
Abstract
This study analyses the contribution of holiday trips to the levels of life satisfaction reported by individuals with and without disability by using an approach in which life satisfaction is seen as a combination of various life satisfaction domains (health, job, housework, household income, dwelling, and leisure). Using longitudinal data from the German Socio-Economic Panel, we estimate a two-layer model which proposes that satisfaction with different domains of life are interrelated and wherein life satisfaction depends on the weight that the individual allocates to each of these domains. The results show that disabled people who participate in holiday trips obtain higher levels of satisfaction with health, job, and housework than do nondisabled ones, especially when this participation is more intense. In addition, satisfaction with health and household income has a significant effect on the overall life satisfaction reported by disabled individuals. Public policy recommendations are given.
Introduction
People with disabilities clearly constitute a large, at-risk population, and one that is of considerable interest to policy makers, governments, and the general public (Houtenville et al. 2009). More than a billion people are estimated to live with some form of disability, that is, about 15% of the world’s population (World Health Organization 2011). This number is constantly increasing because of the ageing population and the global increase in chronic health conditions associated with disability, such as diabetes, cardiovascular diseases, and mental illness. Approximately 80 million of these people live in the European Union (EU), suffering some kind of disability (ranging from mild to severe), who are often prevented from fully taking part in society and the economy because of environmental and attitudinal barriers (European Commission 2010). Poverty and social exclusion are inextricably linked, and one of the main causes of poverty is the lack of employment. Many efforts have been made in most European countries to improve their participation rates, but the barriers, for example, to gaining and retaining employment are still significant. However, social exclusion is not restricted to inadequate income, but extends to barriers to the labor market, transport, and the social environment, as well to limited access to a wide range of public and private services (European Commission 2008). Disabled people face many kinds of barriers; some are visible (e.g., environmental barriers) but many others are invisible (e.g., attitudinal barriers).
Within this context, it is largely accepted by the existing literature that tourism activities offer individuals an escape from the routine of daily life and provide an opportunity to experience something different, challenging, or simply pleasurable (e.g., Gross 1961; Diener, Lucas, and Oishi 2002; Prentice 2004; Pressman et al. 2009). However, disabled people are still marginalized and even discouraged by the tourism industry itself from taking part in it; furthermore, there has been a reluctance to explore the experiences, consequences, and levels of satisfaction of the disabled traveler (Yau, McKercher, and Packer 2004; Shaw and Coles 2004; Dann 2012). According to Shaw and Coles (2004) and Yau, McKercher, and Packer (2004), there is an important segment of disabled people for whom removing the barriers of physical access is only part of the problem. For this group, holidays are not possible because of the financial restrictions that are clearly associated with disabilities in that they restrict access to the world of work. For example, people with disabilities face difficulties in traveling and this can lead to limited life opportunities (Lucas 2004). Poor transport services or the inability to travel contribute to increasing social deprivation among disabled people because they restrict access to activities that enhance their life chances. McKercher et al. (2003) mention that travel agents are largely ignorant of the specific needs of people with disabilities, which leads to overt or subtle discrimination. In addition, there are still few studies that examine the link between tourism and life satisfaction, and it is unclear how the different domains of life satisfaction interrelate and which domains contribute most to life satisfaction overall (e.g., Neal, Sirgy, and Uysal 2004; Sirgy et al. 2011; Dolnicar, Yanamandram, and Cliff 2012; McCabe and Johnson 2013).
The aim of this study is to investigate the effects of holiday trips on the levels of life satisfaction reported by nondisabled and disabled travelers, using a framework wherein life satisfaction is viewed as an aggregate concept consisting of different domains or facets (in our case, health, job, housework, household income, dwelling and leisure). For this purpose, we estimate a two-layer model proposed by Van Praag, Frijters, and Ferrer-i-Carbonell (2003) and based on a bottom–up approach, which allows the impact and weight of each satisfaction domain on general life satisfaction to be identified. Instead of trying to estimate directly the effect of holiday trips on overall life satisfaction, we include the satisfaction domains as explanatory variables in our overall life satisfaction equation. According to Van Praag, Frijters, and Ferrer-i-Carbonell (2003), this two-layer model allows us to get a better view and understanding of the factors that maximize the levels of life satisfaction of individuals. To carry out this study, we use longitudinal data drawn from the German Socio-Economic Panel (GSOEP) for a set of years that include detailed information on individual and household characteristics (e.g., satisfaction indicators, labor and health status, and free-time questions, among others). The availability of this panel of data allows us to control for unobserved individual effects that may capture individual personality traits. 1
Our study can be included within the literature that analyses the effects of holiday trips on “social tourists.” According to Haulot (1982), social tourism is defined as participation of disadvantaged groups (such as the disabled population) in tourism activity that is facilitated by financial and social measures. This concept of social tourism is strongly associated with the idea of social exclusion suffered by disabled people and mentioned earlier. Disabled people are more likely to live in poorer households (and depend on state benefits), with lower employment and income rates, and to face social exclusion and higher levels of discrimination (OECD 2003). As a result, disabled people may value tourism experiences more highly, and so it is likely that they also prioritise tourism consumption more highly (McCabe and Johnson 2013). In many cases, tourism represents a metaphor of recovery, wherein the complex process of being a tourist with a disability involves personal initiative, accurate evaluation of one’s own capabilities, the ability to collect reliable information, managing the trip, managing oneself, and reflecting upon experiences (Yau, McKercher, and Packer 2004). Social tourism has become a flagship tourism policy in the EU (Diekmann and McCabe 2011).
As regards previous literature on the relationship between holiday trips and life satisfaction for all individuals, it is very scant, and nonexistent for the disabled population. It is worth mentioning the works of Milman (1998), Gilbert and Abdullah (2004), Neal, Sirgy, and Uysal (2004), Neal, Uysal, and Sirgy (2007), Neal and Gursoy (2008), Sirgy (2010), Sirgy et al. (2011), Nawijn (2011), Nawijn and Veenhoven (2011), Dolnicar, Yanamandram, and Cliff (2012), McCabe and Johnson (2013), and Chen and Petrick (2013). Nevertheless, the empirical evidence is unclear. Milman (1998) obtains that holiday trippers are not happier after their holiday, whereas authors such as Gilbert and Abdullah (2004) and Neal, Sirgy, and Uysal (2004) conclude that holiday trips positively influence the sense of well-being of tourists. In the same line, Neal, Uysal, and Sirgy (2007) confirm that tourism is an important aspect of leisure life, which is a significant factor in overall life satisfaction. In addition, Neal and Gursoy (2008) find, using a multiphase model of travel developed by Leiper, that tourists’ level of satisfaction or dissatisfaction during various stages of travel affects their overall satisfaction with travel and tourism services. Sirgy (2010) introduces a new theory of travel leisure satisfaction based on goal theory to guide the development and marketing of tourism services and programs that can enhance the quality of life of tourists.
For the propose of our study, the work of Sirgy et al. (2011) is especially interesting because they also use a bottom–up approach to analyse the contribution of travel to tourists’ life satisfaction. They carried out a qualitative and quantitative study and demonstrated the effect of positive and negative affect generated from travel experience on the overall satisfaction of 13 life domains (e.g., social life, family life, leisure and recreation, health and safety, among others). They find that in some domains, positive affect from travel experiences contributes significantly to overall satisfaction in some life domains but not in others. In addition, Nawijn and Veenhoven (2011) find that the leisure activity with the largest correlation with happiness for each year is holiday trips (around 18). Nawijn (2011) also obtained that although general life satisfaction on holiday is not different from everyday life satisfaction, affect balance while on vacation is significantly higher than generally observed in everyday life. Thus, tourists feel generally better on holiday compared to everyday life. Recently, the results obtained by Dolnicar, Yanamandram, and Cliff (2012) show that vacations contribute to the quality of life of the majority of people (and especially to the domains of satisfaction with leisure and people), and this quality of life means different things to different people at different points in their life, representing an individual and dynamic concept. Furthermore, McCabe and Johnson (2013) find that there is a positive link between holiday taking and improvement in subjective levels of well-being among social tourists. Finally, Chen and Petrick (2013) provide a comprehensive review of the literature pertaining to how travel experiences impact the emotional and physical health and wellness of individuals. These authors also examine the main factors influencing vacation outcomes through four stages, including anticipation, experience, beneficial, and fade-out.
Despite the existence of this literature, most are cross-sectional studies and based on qualitative data (e.g., person-to-person interviews) or use simple correlation techniques. The majority of these studies point out the need to carry out further research, particularly longitudinal studies, which employ complementary methods and more complex econometric techniques to confirm and support the positive relationship between holiday trips and life satisfaction. For example, Sirgy et al. (2011) note that we have a very limited understanding of the nature of affect spill-over from satisfaction with tourism experiences to satisfaction with life overall.
The contribution of this study is threefold. First, it contributes to increasing the empirical evidence on the relationship between holiday trips and life satisfaction for disabled individuals. This study fills an important gap in the existing literature on disability and life satisfaction and represents a step forward in the research agenda on disability and tourism activities. In addition, this study is the first attempt to explore and analyze the relationship between overall life satisfaction and some domains of life satisfaction for disabled individuals in Germany. Second, we use a bottom–up approach to identify how holiday trips affect the leisure domain directly and other life domains considered indirectly. Thanks to the two-layer method proposed by Van Praag, Frijters, and Ferrer-i-Carbonell (2003), we can better handle econometric issues (pointed out by previous studies) such as endogeneity, simultaneous equations, and estimates with panel data (as in our case). In addition, we use longitudinal data that allow us to control for unobserved individual effects that may capture individual personality traits. Third, this analysis can help the tourism industry, travel agencies, tourist operators, and policy makers to identify, define, promote, and implement specific actions and services that allow disabled travelers to obtain full access and participation in tourism activities, thereby increasing their sense of well-being and improving their health status, self-confidence, self-esteem, family life, and relationships.
Data and Method
Data
To carry out this study we use five waves (1990, 1995, 1998, 2003, and 2008) taken from the German Socio-Economic Panel (GSOEP), a representative longitudinal data set of persons, households, and families in Germany. This survey covers a broad range of topics, including information at an individual and household level on living conditions, household composition, employment status, income, health, education, and satisfaction measures among others. However, only for those five waves does the GSOEP questionnaire include a set of questions concerning free time, which reveals how often individuals take part in some leisure activities, such as going out for a drink or a meal, visits to and from family members and relatives, attending religious events, watching TV/video, listening to the radio, and “go(ing) on a trip or short holidays.” In our case, we focus on the answers obtained for this latter activity, which we call “holiday trips” in this study. 2 The possible responses to this question are the following: Daily, at least once a week, at least once a month, seldom, and never. Because of the low number of disabled individuals for the first response “daily” (only 98 individuals, of whom 12 are disabled), we have combined the first two responses into one, that is, “daily/weekly.”
Life satisfaction can be defined as the degree to which an individual favorably judges the overall quality of his life-as-a-whole (Veenhoven 1991). Most psychologists consider that the best way to study life satisfaction and/or other domains of satisfaction is by asking individuals how they feel. In our case, all satisfaction measures have been reported by the individuals themselves. For example, satisfaction with life is measured by participant responses to the following question and asked in each wave of the GSOEP: “How satisfied are you with life, all things considered?” This question is available in all waves and has been previously used, for example, by Lucas (2007), Oswald and Powdthavee (2008), and Pagan (2012a). The respondents of the GSOEP are also asked to report how satisfied they are at that moment with their health, job, housework, household income, place of dwelling, and free time. 3 The possible responses to all these satisfaction questions range from 0 (completely dissatisfied) to 10 (completely satisfied). Veenhoven (1996) points out that this single-item measure is generally as reliable and valid as multiitem measures. In addition, psychologists have usually considered these answers to satisfaction questions as cardinal (e.g., Schwartz 1995; Ng 1997), whereas some economists have assumed the ordinality of the answers (e.g., Van Praag 1991; Ferrer-i-Carbonell and Frijters 2004). Nevertheless, Ferrer-i-Carbonell and Frijters (2004) conclude that assuming cardinality or ordinality has little impact on estimation results.
As for our disability measure, this is based on whether the person reports a work-limiting health condition (e.g., Burkhauser and Daly 1998; Burchardt 2000; Hotchkiss 2004; Jenkins and Riggs 2004; Burkhauser, Houtenville, and Rovba 2006). Looking at the GSOEP questionnaires, we find that the work limitation included in the data set has been changed over time and it has not been asked in all its waves (from 1988 to 1991 and in 1993 and 1994, or at all from 2002 onwards). To bridge these gaps in the data, Burkhauser and Schroeder (2007), using the existence of this work limitation question as a benchmark when available, have created a work limitation–based measure of disability for all GSOEP years that is comparable to that work limitation question included in the Current Population Survey (CPS) of the United States. To do this, they combine two alternative survey questions in the GSOEP that have been asked each year. The first part of this combination definition is obtained from the current health satisfaction question, which ranges from 0 (completely dissatisfied) to 10 (completely satisfied) and is highly correlated with the self-perceived work limitation (Burkhauser and Schroeder 2007). The second part comes from the following question: “Are you officially registered as having a reduced capacity to work or as being severely disabled? If Yes, what is the degree of your disability?” The degree of disability ranges from 0 (not disabled) to 100 (severely disabled). They found that the best concordance of the combination definition with the severe limitation question is a combination of individuals with a health satisfaction level of at most 2 or a degree of disability of at least 53%. That is, a person is considered disabled if he/she has a health satisfaction level of at most 2 or a degree of disability of at least 53%. Namely, those individuals who fulfil at least one of these two conditions are considered disabled. 4 According to Burkhauser and Schroeder (2007), if we only use the degree of disability measure to identify the disabled population, we would miss individuals with a work limitation who were in the process of becoming registered that had short-term limitations or decided it was not worth registering.
Our sample consists of individuals aged 16 or over. Only those who answered the domains satisfaction questions, including the overall life satisfaction, are included in the analysis. It is worth noting that only a part of the disabled sample (around 21%) reports some values for satisfaction with job. For this reason, the final sample is not conditioned on whether the individual (disabled or not) also reports a level for job satisfaction. After dropping those individuals with missing information, the final samples used in the estimation process for people without and with disabilities are 39,486 (22,189 individuals) and 3,940 (2,855 individuals) observations, respectively. For the estimation of the job satisfaction equations, we have 21,964 observations (13,830 individuals) for the nondisabled, and 824 observations (727 individuals) for the disabled.
Method
Although subjective well-being can be analyzed through either a top–down or bottom–up approach (e.g., Diener 1984; Headey Holmstrom, and Wearing 1985; Lance et al. 1989; Sirgy 2002; Sirgy and Lee 2006; and Sirgy et al. 2011), we use a bottom–up approach wherein domains of satisfaction determine (and are the component of) satisfaction with life as a whole. According to Van Praag, Frijters, and Ferrer-i-Carbonell (2003), this yields the so-called two-layer satisfaction model. In particular, this bottom–up approach has been previously proposed and used by Sirgy et al. (2011) in the analysis of the effect of travel on tourists’ life satisfaction and domains satisfaction. These authors postulate that affect within a specific life domain accumulates and vertically spills over to superordinate domains (e.g., life in general), and thus we can make a case for the effects of satisfaction with certain tourist-related events (e.g., holiday trips) on satisfaction of various life domains and on life overall.
Following the method proposed by Van Praag, Frijters, and Ferrer-i-Carbonell (2003) and similar to Sirgy et al. (2011), we estimate a two-layer satisfaction model wherein overall life satisfaction (LS) is a function of satisfaction levels regarding various domains or facets of life (DS), such as satisfaction with health, job, housework, household income, place of dwelling, and free time (Figure 1). Satisfaction with life as a whole may be seen as an aggregate measure or as a weighted average of domain satisfaction, where the most important domains are given the most weight. The main advantage of this method, which these authors call the “Probit Adapted OLS (POLS),” is the possibility to measure the influence of some characteristic variables (e.g., gender, age, educational level, and “participation in holiday trips”) on LS through different domains of life satisfaction. This allows us to obtain a more detailed and more accurate description when we concentrate on the intermediate block in Figure 1 than when we try to cover the two stages in only one equation (Van Praag, Frijters, and Ferrer-i-Carbonell 2003).
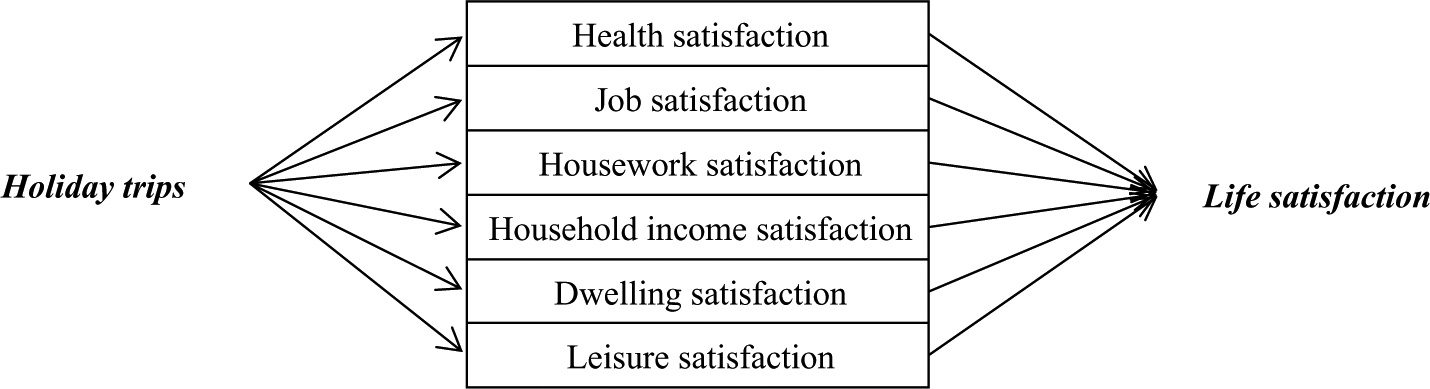
The two-layer model proposed by van Praag, Frijters, and Ferrer-i-Carbonell (2003).
POLS represents an alternative approach to traditional ordered response models and is based on the transformation of the data that allow discrete-choice variables as if they are distributed along the whole real line. One advantage of this method compared to ordered probit (OP) is that when estimating panel data, the random fixed effect error structure is much more easily implemented than with a similar model in the OP framework (and also substantially reduces computational time). In addition, POLS estimates (both coefficients and standard errors) are similar to OP estimates (except for a multiplicative factor) and it is especially useful in the presence of ordinal variables among regressors (see Terza 1987; Van Praag and Ferrer-i-Carbonell 2008). In addition, this method is very helpful when we employ Probit-type variables in longitudinal analysis (as in our case) with intertemporal correlations). The drawback is that a harsher normality assumption is needed. The reason why these authors prefer POLS to OP is that they can use simple OLS techniques without any loss of information (the resulting trade-off ratios are virtually identical, as are t ratios). Not only are the OLS variants computationally easier than the discrete methods that require the computation of many integrals and/or Monte Carlo simulations, but they also open the way to the application of linear classical methods to discrete response data.
POLS assumes that there is a set X of objectively measurable explanatory variables X1, . . . , Xk that explain the various domains of life satisfaction, which can be denoted by DS1, . . . , DS j (in our case j = 6). According to Van Praag, Frijters, and Ferrer-i-Carbonell (2003), it is quite probable that the endogenous variables DS would influence each other. This being true, the intermediate block of the model in Figure 1 must be seen as a reduced model in which all cross-relations between domain satisfactions have been eliminated. As a result, we can assume a model equation of the type (Van Praag, Frijters, and Ferrer-i-Carbonell 2003):

and each domain of life satisfaction as follows:

where xj represents a subselection of x variables for the domain j, and the variable Z is, by definition, unobservable and, if no special treatment is given, becomes part of the error terms of the DS and LS equations. As a result, the explanatory variables DS in equation (1) are correlated among themselves and with the LS error term, which would cause an endogeneity bias. To avoid this problem, Van Praag, Frijters, and Ferrer-i-Carbonell (2003) propose constructing an instrumental variable for Z, which will be included in equation (1). This variable is obtained from the estimation of the six DS equations and the corresponding residuals in order to obtain the part of Z that is common to all the residuals. This is derived as the first principal component of the (j × j) error covariance matrix of the residuals obtained after the estimation of each DS equation (2). The inclusion of the variable Z as an explanatory variable in the overall life satisfaction equation (1) allows us to reasonably assume that the remaining LS error is no longer correlated with the DS errors and that the estimators of the coefficients in equation (1) do not suffer from endogeneity bias. 5
To apply this POLS method, we also have to take into consideration other important and relevant aspects. First, our dependent variables in equations (1) and (2) (i.e., LS and DS j ) are categorical, naturally ordered and with i response categories (in our case, i is from 0 = completely dissatisfied to 10 = completely satisfied). To use POLS, it is necessary to transform the LS and DS j variables into their conditional expectations and based on the properties of the normal distribution (Maddala 1983). For example, we define:
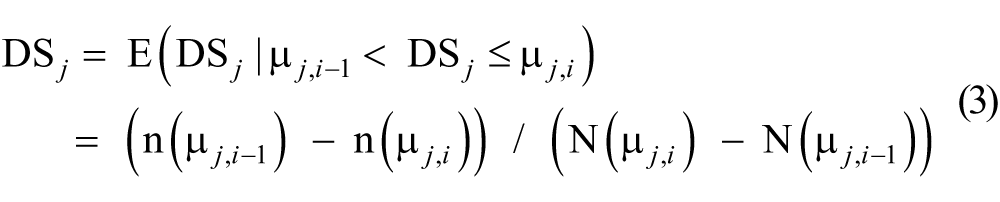
where N is the normal distribution function, n is the normal density function, and μi are the values for which it holds that N(μj, i ) − N(μj,i–1) is the fraction of respondents belonging to response category i for each DS j . This transformation has been applied to the overall life satisfaction (LS) and each domain of life satisfaction (DS j ). Furthermore, and as noted earlier, use of this transformation, first advocated by Terza (1987), ensures that the dependent variables in equations (1) and (2) now vary over the whole real axis. 6
Secondly and following Van Praag and Ferrer-i-Carbonell (2008), we can assume that most variables are not fixed over life; that is, they fluctuate around an average or are perceived by the individual as doing so. In order to introduce some dynamic components in equation (1) by distinguishing between transitory and permanent effects for our key explanatory variables (i.e., DS
j
), we replace the contribution of each domain in the overall life satisfaction regression by their annual value and their mean over the period covered by the data. For example, the variable “satisfaction with health,” DS1, is included in the overall life satisfaction equation as
Thirdly, the longitudinal dimension of our database allows us to estimate the equations (1) and (2) by individual random effects. However, this may be problematic since the individual random effect model may overlook the potential correlation between individual random effects (e.g., innate ability) with some explanatory variables such as age or income (Van Praag and Ferrer-i-Carbonell 2008; Skalli, Theodossiou, and Vasileiou 2008). To overcome this problem, Mundlak (1978) proposes that the error terms of the LS and DS equations be decomposed into two independent terms:

where n stands for the individual. The term υ jn represents the individual random effect, that is, the unobservable individual characteristics, and the term η jnt is the pure error term (which follows a normal distribution, N[0, σ2]). We assume that E(ε) = E(υ) = E(η) = 0, and E(η, x) = 0, namely, that the individual random effect is not correlated with the explanatory variables. Additionally, we introduce in equations (1) and (2) a fixed time and region effect through a set of year and region dummy variables in order to incorporate several effects (e.g., inflation rates, cultural aspects, and socioeconomic environment in each region) and any trend effects in satisfaction. All calculations were made using the statistical package Stata 11.
As for the explanatory variables included in equation (2) and following the standard literature on satisfaction literature (e.g., Zimmermann and Easterlin 2006; Oswald and Powdthavee 2008; Clark et al. 2008), we include, apart from our key dummy variables of participation in holiday trips (i.e., daily/weekly, monthly, seldom, and never), gender, age and its square, marital status, years of education, real household income (in logarithms), the number of children in the household, total number of persons living in the household, employment status, if the individual is a homeowner, year of interview, and region of residence.
Results
Descriptive Analysis
Figure 2 shows the levels of life satisfaction as a whole and those for the different domains of satisfaction reported by nondisabled and disabled individuals according to their participation and intensity in holiday trips. 7 Overall, we find that the scores in all satisfaction domains are higher for nondisabled individuals as compared to disabled ones, except for satisfaction with leisure. Using a test of equality of means, we have found that the satisfaction gap between both groups is especially high in some cases, as for example in the domains of job and health satisfaction. For example, the differentials are 2.92 and 1.23 points in favor of nondisabled individuals if the participation in holiday trips is daily/weekly for the domains of health and job satisfaction, respectively. As noted earlier, social tourists (such as the disabled) differ from mainstream tourists (such as the nondisabled) because they are on low incomes and are affected by some specific issues and circumstances (e.g., barriers and obstacles that prevent them from full participation) that mainstream tourists are far less likely to encounter, which leads to having lower levels of satisfaction than the general population (McCabe 2009). In contrast, this differential is −0.25 and −0.09 points in favor of disabled individuals if we analyze the participation category daily/weekly and monthly for leisure satisfaction, respectively.
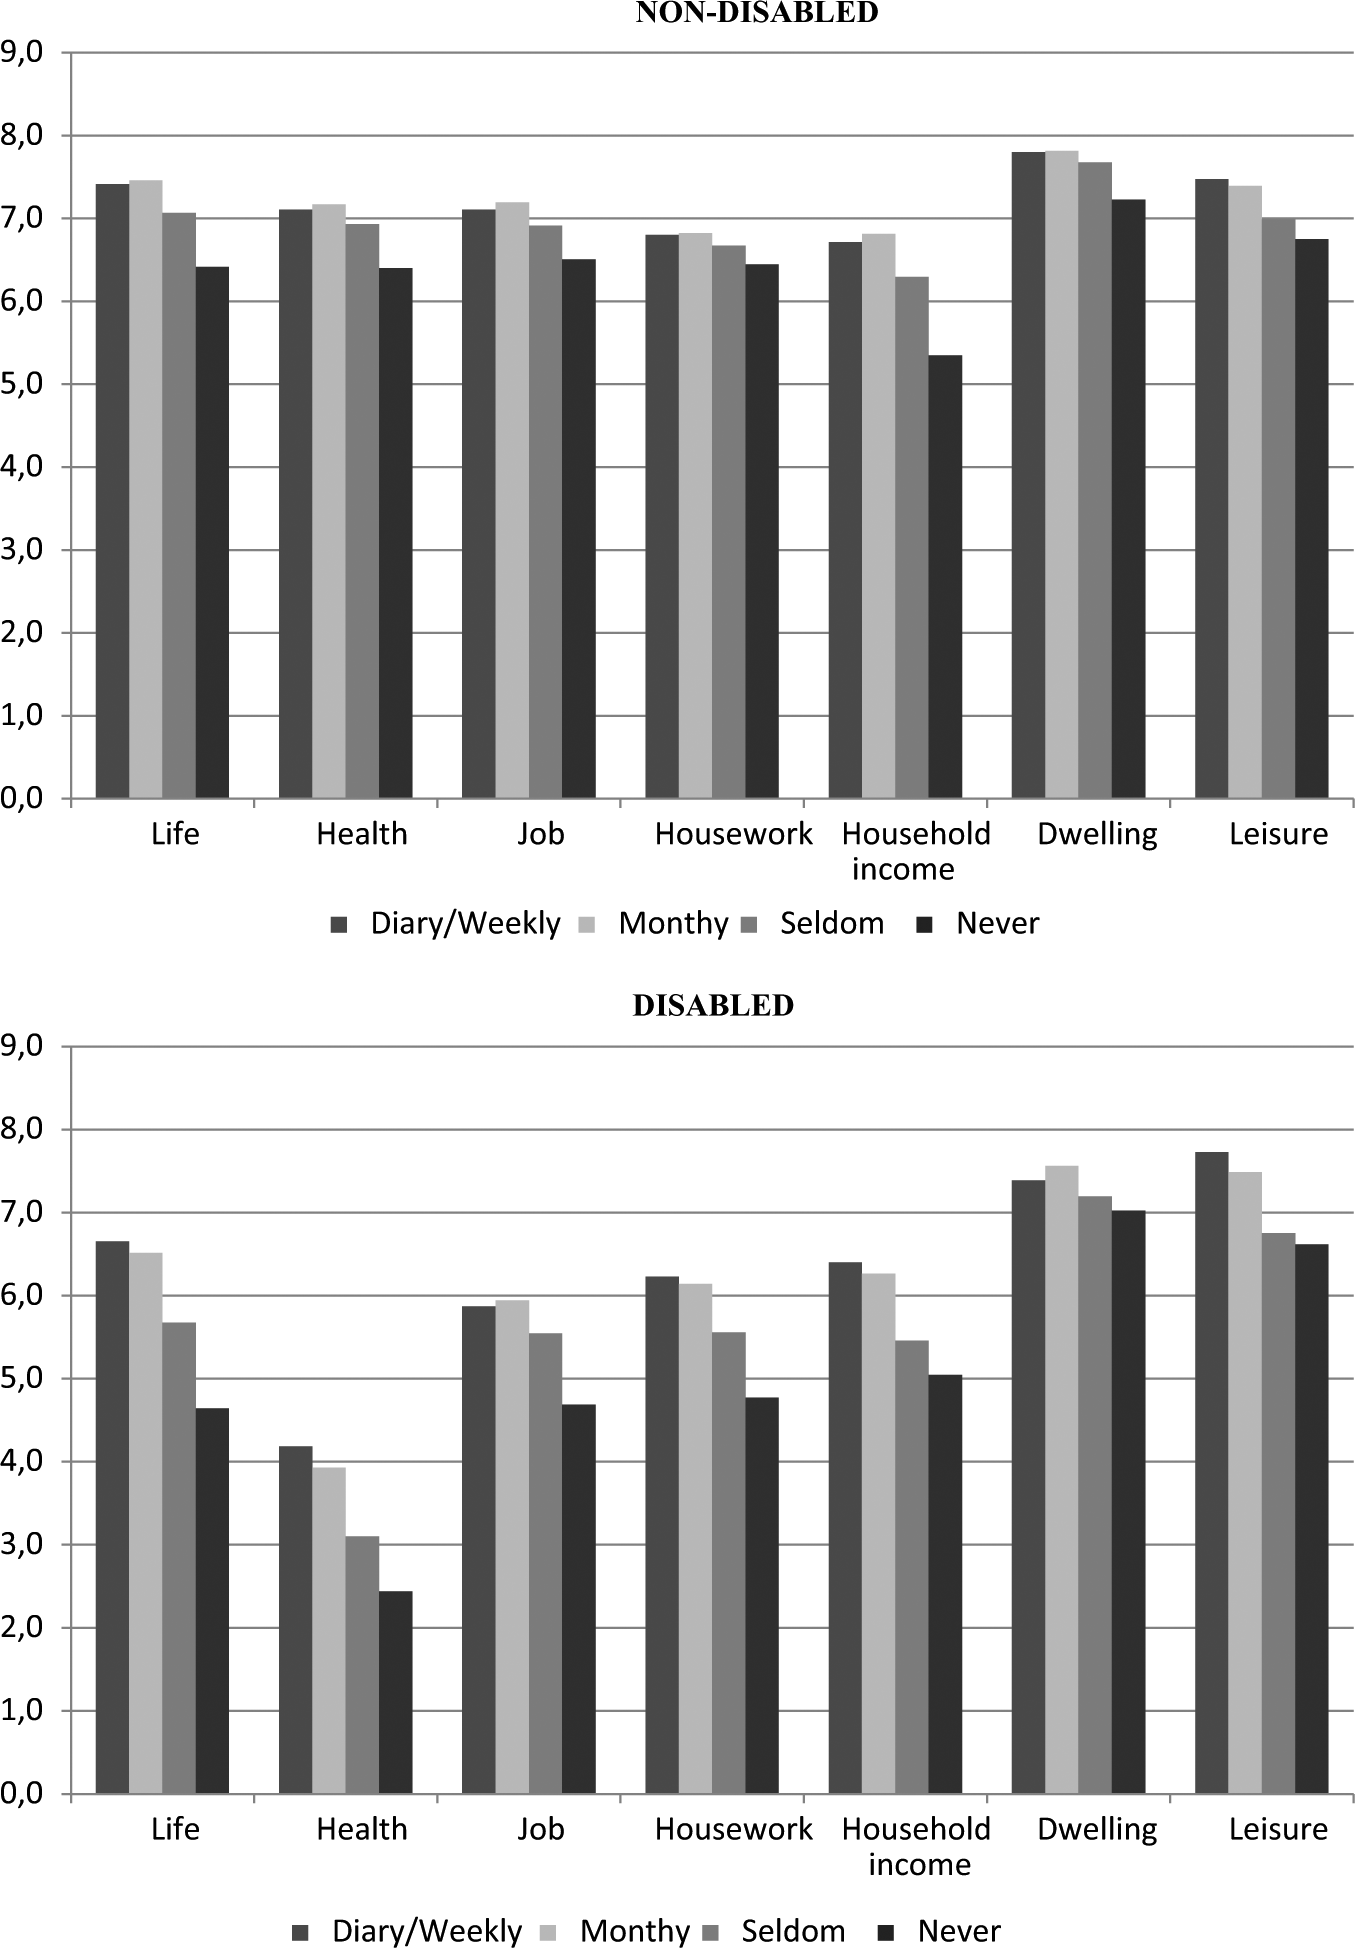
Mean levels of overall life satisfaction scores and domains of satisfaction by participation in holiday trips and disability status in Germany.
According to Figure 2, we find a clear positive relationship between the intensity of the participation in holiday trips and all satisfaction domains. Namely, in all cases, the levels of satisfaction reported by nondisabled and disabled individuals increase as the participation in holiday trips is more intense. For example, the life satisfaction scores for the disabled sample in the category daily/weekly is 6.66 points, decreases slightly to 6.51 if the intensity is monthly, 5.67 points in the category “seldom,” and finally goes down to 4.67 if the person has never participated. Similar results are found for the remaining satisfaction domains. However, it is worth noting how taking part in holiday trips has a positive and significant effect on the levels of satisfaction with health and leisure among disabled individuals. These results are consistent with the spill-over effect pointed out by Sirgy et al. (2011), which leads to participation in holiday trips’ having an impact not only on the individual’s life satisfaction scores but also on the rest of the domains of life satisfaction. Although the levels of life satisfaction follow a similar pattern for the nondisabled sample, we observe that the distance in terms of satisfaction between the highest trip category (daily/weekly) and the lowest one (never) is greater for the disabled than the nondisabled (2.02 vs. 1.01 points). The finding is also made for the domains of satisfaction with health (0.7 vs. 1.74 points), job (0.6 vs. 1.18 points), housework (0.36 vs. 1.46 points), and leisure (0.72 vs. 1.11). However, for the disabled sample, this spread between these extreme categories is lower for satisfaction with place of dwelling (0.57 and 0.37 points for the nondisabled and disabled samples, respectively).
To shed further light on this preliminary analysis of life satisfaction and domains of life satisfaction by participation (and its intensity) in holiday trips for nondisabled and disabled individuals, Appendix Table A1 shows the sample distribution into each holiday trip category for the nondisabled and disabled samples used in the estimation process. In all cases, we find that disabled individuals are less likely to participate in holiday trips as compared to their nondisabled counterparts. For example, 27% of disabled individuals (included in the sample used to estimate all domains of satisfaction, except the job satisfaction equation, which has a lower number of observations) have never participated in holiday trips, whereas for the nondisabled sample, this percentage goes down to 12%. This initial finding is in line with the works of Smith (1987), Darcy (1998, 2002), Horner and Swarbrooke (2004), and Pagan (2012b). Following Smith (1987), disabled tourists face three types of barriers: (1) intrinsic barriers, resulting primarily from the tourist’s own levels of cognitive, physical, and psychological function; (2) environmental barriers, consisting of externally imposed limitations; and (3) interactive barriers, relating to skill-challenge incongruities and communication barriers. Many of these barriers are socially constructed (e.g., negative attitudes of staff members and passengers, user-unfriendly services, prejudice, employees’ negative attitudes toward people with disabilities, etc.), and information dissemination on accessible destinations becomes a key factor in increasing tourism opportunities among disabled individuals (Darcy 1998). In addition, those disabled people who are limited in their daily activities are even less likely to participate in tourism activities (Pagan 2012b). These considerations will help us explain and understand the econometric results obtained below.
Econometric Analysis
Appendix Table A1 also shows the mean and standard deviation of the explanatory variables used in the estimation of equation (2) for each domain of life satisfaction. As noted earlier, we have to take into account that the final samples used in the estimation process were not conditioned on whether the individual (disabled or not) also reported a score for job satisfaction. For this reason, Appendix Table A1 shows the mean and standard deviation of the regressors distinguishing the job satisfaction equation (with 21,964 observations) from the rest of domains of satisfaction (all with 39,486 observations). Apart from the lower participation in holiday trips of disabled individuals (as indicated above), we find that these individuals are older, nonmarried, with lower levels of education and household incomes, living in households with a lower number of children and members, out of the labor market, and less likely to be homeowners, as compared to their nondisabled counterparts.
Turning to the econometric analysis, the estimates of the six DS equations (2) corresponding to satisfaction with health, job, housework, household income, place of dwelling, and leisure are reported by disability status in Tables 1 and 2. Initially, we have tested the existence of a possible problem of selectivity bias in all our samples. For example and according to Clark (1997), if dissatisfied disabled individuals can leave the labor market more easily than equally dissatisfied nondisabled individuals, the remaining disabled workers will have higher average levels of job satisfaction because the sample is biased. The underlying assumption is that the potential job satisfaction is related to the probability of being an employee. Furthermore, and as we have panel data, there is a potential selection problem related to nonrandom sample attrition. If disability is linked to a higher (or lower) propensity to remain in the sample, the estimated coefficients will be biased (see Baltagi and Song 2006, for a survey of this type of bias). To test the existence of this problem, we have applied the method proposed by Verbeek and Nijman (1992) for random effects models. 8 This test rejected the relevance of a selectivity bias in all samples. 9
Domains of Life Satisfaction for NONDISABLED (POLS Individual Random Effects).

Source: Author’s calculations using the German Socio-Economic Panel (GSOEP) for the years 1990, 1995, 1998, 2003 and 2008.
Note: All equations include regional dummies. The standard errors are robust. Individuals aged 16 or over. We use overall R2.
p < 0.1, **p < .05, ***p < .01.
Domains of Life Satisfaction for the Disabled (POLS Individual Random Effects).

Source: Author’s calculations using the German Socio-Economic Panel (GSOEP) for the years 1990, 1995, 1998, 2003and 2008.
Note: All equations include regional dummies. The standard errors are robust. Individuals aged 16 or over. We use overall R2.
p < 0.1, **p < .05, ***p < .01.
According to Tables 1 and 2, we find that participation and intensity in holiday trips have a positive and significant effect on each of our domains of life satisfaction both for the nondisabled and for the disabled sample. These results confirm the need to introduce in these studies the spill-over effect of holiday trips on all domains of life satisfaction, as Sirgy et al. (2011) concluded. Although this general result is observed for nondisabled and disabled individuals, we observe significant differences in the magnitude or size of the coefficients estimated in almost all satisfaction domains by disability status. Although society assumes that tourism (and holiday trips, in particular) is healthy for all people (Hobson and Dietrich 1994), the contribution of holiday trips to the levels of satisfaction with health is especially higher (more than double all trip categories) for the disabled sample as compared to the nondisabled one. This finding shows the important impact of holiday trips on health satisfaction scores reported by disabled travelers. The benefits of holiday trips in relation to health include enjoyment, personal growth and development, well-being, and freedom from stress (Clark and Clift 1996). Travelers feel relaxed, rested, renewed, and recharged after the trip (Sirgy et al. 2011). These positive implications of holiday trips may be even higher for disabled people because of their isolation, discrimination practices, and the substantial barriers to participating in tourism activities. For example, for cancer patients, feelings of isolation, being ostracised, and fear can be reduced throughout holiday trips because they provide a range of therapeutic opportunities and a necessary means of escapism (Hunter-Jones 2003). In the same line, Mackie and Brattle (1999) point out the significant positive effects of holiday trips on increasing energy, doing more of the things one wishes, and achieving independence for people living with multiple sclerosis. In addition, Pols and Kroon (2007) conclude that holiday trips contribute to psychiatric rehabilitation and better health by promoting and supporting, among other things, community participation, social relations, and a feeling of freedom.
Looking at the results for the job satisfaction domain, once again we find that the contribution of taking part in holiday trips is higher for disabled individuals than their nondisabled counterparts. For the disabled sample, the results show that participating in holiday trips daily/weekly increases levels of job satisfaction by 0.244 points as compared to the reference category (never). On the contrary, the size of this coefficient for the nondisabled is only 0.105 points, that is, 0.139 points lower. Following the Effort-Recovery Theory (e.g., Meijman and Mulder 1998; Geurts and Sonnentag 2006), this premium in job satisfaction that is obtained by disabled people who participate in holiday trips daily/weekly can be due to the fact that these people often recover insufficiently during time off work, and thus they see holiday trips as a vehicle to recover energy and reduce prolonged fatigue, workload, and stress. Furthermore, we have to take into consideration that disability “steals” time, because persons with disabilities need more leisure time to rest, obtain medical care, and accomplish everyday activities (Oi 1991). In addition, time consumed by transportation to and from work may be longer. For example, Oi (1991) mentions that the disabled make nearly three times as many physician visits a year and purchase more than four times as many prescriptions as do individuals with no activity limitations. Therefore, holiday trips boost job satisfaction for disabled individuals because they allow them to break away from the work routine as well as from the demands and constraints of the workplace, aspects especially important for this group (Sirgy et al. 2011).
Similar results are found for satisfaction with housework. Once again, holiday trips contribute to increasing the levels of satisfaction for this domain reported by all individuals (disabled or not). However, the levels of satisfaction are higher for disabled individuals as compared to the nondisabled. The differential between both groups is even higher than that observed for the first two domains analyzed (i.e., health and job satisfaction). According to the existing literature (e.g., Pagan 2013), disabled people (especially females) are more likely than nondisabled ones to spend more time on housework activities (and household production). This fact leads to higher levels of tiredness, fatigue, and stress of the disabled individual as a result of their health concerns, time constraints, activity patterns, and lifestyle requirements. In this sense, vacations can increase the levels of satisfaction with housework observed by disabled individuals (especially among females, as the econometric results confirm) because they allow them to recover from housework duties and spend their time in a different and more relaxing environment that may allow individuals to detach physiologically from housework and from other daily demand and routines (De Bloom et al. 2009).
As for satisfaction with household income, we also find a significant effect of the participation in holiday trips on this domain of satisfaction. For the nondisabled sample, the coefficient on daily/weekly is positive and significant (0.351) at conventional levels with respect to the reference category (never). For the disabled sample, this coefficient is also positive and significant but lower than that obtained for the nondisabled sample (0.202). This lower contribution of holiday trips among disabled individuals may reflect the difficulty of accessing certain tourism activities because of lack of financial resources to fully enjoy the trip (Smith 1987; Sirgy et al. 2011; Pagan 2012b). We have to bear in mind the fact that the personal incomes (and also household incomes) of disabled people depend primarily on their work status. As noted earlier, the labor market integration of the disabled people is not satisfactory in terms of employment, which thus reduces their likelihood to participate in holiday trips. Disabled people have two other important sources of income, disability-related benefits and, to a lesser extent, early or regular retirement benefits (OECD 2003). In any case and as noted earlier, disabled people live in low-income households and this fact may limit their possibilities to request travel and tourism services and products, which have a significant impact on life satisfaction in general and household income satisfaction in particular.
Looking at the satisfaction with place of dwelling, we also find positive and significant effects of holiday trips on the satisfaction scores. However, these effects are lower for the disabled sample, and even the coefficient on daily/weekly is no longer significant at conventional levels. According to Eastman (1978), there are significant differences between households with and without a disabled member regarding the need for additions and alterations to the dwelling, with households with a disabled member having a greater need for these modifications and alterations. In many cases, these needs are not met because of the lack of financial resources, which become the main determinants for the levels of housing satisfaction. In addition, there are other factors or constraints that prevent housing modifications such as, for example, the lack of time, energy, ability, and skills to make needed alterations. These facts may explain the low contribution of holiday trips to housing satisfaction for the disabled sample as compared to the nondisabled one.
Finally and as we expected, holiday trips contribute to increasing the levels of leisure satisfaction reported by nondisabled and disabled individuals. This result is consistent with the existing literature (e.g., Lazarus, Kanner, and Folkman 1980; Neal, Sirgy, and Uysal 2004; Nawijn and Veenhoven 2011; and Dolnicar, Yanamandram, and Cliff 2012), which concludes that leisure activities, including holiday trips, are salutary and may serve as “breathers” that provide a chance to take a break, engage in a pleasurable diversionary activity, and consequently induce positive emotions and feelings that contribute to increasing individuals’ life satisfaction (and leisure satisfaction). According to Tables 1 and 2, the contribution of holiday trips to leisure satisfaction is quite similar for the nondisabled and disabled samples, except for the coefficient on daily/weekly, which is slightly higher for the nondisabled sample (0.341 vs. 0.256 points). This outcome supports the idea that taking a vacation is important for disabled individuals, not only because it offers a means of increasing their leisure and life satisfaction but also because it is a means to an end for them in becoming (or being) self-reliant, independent, confident, and “able” persons (Blichfeldt and Nicolaisen 2011). This notion of being “able” persons through vacations as pointed out by these authors is extremely important. According to Smears (1996), disability relates to how one is defined by “the surrounding society” and, henceforth, being a tourist helps change the social construction as an “unable” person. Tourism enables people with disabilities to develop more positive and empowering feelings and experiences. Hence, holiday trips relate to overcoming self-doubt and redefining oneself and seem to be the means to the end of being an “able” person (Blichfeldt and Nicolaisen 2011).
As for the remaining explanatory variables, it is worth noting some results. Nondisabled males report lower levels of satisfaction with job, housework, household income, and dwelling than do nondisabled females, whereas the opposite result is found for satisfaction with health and leisure. For the disabled, we only find significant differences by gender for the domains of health and leisure. For the nondisabled sample, there is a U-shaped relationship between age and all domains of satisfaction. On the contrary, this U-shaped relationship is only found for satisfaction with household income for the disabled sample. For the nondisabled sample, the variable years of education has a significant effect on almost all domains of satisfaction (except for satisfaction with dwelling), whereas for the disabled, none of the coefficients are significant at conventional levels. The variables number of children in the household and household size have a significant effect for the nondisabled on all domains of satisfaction. For the disabled sample, the effects of these two variables on domains of satisfaction are more limited. For the nondisabled, being a part-time worker reduces the levels of satisfaction with job, housework, and household income and increases the levels of satisfaction with dwelling and leisure. For the disabled, being out of the labor force increases the levels of satisfaction with health and leisure. Finally, we find important and significant differences by year of the interview, especially in the nondisabled sample.
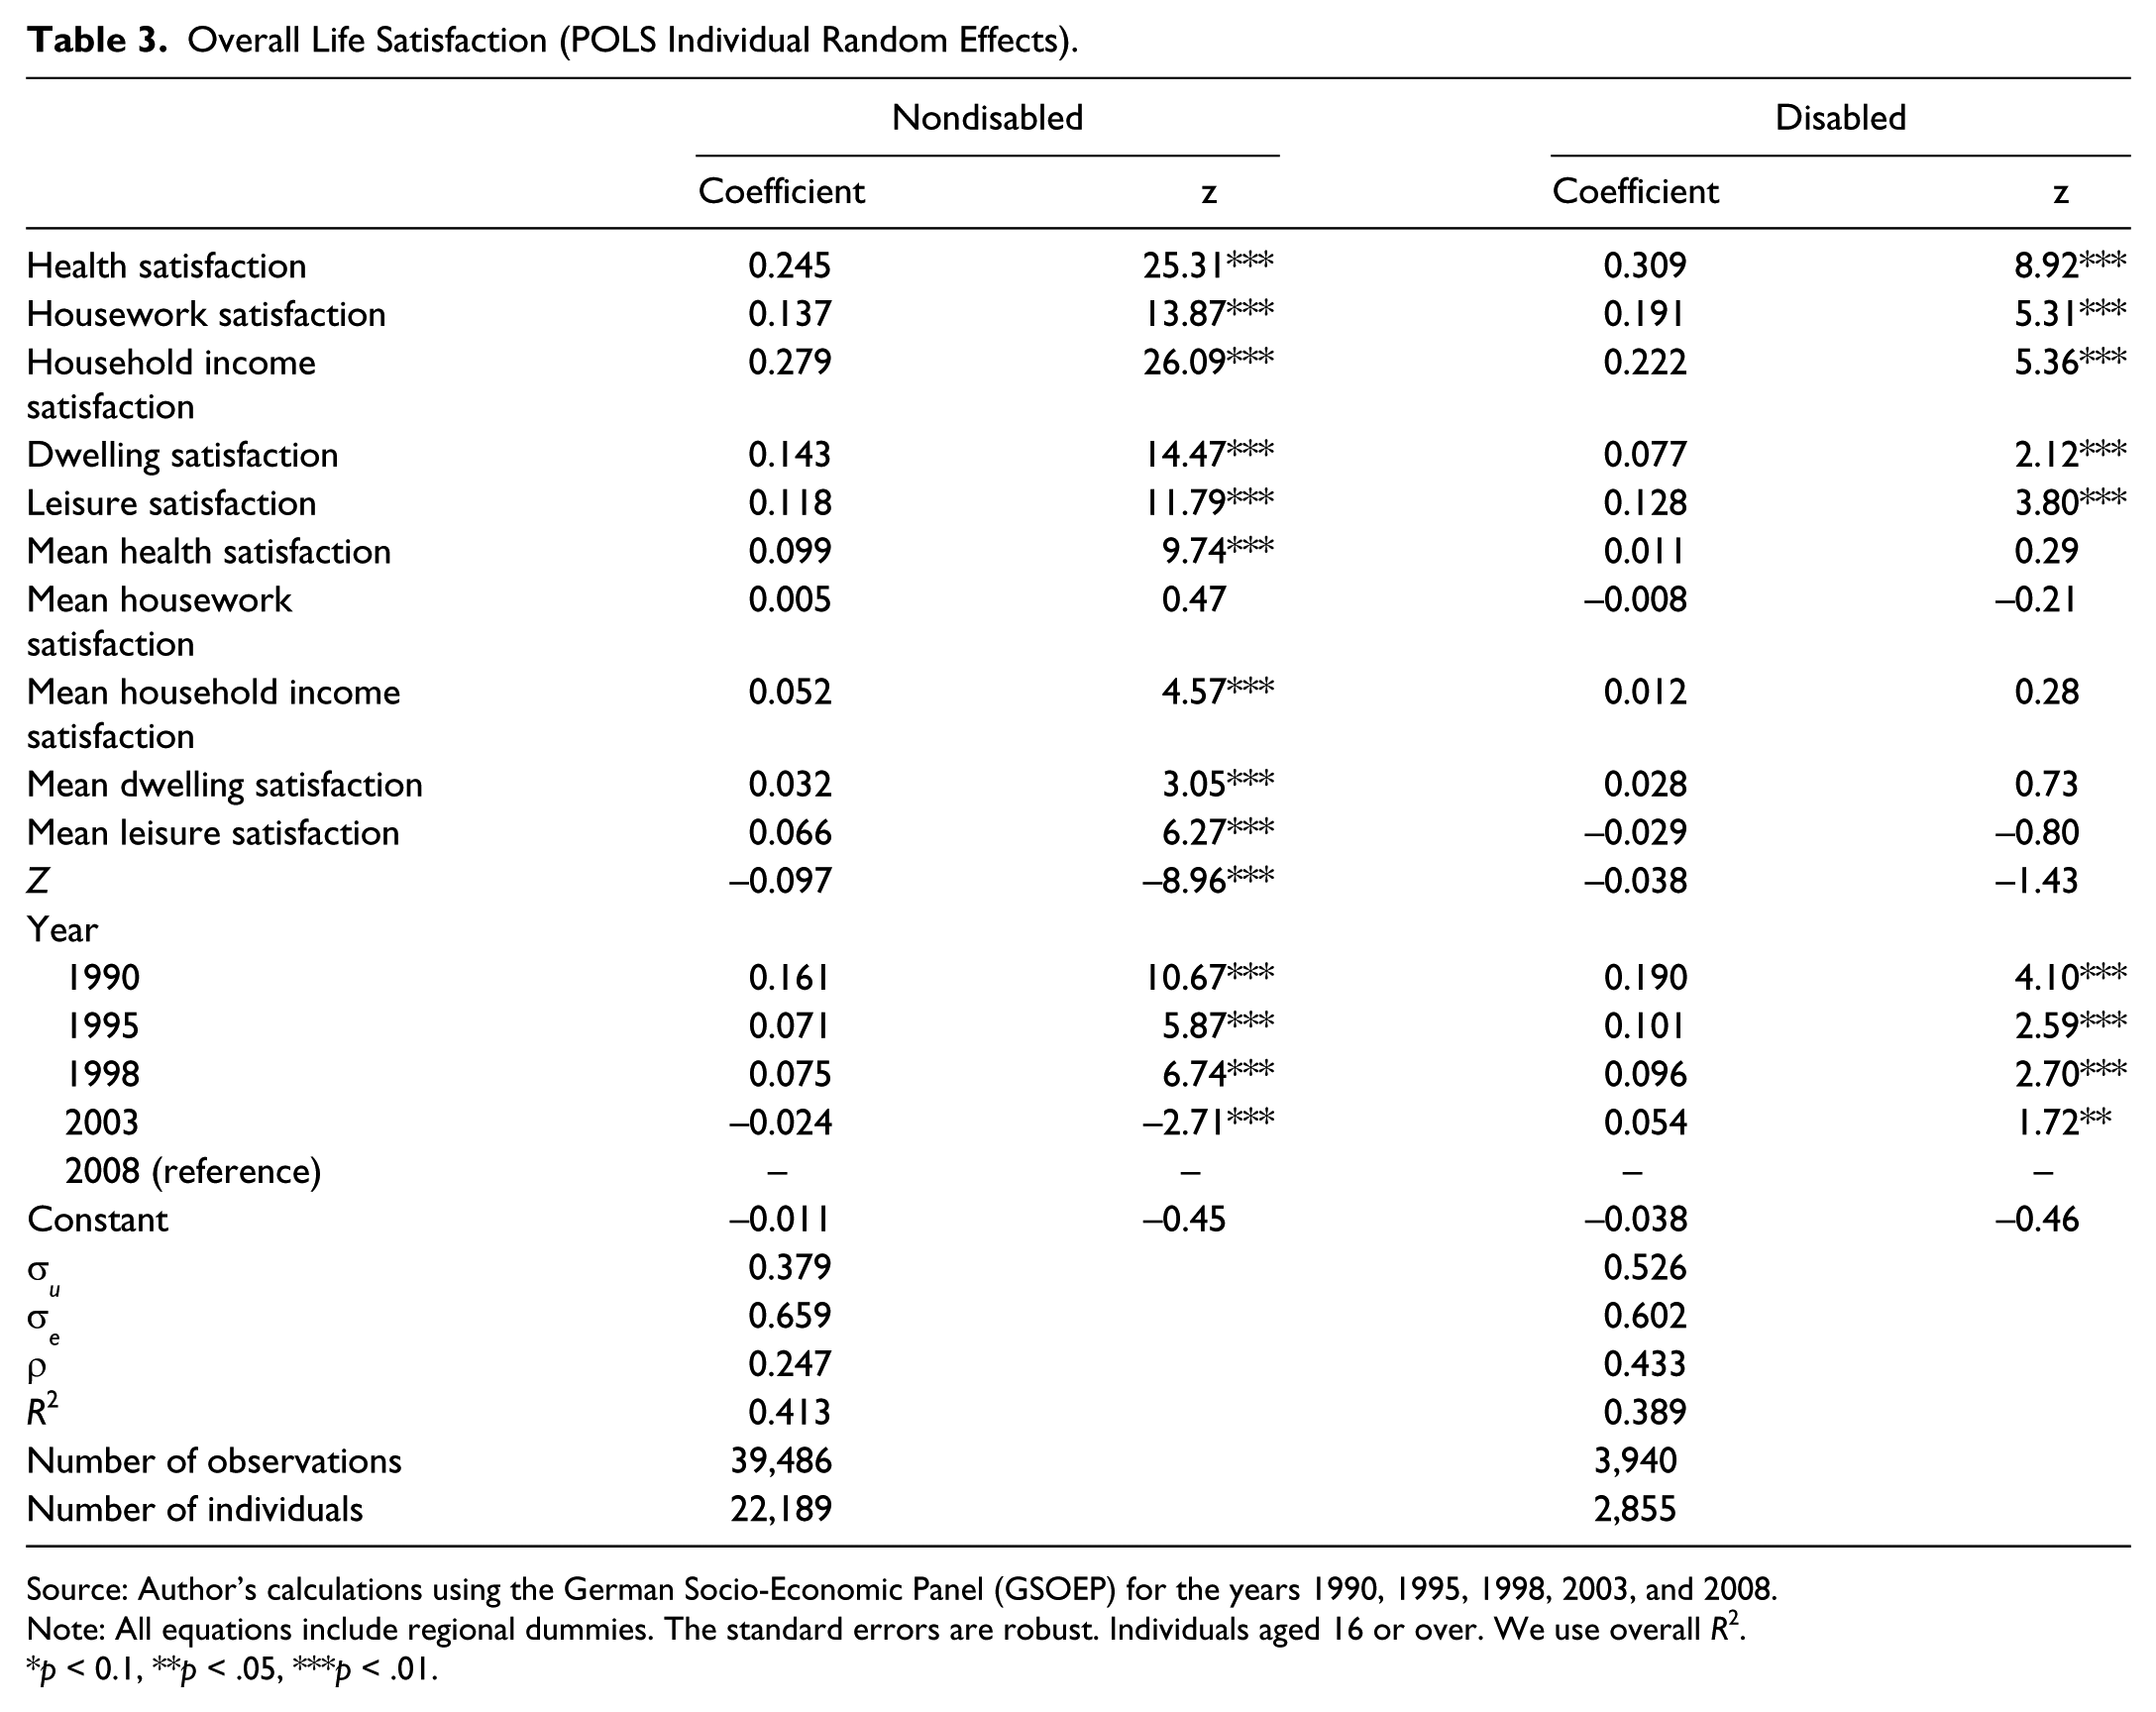
Table 3 reports the results from the estimation of equation (1), which reflect the relationship between overall life satisfaction and each domain of life satisfaction. As noted earlier, we have a reduced number of disabled workers who respond to the job satisfaction question (only 824 observations, which correspond to 727 individuals). For this reason, initially we have estimated equation (1) without the domain of job satisfaction, hence avoiding the loss of a large number of observations (and individuals). In any case, we have also included a table in the Appendix showing the results obtained if we add the domain of job satisfaction as an additional explanatory variable in equation (2). These results will be commented on later. According to Table 3, we find first that the additional variable Z in equation (1) used to correct the possible endogeneity bias is negative in both samples (nondisabled and disabled) but only significant at the 1% level for the nondisabled sample. This result corroborates that endogeneity is indeed a crucial issue that must be taken into account in these kinds of studies, where life satisfaction is considered as a multidimensional variable derived from various life satisfaction domains. Second, we observe that the contribution of the individual random effect to the total variance is relatively large for the disabled sample (0.433). Third, we detect a lower number of significant coefficients in the disabled sample (at the 10%, 5%, and 1% level, respectively) as compared to the nondisabled sample.
Overall Life Satisfaction (POLS Individual Random Effects).
Source: Author’s calculations using the German Socio-Economic Panel (GSOEP) for the years 1990, 1995, 1998, 2003, and 2008.
Note: All equations include regional dummies. The standard errors are robust. Individuals aged 16 or over. We use overall R2.
p < 0.1, **p < .05, ***p < .01.
As noted earlier in the Data and Method section, we can distinguish between transitory (i.e., coefficient on each domain of life satisfaction) and permanent effects (i.e., coefficient on the mean satisfaction of the corresponding domain). For the nondisabled sample, we find that almost all these transitory and permanent effects on life satisfaction domains have a positive and significant effect on life satisfaction. The only exception is the coefficient on mean housework satisfaction. However, we observe that the transitory effects seem to be different and higher than the permanents effects. For example, an increase by 1 percentage point in the transitory satisfaction with health increases the overall life satisfaction of the nondisabled by 24.5%, whereas a 1 percentage point increase in permanent satisfaction with health leads to an additional 9.9% increase in the nondisabled worker’s overall life satisfaction. In addition, we find a significant transitory effect of satisfaction with household income on life satisfaction (27.9%), whereas the transitory effect of satisfaction with leisure is the domain with the lowest contribution to life satisfaction (11.8%). For the disabled sample, we find that only the transitory effects are significant at the 1% level. Namely, holiday trips have no long-term or permanent effects on the levels of life satisfaction of disabled individuals. The highest transitory effect is found for the domain of satisfaction with health (30.9%), followed by household income (22.2%). In contrast, the lowest transitory effect is found for satisfaction with dwelling (7.7%). The nonsignificance of the permanent effects for the disabled sample is striking and is in line with the results obtained by Nawijn and Veenhoven (2011), who concluded, using data from the GSOEP, that holiday trips have a short-lived effect on individuals’ life satisfaction. De Bloom, Guerts, and Kompier (2012) also found that health and well-being levels improved early in the holiday but rapidly returned to base levels on return to work. However, in our case, this outcome is only supported by the disabled sample. This finding may be explained by the set point theory, which argues that individuals return to a life satisfaction baseline after painful (such as divorce, unemployment, etc.) or happy (marriage, the birth of a child, going on holiday, etc.) life events. In this view, particular experiences as, for example, holiday trips, can at best provide a temporary lift, after which we return to our set point (Cummins 2005; Veenhoven 2006).
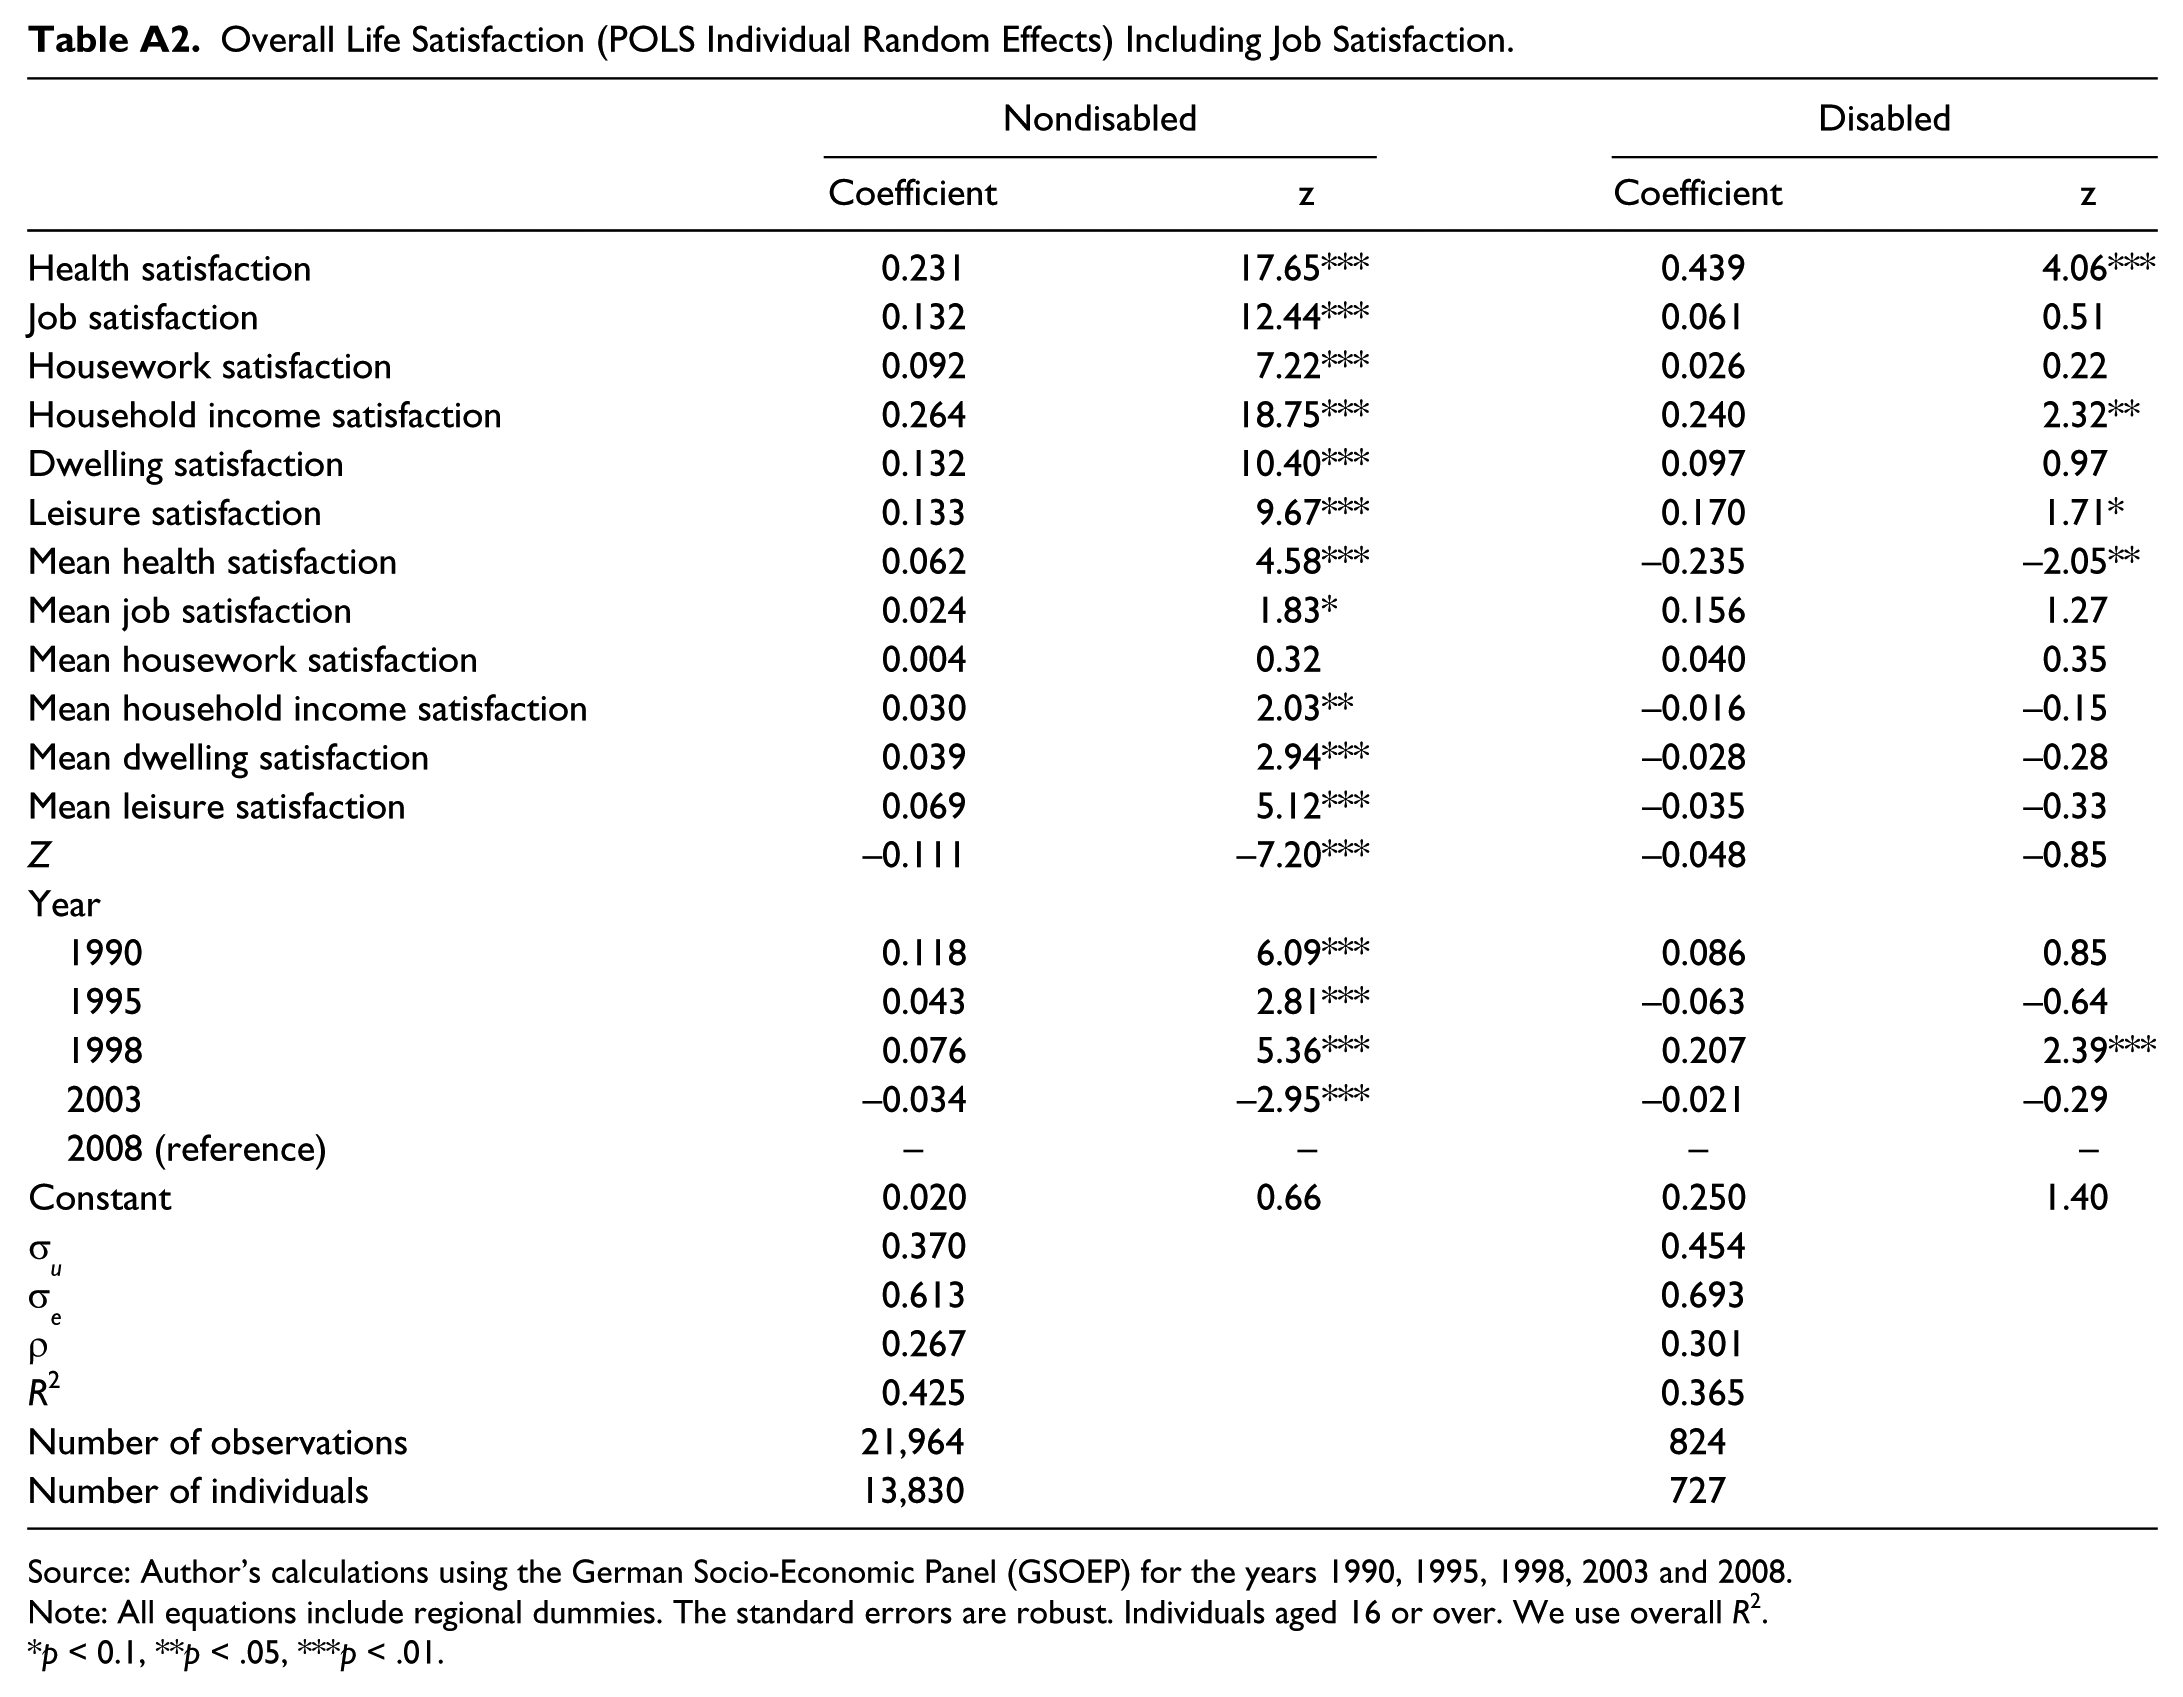
Additionally, we have reestimated equation (1) but now including as an additional explanatory variable the domain of satisfaction with job. According to Appendix Table A2, we find that the transitory and permanent effects of satisfaction with job are positive and significant at conventional levels for the nondisabled. An increase by 1 percentage point in the transitory satisfaction with job increases the overall life satisfaction by 13.2%, whereas a 1 percentage point increase in permanent satisfaction with job provokes an additional 2.4% increase in the nondisabled worker’s overall life satisfaction. The coefficients of the remaining satisfaction domains are similar to those included in Table 3. For the disabled sample, the number of significant coefficients is even lower than that shown in Table 3 (mainly because of the considerable reduction in the number of observations). In addition, we find that the coefficients of job satisfaction and mean job satisfaction are not significant and thus they do not have an effect on disabled individuals’ overall life satisfaction.
Finally and similar to Van Praag, Frijters, and Ferrer-i-Carbonell (2003), Table 4 shows the cumulative transitory and permanent effects of satisfaction with each domain on the overall life satisfaction. To calculate these cumulative effects, we have summed up the transitory and permanent effects for each domain as reported in Table 3. We also include in parentheses a ranking of domains of satisfaction from the most to the least positive impact on the overall life satisfaction. This ranking shows the importance attached by individuals to each domain in terms of the overall satisfaction effect. For nondisabled individuals, the domains with the highest positive effects on life satisfaction are health (0.344), household income (0.331), and dwelling (0.175). On the other hand, the domains of satisfaction with leisure and housework are located in the lowest positions, with 0.184 and 0.142 points, respectively. As for disabled individuals, once again the domains of health and household income are, in term of satisfaction, the main components that most affect the levels of overall life satisfaction for this group (0.32 and 0.234, respectively), whereas the domains of dwelling and leisure are the components with the least contribution to overall life satisfaction (0.105 and 0.099, respectively). However, we have to bear in mind that all these positive values for the disabled sample have been obtained by adding up the permanent effects which are very low (and with no significant coefficients). Therefore, all these level effects of satisfaction with life domains on overall life satisfaction for disabled people are mainly reflecting transitory effects. 10
Level Effects of Each Domain of Satisfaction on Life Satisfaction.
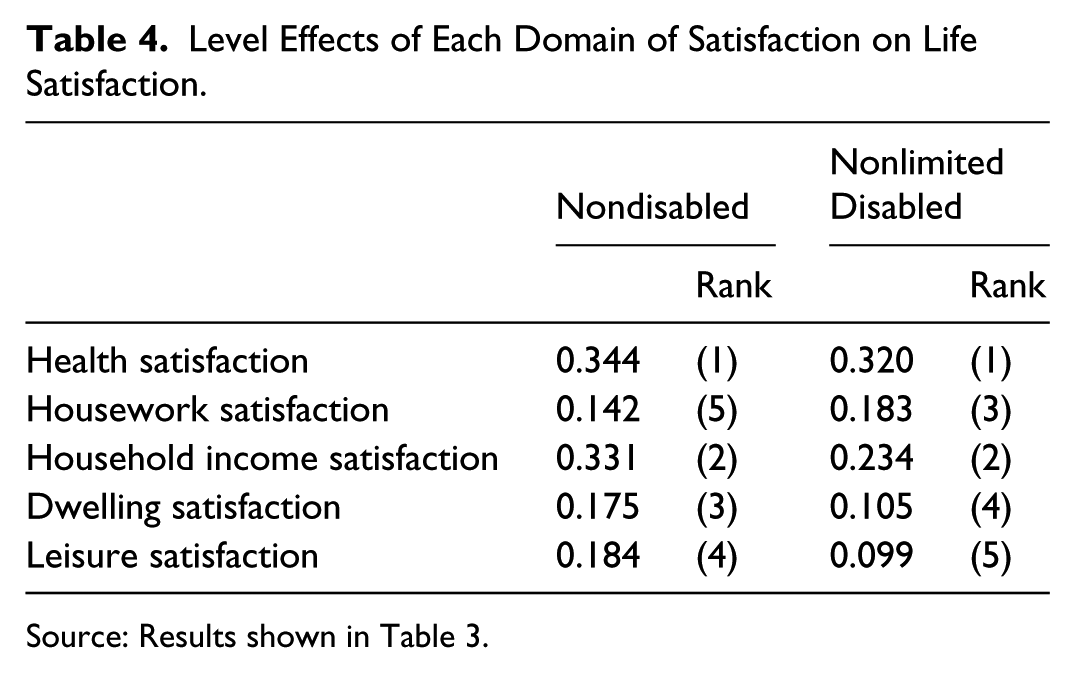
Source: Results shown in Table 3.
Discussion
This study has investigated the contribution of holiday trips to life satisfaction by nondisabled and disabled individuals, taking into account different domains of life (health, job, housework, household income, dwelling, and leisure). Following the methodology proposed by Van Praag, Frijters, and Ferrer-i-Carbonell (2003) and using data from the GSOEP for a set of years, we have estimated a two-layer model in order to, first, determine, how the participation in holiday trips affects each of these domains of satisfaction and, second, identify the weight of each domain on the individual’s overall life satisfaction. The results show that taking part in holiday trips increases the levels of satisfaction in all domains for the nondisabled and disabled samples. This finding is in line with the results found by Gilbert and Abdullah (2004), Neal, Sirgy, and Uysal (2004), and Sirgy et al. (2011) for the whole population. For the disabled, the contribution of holiday trips is higher in the domains of satisfaction with health, job, and housework as compared to their nondisabled counterparts. These results support the idea of the existence of a spill-over effect of holiday trips on all domains of life satisfaction, which in turn have an influence on overall life satisfaction (as Sirgy et al. 2011 pointed out). We also found significant effects of gender, age, years of education, employment status, and year of interview on our six domains of satisfaction, especially in the nondisabled sample. As for the determinants of life satisfaction, we found the significant contribution of transitory and permanent effects (in almost all satisfaction domains) for the nondisabled, whereas for the disabled we only obtained significant transitory effects. Namely, the effects of holiday trips on life satisfaction have a short-term influence for disabled individuals. This result is consistent with the works of Nawijn and Veenhoven (2011) and De Bloom, Guerts, and Kompier (2012). According to the cumulative effects shown in Table 4, the domains of satisfaction with health and household income are the main components increasing the levels of life satisfaction reported by the disabled population.
From a public policy perspective, our results have demonstrated the positive relationship between holiday trips and satisfaction with life (and the domains of satisfaction with health, household income, leisure, etc.). For example, the significant and positive effects of holiday trips on satisfaction with health for disabled individuals lead to identifying and incorporating into the tourism debate the relevance and importance of the role of health promoters, tourism academics, and those involved in a caring role in order to increase the participation and quality of life of disabled individuals (Hunter-Jones 2003). In addition, specific tourism programs and services should be designed to help disabled tourists feel relaxed, rested, renewed, and return home in a healthier state, both physically and mentally speaking (Sirgy et al. 2011). Tourism operators must increase their knowledge, training, and education regarding the needs and requirements of disabled travelers, thus avoiding negative attitudes toward disabled people. In this sense, cooperation between the public and private sector is crucial in order to create enabling environments and remove barriers in public accommodations, transport, information, and communication.
More data on the levels of satisfaction of travelers must be collected by the tourism industry and governments in order to carry out possible further research on disability, well-being, and tourism. Within this process, disabled individuals and their families should be consulted and actively involved in the design and implementations of policies, laws, and services aimed at boosting their inclusion and participation in the society in general and in the tourism industry as consumers/travelers in particular. According to Schleien, Hornfeldt, and McAvoy (1994), this inclusion is based on the premise that least restrictive and integrated environments benefit both individuals with and without disabilities in that all can experience the positive physical, cognitive, emotional, and social outcomes of recreation participation. Individuals with disabilities who perceived they were socially accepted were more satisfied with the leisure experience (Devine and Dattilo 2000). When inclusion served as a connector for participants, the staff played a pivotal role in facilitating bridges especially when they served as role models for positive attitudes and behavioral expectations (e.g., Devine and Lashua 2002; Grenier 2006).
As noted earlier, the study of the relationship between holiday trips and satisfaction for people with disabilities can be analyzed within the literature on social tourism. According to the special issue of the journal Current Issues in Tourism (June 2011), the most important barrier preventing disabled people from participating in tourism activities is affordability (Bélanger and Jolin 2011; Diekmann and McCabe 2011; Minnaert, Maitland, and Miller 2011). Many disabled people are economically fragile and have fewer financial resources to fully participate in the tourism industry. A range of financing options (e.g., lower payments, subsidies, income support, and fiscal benefits) could be designed to improve the coverage and affordability of tourism services for the disabled population. For example, it is necessary to negotiate lower and reduced prices with accommodation providers and tourist agents in order to enable access to holidays for the greatest number of people with disabilities. Social tourism can be seen as the expression of a fundamental right to travel, as a vehicle for the economic development of regions, and as a measure to increase social inclusion or as a route to greater European citizenship (Minnaert, Maitland, and Miller 2011). However, access to tourism is by no means universally seen as a right: for many, it will rather be a luxury, a discretionary activity to which no right exists. Furthermore, Poy (2003) points out that social tourism can be seen as the key to the development of certain isolated regions, by reviving the local economy through the facilitation of domestic travel and the stimulation of revenue creation at domestic destinations. However, social tourism will not provide the same benefits automatically for every participant with disabilities, so welfare agents need to be aware of their role in the process and how they can influence outcomes, and must be trained and resourced to do so (Minnaert, Maitland, and Miller 2009).
For the tourism industry, disabled people become a new target and potential market, which leads to increasing benefits, filling occupancy in low seasons and improving tourism seasonality patterns, generating new employment opportunities, and providing a range of support and assistance services adapted to disabled individuals. Our results have shown important differences in terms of satisfaction by gender. We have to take into account that disabled women face a further disadvantage because of the combined discrimination based on gender and discrimination based on disability (i.e., double discrimination). This fact must be considered from a public policy perspective. For example, disabled women suffer from higher rates of violence, abuse, and unemployment, and have lower levels of income, education, and school attendance than do nondisabled women (e.g., OECD 2003; Abramson, Emanuel, and Hayden 2000). Finally and according to the World Health Organization (2011), in transport, the goal of continuity of accessibility throughout the travel chain can be achieved by determining initial priorities and introducing accessibility features into regular maintenance and improvement projects, as well as developing low-cost universal design improvements that result in demonstrable benefits to disabled passengers.
Footnotes
Appendix
Overall Life Satisfaction (POLS Individual Random Effects) Including Job Satisfaction.
| Nondisabled |
Disabled |
|||
|---|---|---|---|---|
| Coefficient | z | Coefficient | z | |
| Health satisfaction | 0.231 | 17.65*** | 0.439 | 4.06*** |
| Job satisfaction | 0.132 | 12.44*** | 0.061 | 0.51 |
| Housework satisfaction | 0.092 | 7.22*** | 0.026 | 0.22 |
| Household income satisfaction | 0.264 | 18.75*** | 0.240 | 2.32** |
| Dwelling satisfaction | 0.132 | 10.40*** | 0.097 | 0.97 |
| Leisure satisfaction | 0.133 | 9.67*** | 0.170 | 1.71* |
| Mean health satisfaction | 0.062 | 4.58*** | −0.235 | −2.05** |
| Mean job satisfaction | 0.024 | 1.83* | 0.156 | 1.27 |
| Mean housework satisfaction | 0.004 | 0.32 | 0.040 | 0.35 |
| Mean household income satisfaction | 0.030 | 2.03** | −0.016 | −0.15 |
| Mean dwelling satisfaction | 0.039 | 2.94*** | −0.028 | −0.28 |
| Mean leisure satisfaction | 0.069 | 5.12*** | −0.035 | −0.33 |
| Z | −0.111 | −7.20*** | −0.048 | −0.85 |
| Year | ||||
| 1990 | 0.118 | 6.09*** | 0.086 | 0.85 |
| 1995 | 0.043 | 2.81*** | −0.063 | −0.64 |
| 1998 | 0.076 | 5.36*** | 0.207 | 2.39*** |
| 2003 | −0.034 | −2.95*** | −0.021 | −0.29 |
| 2008 (reference) | – | – | – | – |
| Constant | 0.020 | 0.66 | 0.250 | 1.40 |
| σ u | 0.370 | 0.454 | ||
| σ e | 0.613 | 0.693 | ||
| ρ | 0.267 | 0.301 | ||
| R 2 | 0.425 | 0.365 | ||
| Number of observations | 21,964 | 824 | ||
| Number of individuals | 13,830 | 727 | ||
Source: Author’s calculations using the German Socio-Economic Panel (GSOEP) for the years 1990, 1995, 1998, 2003 and 2008.
Note: All equations include regional dummies. The standard errors are robust. Individuals aged 16 or over. We use overall R2.
p < 0.1, **p < .05, ***p < .01.
Declaration of Conflicting Interests
The author declared no potential conflicts of interest with respect to the research, authorship, and/or publication of this article.
Funding
The author received no financial support for the research, authorship, and/or publication of this article.