
Abstract
This article addresses tourist demand during the persisting economic downturn between 2008 and 2013, within the context of expenditures on other consumer goods, taking into account different types of vacations and focusing on the “why” of the development of this demand over time. The research approach is a micro-analysis of data that are partly longitudinal and partly cross-sectional. The findings show that holidays, in particular the main summer holiday, can be positioned closer to being a necessary good than to being a luxury good, at least during an economic downturn. Many vacationers are prepared to sacrifice expenditures on a variety of products just so as to keep on going on holiday. The major explanation is the high essentiality of vacations for a better quality of life. The influence of income and personal economic situation on tourist demand at the micro-level during an economic downturn is relatively minor or nonexistent.
Introduction
Tourist demand and expenditures have for a long period been an important topic of interest for tourism research, though this interest seems to wax and wane over time. The reviews of Wang and Davidson (2010), Song et al. (2012), and Brida and Scuderi (2013) identify the major approaches, issues, and findings in relation to this investigation of tourism demand. They conclude that the research is dominated by studies that have used aggregated or pooled data, while studies using the data of individual tourists, or micro-analyses, are much rarer. As regards explanatory variables, studies most frequently use income and other sociodemographic variables with a lack of psychological and destination-related variables. Summarizing, Wang and Davidson (2010) state, “The review indicated that micro-economic modeling of tourism demand is an under-researched area, and future studies should investigate the effect of psychological and destination-related variables on expenditure” (p. 522).
The research reported on in this contribution takes up these challenges and extends it to three aspects that play a role in vacationers’ spending:
Tourist demand during a prolonged economic crisis The economic conditions under which vacationers live vary. Most studies reviewed by the authors mentioned above were carried out in the1990s and early 2000s, when most economies flourished. The financial crisis that commenced in 2008 fundamentally altered this climate, leading, particularly in Europe, to a persisting economic downturn that influences people’s disposable incomes. This raises the question (see, e.g., Papatheodorou, Rossello, and Xiao 2010; Alegre, Mateo, and Pou 2013) as to how vacation demand and expenditures are influenced by an economic downturn. Previous research into the effects of an economic crisis on tourism is rather scarce. Exceptions are studies directed at the 2001 crisis in Turkey (Okumus and Karamustafa 2005) and the Asian financial crisis in the 1990s (Henderson 1999), whereas others are outdated as the last global recession was long ago. The main data used in these studies are aggregate ones focusing on, for example, inbound tourism variables like foreign arrivals and hotel bookings (see, e.g., Song et al. 2011) and not on individual vacationers and their holiday plans and decisions. In general, a mild impact of economic crises on tourism was found.
Tourism as compared with other household expenditures Tourist demand takes place not in isolation, but in the context of many alternative ways in which a consumer can spend the available money. Comparing expenditures on alternatives like durable goods and necessities (such as housing and food) with expenditures on vacations can shed light on the relative importance of a holiday. One of the few studies comparing expenditures on vacations with expenditures on other consumer goods was carried out by Crouch et al. (2007). However, they investigated spending a one-time available extra amount of AU$2,000. Their main finding was that the largest portion of discretionary spending of this amount went to reducing mortgage repayments. More specifically, the question as to whether holidays can still be regarded as luxury goods is an interesting one, and can be answered when the real need to cut expenditures becomes more pressing in adverse economic conditions.
Tourist spending broken down by expenditures on different types of holidays Tourist spending is a term that covers all money spent by tourists or vacationers. However, vacations are highly configurable products that can range from a long summer holiday to day trips away from home. Models that fit demand for a main summer holiday may not fit demand for short trips, like visiting a city for a few days. As Brida and Scuderi (2013) state, “Types of visits, such as same-day trips, remain unexplored” (p. 38).
Based on what has been said above, the paper addresses tourist demand during a persisting economic downturn in the context of spending on other consumer goods, taking into account different types of vacations. The research approach is a micro-analysis of partly longitudinal and partly cross-sectional data.
Theory and Research Questions
Previous research has shown that, in the Netherlands for example, tourist demand and expenditures are remarkably crisis-resistant (Bronner and de Hoog 2012, 2014). They show that between 2008 and 2012, when the economic downturn exhibited a W-shaped pattern, the percentage of vacationers who cut expenditures on summer holidays stayed almost the same, even if disposable incomes decreased and individual economic prospects became worse. In addition, overall spending on vacations remained stable during this period. Also the study by Eugenio-Martin and Campos-Soria (2014) shows that of 165 European regions, the three Dutch regions included are placed 157–159 in the ranking of the probability of cutbacks on tourism expenditures. This crisis resistance is also observed by other studies in other countries. A Harris Poll (HarrisInteractive 2009) showed that adults in five large European countries (Great Britain, France, Italy, Spain, and Germany) and in the United States will take fewer vacation days but would not let the economic crisis spoil their vacations. However, in Europe substantial country-wise and regional differences do occur (Eugenio-Martin and Campos-Soria 2014). Furthermore, Ritchie, Amaya Molinari, and Frechtling (2010) conclude, “In the case of the United States, the indelibly-etched events of 9/11 have had a much greater impact than the current crisis, while in the case of Mexico, it has been natural disasters that have affected the national tourism industry to a greater extent than the current economic crisis” (p. 13).
As tourist demand during an economic downturn is the context for the research described in this contribution, the first research question is whether the crisis resistance of this demand that was shown between 2008 and 2012 still holds true in 2013.
Research question 1: Has the tourism demand of vacationers living in countries suffering from an economic downturn still been crisis-resistant during the most recent period (2013)?
The next research question focuses on the position of vacations among other product categories when consumers have to allocate money to the available options. This is a well-known problem, addressed by economists and consumer researchers under the notion of the substitution rate between products or trade-offs in relation to meeting different consumption needs (Du and Kamakura 2008). A more recent study by Kamakura and Du (2012) is an example of an investigation of this issue. The common assumption, as expressed by these authors, is that when disposable income decreases, “Consumers cut expenditures disproportionally more in less essential categories (e.g., dining out), resulting in smaller shares for these categories and larger shares for the more essential (e.g., food at home)” (p. 229). This is related to the notion of a luxury good. In the tourism literature, vacations were in the past seen as a luxury good (see, e.g., Smeral 2012), which implies that demand for holidays will decrease proportionally more than the demand for nonluxury goods when disposable income decreases. However, the data collected by Bronner and de Hoog (2012, 2014) seem to point in the opposite direction because over a period of 4 years of economic downturn, tourist demand and spending in the Netherlands hardly changed. From this perspective, the demand for tourism can be interpreted as a relative demand: the demand for a product or service depends on how this product or service is situated in the overall expenditure pattern of individual consumers. For example, when making a decision on vacation-related expenditures, this decision carries the implication that if this spending increases, less money is available for expenditures on, for example, mobile phones or furniture, given the same disposable income. In other words, what is, as Dolnicar, Yanamandram, and Cliff (2012) say, “the willingness to sacrifice vacations in times where they may have to prioritize other aspects of their lives” (p. 75). This decision is based on a priority rank order that, in turn, is based on individual utilities, leading to a challenge for researchers to investigate what drives these priorities.
To investigate this relative demand for vacations amid other consumer products, a categorization of a wide range of different consumer goods is needed. The study by Crouch et al. (2007) used a rather limited set of consumer goods, including reducing household debts that are not suitable to include when the focus is on economizing decisions. A more fitting approach can be found in the paper by Kamakura and Du (2012), who use essentiality and visibility as two dimensions for classifying consumer goods. For determining the essentiality of a good, they use Engel-curves, where the y-axis shows the proportion of total expenditures on a particular product and the x-axis, total expenditures. More essential products will have a negatively sloped Engel curve and less essential products a positively sloped one. Their dimension of visibility is based on the idea of positional goods: goods whose amount of consumption depends to a certain extent on the consumption of these goods by a reference group. This notion of positional goods is also present in the concept of conspicuous consumption (Veblen 1899), described as the advertisement of one’s income through spending more on visible items. Vacations can be considered as an example of conspicuous consumption: consumers feel the need to maintain or improve their social position through consuming certain goods. Their consumption is not only for functional utility but also for their social meaning (Christen and Morgan 2005).
Heffetz (2011) uses visibility of a product as an indicator of conspicuous consumption. Based on empirical research at the level of individual consumers, he classifies an extensive set of products in a visibility rank order. Unfortunately, vacations are not present in this rank order, but some components of a vacation are present: air travel and hotel stays. Kamakura and Du (2012) use this rank order of visibility for their two-dimensional classification of consumer goods. In addition, they “classify expenditures mostly related to vacations (airfare, lodging away from home) as visible, because being away from home on a vacation would be fairly noticeable to one’s neighbors, friends and colleagues” (p. 234).
Based on this literature, we will use essentiality and visibility as the two dimensions for classifying consumer goods in order to compare their demand with the demand for vacations. However, which goods, apart from vacations, should be included in the research? In part, we use the same goods as used by Heffetz (2011) and Kamakura and Du (2012), with some additions based on two criteria:
They should make up a sizeable part of the household budget.
They should be of such a nature that expenditures on them can be changed in the short term, which excludes expenses for rent, mortgage, pensions, insurance, and taxes.
The previous research and the two criteria lead to the classification shown in Figure 1. In order to take into account the heterogeneity of vacations, we split the vacation product into three different subtypes: the Main summer holiday (about 65% of vacation spending in the Netherlands is on this holiday), Short in-between trips (like city trips: a long weekend, for example) and Day trips away from home. We assume that the Main summer holiday can be regarded as more essential, given the stability of spending over the last decade and its high visibility, since being away for some time is easily observable by others. Additionally, summer holidays are a topic very commonly raised during social occasions at home, at work, and increasingly, in the social media. The Short in-between vacation is assumed to be less essential, but still fairly visible, while Day trips away from home are seen as less essential and are characterized by a low visibility, as it will be difficult for others to notice the difference between being away for work or shopping, and being away on a day trip.
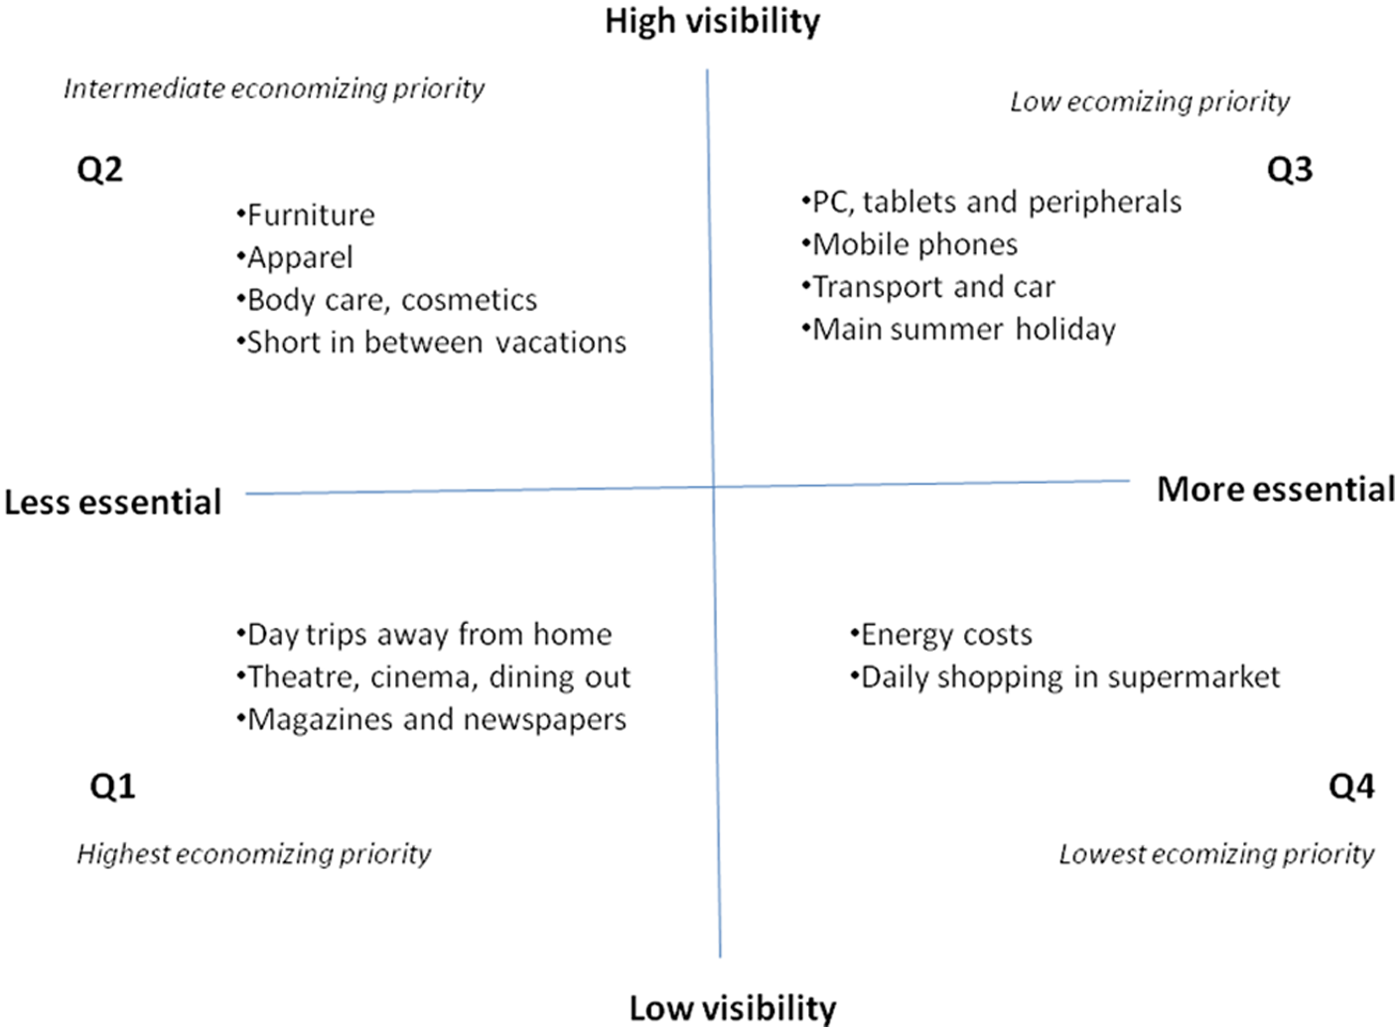
Classification of goods and services included in the research.
These considerations lead to the second research question:
Research question 2: Do differences in the essentiality and visibility of a product influence the likelihood that relative demand for a product will be reduced by consumers during a lasting period of economic downturn, and what is the position of vacations in this respect?
Relative demand during a lasting period of economic downturn can be measured in many different ways. Given this specific economic context, we use the individual economizing priorities of consumers as an estimate of the effect of the economic downturn on the relative demand for different consumer products, including the three types of vacations.
Using the literature mentioned and Figure 1 above, a hypothesis is proposed as regards what will happen to consumer spending during an economic downturn. This is done by rank-ordering the four quadrants of Figure 1 in accordance with their economizing priority:
Lowest economizing priority: Quadrant 3 (more essential, high visibility)

Highest economizing priority: Quadrant 1 (less essential, low visibility)
More specifically, as regards the type of vacations, the prediction is that reductions in demand will be least (if showing up at all) in relation to the Main summer holiday, followed by reductions on Short in-between vacations, with the greatest reduction in demand showing up in relation to Day trips away from home.
This hypothesis is related to the notion of the income elasticity of consumer goods. This elasticity is expressed as the ratio between % change in income and % change in demand for a product. This income elasticity is used to classify goods as being more luxury goods (income elasticity >1) or being more necessary goods (income elasticity ≤1). Traditionally vacations were found to be luxury goods (Smeral 2012). Expenditures on luxury goods will be sacrificed, in this view, as soon as the disposable income of consumers decreases. According to Heffetz (2011), there is a moderate positive correlation between elasticities and visibility of a good and his data show that vacations have average elasticities, positioning them in between luxury and necessary goods. Also Heffetz (2011) raises the possibility that expenditures can be luxuries at some income levels and necessities at other levels, which could be applicable to the main summer holiday. Furthermore, Seetaram (2010) found that “tourism demand is inelastic with respect to income in the short run” (p. 419). Eugenio-Martin and Campos-Soria (2014) conclude that tourism generally behaves as a luxury good: as income increases its consumption also increases, but their analysis is based on cutback probabilities.
In research question 2 we classified products using the visibility and essentiality dimension to explain economizing priorities. A low economizing priority is seen as indicating a high crisis resistance of a product. A further step is made by investigating what drives this essentiality dimension in Figure 1, because we expect that essentiality can be related to several beneficial aspects a holiday can have. In the literature, overviews of benefits from holiday making can be found. However, the relation between these benefits and demand and expenditures on vacations in times of an economic downturn has received very limited attention in tourism research. We discern six drivers that can affect this essentiality and, as a consequence, contributes to this crisis resistance (=low economizing priority). These possible explanations for the limited influence of the economic downturn on vacation behavior are elaborated below. In the empirical section, data are presented about the relative importance of these drivers. These drivers are as follows.
Family Cohesion
As several papers show, vacation has a positive influence on family functioning (Kluin and Lehto 2012). More specifically, holidays are a contributor to family communication and cohesion (Lehto et al. 2009). This is especially true in a period when both parents have a busy and stressful professional life and children work hard at school. In such a situation, a vacation can be considered, according to Lehto et al. (2009) as a “reconfiguration of interpersonal distance” (p. 463). A more concrete example is given by Kelly (1983), who shows that parents testify that just being together in the car with no distracting tasks provides an opportunity for communication, especially with older children. Durko and Petrick (2013) recently carried out a literature review of the benefits of travel for families and relationships. Their findings reveal that because time for family bonding is decreasing because of increased career demands, a vacation can be used as a kind of compensation. They support their conclusion with some illustrations based on the literature: “A holiday helped re-ignite the flames of love” (p. 6), “Vacations can increase marital satisfaction” (p. 6), “Travel has been introduced as a resource to combat domestic unrest and unhappiness and has been used to deter couples from divorce” (p. 5).
To summarize, time allocated to family bonding is diminishing due to increasing job and education demands and vacations can “reconfigure” these bonds and generate positive effects on family cohesion.
Well-Being and Life Satisfaction
Dolnicar, Yanamandram, and Cliff (2012) investigated the contribution that vacations make to life satisfaction and the subjective feeling of well-being. Because objective measures of life conditions account for only a modest proportion of individuals’ subjectively reported well-being, the authors use a “subjective well-being approach which focuses on individuals’ subjective experience of their lives” (p. 60). This study reveals that although vacations are seen by different people as contributing differently to their well-being, it can be concluded that as far as the large majority of people are concerned, vacations do contribute to this well-being. This finding is consistent with the opinion of other authors, like Sirgy (2010), who shows that vacations and life satisfaction are related. This finding, in his opinion, also has managerial implications. He concludes that “research should allow tourism researchers to propose the development of specific tourism services and programs designed to maximize tourist satisfaction in ways that contribute to life satisfaction” (p. 255). Furthermore, Chen and Petrick (2013) also conclude, based on a literature review, that people feel happier after taking a vacation.
To summarize, leisure and vacation are important factors in enhancing the more subjective feelings about life (in the literature, a diversity of concepts is used for these kinds of feelings, such as life satisfaction, feelings of well-being, perception of life quality, mental healthiness, and emotional health).
Physical Health
The previous driver refers to the importance of the more subjective feelings of well-being. The third driver highlights the more objective factor of health. Chen and Petrick (2013) argue that most studies in the past have been focused on perceptions, while physiological measures have been adopted only by a very limited number of studies. Still, there is evidence that taking vacations improves physical health. Individuals who traveled more frequently had fewer nonfatal cardiovascular events and lower risk factors for coronary heart disease (Gump and Matthews 2000). Lewis (2001) found that a holiday may reduce stress-related illness in children. However, based on their literature review, Chen and Petrick (2013) conclude that more research is needed to conclude whether vacations “help people to become healthier and not just feel healthier” (p. 8).
To summarize, taking vacations can improve physical health.
Postponing to the Future
One may expect that an economic downturn influences vacation expenditures in a negative direction. However, income effects can lag and as a consequence vacationers postpone the decision to cut down on holiday expenditures to later years (Bronner and de Hoog 2014). Seymour and Moore (2000) use an apt analogy. Economic downturns, like the period 2009–2013 in Europe, can be of two types: the cobra type, which strikes suddenly, and the python type, which occurs gradually. The current crisis in Europe is more similar to the way in which a python strikes, that is, gradually, and is less similar to the sudden approach of a cobra. This python effect may explain why an economic recession has a limited influence on vacation planning in the short term: vacationers postpone their expenditure cuts to the future.
To summarize, the present economic downturn in Europe has more the character of a python effect, striking gradually, rather than a cobra effect, which strikes suddenly. This leads to a delay in the cutting of vacation expenditures.
Using Savings and Borrowing
Another driver of the crisis resistance of tourist demand is that vacationers use their savings to continue their vacation behavior, and in this way circumvent their liquidity constraints (Smeral 2012). Alegre, Mateo, and Pou (2010) conclude that “households that are able to save present a likelihood of being able to afford a holiday that is 10.52 percentage points higher” (p. 52). In a later study, Alegre, Mateo, and Pou (2013) state in a similar vein that households’ saving capacity should be included in studies concerning income and tourist expenditures. An alternative for using your savings account is borrowing (Christen and Morgan 2005). More and more consumers pay for products and services by incurring debt. Thanks to buying on credit, some vacationers may maintain their former travel behavior, despite the economic downturn.
To summarize, using your savings account or borrowing by buying on credit may make it possible for a consumer to afford a holiday, despite a drop in disposable income.
Loss Aversion
Kahneman and Tversky (1979) developed prospect theory, and its most essential postulate is that losses of a certain amount result in a utility loss that is larger than the utility gained by the same amount. More specifically, they say, “The aggravation that one experiences in losing a sum of money appears to be greater than the pleasure associated with gaining the same amount” (p. 279). Because of this phenomenon, people are loss-averse. Going on holiday for many consecutive years and then giving up this pleasure can be seen as a loss that has to be averted at any price. Smeral (2010, 2012) has also suggested that vacationers are loss-averse.
To summarize, loss aversion may be a reason for not giving up your holiday.
So far, we have sketched six possible drivers for crisis resistance, based on the essentiality dimension in Figure 1. These drivers are seen as six psychographic variables covering the gap identified by Brida and Scuderi (2013): “The importance of psychological factors for the choice of destination and expenditures cannot be ignored” (p. 37), and “this should instead motivate the proposal of new ways to measure intangible traits of the consumer” (p. 38). Also, Wang and Davidson (2010) notice the scarce use of psychographic variables in studies of tourism demand.
In the empirical section, we will investigate the relative importance of these drivers for explaining crisis resistance, and answer research question 3, which is formulated as follows:
Research question 3: What is the relative importance of the different psychographic drivers influencing the crisis resistance of tourist demand during an economic downturn?
The next research question concerns the role of more frequently used factors that can explain holiday expenditures and demand when combined with psychographics as used in research question 3. Income is obviously an important factor. In the literature, much attention is paid to the relation between income and tourist demand. Models are available at a macroeconomic level (e.g., number of arrivals, number of hotel nights) and at a microeconomic level (survey data with nationally representative tourist samples, measured at an individual level).
Income is important, but it is also clear that there is more at play than income alone. Alegre, Mateo, and Pou (2010) conclude, “The households’ probability of being able to afford a holiday is not just dependent on their level of income” (p. 46). Expectations about the future, like assessments of the future risk of a job loss, are even more important than income. This implies that indicators of the personal economic situation and expectations should be included in the analysis.
Furthermore, Dolnicar, Yanamandram, and Cliff (2012) state, “Few studies have investigated the contribution of vacations to tourists’ QOL” (p. 62). These authors understand quality of life (QOL) to mean “an individual’s subjective evaluations of the degree to which his or her most important needs, goals, and wishes have been fulfilled” (p. 60). It should be noted that in the literature a distinction is made between the QOL of tourists and the QOL of residents of host communities of tourist destinations (Uysal, Perdue, and Sirgy 2012). The latter QOL is related to issues of sustainable tourism that are not covered in this article. Recent research in the Netherlands by GFK (2014) shows that vacations are seen by consumers as substantially contributing to individual happiness. They are ranked second (46%), just behind apparel (47%), but far ahead of entertainment (26%) and food (22%). As a consequence, QOL can be used in our research as another psychographic variable that explains additional variance besides income and one’s personal economic situation. Based on these considerations, research question 4 can be formulated.
Research question 4: What explains the crisis resistance of tourist demand: income and other sociodemographics, the psychographic variable QOL, or the individual economic income effects and expectations?
In the next section, the operationalizations needed for the purpose of answering research questions 1–4 are detailed. Furthermore, information is presented about sample size and sample composition.
Research Design
Sample
The samples in this study are from the Dutch Continu Vakantie Onderzoek (CVO; “continuous vacation panel”). This panel consists of respondents who report on their vacation behavior four times a year. It is refreshed annually, which does not allow a longitudinal analysis at the individual level. The CVO data are weighted for sociodemographics, resulting in a sample that can be considered as representative of the Dutch population for variables crucial to the vacation decision. All tour operators in the Netherlands make use of these data, and the study is considered to be the standard for obtaining insight into holiday plans and decisions. The fieldwork is carried out by TNS NIPO, one of the largest Dutch market research agencies. For data collection, computer-assisted self-interviewing is used. Respondents can answer the questions at home at a time that is convenient to them and can take the time they require to answer the questions. This customer-friendly approach increases response and data quality, as was shown by Bronner and Kuijlen (2007). In addition, according to Dolnicar, Yanamandram, and Cliff (2012), online panels do not suffer from higher levels of sample bias like traditional mail surveys do.
The samples used are from the five-year period 2009–2013, and all data were collected in the month of April in the year of measurement.
Operationalizations of the Main Concepts
To answer research question 1, we employ three standard questions from the CVO, which were included in that study during the period 2009–2013:
Expenditures 1
How much money do you intend to spend on holidays in 20…, as compared with the previous year? Answers: more, the same, less, don’t know.
Expenditures 2
If spending less money:
What percentage less do you expect to spend: between 1-15%, between 16-25%, more than 25%?
Demand
Do you intend to go on holiday one or more times in 20..? Answers: Yes, definitely; yes, probably; perhaps; no, likely not; certainly not.
To answer research question 2, the following questions were asked in the 2013 sample:
As you can see every day in the media we live in a period with less economic prosperity. Prospects for recovery are uncertain. Suppose that this year you have 10-15% less money to spend due to these economic developments and suppose that this decline will continue for 2-5 years.
Suppose that this causes you to economize: which product categories are the first you will economize on? From the list of 13 product categories below (in this paper Figure 1), select the three which have the highest priority in terms of economizing.
Which three product categories have the lowest priority in terms of economizing?
The choice for 10%–15% and two to five years is based on data collected in four matched random samples (between n = 1,300 and n = 1,400) using four questions of the same type as the one described above. These differed in loss of income and duration: 5%–10% and two years, 5%–10% and five years, 15%–20% and two years, 15%–20% and five years. The analysis of these data showed that the product–moment correlations between the priority rankings over the four conditions were all above .90. This finding motivated us to choose for an intermediate question concerning loss of income and duration: 10%–15% and two to five years.
The decision to use two times the “pick 3 out of 13” option is based on the known difficulty of letting people reliably completely rank-order a substantial number of options. The same holds true for using paired comparisons and triadic comparisons. To cite Green and Tull (1978), “Generally speaking, these designs reduce the number of comparisons per respondent” (p. 173). The choice for two times 3 is based on the assumption that about half of the options can be reliably rank-ordered.
For research question 3, the following questions were asked in the 2013 sample, each linked to the drivers mentioned:
Family cohesion
To me, vacations are indispensable as regards having and maintaining good relations with my partners and/or children
Well-being
Vacations are essential for my well-being
Physical Health
My health would suffer strongly if I did not have a vacation
Postponing to the future
If the economic crisis lasts a long time, I will be forced to economize on vacations
Savings
In order to keep going on vacations, I am willing to use my savings
Loss aversion
I am so used to taking holidays that I will not sacrifice vacations easily.
All these questions are measured using a 7-point Likert-type scale, which ranges from fully agree to fully disagree.
Concerning research question 4, the following questions from the 2013 sample are used:
Questions about sociodemographics: gender, income, age, household size.
Two questions are asked about the respondents’ personal economic situation:
During the past 12 months, did your economic situation deteriorate, stay the same, or improve? Answers: deteriorated, stayed the same, improved.
Do you expect that in the next 12 months your economic situation will deteriorate, stay the same, or improve? Answers: will deteriorate, will stay the same, will improve.
The 2013 sample consists of 5901 respondents. For a variety of reasons, the economizing priority questions are not answered completely by all respondents, so 447 respondents were not included in the analyses of the economizing questions, leading to a sample size of 5454 for the priority analyses. The excluded 447 respondents did not differ from the other respondents in terms of sociodemographics.
Results
Research Question 1
The general context of the economy in the Netherlands between 2008 and 2013 can be characterized by a W-shaped curve for the key indicators of consumer behavior: disposable income, consumer confidence, and consumption (CBS 2013). The W-shape implies that the bottom is hit twice, with the major dips in 2009 and after 2011. In 2013, the economic situation is still in this last dip, with maybe a minor recovery in the near future (2014/2015). Economic indicators for many other European countries point in the same direction. Obviously, the crisis is persisting far longer in Europe than media and politicians expected in 2008, and this persistence has received much media coverage, thus influencing consumers’ attitude and buying intentions. What is the influence of this W-shaped crisis on tourist demand and expenditures? Figures 2 and 3 provide an answer.

Planned vacation expenditures for a year when compared with the previous year.
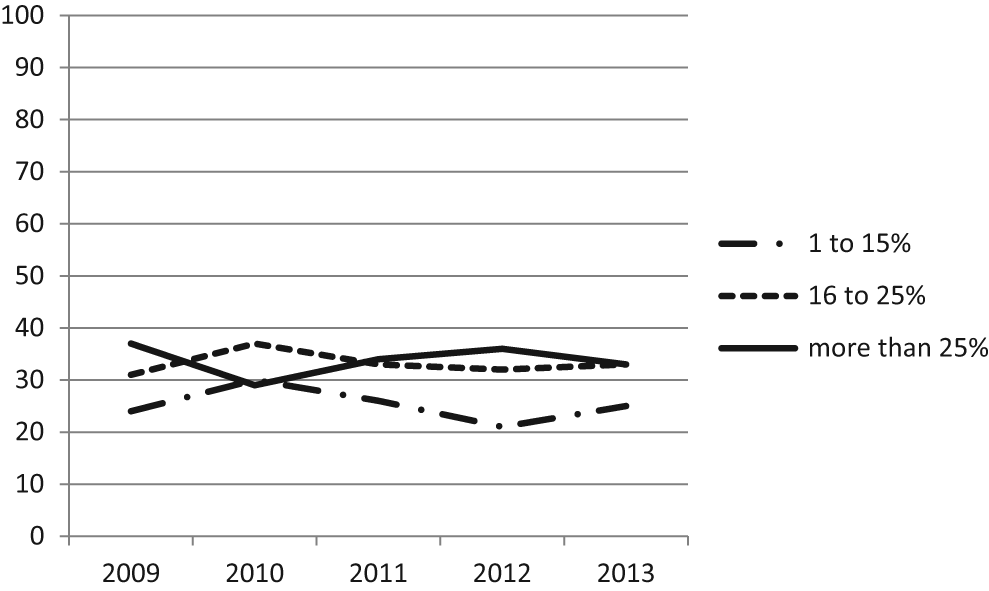
Percentage that vacationers intend to spend less on their vacation than the year before.
Figure 2 shows the planned vacation expenditures of Dutch vacationers for a particular year when compared with the previous year.
As can be seen from Figure 2, there are some relatively minor changes in planned expenditures between 2009 and 2013. The intention to spend less than the previous year is increasing somewhat, while intentions to spend the same amount or more are somewhat decreasing. A more quantitative question was posed to vacationers with the intention to spend less than the previous year. Figure 3 shows these amounts.
In Figure 3, for heavy (>25%) economizers upward and downward values alternate between 2009 and 2013, but overall differences are small.
The development over time of holiday demand (planned vacations) is shown in Figure 4.
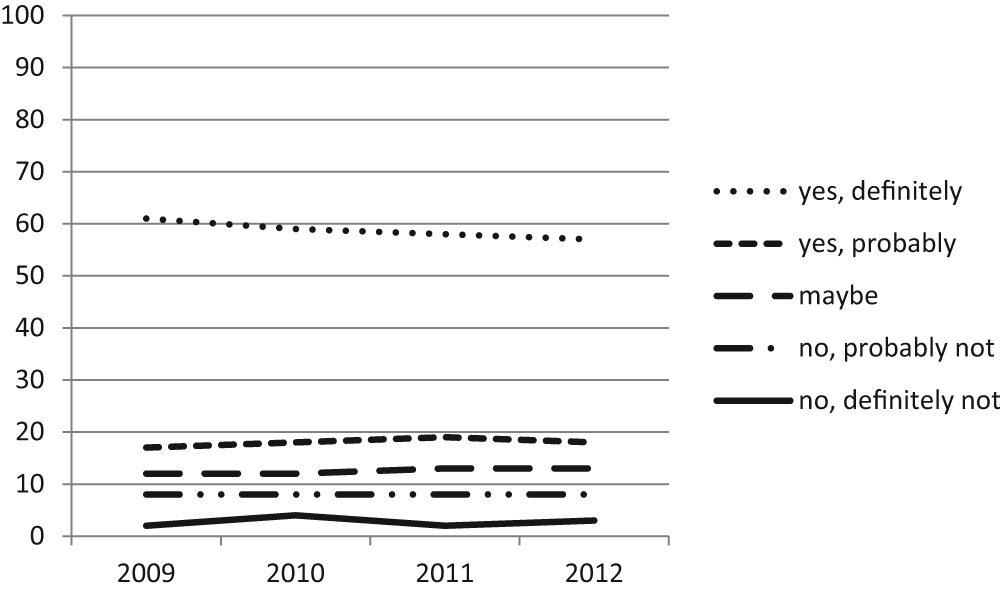
Holiday plans of individual vacationers between 2009 and 2013.
Figure 4 shows that Dutch vacationers are remarkably crisis resistant in terms of their holiday expenditures as well as their holiday demand. Only some minor changes occur in expenditures between 2009 and 2013. This conclusion is also supported by data collected by the official governmental bureau of statistics of the Netherlands (CBS 2014), which show that expenditures per individual vacationer vary between the lowest value of €205 in 2008 and the highest value of €219 in 2012. When combining the data in Figures 2, 3, and 4, it appears that economizing during an economic downturn occurs mainly on certain aspects of a holiday, as demand hardly changes while expenditures decrease marginally given the total amount spent on holidays by Dutch vacationers. Bronner and de Hoog (2012) observed the same pattern and called it “economizing by cheese-slicing” instead of “economizing by pruning,” that is, giving up holidays altogether.
However, one could argue that prices decline in times of severe economic downturns and not just expenditures as destinations become more competitive and tour operators offer heavily discounted products. This development could mitigate the effect of the crisis for vacationers. This could either lead to having the same vacation for less money or a “better” vacation for the same amount of money. Which one predominates cannot be established based on the data collected here. However it turns out that the total amount of money spent by vacationers in the Netherlands hardly changes between 2009 and 2013, making the first possibility unlikely. Furthermore, Bronner and de Hoog (2011) found that “the top ranking attributes on which vacationers economized in 2009 are shorter length of stay, changing the destination, spending less on activities on the spot and choosing another type of accommodation” (p. 190). At the bottom of the list are a cheaper alternative within the same type of accommodation and choosing a cheaper tour operator. Taken together, these findings indicate that the price offer effect is not the major factor in the (non)-economizing decision process. Comparing this behavior with the development of the economic key indicators, the conclusion is warranted that the Dutch vacationers are remarkably crisis resistant in terms of their holiday expenditures as well as their holiday demand.
Research Question 2
For this research question, 13 different products were compared on their economizing priority using the method detailed in the section Research Design. This resulted in the categorization of the products into three groups:
High economizing priority: product is part of the first three products selected
Low economizing priority: product is part of the last three products selected
Intermediate economizing priority: product is not selected as first or last economizing priority
The data presented in Table 1 uses these three categories and shows the economizing priority and the calculated balance score for each product, as well as their hypothesized location in Figure 1.
Economizing Priority for Different Products in % of the Sample (Ordered Following the Highest Priority for Economizing in the Balance Score Column (n = 5,454 for Each Row).
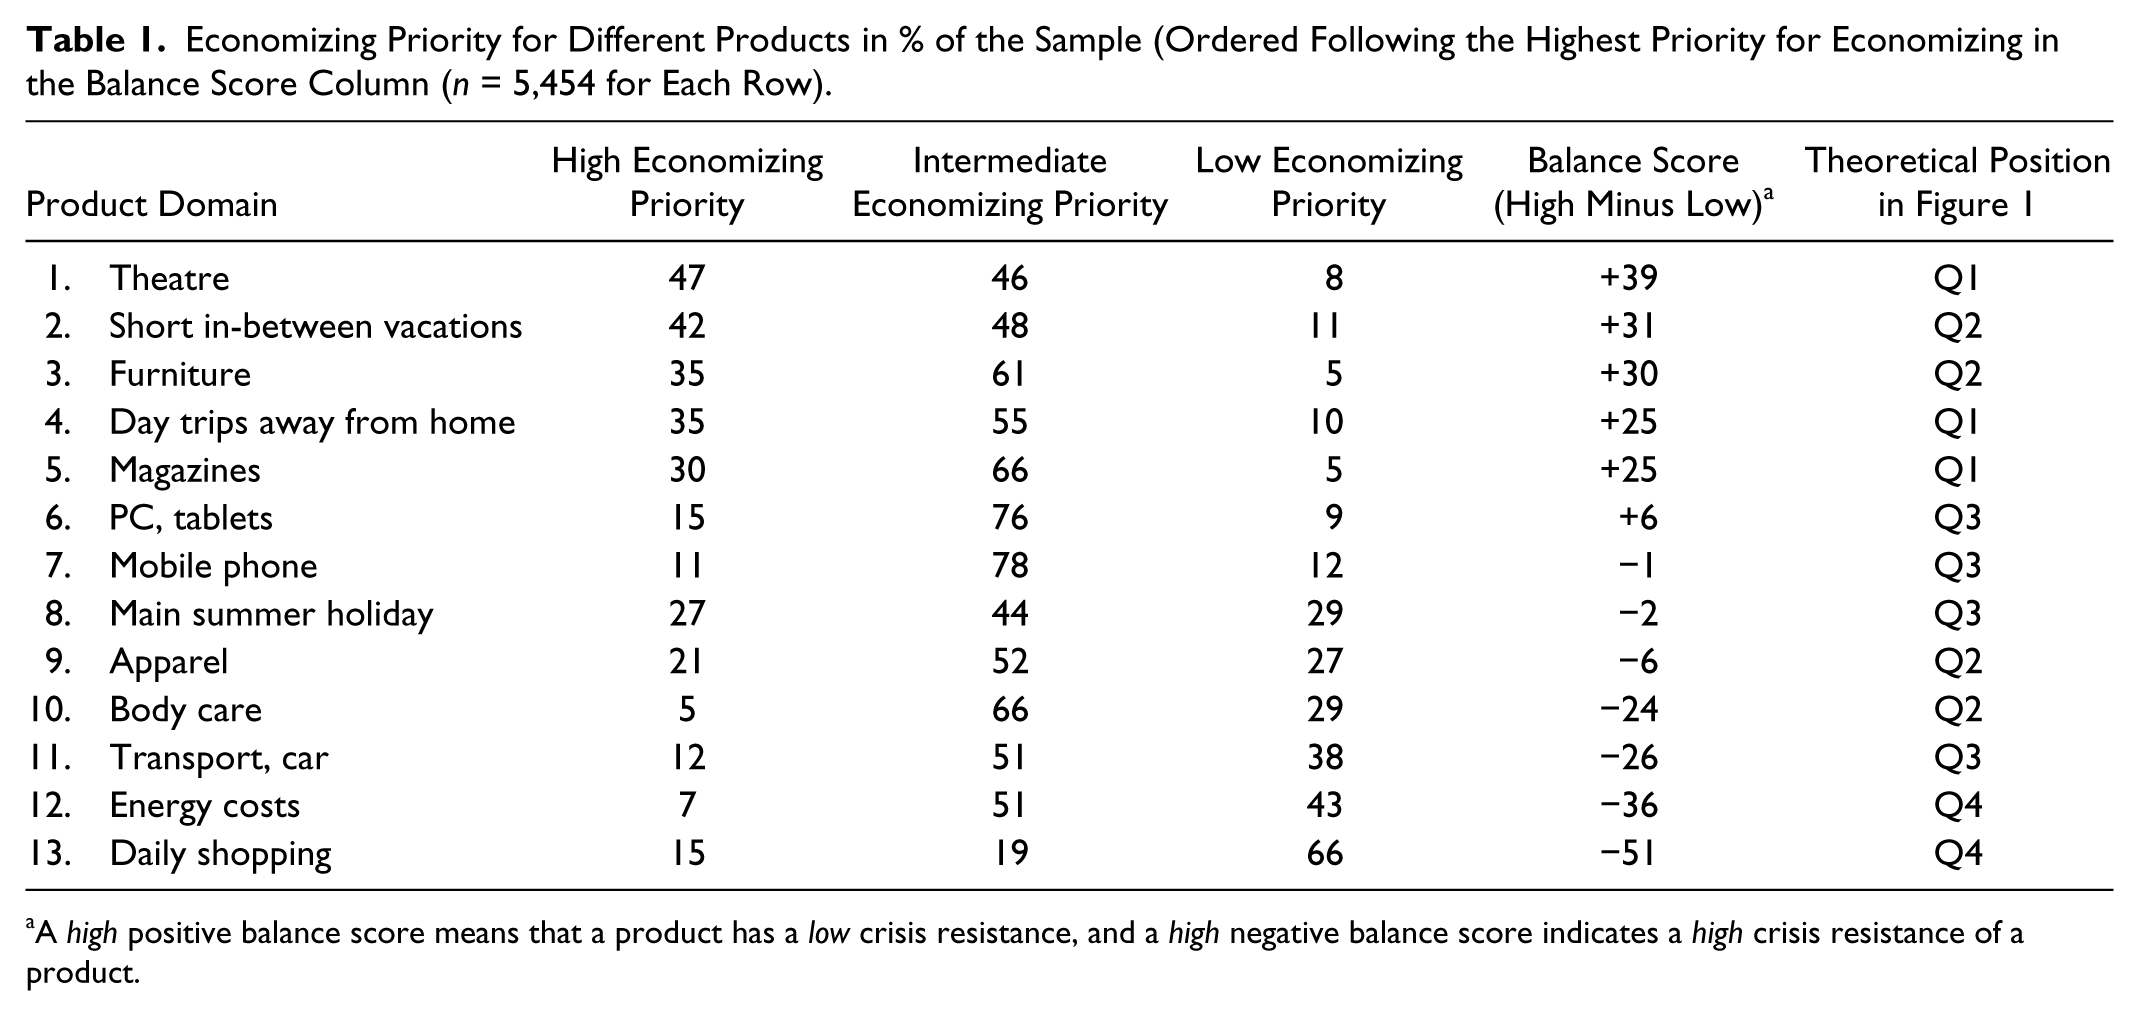
A high positive balance score means that a product has a low crisis resistance, and a high negative balance score indicates a high crisis resistance of a product.
Comparing the results in Table 1 with Figure 1, it can be concluded that the positioning of some products in Figure 1, which is based on the literature, is not always in line with our findings. Clearly, the data show that contrary to our hypothesis, the quadrant with the lowest economizing priority is the lower right-hand quadrant, Q4 instead of the expected Q3. Both left-hand quadrants Q1 and Q2 fit the data. Probably the partial rejection of the hypothesis is due to the fact that the essentiality dimension weighs more heavily than the visibility dimension.
Concerning research question 2, it can be concluded that short in-between vacations and day trips away from home are likely candidates for economizing on, while the main summer holiday is a less likely candidate. When looking at the position of the main summer holiday in the fourth column of Table 1, it is positioned closer to the necessities of life (energy, daily transport) than to the more luxury goods (theatre, furniture, magazines).
The data in Table 1 do not show what the economizing priorities between pairs of product categories are, since a pairwise comparison between all products was not feasible, given the number of products and the resulting respondent burden. However, as a kind of proxy, the correlations between all pairs of products have been computed. Given the sample size of more than 5,000 respondents, we decided to lower the significance threshold from the usual .05 to .001 (two-sided). The main summer holiday has a very specific position, as economizing on this holiday has a significant negative rank-order correlation with economizing on energy (–.08, p < .001), furniture (–.07, p < .001), PC (–.05, p < .001), apparel (–.06, p < .001), daily shopping (–.09, p < .001), body care (–.08, p < .001), and magazines (–.08, p < .001). The relationships with theatre, mobile phone, and transport are not significant. This implies that there is some evidence that in order to be able to go on holidays, people are prepared to economize on a wide range of other products, once more an indication that tourist demand is crisis-resistant at the expense of other goods.
Research Question 3
As was detailed in the Research Design section, six items are used in the questionnaire to measure the drivers that could influence the crisis resistance of tourist demand based on the essentiality dimension used in Figure 1. To determine the relative importance of these drivers for tourist demand, the following procedure is used:
For each driver, a segment is created comprising respondents who (fully) agree with the statement representing this driver.
For each created segment, the same balance score as in Table 1 is calculated, which means percentage high economizing priority minus percentage low economizing priority).
This is carried out for the three types of holidays.
The balance score captures the relationship between the used psychographics and a near behavioral indicator.
Table 2 gives the results for the main summer holiday and shows that vacationers who are loss-averse as regards a holiday, or highly value the importance of holidays for their well-being, are least inclined to economize on the main summer holiday. On the other hand, vacationers who might sacrifice savings or postpone cutting expenditures for the time being have the highest inclination to economize on the main summer holiday. For the other two types of holidays, the six balance scores are positive, indicating a lower crisis resistance. For both, the balance scores do not differ, with day trips away from home ranging between +24 and +26 and short in-between vacations ranging between +15 and +20. This shows that the effect of the six drivers of essentiality bears mainly on the crisis resistance of the main summer holiday.
Relationship between Drivers of Crisis Resistance and Vacation Economizing Priority.
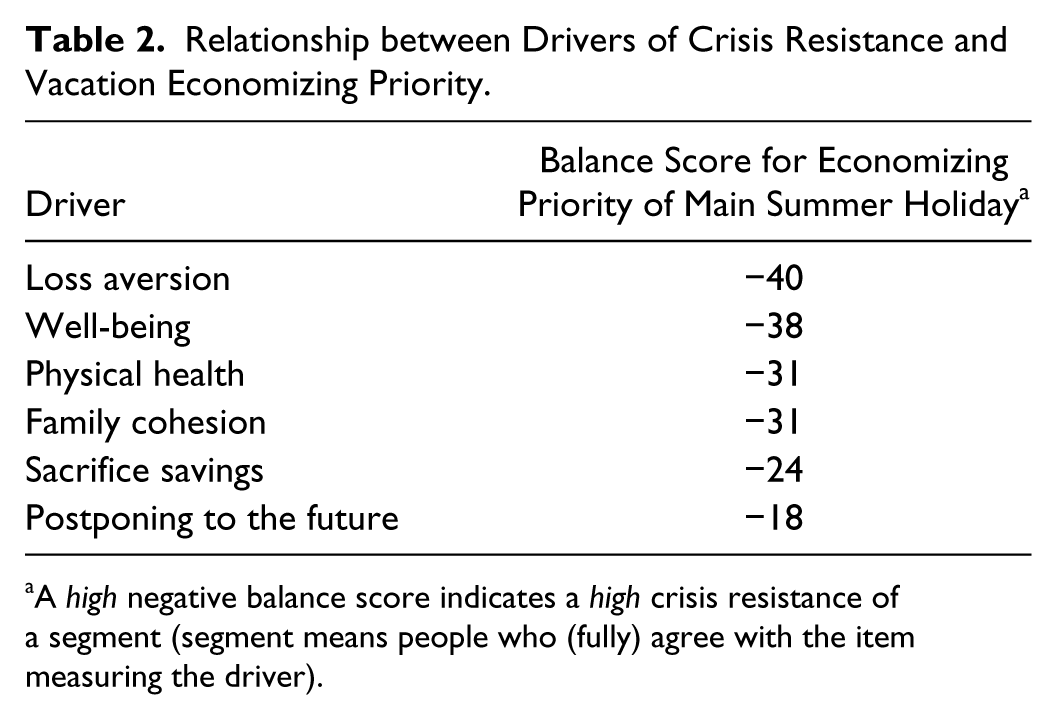
A high negative balance score indicates a high crisis resistance of a segment (segment means people who (fully) agree with the item measuring the driver).
Research Question 4
The analysis for research question 4 requires measurements of income, sociodemographics, QOL, and individual economic income effects and expectations. Apart from QOL, the variables are included in the questionnaire (see Research Design section). The relative contribution of these variables to crisis resistance is calculated by means of a regression analysis. For QOL, the 6 drivers of crisis resistance can be used, although it should be tested if they do not exhibit collinearity. We carried out a factor analysis on the six items using a Varimax rotated solution. Results are shown in Table 3.
Factor Analysis of Items Measuring Benefits of a Vacation.
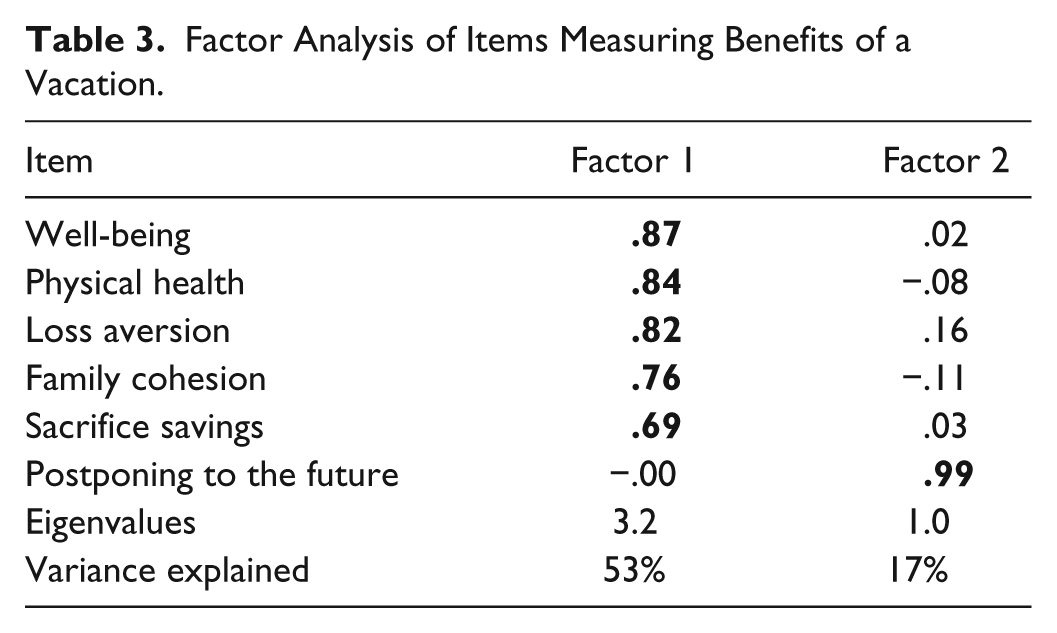
It can be seen from Table 3 that five items load high on the first factor while the “Postponing to the future” item is the only one that loads high on the second factor. This indicates that the first factor is a single variable that can be described as measuring the contribution of a holiday to a person’s QOL in a broad sense, including willingness to sacrifice savings for it. Additionally, these five items have a Cronbach alpha of .86. As the second factor contains only one item and has an eigenvalue near to 1, and does not explain much variance, we decided to take only factor 1 into account under the acronym QOL when comparatively investigating different types of variables that can influence the crisis resistance of tourist demand. In order to do this, we took the respondents’ factor scores on the first factor and categorized them into three equal groups: the highest factor scores are seen as indicating that holidays make a high contribution to QOL, the medium score showing an intermediate contribution to QOL, and the lowest scores as making the lowest contribution to QOL.
To investigate research question 4, a set of regression analyses is carried out, with three different models for the three types of holidays, with economizing priority as the dependent variable. Economizing priority with regard to a type of holiday is 1 when it belongs to the first three product categories one will economize on, 3 when it belongs to the last three, and 2 if it belongs neither to the first nor to the last category.
The following models are applied:
Model 1: sociodemographic variables
Model 2: sociodemographic variables + personal economic situation
Model 3: sociodemographic variables + personal economic situation + psychographic (QOL)
The method used is stepwise regression, with an enforced order of entering the variables in the equations.
This analysis will be performed for the three types of holidays: the main summer holidays (Table 4), short in-between vacations (Table 5), and day trips away from home (results not in a table). The results are compared in Table 6.
Summary of Linear Regression and Variance Explained in Economizing Priority of the Main Summer Holiday. a
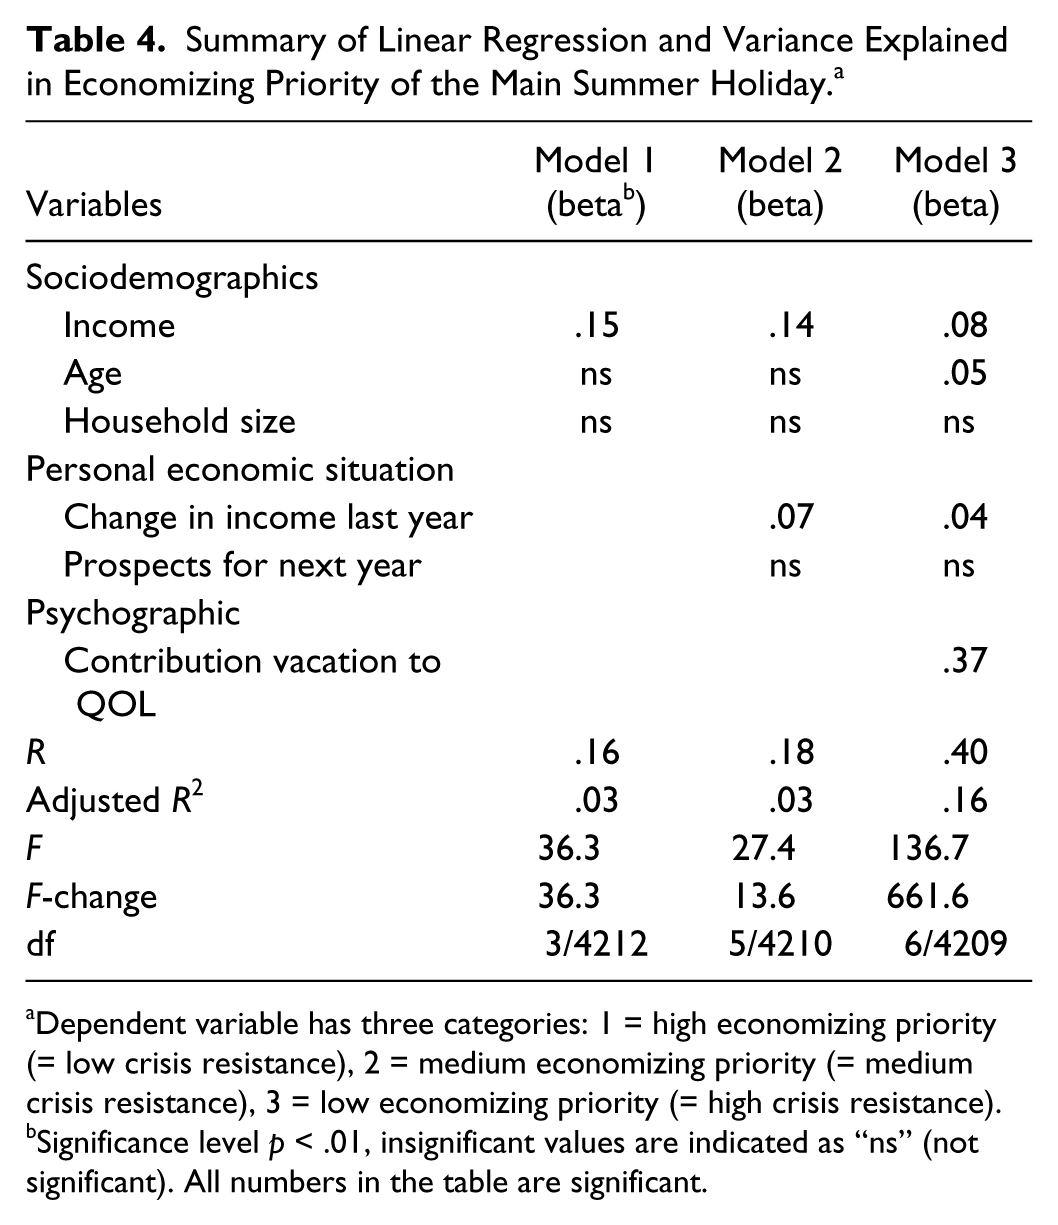
Dependent variable has three categories: 1 = high economizing priority (= low crisis resistance), 2 = medium economizing priority (= medium crisis resistance), 3 = low economizing priority (= high crisis resistance).
Significance level p < .01, insignificant values are indicated as “ns” (not significant). All numbers in the table are significant.
Summary of Linear Regression and Variance Explained in Economizing Priority of Short In-Between Vacations.

Dependent variable has three categories: 1 = high economizing priority (= low crisis resistance), 2 = medium economizing priority (= medium crisis resistance), 3 = low economizing priority (= high crisis resistance).
Significance level p < .01, insignificant values are indicated as “ns” (not significant). All numbers in the table are significant.
Comparison of Variance Explained of Three Types of Holidays.
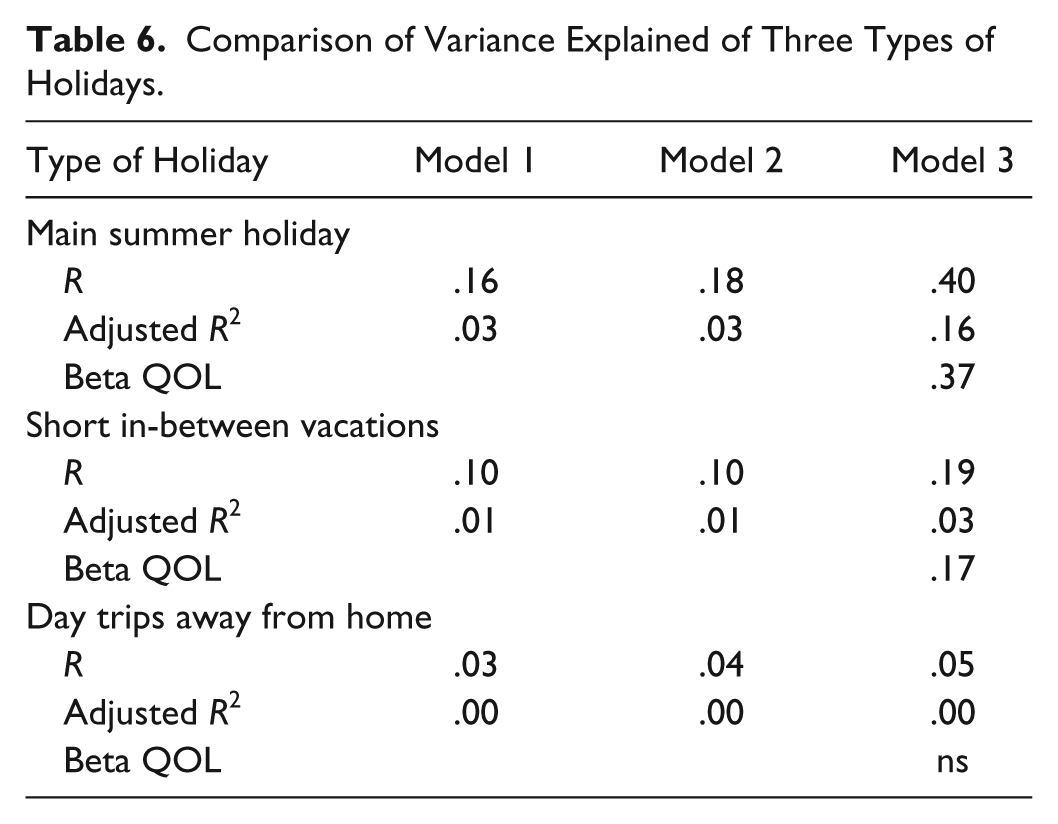
From Table 4, it can be concluded that the crisis resistance for the main summer holiday is mainly explained by the QOL variable, with income as a minor secondary factor. The other variables play no role.
For Table 5, the conclusion is almost the same as for Table 4, with a less strong effect of QOL and no effect for Income.
As regards daytrips from home, the analysis yielded no significant differences for the three models investigated, so results are not presented in a table.
Table 6 summarizes the results for research question 4.
To answer research question 4, the perceived contribution of a vacation to the QOL is the main driver of the crisis resistance of tourist demand, but mainly for the main summer holiday and to a lesser extent for short in-between trips. This relationship is absent for day trips away from home. The personal economic situation, such as a change in income during the previous year, has no significant relationship with vacationers’ economizing priorities.
Summary
Research question 1. Dutch vacationers are remarkably crisis-resistant in terms of their holiday expenditures as well as their holiday demand. There are only some relatively minor changes in expenditures between 2009 and 2013. The tendency to spend less than in the previous year is increasing somewhat, while the tendency to spend the same amount or more is decreasing somewhat. The longitudinal data set shows that economizing on holidays is increasing slightly over time, but this economizing is mainly on certain aspects of a holiday, indicating a “cheese-slicing” strategy instead of a “pruning” strategy.
Research question 2. It is concluded that short in-between vacations and day trips away from home are likely candidates for economizing on, while the main summer holiday is a less likely candidate. When looking at the position of the main summer holiday, we see that it is positioned closer to the necessities of life (energy, daily transport) than to luxury goods (theatre, magazines, furniture). Taking all products into consideration, it seems that the essentiality dimension is more important for determining relative demand, as measured by economizing priority, than is the visibility dimension, but both dimensions play a role. There is some evidence that in order to be able to go on holidays, people are prepared to economize on a wide range of other products; once more an indication that tourist demand is crisis-resistant at the expense of other goods.
Research question 3. The data show that people who are loss-averse as regards a holiday, or highly value the importance of holidays for their well-being, are least inclined to economize on a holiday. On the other hand, vacationers who might sacrifice savings or postpone cutting expenditures for the time being are the ones most inclined to economize on a holiday.
Research question 4. The perceived contribution of a vacation to the QOL is the main driver of the crisis resistance of tourist demand with a minor role for income, but mainly for the main summer holiday and to a lesser extent for short in-between trips. This relationship is absent for day trips away from home. The personal economic situation, such as a change in income during the previous year and individual economic prospects, have no significant relationship with vacationers’ economizing priorities.
Implications
Theoretical Implications
Not much research was carried out on how vacations are positioned among other consumer goods with the exception of the study by Crouch et al. (2007). Comparing our results with theirs, while taking into account the fact that their research focused on spending an extra amount of money, the most striking difference is the minor effect we found of income and age on economizing decisions concerning the main summer holiday. Crouch et al. (2007) found a very strong effect for these two variables. The absence of this effect in our study and the major role played by the QOL variable could indicate that QOL is maybe more important for economizing decisions during adverse economic conditions than for decisions about spending an extra amount of money that becomes available only once. The latter appear to be more influenced by age and income.
Looking back at papers published in 2010 as a sequel to the Academy for the Study of Tourism 20th anniversary conference in Mallorca, Spain, in June 2009 when the shape of the duration and depth of the crisis was still unknown (Papatheodorou, Rossello, and Xiao 2010; Smeral 2010), it is interesting to compare some of the predictions made in those papers with our findings. Papatheodorou, Rossello, and Xiao (2010) predicted that “in the short to medium term, it is almost certain that an important group of travelers will opt for a reduction in their travel expenditure” (p. 44) and also, “Europe will be one of the regions to experience a more serious drop in tourist demand than other places, with crisis expanding to 2010” (p. 44). Smeral (2010) stated that “in contrast to former economic downturns, the current crisis has a global and all-encompassing impact that has hit tourism services (a non-necessary consumer good) with particular force” (p. 31). Contrary to these predictions, we found for the Netherlands—which was hit by double economic dip between 2008 and 2013—a hardly changing demand for holidays while the expenditures decreased marginally given the total amount spent on holidays by Dutch vacationers. Clearly the Dutch vacationers were remarkably crisis resistant during this period. Though our study is limited to Dutch vacationers, data collected by Eurostat (Eurostat 2012) show that between 2008 and 2011, more or less at the height of the economic crisis, the number of holiday trips (staying away from home for more than four consecutive nights in a paid accommodation) by residents of the 27 EU countries remained stable while the number of business trips fell by 11%. An explanation for this finding can be found in the fact that currently holidays, in particular the main summer holiday, can be positioned closer to being a necessary good than to being a luxury good during an economic crisis. This finding is contrary to studies in the nineties (Melenberg and van Soest 1996), when tourism was a luxury good for households. A change seems to have occurred as regards the necessity of a holiday. Many vacationers are prepared to sacrifice expenditures on a variety of products just so as to keep on going on holiday. Based on the literature, we found several explanations for this shift toward necessity. The major explanation can be found in the high visibility and high essentiality of a holiday, and within essentiality the order of importance of the drivers of crisis resistance of tourist demand is (1) loss aversion, (2) well-being, (3) physical health, (4) family cohesion, (5) sacrifice of savings, (6) postponing to the future. Together, the first five of these drivers turned out to be a single factor or variable measuring the contribution of a vacation to one’s QOL. Empirically, this turned out to be the most determining factor for explaining crisis resistance.
The importance of vacations for individual and family QOL is also evidenced by the possibility for disadvantaged low-income families to obtain financial means from a UK-wide charity to go on holidays (McCabe, Joldersma, and Li 2010; McCabe and Johnson 2012). Furthermore, research by Pagán (Pagán 2013, 2014) shows that disabled people who participate in holiday trips obtain higher levels of satisfaction with health, job, and housework than do nondisabled ones. The longitudinal study by Chen, Lehto, and Cai (2013) provides a caveat: long-term beneficial effects of vacations on general well-being factors were mostly absent; however, short-term beneficial effects on occasion-specific well-being factors were substantial. It should be noted that the studies mentioned above address effects of vacations on QOL, while our study investigates the motivating role of QOL when people must choose between economizing options. Though effects and motivations are clearly related, generalizations across them should not be made too easily.
Finally, the influence of income and personal economic situation on tourist demand at the micro-level is relatively minor or nonexistent, and these are certainly not the only variables influencing tourist participation, though they evidently determine the amount of money a consumer can spend on a holiday. People with a higher income will probably stay in an expensive hotel, while people with a lower income will probably stay in cheaper hotels. Though they will spend different amounts of money, for both income categories a holiday has a high priority among other consumer goods, because of the contribution that holidays make to their QOL. This leads to their crisis resistance during a lasting economic downturn, with a kind of “cheese-slicing” strategy being used at most.
Practical Implications
Based on the empirical findings and supported by recent literature, practical implications for the tourism industry can be sketched out. A major factor driving the crisis resistance of vacationers is QOL, which is more comprehensive than the concept “wellness” as it currently figures in marketing messages. This broader concept of QOL clearly has managerial implications. To maximize tourist satisfaction, Sirgy (2010) suggests two ways. Tourism marketers can (1) segment the market based on tourist goals and (2) develop interactive computer programs that as a first step aid tourists in selecting their leisure travel goals and, as a second step, aid in the selection of destinations and services based on these leisure travel goals. This idea of travel goals fits in with the ideas of Gilbert and Abdullah (2004), who state “that people travel because they have been motivated by some felt needs, which are psychological in nature and can only be satisfied by tourism activity” (p. 117). Furthermore, we agree with the practical implications Dolnicar, Yanamandram, and Cliff (2012) sketch out in relation to vacations and QOL: “These results provide an argument beyond tourism’s contribution to national revenue and wealth generation, namely that tourism has a positive impact on people’s QOL. The findings can also be used in tourism marketing by emphasizing that vacations are not only fun, they are also good for one’s QOL” (p. 74).
The visibility of holidays is generated by travelers describing expectations before, experiences during, and stories after a vacation. The increasing use of social media greatly increases the participation in and the reach of these messages. This ties in with classical ideas about conspicuous consumption. For the tourism industry, the implication is that tour operators should help tourists in creating appealing and impressive stories about their holiday and stress the uniqueness of experiences you can’t miss, experiences that are not necessarily related to the standard attributes used in review sites. In summary, they should help in story-telling in such a way that the observation by others is optimized and the visibility is increased.
Another explanation for crisis resistance is the role of a vacation in family cohesion. The tourism industry can stress this family function by offering facilities that you can use together as a family. Brochures and advertising relating to the possibilities of performing activities together as a family need more attention. Durko and Petrick (2013) suggest more attention in marketing on “multigenerational” travel opportunities, with grandparents traveling with their families.
In closing, our findings show that explanations for crisis resistance do not cover all types of holidays. Clearly, the influence of QOL is most pronounced in relation to the main summer holiday, and to a lesser extent in relation to short in-between vacations. So the marketing messages need some tailoring to fit these different types of vacation.
It can be concluded that our findings have theoretical and practical consequences: theoretical because there are more issues in play than income alone and practical because the factors explaining crisis resistance have serious consequences for tourism marketing.
Future Research
The investigation of the crisis resistance of tourist demand can be extended by including several options. First, data for other countries can be collected. By varying the severity of the economic crisis or the shape of the key economic indicators, more insight can be gained into how vacationers can react to different economic conditions. This is of particular interest as regards the role of the QOL in determining these reactions. A second option is to measure not only short-term effects but also long-term ones, with particular reference to the relationship between vacations and (physical) health. Third, the question remains open as to whether vacation demand and expenditures are influenced in a different way by a downturn than by an upturn in the economic cycle. When the economy recovers, one can test the hypothesis that a vacation is a special type of good: a luxury one when disposable income increases but a necessary one as disposable income decreases. The last option is to measure the role of family cohesion for economizing priorities by interviewing entire families.
Footnotes
Acknowledgements
The authors would like to thank NBTC-NIPO Research for funding the fieldwork for this study. For their stimulating comments, we thank Ad Schalekamp and Bianca Hopman (TNS-NIPO).
Author Note
An SPSS file containing the data is available from the authors.
Declaration of Conflicting Interests
The author(s) declared no potential conflicts of interest with respect to the research, authorship, and/or publication of this article.
Funding
The author(s) received no financial support for the research, authorship, and/or publication of this article.