
Abstract
Most tourists love to share their holiday experiences with family, friends, and, increasingly, strangers, using the Internet. Such word-of-mouth represents a highly influential information source for potential tourists and is therefore of great interest to tourism marketing managers. This study aims to understand patterns among tourists when sharing holiday experiences, both in terms of the communication channel they use and the kind of content they share. The findings contribute to a theoretical understanding of word-of-mouth behavior by empirically showing that word-of-mouth is not a homogeneous activity. Rather, results show that distinct segments of word-of-mouth behavior exist. Segments differ with regard to content shared (visual/verbal) and channel used (offline/online). Two out of the five segments use only offline channels to share their experiences, and the extent of visual content shared varies across segments. The article illustrates how these findings could be translated into proactive marketing action aimed at instigating word-of-mouth behavior.
Keywords
Introduction
The influence of word-of-mouth has been studied extensively in consumer decision making. This body of work is characterized by a number of assumptions: (1) that word-of mouth is a homogenous activity; (2) that electronic word-of-mouth is more influential than traditional word-of-mouth; and (3) that word-of-mouth is predominantly verbal, not visual. This article challenges these three assumptions. The following research questions are investigated:
Research question 1: Is tourist word-of-mouth a homogeneous activity, or do different tourists use different approaches when sharing their vacation experiences?
Research question 2: Do tourists use both electronic and traditional word-of-mouth to communicate their experiences or does one form dominate?
Research question 3: Do tourists use both verbal and visual word-of-mouth to communicate their experiences, or does one form dominate?
To answer these three research questions, an analysis of heterogeneity of word-of-mouth patterns was conducted using information provided by Australian tourists about how they shared their holiday experiences. Findings from this study contribute to theory by challenging current assumptions about word-of-mouth. This has implications not only for future research, but also for tourism marketing managers, who may benefit from considering a larger set of marketing activities to stimulate word-of-mouth than relying primarily on social media.
Literature Review
Word-of-mouth is defined as “informal communication between private parties concerning evaluations of goods and services” (Anderson 1998, p. 6). Word-of-mouth happens in the context of a specific situation (Allsop, Bassett, and Hoskins 2007) and may contain both cognitive and emotive elements (Sweeney, Soutar, and Mazzarol 2012). It is sought by consumers who have not experienced a product or service because it is seen to be credible and trustworthy coming from an experienced personal source (Allsop, Bassett, and Hoskins 2007). Hence, word-of-mouth is of special importance for services (Murray 1991). It has been shown to be the information source most frequently used by tourists (e.g., Andereck and Caldwell 1994; Bieger and Laesser 2004; Day, Cai, and Murphy 2012; Gitelson and Crompton 1983; Murphy, Moscardo, and Benckendorff 2007) and is therefore of critical importance to tourism destinations and businesses.
Yet, despite its role in influencing purchase decisions (Arndt 1967; Whyte 1954), word-of-mouth has its limitations. Most critically for the tourism industry, word-of-mouth is difficult to influence or control (Allsop, Bassett, and Hoskins 2007). It is therefore important to develop a good understanding of the nature of word-of-mouth behavior. Such understanding forms the basis of the tourism industry’s ability to stimulate or reinforce desirable word-of-mouth.
The Assumption of Word-of-Mouth as a Homogeneous Activity
Word-of-mouth has mostly been studied as an information source for tourists, rather than from the perspective of the communicator of the holiday experience. Several studies have investigated segments based on the use of different information sources in the context of holiday planning and decision making (e.g., Bieger and Laesser 2004; Fodness and Murray 1997; Hsieh and O’Leary 1994; Murphy, Moscardo, and Benckendorff 2007). These studies identify segments with varying degrees of importance of word-of-mouth and other information sources. However, all these studies treat word-of-mouth as one homogeneous activity. Murphy, Moscardo, and Benckendorff (2007) consider heterogeneity to some extent by differentiating between different sources of word-of-mouth (friends and relatives vs. other travelers), but do not investigate differences in the approaches used by communicators.
To date, only a few studies have investigated word-of-mouth behavior from the communicator’s perspective. In a study on the trustworthiness of different online information sources, Munar and Jacobsen (2013) report descriptive results regarding intentions to share digitized content after returning from vacation. Munar and Jacobsen found that tourists exhibit different levels of intentions to use certain types of media (Facebook, blogs, Twitter, online reviews, emails/sms/mms) to share such content. Sending emails or text/multimedia messages are reported as the most popular. While Munar and Jacobsen show that the popularity of various digital communication channels varies, they did not investigate combinations of media used or the type of content that is shared.
Bronner and de Hoog’s (2011) findings show that the motivations to post influence: the type of website where an online review is posted, the number of aspects addressed, the valence of the review, and, to a lesser extent, whether or not pictures are used. While Bronner and de Hoog identify a source for differences in some aspects of the content, they investigated only one specific electronic word-of-mouth activity (posting a review online). Lo et al. (2011) investigated a different single electronic word-of-mouth activity (sharing photographs online) and identify different segments of sharers based on the types of media they used.
These studies provide valuable insights into how creators of word-of-mouth can differ, but no study deals with the heterogeneity in word-of-mouth activity resulting from a combination of traditional and electronic word-of-mouth and the mixture of visual and verbal content.
The Assumption That Electronic Word-of-Mouth Dominates
Electronic word-of-mouth is defined as “all informal communications directed at consumers through Internet-based technology related to the usage or characteristics of particular goods and services, or their sellers” (Litvin, Goldsmith, and Pan 2008, p. 461). Electronic resources such as email, the Internet, mobile phones, instant messaging, and blogs have made sharing information and opinions easier than ever (Allsop, Bassett, and Hoskins 2007). Electronic word-of-mouth advances traditional word-of-mouth in several ways: (1) the line of communication is expanded to one-to-many, one-to-one, or many-to-many (Litvin, Goldsmith, and Pan 2008). This (2) escalates the audience of both positive and negative electronic word-of-mouth because it becomes accessible globally (Chan and Guillet 2011; Ip, Lee, and Law 2012) and (3) allows sharing between strangers while traditionally word-of-mouth refers to opinions from friends and family. (4) Electronic word-of-mouth can be spread over a variety of channels, some of which allow anonymity (Benckendorff, Sheldon, and Fesenmaier 2014). Furthermore, communicating online (5) has overcome the perishability of traditional word-of-mouth because it can be collected and preserved (Goldsmith 2006).
These advantages of electronic word-of-mouth have led to an increase in the importance of electronic word-of-mouth compared to traditional word-of-mouth (Goldsmith 2006; Litvin, Goldsmith, and Pan 2008; Sun et al. 2006). Additionally, Gretzel and Yoo (2008) have shown the influence of electronic word-of-mouth on purchase decisions. However, some advantages of electronic word-of-mouth are also perceived as disadvantages by others. While credibility is regularly attributed to electronic word-of-mouth (Bickart and Schindler 2001; Bronner and de Hoog 2010), others argue that online word-of-mouth may be perceived as untrustworthy or inaccurate because it is created by strangers whose credibility may not be easily established (Tham, Croy, and Mair 2013). In an investigation of the different dimensions of trustworthiness for online channels, Dickinger (2011) shows that tourists doubt the ability of users who generate electronic word-of-mouth to provide high-quality information. The differences between traditional and electronic word-of-mouth, especially with regards to credibility, led Tham, Croy, and Mair (2013) to conclude that traditional word-of-mouth is still important. Tan and Tang’s (2013) findings also show that one cannot generally conclude that either traditional or electronic word-of-mouth is more important.
Consequently, while the emergence of and increase in electronic word-of-mouth has to be acknowledged, investigating traditional and electronic word-of-mouth simultaneously seems to represent a more complete picture of total word-of-mouth behavior.
The Assumption That Word-of-Mouth Is Predominantly Verbal
The focus on verbal content in traditional word-of-mouth, where “communication” is the central element in the definition (Anderson 1998; Fitzgerald Bone 1992; Westbrook 1987), has been carried over to electronic word-of-mouth, where the verbal aspect also dominates (Goldsmith 2006; Hennig-Thurau et al. 2004; Litvin, Goldsmith, and Pan 2008; Sun et al. 2006). Consequently, a substantial amount of tourism-related research has been conducted on text-driven blogs (e.g., Pan, MacLaurin, and Crotts 2007; Zehrer, Crotts, and Magnini 2011) and online reviews (e.g., Gretzel and Yoo 2008; Sparks and Browning 2011; Vermeulen and Seegers 2009). Despite the dominance of visual experiences in tourism (Feighey 2003), in the context of word-of-mouth, researchers have turned their attention to the visual representation of a travel experience only recently (e.g., Lo et al. 2011; Stepchenkova and Zhan 2013).
The only study that explicitly focuses on the importance of the combination of visual and verbal content in tourism-related word-of-mouth is by Lee and Tussyadiah (2011). Based on the “dual-coding theory” (Paivio 1990), they argue that both visual (e.g., photographs) and verbal means (e.g., written and spoken language) constitute a tourist’s mental representation of a destination. Lee and Tussyadiah found that in the context of an online travel community, the combination of text and photo is perceived as the most influential source of information, and is also the combination of content most frequently contributed to the online travel community. However, Bronner and de Hoog (2011) show that not everyone contributes both types of information in the context of posting reviews.
In line with Lee and Tussyadiah (2011), this study focuses on the use of both visual and verbal content in word-of-mouth; an area that has not yet been extensively studied.
Methodology
Data
Survey data were collected from 1003 adult Australian residents using an Australian research-only online panel company that recruits respondents both online and through traditional avenues such as mail and intercepts. Respondents were paid a small amount of money as compensation for their efforts. Although well-maintained online panels have been shown to lead to equally representative samples (Dolnicar, Laesser, and Matus 2009), it is possible that online data collection in this particular study will lead to an overestimation of respondents who use electronic media to communicate about their holiday experiences. This is not problematic, however, because the primary aim of the study is to explore patterns of word-of-mouth behavior, not to correctly predict the segment size of people who display those patterns.
Respondents were asked how often they go on holiday and which travel information sources they normally use for making their decisions. Respondents were also asked to think of their last domestic holiday and indicate where they spent it, how far it was from home, how they got there, how long the holiday was, what the accommodation was, how much they spent, and which activities they engaged in (these comprised 45 activities used in the Domestic Visitor Survey conducted by Tourism Research Australia 2009). Respondents were then asked whether they communicated their holiday experiences and how. The items used to measure word-of-mouth behavior included practices relating to offline as well as online word-of-mouth, and represent the use of visual or verbal content. Respondents were first asked, “After your last holiday, did you share or communicate your experiences with any of the following people?” Then they were asked, “In which of the following ways did you communicate this information?” All word-of-mouth behavior items were binary. The binary format was selected because it was of interest in this study whether or not tourists engaged in certain behaviors, rather than the extent to which they did so. Furthermore, binary data is suitable for analysis with all available segmentation methods, whereas ordinal data, which would have resulted by asking a small number of frequency levels or levels of agreement, cannot easily be analyzed using clustering approaches because the distance between scale points is not defined (Kampen and Swyngedouw 2000). The specific items used as segmentation base are conversations, showing photos in person, updating a web journal or website, updating/posting a blog (online diary) or network tool (e.g., MySpace or Facebook), emailing photos, writing emails (no pictures), and sharing video footage. The frequencies for all items are shown in Table 1.
Frequency of Reported Word-of-Mouth Behaviors.
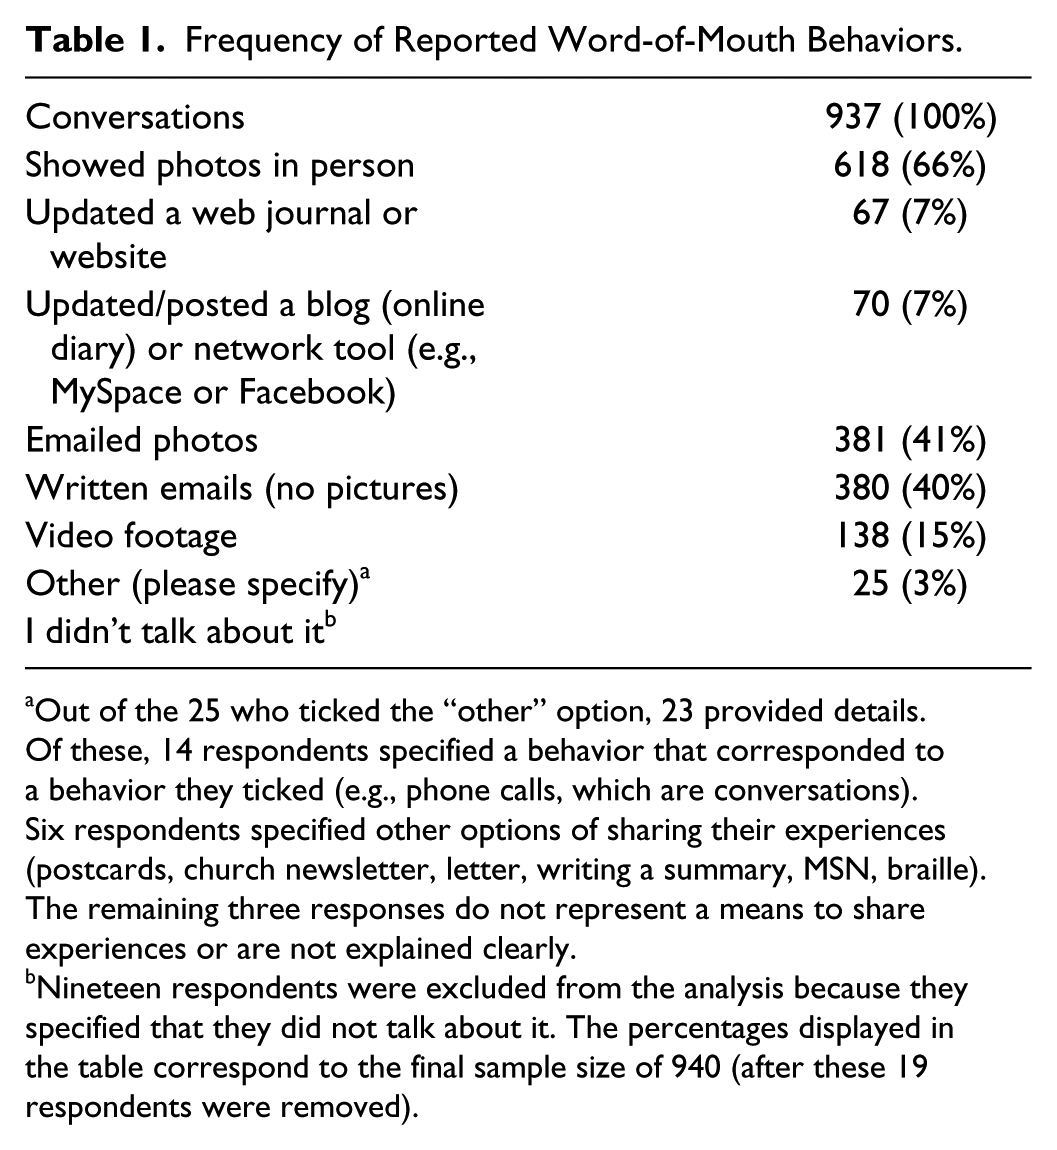
Out of the 25 who ticked the “other” option, 23 provided details. Of these, 14 respondents specified a behavior that corresponded to a behavior they ticked (e.g., phone calls, which are conversations). Six respondents specified other options of sharing their experiences (postcards, church newsletter, letter, writing a summary, MSN, braille). The remaining three responses do not represent a means to share experiences or are not explained clearly.
Nineteen respondents were excluded from the analysis because they specified that they did not talk about it. The percentages displayed in the table correspond to the final sample size of 940 (after these 19 respondents were removed).
Finally, respondents were asked to provide some information about their personal characteristics, including their age, gender, family status, household size, education level, income, and employment status.
Sample Description
Of the 1,003 respondents, 44 cases were deleted because of straight-lining or implausible answers. Nineteen respondents were excluded because they did not communicate or share their last holiday experience in any way. This resulted in a final sample size of 940 observations.
The sample consisted of 52 percent females and 48 percent males. Twenty-two percent were 29 or younger, 19 percent 30–39 years, 20 percent 40–49 years, 22 percent 50–59 years, 15 percent 60–69 years, and 2 percent 70 years or older. Compared to Australian census data (Australian Bureau of Statistics 2014), the current sample underrepresented the age group of 70 years and older by 10 percentage points, while slightly over-representing people aged 50–59 years and 60–69 years. Regarding state of residency, the numbers mirrored the distribution of the total Australian population (Australian Bureau of Statistics 2014), with the majority of respondents from New South Wales (30%), Victoria (26%), and Queensland (20%). Half of the respondents took a maximum of four domestic trips a year and the majority did not go on overseas holidays (56%).
Regarding their last holiday within Australia, almost all (94%) traveled independently, and 37 percent went on a weekend trip. Half traveled less than 550 kilometers to their chosen destination and the majority traveled by car—either their own (64%) or a rental (11%). Respondents mainly stayed in private properties (own or friends’, 25%), hotels or motels with a maximum of three stars (19%), four- or five-star hotels or resorts (16%), or in serviced apartments (11%). Traveling with their partner (67%) was the most popular option. Of these, 30% also traveled with their children.
A first examination of the segmentation variables (see Table 1) revealed that 937 of the 940 talked about their last holiday in conversations, making this variable non-informative for the cluster solution. Non-informative variables bear the risk of masking underlying structure (Milligan 1980; Steinley and Brusco 2008). Consequently, this variable was removed. However, 200 respondents (21%) shared their holiday experiences in conversations only, making it the most frequent single word-of-mouth pattern. This segment was extracted a priori using a commonsense approach (Dolnicar 2004) and named “offline verbalists”.
The remaining six variables showed mixed levels of adoption. Tourists most frequently reported showing photos (66%), emailing photos (41%), and writing emails without photos (40%). The other three options were used less frequently (sharing videos, 15%; updating web journals or websites, 7%; updating blogs or network tool, 7%). These six variables were used as the segmentation base for the remaining 740 respondents. A sample size of 740 is adequate for cluster analysis with six binary variables (Dolnicar et al. 2014).
Data Analysis
To identify patterns of reported word-of-mouth behavior, a data-driven approach was chosen because the structure of the sub-markets was not known a priori (Green 1977). The literature identifies stability as an important criterion for segment attractiveness (Dibb and Simkin 2008). Stability was used as a criterion for determining which number of clusters to choose for the analysis. Specifically, bootstrap samples of the original data set were used to calculate many segmentation solutions for numbers of clusters from 2-to-10. The stability of segmentation solutions within each of those numbers of clusters was then calculated (Dolnicar and Leisch 2010).This procedure can be applied using several algorithms. For this study, Martinetz and Schulten’s (1994) neural gas algorithm with Euclidean distance was used because this algorithm produces more stable results than k-means clustering (Ganglmair and Wooliscroft 2001). Neural gas is very similar to k-means. It only differs in two aspects: (1) neural gas adjusts the location of the cluster centroids after each case is assigned to a cluster, whereas for k-means centroid adjustment occurs only after all data points have been assigned to a cluster; (2) neural gas adjusts not only the closest centroid but also, with decreasing weights, the other neighboring centroids for each case, thus reducing the risk of getting stuck in a local optimum. The neural gas algorithm has been previously applied to classification research in tourism (Mazanec et al. 2010).
The stability analysis was undertaken in four steps: (1) calculation of cluster solutions for bootstrap samples; (2) predicting cluster memberships of original observations based on cluster solutions from bootstrap samples; (3) calculation of adjusted Rand indices (Hubert and Arabie 1985) to determine agreement between predictions; and (4) selection of optimal number of clusters based on adjusted Rand indices.
Calculation of Cluster Solutions for Bootstrap Samples
Fifty pairs of bootstrap samples were drawn from the data. Consider bootstrap samples A and B one such pair. The neural gas algorithm was used to compute cluster solutions for numbers of clusters ranging from 2 to 10 on bootstrap sample A. Every computation (i.e., for numbers of clusters from 2 to 10) was conducted five times, and only the best solution based on the smallest within-cluster sum of squares was retained. Then, the cluster centroids of these 2 to 10 clusters solutions were saved. The same was repeated for bootstrap sample B.
Predicting Cluster Membership of Original Observations
In the second step, these centroids were used to predict cluster membership for every observation in the original data set. First, the cluster centroids of bootstrap sample A were used to predict cluster membership by assigning every observation to the closest centroid. This was done for all 2 to 10 clusters solutions. Then, the predictions were repeated based on the cluster centroids of bootstrap sample B. The outcome of this step was a set of predictions for all 2-to-10 clusters solutions. One pair of predictions for every observation in the original data set was obtained for all numbers of clusters solutions (2-to-10). The first prediction was based on the solution from bootstrap sample A, while the second was based on the solution from bootstrap sample B. These pairs of predictions were the basis for the stability analysis.
Calculation of Adjusted Rand Indices
The third step formed the heart of the stability analysis. The Rand index was used to judge on the stability of the 2-to-10 clusters solutions (Rand 1971). The Rand index expresses agreements as a proportion of agreements and disagreements between two solutions. As an example, consider the predictions from the pair of bootstrap samples A and B for the two-cluster solution. For every pair of observations, it was determined (1) if the two observations were assigned to the same cluster based on the predictions from bootstrap sample A, or not; and (2) if they were assigned to the same cluster based on the predictions from bootstrap sample B, or not. Agreements are all pairs of observations either assigned to the same cluster in both (1) and (2), or not assigned to the same cluster in both (1) and (2). Disagreements are all pairs of observations that were either put into the same cluster in (1), but into different clusters in (2), or put into the same cluster in (2), but into different clusters in (1). An index value closer to one indicates a higher agreement between the two predictions based on A and B. Perfect agreement is represented by a Rand index of 1. Finally, the Rand index was adjusted for chance (adjusted Rand index by Hubert and Arabie 1985; for computation see also Steinley 2004). For the pair of bootstrap samples A and B, this computation of the adjusted Rand index was repeated for all numbers of cluster solutions (2-to-10), resulting in one adjusted Rand index for each of the 2-to-10 clusters solutions.
For the stability analyses, 50 such pairs of bootstrap samples were drawn. Consequently, for each of the 2-to-10 clusters solution, 50 adjusted Rand indices were obtained.
Selection of Optimal Number of Clusters
In the final step, these adjusted Rand indices were used to determine the optimal number of clusters. For each of the 2-to-10 clusters solutions, the distribution of the adjusted Rand indices was compared. The closer the average of the 50 adjusted Rand indices for a given number of clusters to one, the more stable the solution.
Figure 1 summarizes the results of the stability analysis. It shows the boxplots of the adjusted Rand indices (y axis) calculated from the 50 pairs of bootstrap samples for 2-to-10 clusters (x axis). The adjusted Rand index lies between 0 (no agreement between a pair of cluster solutions) and 1 (perfect agreement between a pair of cluster solutions). For every prespecified number of clusters (2-to-10), the shown boxplots provide guidance on the stability of the solution. A boxplot close to the top of the graph (i.e., 1) indicates a high agreement across bootstrap samples. The four-segment solution is the most stable and was therefore selected for further analysis.

Stability analysis results (boxplot of stability of 50 calculations for all numbers of clusters between 2 and 10; black horizontal line indicates the median, and 50% of the data is within the box).
After identifying the optimal number of clusters, the final cluster analysis was performed on the original data set. The best solution based on the smallest within-cluster sum of squares of five reruns of the algorithm was selected.
For a segmentation solution to be useful to marketers, the segments should be distinguishable with regards to background variables that allow marketers to identify the segments (Dibb and Simkin 2008). To differentiate between the segments based on background variables not included in the segmentation base, multinomial logistic regression was used. The aim of this analysis is not to draw causal conclusions about why word-of-mouth is communicated in a certain way. Rather, gaining a better understanding of the nature of the segments allows marketers to identify and access them, thus making them viable target segments for marketing activities aimed at stimulating word-of-mouth. General sociodemographics and travel-related behavior characteristics are used as independent variables because they can be observed by marketers. Five separate models were estimated (sociodemographics, vacation activities undertaken, information sources and type of booking, mode of transport, general travel characteristics). Then, the significant variables (p < .1) from these models were put into one model. 1 All analyses were carried out using R (R Core Team 2013), using flexclust (Leisch 2006) and nnet (Venables and Ripley 2002).
Results
Research Question 1: Is Tourist Word-of-Mouth a Homogeneous Activity?
Figure 2 profiles the segments: colored bars indicate the percentage of people in each segment who engage in a specific activity, and the red horizontal lines represent the sample average. To easily identify variables that contribute the most to the distinct profile of a specific cluster, variables that do not show a substantial deviation from the total sample mean are shown in white (Dolnicar and Leisch 2014). Writing emails and emailing photos best distinguishes between the four segments. In segments 1 and 3, all respondents emailed photos, whereas in segments 2 and 4 nobody did. In segments 3 and 4, all respondents sent (verbal) emails, whereas in clusters 1 and 2 nobody did. All segments liked to show photos (offline) of their holidays, but segment 4 did to a considerably lesser extent.
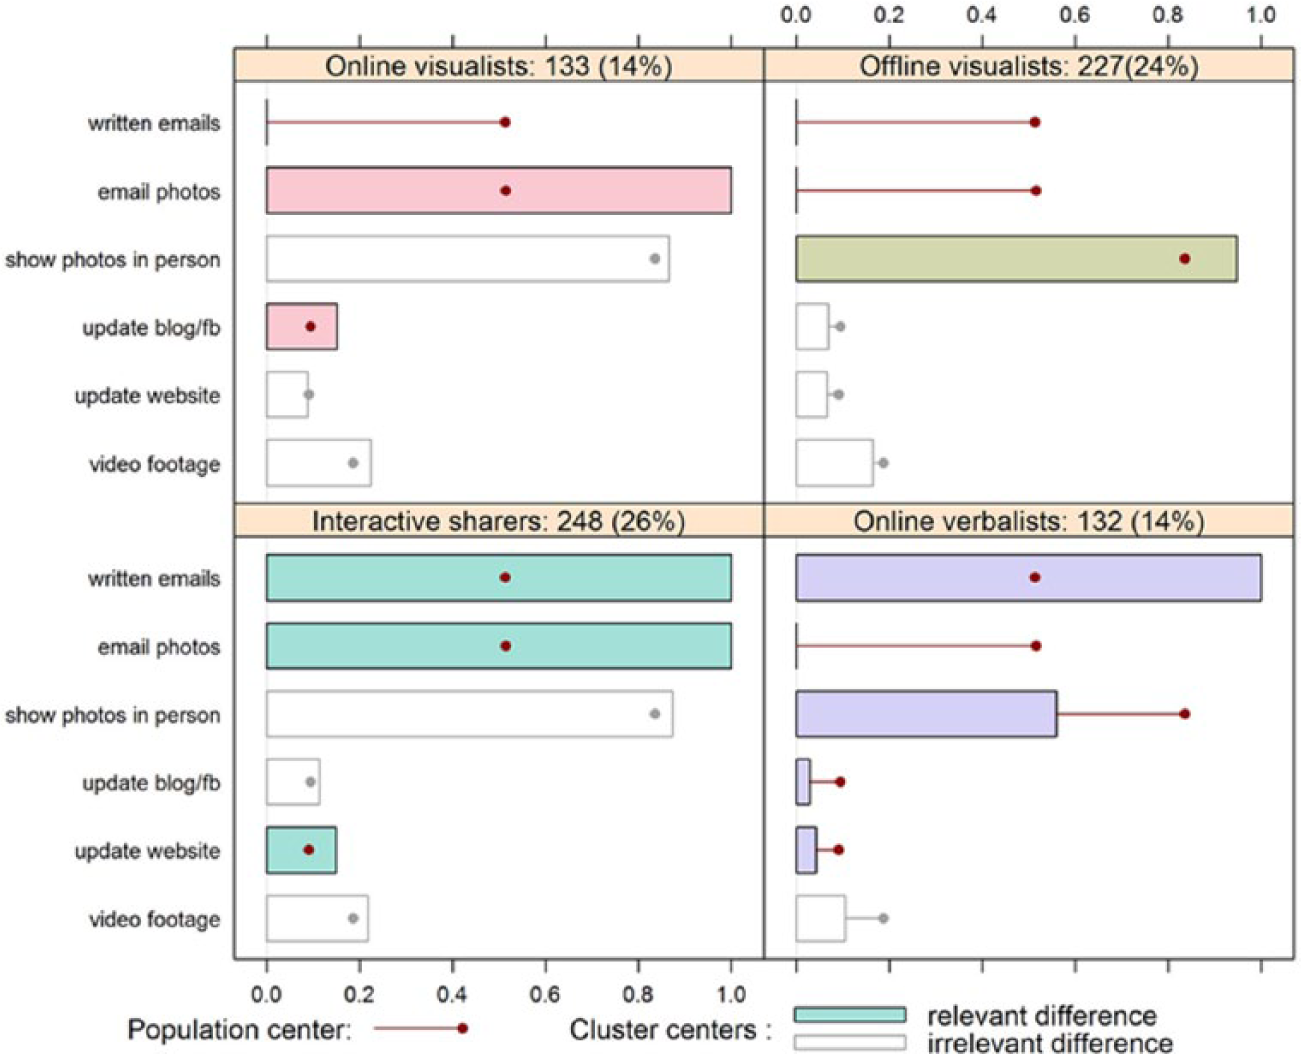
Segment Profile Plot.
In total, five word-of-mouth segments are identified. Four emerged from the data-driven segmentation analysis and the fifth was extracted a priori. Note that all segments share their experiences in conversations. For the a priori selected segment (“offline verbalists”), conversations are the only means of sharing their experiences. The multinomial logistic regression identified several variables that assist in profiling and differentiating each of the segments. Results are reported in Table 2. “Offline verbalists” serve as the baseline category because members of this segment engage in only one type of word-of-mouth behavior (sharing experiences in conversations).
Multinomial Logistic Regression Results.

p < .05, **p < .01, ***p < .001. No significant results were found for education (reference category: university education), age, how often newspapers are read (sociodemographics), going camping, playing tennis, visiting museums or art galleries, going on guided tours (activities), book accommodation: on the phone, at arrival, via travel agent, use hotel brochures as information source,c use exhibitions/fairs as information sourcec (information and booking), get around at destination by: walking, bus, ferry, taxi, rented car (transport), vacation taken on weekend or during the week, type of accommodation stayed at (reference category: private property where no payment was required), traveled with children, length of the trip, times went out for coffee (travel characteristics).
Full-time employed was used as the reference category.
“A typical annual vacation (once a year)” was used as the reference category.
Asked in general (“In general, which information sources do you use to help you with your vacation destination choice?”). All other trip characteristics refer to the last Australian (domestic) vacation.
Table 3 summarizes with whom the segments share their holiday experiences. Because this is a behavior that happens after a holiday has taken place, it is a background variable that cannot be used by marketers to identify people. Hence, it was not included in the multinomial logistic regression. Table 3 also shows the average amount of holiday activities undertaken (out of 44) as a proxy for how active the segments are on their holiday.
Summary of Segment Characteristics.
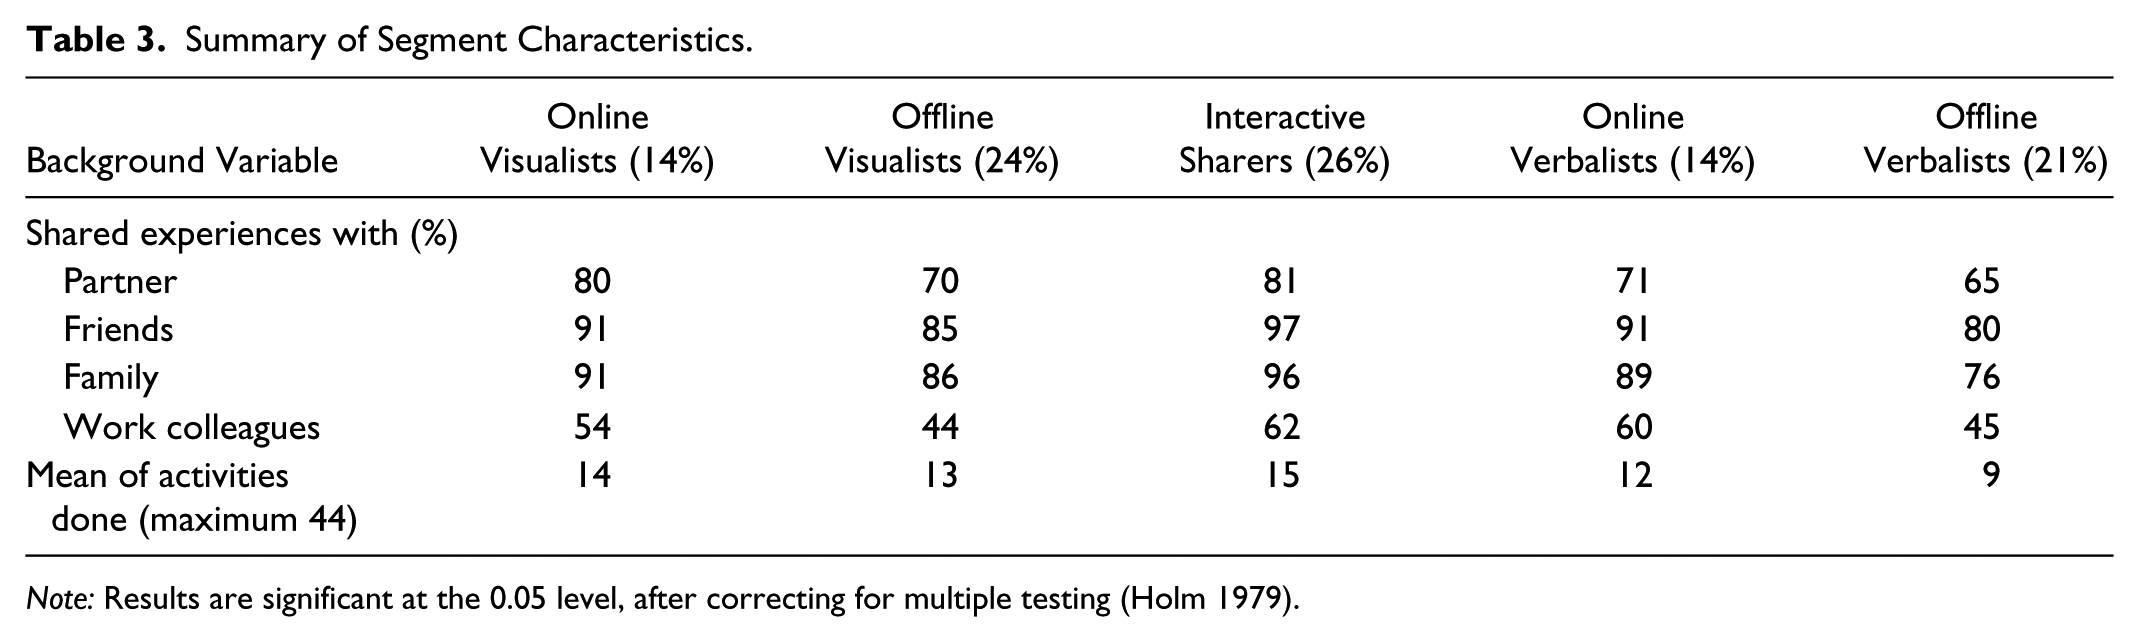
Note: Results are significant at the 0.05 level, after correcting for multiple testing (Holm 1979).
The first segment (“online visualists”) is characterized by the use of visual information (email photos, 100%; show photos, 86%; update blog or Facebook, 16%; show video footage, 23%; see Figure 2). In contrast to segments 3 and 4, members of this segment do not use purely verbal online communication (written emails). The only significant sociodemographic variable is employment (see Table 2). Retirees were more likely to be in the “online visualists” segment than those who are in full-time employment (odds ratio 4.26). Tourists belonging to this segment are unlikely to participate in activities such as whale or dolphin watching or eating out in reasonably priced restaurants (odds ratios of 0.33 and 0.36, respectively). However, tourists bushwalking, being on charter boats or cruises, visiting a health or beauty spa, sightseeing, and having picnics or barbecues are all more likely to be “online visualists” (odds ratios 2.41, 2.44, 3.00, 2.66, and 2.43, respectively). Additionally, behaviors such as booking accommodation on the Internet (odds ratio 1.93) or traveling to the destination by four-wheel drive (odds ratio 3.49) or bus (odds ratio 4.09) are significant predictors of belonging to this segment. The odds of people who are on a special vacation to be in this segment decrease to 44 percent (compared to people who are on a regular break). Finally, people traveling alone are less likely to be “online visualists” (odds ratio 0.32). The odds of being included in this segment increase by 6 percent for every additional person in the travel party. Table 3 shows that members of this segment actively shared their experiences with many different people and participated in a lot of different activities during their vacations.
Travelers in the second segment (“offline visualists”) showed photos to a high extent (95%), but use the other means of sharing experiences less than the average. In contrast to the first segment, this segment shared their pictures only offline. Retirees and students were more likely to be in this segment than those in full-time employment (odds ratios 3.29 and 5.05, respectively). The activity profile of this segment was less likely to include relaxing or doing nothing (odds ratio 0.52). Conversely, bushwalking, being on a charter boat or cruise, and visiting wildlife parks, zoos, or aquariums were popular activities (odds ratios 1.91, 2.20, and 1.92, respectively). They also traveled less internationally and did not tend to travel alone. For every additional international trip, the odds of belonging to this segment are reduced by 37 percent, and traveling alone reduces the odds to 40 percent. “Offline visualists” were less likely to be on a regular break (odds ratio 0.47 compared to being on a typical annual vacation). Indeed, a descriptive investigation of this variable shows that this segment was not only less likely to be on a regular break (32% compared to an average of 48% in the other segments), but was more often on a special vacation (36% compared to an average of 25% in the other segments). “Offline visualists” shared their experiences less frequently with different people and engaged in an average amount of activities during their vacation (see Table 3).
Aside from the unanimous adoption of emails for both written communication and pictures, the third segment (“interactive sharers”) also displays an above average level for all other variables (show photos, 87%; update blogs or Facebook, 11%; update web journals, 15%; show video footage, 10%). Again, retirees were more likely to belong to this segment (odds ratio 2.30). Table 3 shows that they were the most active segment. Activities such as bushwalking; visiting wildlife parks, zoos, or aquariums; having picnics or barbecues; and eating out in upmarket restaurants all increase the odds of belonging to the “interactive sharers” segment (odds ratios 2.4, 2.35, 2.20, and 2.07, respectively). Additionally, the odds for someone who books accommodation on the Internet are 2.42 times higher. Using information from tourist information centers increases the odds by 1.67. Tourists traveling to the destination by plane or bus (odds ratios 2.80 and 5.24, respectively) and who travel around by plane (odds ratio 2.73) are also more likely to be “interactive sharers.” Respondents in this segment also shared their experiences with a wider variety of different people.
The fourth segment (“online verbalists”) exhibits below-average values for all variables except writing emails (100%). Members of this segment still showed photos (56%), but to a lesser extent than did visually dominated segments. Females are more likely to belong to this segment (odds ratio 2.38), and to participate in bushwalks, scenic walks or drives, visiting friends and relatives, and eating out in upmarket restaurants all increase the odds of belonging to this segment (odds ratios 2.18, 2.12, 1.90, and 2.32, respectively). They were less likely to relax and do nothing or visit botanic gardens (odds ratios 0.38 and 0.34, respectively). Tourists traveling to the destination by plane or bus were also more likely to be “online verbalists” compared to those who did not use this type of transport (odds ratios 3.33 and 7.36, respectively). Additionally, the odds of tourists who traveled by plane during their vacation to be in this segment are 4.03 times higher. They were less often found to be eating out for lunch (odds ratio 0.34). “Online verbalists” were more likely to undertake domestic travel than “offline verbalists.” For every additional domestic trip per year, the odds of belonging to this segment increase by eight percent. “Online verbalists” shared their experiences to an average extent, with the exception of sharing with colleagues, where they show a higher than average level. They also were more active on vacations than the “offline verbalists,” but to a lesser extent than were the other three segments (see Table 3).
Segment 5 (“offline verbalists”) shared holiday experiences only in conversations. Because this segment was chosen as the reference category, the negative intercepts for all segments (see Table 2) indicate that an observation where all continuous variables are 0 and the values for all categorical variables are their reference categories is most likely to belong to Segment 5. Additional information from Table 3 shows that “offline verbalists” shared their experiences with the smallest number of people and were also the least active during their vacations.
In summary, the results for Research Question 1 (Is tourist word-of-mouth a homogeneous activity, or do different tourists use different approaches when sharing their vacation experiences?) suggests that word-of-mouth is not a homogeneous activity; rather, distinct segments with regards to different types of word-of-mouth behavior exists.
Research Question 2: Do Tourists Use Both Electronic and Traditional Word-of-Mouth to Communicate Their Experiences?
The findings show that both, electronic and traditional word-of-mouth, are used. However, the findings also show substantial heterogeneity in the use of these two channels. Two of the five segments are dominated by traditional word-of-mouth (“offline visualists” and “offline verbalists”) while the other three segments employ a combination of traditional and electronic word-of-mouth behaviors.
Research Question 3: Do Tourists Use Both Verbal and Visual Word-of-Mouth to Communicate Their Experiences?
The tourists in this survey shared both verbal and visual word-of-mouth content. Segments can also be profiled by their diverging use of these two types of contents. All respondents engaged in conversations, but the extent of the use of visual material varies across segments. One segment exclusively used verbal word-of-mouth (“offline verbalists”) and one other segment was dominated by verbal content (“online verbalists”); they also showed photos, but to a lesser extent than the other three segments.
Discussion
Results indicate that there is substantial heterogeneity in how word-of-mouth is expressed. Traditional and electronic word-of-mouth stand side by side, and both visual and verbal word-of-mouth play a role in sharing holiday experiences. Different people display different tendencies of using combinations of word-of-mouth modes and channels.
These findings contribute to the theoretical understanding of word-of-mouth in several ways. They empirically support the notion that, while electronic media is increasingly important, traditional word-of-mouth continues to play a major role in sharing holiday experiences (Tham, Croy, and Mair 2013). Additionally, the findings provide empirical evidence for the importance of a relatively new stream of research studying the role of visual stimuli as part of word-of-mouth behavior in tourism (Lee and Tussyadiah 2011; Lo et al. 2011; Stepchenkova and Zhan 2013) and point to the potential of simultaneous use of verbal and visual content (Lee and Tussyadiah 2011).
This study is the first to demonstrate the extent of heterogeneity among tourists with respect to different ways of sharing holiday experiences. This finding has practical implications, because it implies that tourism marketers may want to not only focus on social media to stimulate and orchestrate word-of-mouth activity but may want to think about other strategies to achieve the same aim for different tourist groups. Several authors (e.g., Schmallegger and Carson 2008; Litvin, Goldsmith, and Pan 2008) have argued that providing incentives for tourists to write blogs based on their experience can positively influence how other tourists (such as their friends and family) perceive a destination image. Similar incentives could be developed for tourists who prefer other ways of sharing their holiday experiences or who communicate predominantly visual or textual information. For example, “online visualists” (an active segment often found on cruises, sightseeing, picnicking, or four-wheel driving) could be offered free photo shoots on cruises or in typical four-wheel driving hot spots. Sending free digital copies of these photographs to members of this segment is likely to lead to those photos being actively shared online. It could be argued, of course, that people will not share photos taken by others. But traditionally, this was the way it was done: for many decades it was the postcard—a photo taken by a professional—and a few lines of text that were used by tourists to share their holiday experiences. Today, it is common practice for tourists to share photos taken by tour operators such as Contiki and TopDeck Tours on social media. The postcard might be a dying tradition, but similar mechanisms could well be embraced by today’s tourists, and may have substantial benefits for the tourism destination or provider. A professionally taken picture makes the destination appear more attractive, allowing the tourist destination or provider to portray itself in line with its positioning, while at the same time improving the “boasting potential” for the tourist. Also, it may offer a way of getting around not being permitted to take pictures at sites of cultural significance such as museums and sacred locations.
Another example of how these findings could be translated into marketing ideas stimulating word-of-mouth would be for tour operators or destinations who build their positioning on special or “once-in-a-lifetime” experiences. They could target the “offline visualists,” who are likely to be on special holidays rather than regular breaks. Retirees and students are likely to be in this segment. Special holidays are underpinned by emotional responses, which makes them suitable for word-of-mouth (Söderlund and Rosengren 2007). Tourism organizations or destinations who position themselves as a special treat could think about strategies to provide their guests with tangible evidence of their holiday, and encourage them to show them to their friends and family when they get home.
Overall, it can be concluded that there is potential to leverage word-of-mouth. Distinct segments exist, which differ in their word-of-mouth behavior. Providing targeted support for these segments represents one possible approach to increase the likelihood that these efforts translate into word-of-mouth.
Conclusions, Limitations, and Future Work
This article challenges three implicit assumptions of word-of-mouth research: that word-of-mouth is a homogenous activity; that electronic word-of-mouth is dominant; and that word-of-mouth is predominantly verbal. The stability of the cluster analysis lends support to the assertion that word-of-mouth should not be considered a homogeneous activity. Rather, results indicate very distinct patterns. Patterns differ regarding the content that is shared (visual and verbal) and the means of sharing it (off- and online). More specifically, the results show that sharing visual word-of-mouth content plays a key role for some tourist segments, and that both electronic and traditional word-of-mouth should be considered when developing strategies to foster word-of-mouth. For example, focusing primarily on electronic word-of-mouth would neglect the potential of stimulating positive word-of-mouth in market segments that still use traditional ways of sharing their holiday experiences, the “offline verbalists” and “offline visualists.”
Findings from this study contribute theoretically to the understanding of heterogeneity in sharing holiday experiences as well as offering a basis for the tourism industry to develop new, creative ways of stimulating word-of-mouth.
The study is limited in that it is based on reported sharing behavior of holiday experiences. While this research focused on sharing behaviors that differentiate between visual and verbal, as well as offline and online content, the authors cannot claim the studied behaviors to be exhaustive. Future research might want to include behaviors such as writing reviews. It would be very interesting—although challenging in terms of the research design—to replicate this study using actual observed behavior at an individual level. Also, it would be of great interest to link the present study with prior work on motivations to engage in word-of-mouth. Previous research has already identified different segments based on motivations for word-of-mouth behavior (Hennig-Thurau et al. 2004). To understand whether these word-of-mouth motivation segments determine the way in which word-of-mouth is communicated provides an interesting avenue for further research. Another interesting avenue for further research is to determine the degree to which tourists would be willing to share professional photographs (controlled by tourism marketers). They might share them either as a substitute of or in addition to their own photos, and might prefer soft or hard copies.
While this research shows clear differences in the content shared (visual and verbal) and in the way content is shared (offline and online), it remains unclear whether or not these exhibited behaviors translate into the same preferences for information processing. For example, do people who share their experiences visually also prefer visual information? It seems promising for further research to investigate the relationship between information processing and information sharing. Additionally, the current research does not differentiate between positive and negative word-of-mouth. Rather, it is assumed that the findings apply to positive word-of-mouth. Future research should investigate if word-of-mouth behavior differs depending on the communicated holiday experiences being positive or negative. Last but not least, generalizations from this study have to be drawn cautiously. Conclusions are limited to domestic travel by Australian residents. However, the authors do not see obvious reasons why these patterns would be substantially different in other Western countries or in other travel contexts, but this would certainly be an interesting research question for future investigation.
Footnotes
Acknowledgements
The authors would like to thank Katie Cliff for contributing to the development of the questionnaire, Friedrich Leisch for his advice on visualizing the solution and Pierre Benckendorff for feedback on a previous version of the paper.
Declaration of Conflicting Interests
The author(s) declared no potential conflicts of interest with respect to the research, authorship, and/or publication of this article.
Funding
The author(s) disclosed receipt of the following financial support for the research, authorship, and/or publication of this article: This research was funded by the Australian Research Council under the Discovery Grant Scheme (project number DP110101347).