
Abstract
Tourism researchers and the tourism industry rely heavily on data-driven market segmentation analysis for both knowledge development and market insight. Most algorithms used in data-driven market segmentation are exploratory; they do not generate one single stable result. Only when data are well-structured (when very clear, distinct market segments exist in the data) are repeated calculations likely to generate the same segmentation solution. When data lack structure, which is frequently the case in empirical consumer data sets, repeated calculations lead to different solutions. Running a market segmentation analysis once only can therefore lead to an entirely random solution that does not represent a strong foundation for developing a long-term market segmentation strategy. The present study (1) explains the problem, (2) assesses how high the risk is of random solutions occurring in tourism market segmentation studies, and (3) recommends an approach that can be used to avoid random solutions.
Introduction
Data-driven market segmentation (Dolnicar 2004) uses empirical data—frequently survey data—to extract groups of similar consumers. Market segmentation has been introduced to marketing in 1956 by Wendell Smith and has since been widely adopted. The aim of market segmentation as understood by marketers is to identify segments that have the characteristic that members of each group are very similar to one another and members of different groups are as different as possible. This allows developing a marketing mix that is particularly attractive to selected segments, which leads to more efficient marketing spending in the short term and competitive advantage in those segments in the long term (Myers and Tauber 1977; Wedel and Kamakura 1998; Lilien and Rangaswamy 2004; Dolnicar 2008).
Data-driven market segmentation is heavily used by tourism researchers to develop knowledge (Zins 2008; Mazanec et al. 2010) and by the tourism industry to gain market insight on which marketing planning is based. Ensuring the validity of market segmentation study results is therefore of critical importance.
A range of methodological decisions in segmentation studies can undermine the validity of results. For example, the underlying data can be of low quality (Dolnicar 2002), the sample can be too small (Dolnicar 2002; Dolnicar et al. 2014; Dolnicar, Grün, and Leisch 2016), and the number of variables can be too high (Dolnicar 2002; Dolnicar et al. 2014; Dolnicar, Grün, and Leisch 2016). Arguably the most fundamental of all possible problems, however, is to end up with an entirely random grouping of consumers.
Ending up with a random solution is not something one would naturally expect to happen, but random solutions often occur because data-driven segmentation analyses do not guarantee stable results. If the analysis lacks test–retest reliability, and if the result cannot be replicated by running the exact same calculation on the exact same data again, the results cannot be trusted. Unstable solutions are caused by the exploratory nature of the calculations used in data-driven market segmentation analysis. For example, in k-means clustering (one of the most popular algorithms in tourism; Dolnicar 2002), the first step is to randomly select a number of data points, which serve as starting points for the calculation. Different starting points lead to different segmentation solutions. Therefore, if data are not well structured, each repeated calculation with different starting points will generate a different solution (algorithm randomness). To complicate matters, the sample of respondents in the data set may not be a perfect representation of the population, so slight variations in the sample are a second source of randomness (sample randomness).
It is for this reason that Dolnicar and Leisch (2010) use stability to try to establish whether any given data set enables the extraction of naturally existing market segments or whether, instead, the data analyst is forced to create a number of alternative segmentation solutions and let the user decide the most managerially useful one.
The key to conducting high quality data-driven market segmentation studies, therefore, is to assess in advance the risk of a random solution and, if possible, avoid such random solutions. The present article (1) explains the problem of sample and algorithm randomness in detail, (2) offers assessments of the risk of random solutions occurring based on past published segmentation studies as well as unpublished tourism survey data sets, and (3) recommends an approach that can be used to avoid random solutions.
This article also serves to raise awareness of the issues pointed out in Dolnicar and Leisch (2010), which was well received in the marketing literature but has so far gone unnoticed by tourism researchers. This article proves that sample and algorithm randomness have major implications on segmentation solutions based on tourism data sets, but are currently being ignored.
The article is structured as follows: first, in an interdisciplinary literature review, developments in clustering and market segmentation methodology are discussed. Methodological aspects of clustering and market segmentation are researched primarily in the fields of statistics and marketing, which is the reason that the literature review relies heavily on work from those fields. Next the methodology is explained in detail. As opposed to empirical tourism studies, a very different approach has to be taken to answer the second research question, that of assessing the risk of random solutions occurring specifically when empirical tourism data sets are segmented. The approach takes two perspectives: a retrospective perspective where past applied segmentation studies in tourism are analyzed to see whether algorithm and sample randomness are accounted for or not. And a prospective approach asking how high the risk is—if a data analyst would take any random empirical tourism data set—to arrive at a random segmentation solution based on the typical nature of tourism data sets. These two perspectives require different research designs. The retrospective question is answered by analyzing prior empirical tourism segmentations studies. This is not another literature review; rather each empirical study here is one data point in the analysis. For the prospective analysis, the structure of a large number of empirical tourism data sets is explored. Results are presented in two separate sections. Finally, conclusions are drawn and practical recommendations offered how tourism researchers can minimize the risk of arriving at random solutions.
Advances in Market Segmentation Research
Despite the long history of market segmentation, academic research on data-driven market segmentation has focused primarily on fine-tuning algorithms, resulting in a wide range of highly sophisticated methods, such as latent class analysis (Gibson 1959; Lazarsfeld, Henry, and Anderson 1968), finite mixture modeling (Banfield and Raftery 1993), and methods that simultaneously group and select the most influential variables (Dolnicar et al. 2012) or correct for response styles while grouping individuals (Grün and Dolnicar 2015).
Review articles on market segmentation typically discuss the wide range of variables that can be used as the basis for segmentation (Beane and Ennis 1987; Dolnicar 2002, 2003; Tuma, Decker, and Scholz 2011) and the advantages and disadvantages of available algorithms (Beane and Ennis 1987; Tuma, Decker, and Scholz 2011). Some also cover issues of reliability or stability (Dolnicar 2002, 2003; Tuma, Decker, and Scholz 2011), which stand at the center of the present study, but do not provide any practical recommendations how stability can be systematically assessed. The reason is that methods for the systematical assessment of stability of clustering solutions were developed later (Tibshirani and Walther 2005; Hennig 2007; Dolnicar and Leisch 2010).
Interestingly, books on market segmentation as well as review articles typically do not discuss some of the fundamental conceptual questions relating to data-driven market segmentation, such as whether market segments of consumers actually exist naturally or whether they are created (as a notable exception, see Putler and Krider 2012). This discussion was ignited by the article by Dolnicar and Leisch (2010) in which the authors postulate that empirical data can permit one of three cases of market segmentation: natural, reproducible, or constructive market segmentation.
In the case of natural market segmentation, true market segments exist. Natural market segmentation is in line with the traditional view of market segmentation that the “initial premise in segmenting a market is that segments actually do exist” (Beane and Ennis 1987, 20). If natural market segments exist, segment members are very similar to one another and very different from members of other segments. As a consequence, natural segments are easy to find. If a data-driven market segmentation analysis is repeated multiple times—using the same or even a different grouping algorithm—the same segments emerge; stability across repetitions is high.
The case of constructive market segmentation represents the exact opposite: no natural market segments exist. Market segmentation is still valuable because sections of consumers will differ from other sections of consumers. But the borders between these sections are not clear; they could be drawn anywhere. As a consequence, repeated calculations of data-driven market segmentation solutions will lead to different results. Stability across replications will be extremely low.
The third possibility is that of reproducible market segmentation. This concept is characterized by a lack of true market segments in the data, as well as by the existence of some other structure in the data that allows the repeated identification of some segmentation solutions (Dolnicar and Leisch 2010).
In their article, Dolnicar and Leisch (2010) also propose a method that allows data analysts to investigate which of the three concepts their data fall under. The idea is to repeat—for each number of clusters—the segmentation analysis many times, each time using a different bootstrap sample of the data. Then, the stability across repetitions is calculated. Stable solutions are good; they give the user of the segmentation solution confidence that their marketing mix will not be based on a random solution (Dolnicar and Leisch 2010).
Unstable solutions, on the other hand, indicate a lack of naturally occurring market segments in the data. Here, each resulting segmentation solution—though not incorrect—represents one of many equally valid alternatives. In such circumstances, market segments are artificially constructed; the data analyst and the user need to select one of many alternative solutions using other statistical criteria (Dolnicar and Leisch 2010).
The detailed algorithm works as follows:
First,
Next, the clustering algorithm is run on each bootstrap sample, resulting in
Then, boxplots and density plots can be utilized to visualize stability. When stability (the Rand index value) is close to 1 the solution is stable, pointing to the existence of natural market segments in the data. Stability values close to 0 indicate unstable solutions and point to market segments having to be artificially constructed (Dolnicar and Leisch 2010).
These new concepts and methods make it possible to avoid negative effects of randomness in both the sample and the algorithm when market segmentation analyses are conducted. The question investigated next is whether tourism researchers display awareness of the problem of randomness and whether they make use of tools available to manage randomness.
Methodology
The risk of random segmentation solutions resulting from data-driven market segmentation studies in tourism is assessed separately for (1) data-driven market segmentation studies published in tourism in the past six years and (2) a number of unpublished tourism survey data sets.
Analysis of Published Data-Driven Market Segmentation Studies
A Scopus search reveals that segmentation studies in tourism appear most frequently in the following three outlets: the Journal of Travel Research, Journal of Travel & Tourism Marketing, and Tourism Management. As a consequence, articles on data-driven segmentation published in these three journals were included. In addition, the International Journal of Hospitality Management and the International Journal of Contemporary Hospitality Management were included on request of the reviewers.
Articles were identified using a key word search on the journal websites. The key words used were “segmentation” and “market segmentation.” Between 2010 and May 2016, a total of 78 segmentation studies appeared in those journals. Of those, 53 (68%) were data-driven segmentation studies. These were used.
The time frame of 2010–2016 was chosen because methods to assess the stability of clustering solutions have developed in the statistical literature between 2005 and 2010 (Tibshirani and Walther 2005; Hennig 2007; Dolnicar and Leisch 2010). Typically, it takes a few years for new methodological advances to be adopted and for software to become available that facilitates the uptake of new methods. The implementation of the bootstrap procedure proposed by Dolnicar and Leisch (2010), for example, is now also available in a graphical user interface (Putler 2014), making it more accessible. Therefore, 2010 was chosen as the starting point for the search of articles using data-driven market segmentation.
Note that the aim is not to review studies in terms of their knowledge contribution. Rather, the aim is to identify key methodological features that allow an estimation of the error potential as a result of running a single calculation of a segmentation algorithm.
Analysis of Unpublished Tourism Survey Data
Typically, when market segmentation analysis is conducted, an empirical data set is used as the basis, usually a survey data set. It is not known in advance if a data set contains market segments or not. The fact that market segmentation analysis leads to a grouping of respondents does not prove that these groupings are real. Every market segmentation algorithm groups respondents, either into their natural segments or, if they do not exist, into artificial groupings. If distinct, real, natural market segments exist in the data and one single market segmentation analysis is calculated, it is very likely that the algorithm will identify the correct market segments. If, however, the data are unstructured and there are no real market segments in the data, the result of one single calculation will necessarily be random. It may still be managerially useful, but it is random.
To be able to derive an estimate of the risk of random solutions in future segmentation studies, it is necessary to understand how structured typical tourism survey data sets are. This is the approach used here.
Specifically, the procedure proposed by Dolnicar and Leisch (2010) was applied to 32 tourism survey data sets. These data sets have not been collected for this study; rather they represent data sets accessible to the authors. Critically, they are very different in nature. High variability minimizes the bias of the estimate derived about the typical extent of data structure in empirical tourism data.
The data sets vary in the following aspects: they contain between 4 and 45 survey questions and between 1,000 and 4,800 respondents. They vary in scale type, including binary (11 cases), metric (3 cases), and ordinal data (18 cases). The content of questions covers destination image, motivations, vacation activities, Internet use, and information sources used during travel planning.
The k-means clustering algorithm (Hartigan 1975) was applied because (1) it is widely used in tourism research according to Dolnicar (2002) and the literature analysis undertaken for the present study (Table 1) and (2) the bootstrap procedure (Dolnicar and Leisch 2010) for k-means is readily available and easy to use given its graphical user interface (Leisch 2006; Putler 2014). One hundred pairs of bootstrap samples were used. Starting points were drawn randomly 20 times and the best starting points were used. All computations were done using the statistical computing software R (R Core Team 2015) with the package flexclust (Leisch 2006). Two criteria were used to classify each one of the 32 empirical data sets into natural clustering, reproducible clustering, or constructive clustering:
In technical terms, the rootogram is defined via the Euclidean distance between each centroid and all data points divided by the sum of all clusterwise distances and all data points. Let
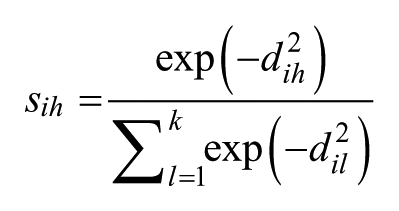
transforms the distances into similarity measures (instead of dissimilarities) between observations and centroids. This transformation was chosen akin to finite mixture models where posterior class probabilities constitute the similarity measures (Fraley and Raftery 1998; Leisch 2004). In fact, this similarity measure is equal to the posterior probabilities of the corresponding finite mixture model (a mixture of independent normal distributions with standard variance). The square roots of these similarities are computed and drawn as histograms for each segment, resulting in the rootogram.
Published Data-Driven Segmentation Studies in Tourism Analyzed in This Study.
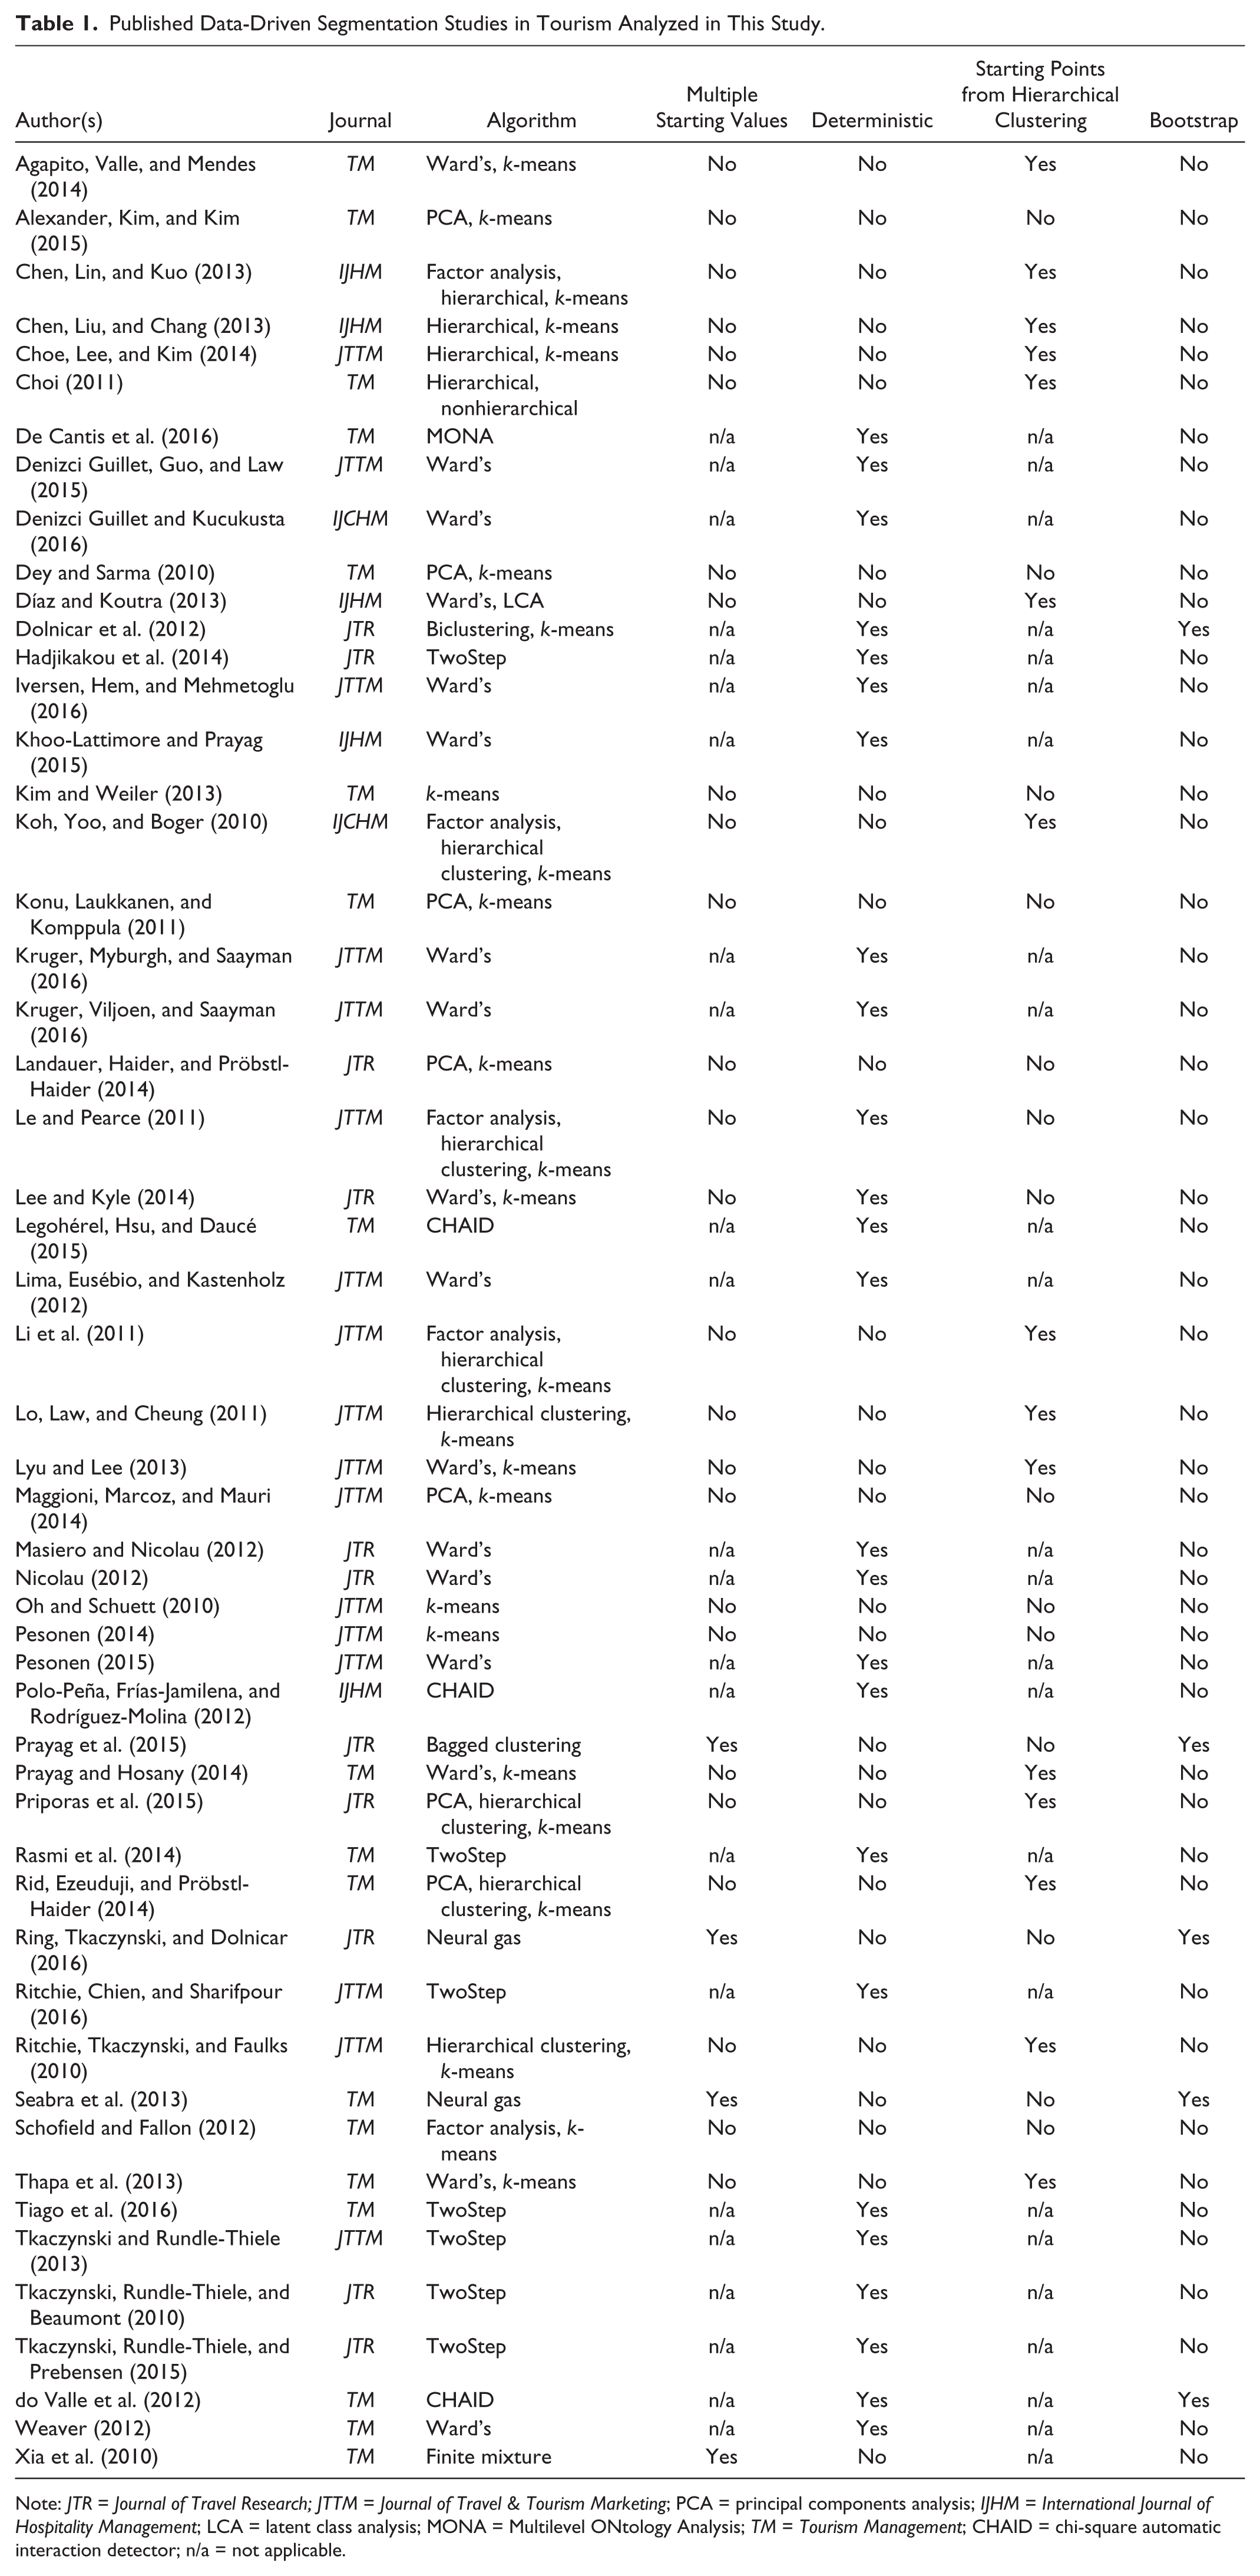
Note: JTR = Journal of Travel Research; JTTM = Journal of Travel & Tourism Marketing; PCA = principal components analysis; IJHM = International Journal of Hospitality Management; LCA = latent class analysis; MONA = Multilevel ONtology Analysis; TM = Tourism Management; CHAID = chi-square automatic interaction detector; n/a = not applicable.
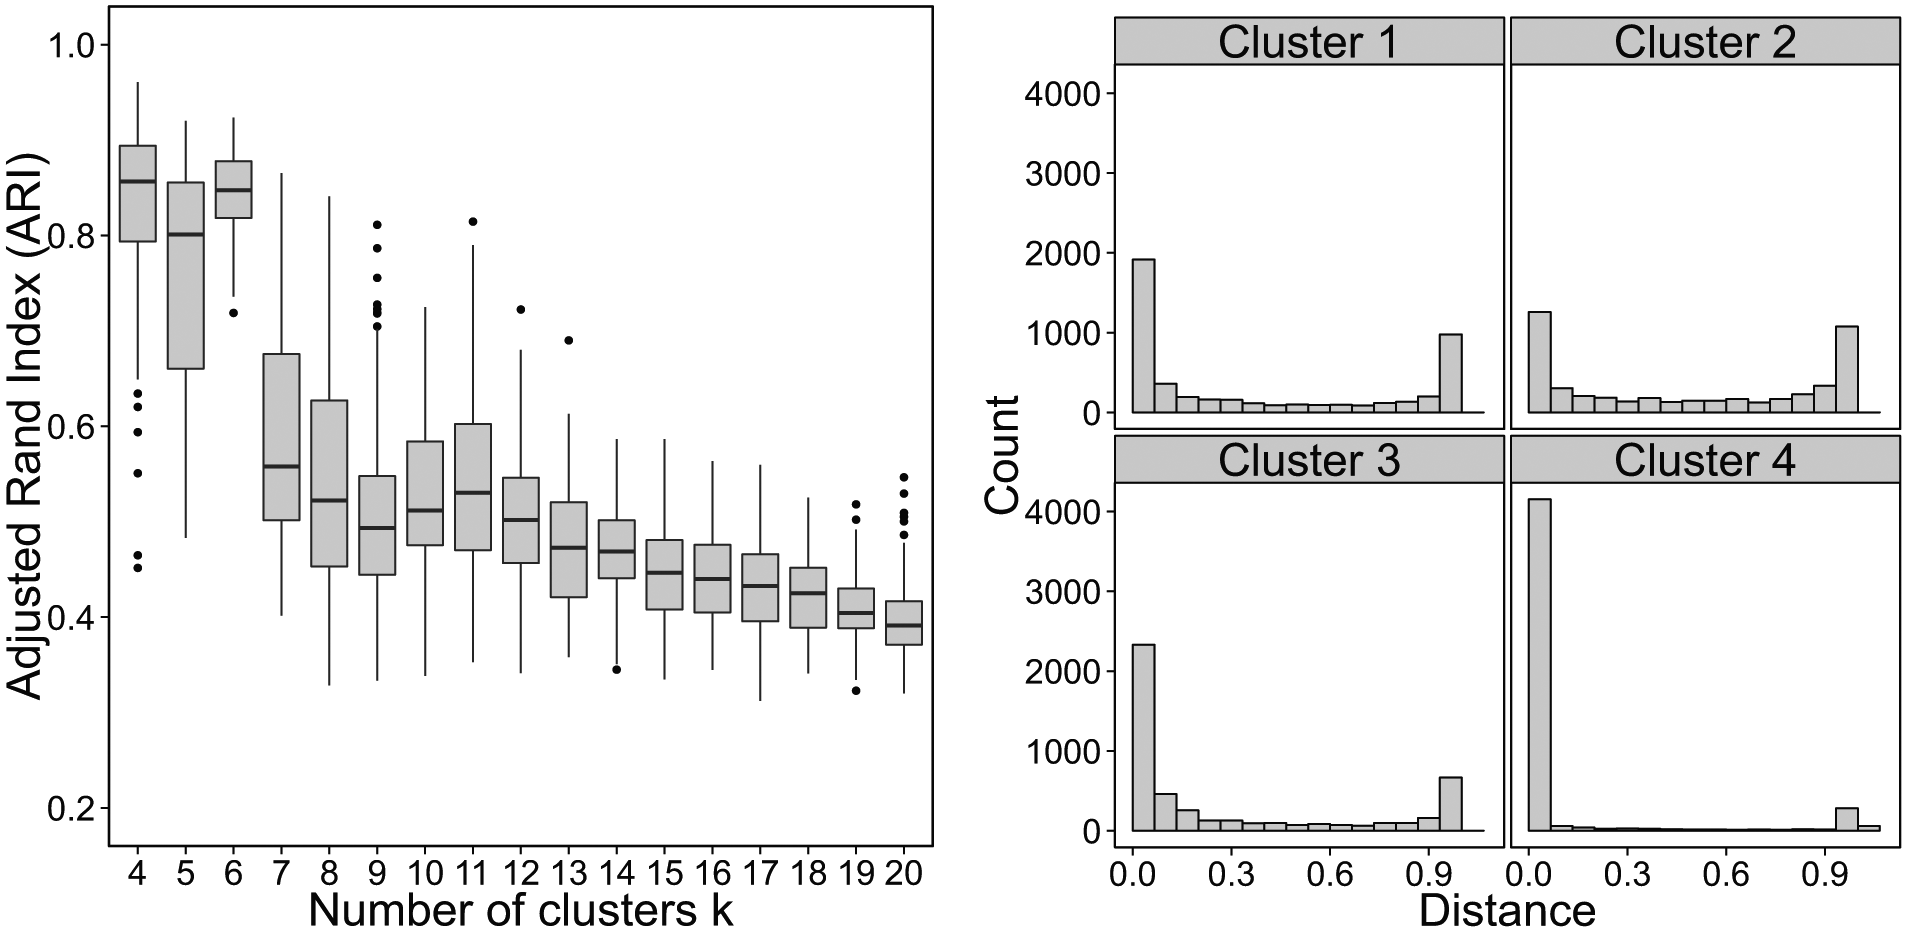
Prototypical boxplot and rootogram (natural segmentation).
The three data-driven market segmentation concepts were operationalized as follows:
Natural segmentation
For natural segmentation, very high stability up to the number of naturally existing segments
Naturally occurring segments are also well separated, which is evident for this data set from the rootogram in the right panel of Figure 1. It plots each of the four segments contained in the four-segment solution. As can be seen, most data points have values of 0 or 1; only few fall in between. This means that most respondents are clearly assigned (or not assigned) to each segment and there is little ambiguity; segments are well separated.
Figure 1 is based on 4,794 tourists’ typical vacation activities. For each of 30 activities, respondents indicated whether they engaged in them “never,” “sometimes,” or “a lot.” The box plots and rootograms (Figure 1) point to the existence of six naturally occurring market segments. Two of them (containing 14% and 9% of respondents, respectively) may represent response styles. The remaining four segments are suitable for interpretation. Segment 2 (24%) engages in many swimming-related activities, such as going to swimming pools, saunas, and swimming in general. Members of segment 3 are sight-seers (22%). Segment 4 (13%) is the sports segment favoring activities like tennis, cycling, sailing, and winter sports, but also attending bars and discotheques and posting electronic evidence of their activities on social media. Segment 5 (18%) contains cultural tourists attending festivals, events, theatres, and the opera and also going out for dinner. They also like taking walks, going swimming, and going on boat trips.
We operationalize natural segmentation as follows: (1) high stability and low variance in the boxplot for at least a limited range of cluster numbers, (2) a steep drop from the high stability range to solutions outside of this range, and (3) good segment separation in rootograms.
Reproducible segmentation
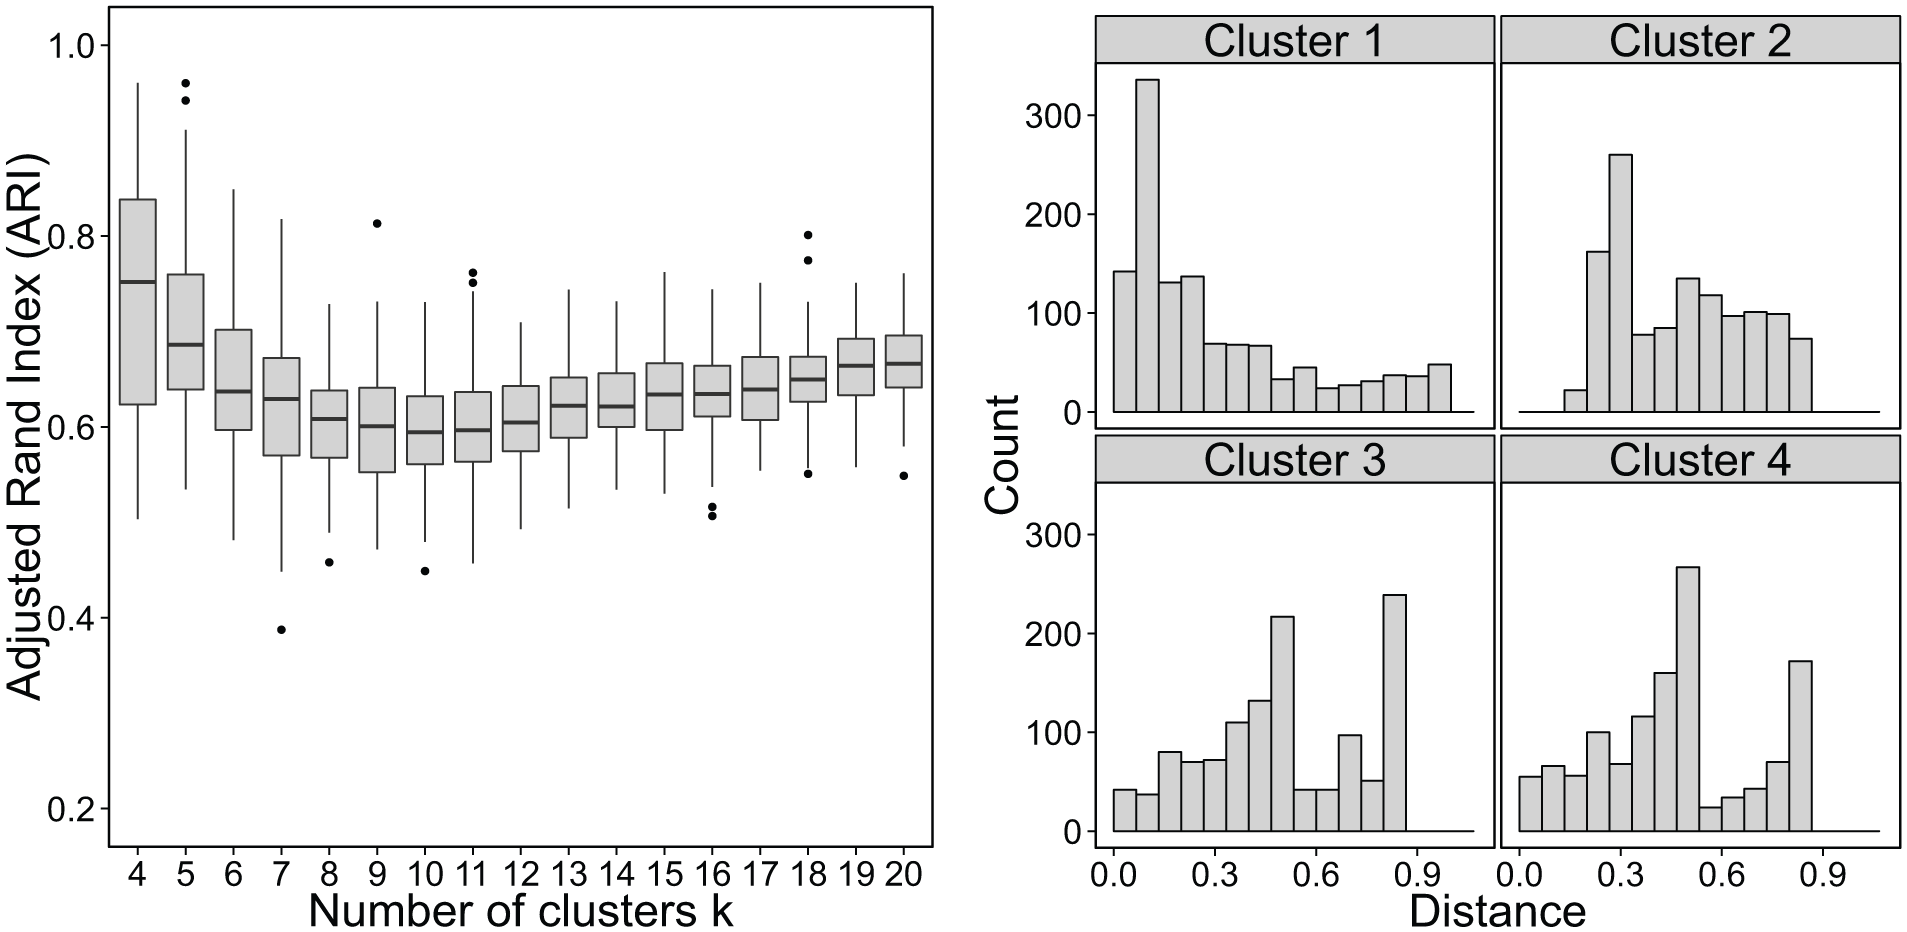
This segmentation concept is characterized by segments being located close to each other, but still containing enough structure to derive stable results. As the number of clusters increases stability declines because it becomes more difficult to find exactly the same partitions with more clusters (if there is a small “classification” error for each cluster, these errors add up, resulting in low stability for large numbers of clusters). Figure 2 shows a prototypical boxplot and rootogram for such an empirical data set.

Prototypical boxplot and rootogram (reproducible segmentation).
These data contain 4,794 tourists’ stated willingness to take 12 different risks. Examples of risks are acting in their boss’s job in order to demonstrate their competence despite the risk of making mistakes, setting only small easily achievable goals, and having sympathy for adventurous decisions. Based on the boxplot shown in Figure 2, the four-segment solution emerges as the best option displaying high stability and low variance. The first two segments comprising 22% and 25% of respondents, respectively, are cautious segments. They tend to disagree with statements such as “I would like to act in my boss’s job some time so as to demonstrate my competence, despite the risk of making mistakes” and “Success makes me take higher risks.” They differ, however, in the item “Nothing ventured, nothing gained” and in taking risks when they find their chances of success are limited. Respondents in the third segment (21%) show a higher affinity toward risky behaviors. They like “putting something at stake, [rather] than be on the safe side.” Further, they are not cautious when making and acting on plans, do not tend to imagine unfavorable outcomes of actions, and take higher risks when they have been successful. The last segment (33%) appears to be a response style because of high agreement across all items, although about half of the items are reverse coded.
We operationalize reproducible segmentation as follows: (1) gradual decline in stability in the boxplot as the number of clusters
Constructive clustering
If data contains no grouping structure, such a structure can be imposed. Consequently, one would expect the stability to be low. In empirical data sets, this can manifest as near-constant stability independent of the number of clusters. Figure 3 shows prototypical plots. These are based on an empirical data set about information sources used by 1,231 respondents while planning their last vacation, such as “tour operator or travel agents,” “social media,” “guidebooks,” “national tourism offices,” or “online travel community companies (e.g., TripAdvisor).”
Prototypical boxplot and rootogram (constructive segmentation).
The five-segment solution contains a segment that mostly obtains information from “friends and relatives” (22% of respondents) and a segment (30%) that does not. Two segments (19% and 17% each) show average usage of information sources with one exception each. One made little use of “online travel community companies” while the other made little use of “official local, regional or national tourism offices.” The fifth segment (22%) did not use any information sources, which can be, at least in part, explained by answer patterns.
To illustrate how starting values can affect segmentation solutions, the same algorithm was run twice on this data set using different starting points. This resulted in a new and different grouping of individuals. Two of five segments can still be found in this solution: the segment that claims to use no information sources (12%) and the segment that reports not using online travel company websites (17%). The remaining segments do not emerge from this solution. They are replaced by one segment that does not use local tourism offices (19%) and does not get information from friends and relatives (30%) and another segment that relies heavily on information from friends and relatives (22%).
While there might be managerial insights in these segmentation solutions, there is no clear statistical evidence that any one particular segmentation solution should be chosen over an alternative solution. In such cases, selecting the optimal segmentation solution requires heavy involvement of the user. Also, it is important to note that in case of constructive segmentation, the segmentation analysis cannot recommend the best solution.
We operationalize constructive segmentation as follows: (1) near-constant stability for all numbers of clusters in the boxplot and (2) weak segment separation in the rootogram.
Results
How High Is the Risk of Random Solutions in Data-Driven Segmentation Studies Conducted in the Past?
The 53 data-driven market segmentation studies identified in the primary publication outlets of academic segmentation research between 2010 and May 2016 were analyzed in view of two criteria: (1) methods and algorithms used and (2) measures taken to control for algorithm and sample randomness (Dolnicar and Leisch 2010). Ways to control for algorithm randomness are using multiple (random) starting points, initializing the algorithm with the results of hierarchical clustering, or side-stepping this problem entirely by only using deterministic algorithms. Sample randomness can be controlled using the bootstrap stability and, to some degree, using cross-validation or bagged clustering.
Results are provided in Table 1. Note that only data-driven segmentation studies were included. This excludes commonsense segmentation studies (such as segments created by splitting up tourists by one single variable like gender), literature reviews and simulation studies.
Table 1 lists—for each data-driven segmentation study—which journal it appeared in and which algorithm was used. When “Ward’s” occurs together with “k-means,” the authors first ran Ward’s clustering analysis and initialized k-means with its result. For “hierarchical clustering” and “k-means” the authors did the same however with an unspecified hierarchical clustering algorithm. When the algorithm contains “factor analysis” or “PCA” (principal components analysis) the authors first reduced the dimensionality of the data sets using either factor analysis or PCA and used the result as the basis for the actual segmentation. The remaining columns list whether the authors report using multiple different starting values, whether the results from hierarchical clustering were used as starting values (where necessary), whether the algorithm is deterministic (usually for hierarchical clustering and TwoStep), and if any kind of bootstrap was performed (including bagged clustering and cross-validation). The columns pertaining to starting values might be “n/a” for “not applicable” in case of deterministic algorithms.
Table 2 summarizes the insights from this analysis by showing how often algorithm and sample randomness were controlled for. The left column shows how often algorithm randomness is accounted for. In eight cases (15% of studies), randomness is not controlled for; 23 articles use entirely deterministic algorithms; 18 control algorithm randomness by initializing the algorithm with the result of a hierarchical algorithm, and 3 articles use multiple random starting values. The right column shows how often sample randomness was controlled for. Only four studies take this into account by either using the bootstrap, bagged clustering, or cross-validation; 49 studies (92%) do not control for sample randomness.
Number of Reviewed Articles That Control for Either Source of Randomness.

Approximately half (30) of the 53 studies use clustering algorithms, the results of which depend on starting points (i.e. k-means, neural-gas, bagged clustering). These algorithms are often used in combination with other statistical methods (such as hierarchical clustering or factor analysis).
Of those 30 segmentation studies, the number of starting points for the calculations is only specified in three studies, in which 5, 10, and 500 random restarts are implemented, respectively. For two other segmentation bases, the number of repeated calculations can be inferred from the software used: one study uses bagged clustering (as implemented in the e1071 R package), where the default value for starting values is 10; the other uses the neural-gas algorithm (using the flexclust R package), where the default value for repeated calculations is 3. In 18 studies, solutions from hierarchical algorithms are used to initialize the cluster algorithms. Most articles used SPSS, which only uses a single starting value for a segmentation basis given the number of clusters
The remaining 23 articles use deterministic algorithms (e.g., Ward’s or SPSS TwoStep clustering) where multiple initializations are not necessary. These studies would have benefited from bootstrapping, however.
Some studies also suffer from a bad sample size to number of variables ratio (e.g. 181 observations and 40 variables; 211 observations and 28 variables; see Dolnicar et al. (2014) and Dolnicar, Grün, and Leisch (2016) for an illustration of the problem of low sample sizes as well as a recommendation for suitable ratios). These studies also use a single starting value with k-means only. As a consequence, they are particularly prone to generating unstable results, making it even more critical to investigate the stability of solutions.
Among the 53 segmentation studies, 2 use the bootstrap procedure proposed by Dolnicar and Leisch (2010). One article uses the chi-square automatic interaction detector (CHAID) algorithm with 10-fold cross-validation, which is similar in spirit to the bootstrap. Another article uses bagged clustering, which implicitly employs a bootstrap procedure as well in order to increase the stability of the result.
It can be concluded from this analysis of segmentation studies published in the past that the risk of these studies presenting a random solution is not negligible. A common strategy to combat algorithm randomness in tourism segmentation studies is to use the result of Ward’s clustering as starting points for k-means analysis (Milligan and Sokol 1980). Steinley and Brusco (2007) show that this procedure works well when the true number of clusters is known. Yet, they argue, results can further be improved by using a large number of random starting points. It can be concluded that there is no single best initialization strategy for k-means that works best in every real-world use-case. It is therefore advisable to compare different starting points for k-means segmentation or take the advice of Steinley and Brusco (2007) and use multiple random initializations.
The fact that some algorithms depend on starting points should not be taken as evidence that deterministic hierarchical clustering on their own should be preferred in general; these methods are typically computationally very intensive with larger sample sizes. Also, they tend to find suboptimal solutions with respect to the within-cluster variance as they are unable to correct for misclassified observations early in the estimation process. Hence, it is quite popular to refine this clustering by running k-means afterwards (Milligan and Sokol 1980; Steinley and Brusco 2007).
The other source of errors is sample randomness. Suppose the same study were conducted repeatedly on two different sets of individuals from the same population. The segmentation results might be very similar in both cases (pointing to a stable solution) or they might be very different (pointing to an unstable solution). Most segmentation algorithms—and all of the algorithms in the reviewed studies—do not account for this variation. Bootstrap or cross-validation procedures are required to obtain estimates of the degree to which segmentation solutions would vary across repeated studies. As Table 2 shows, only 4 of the 53 reviewed studies accounted for sample randomness. The majority of studies (49) did not control for this source of error at all.
Overall, it can be concluded from the analysis of published studies that approximately 92% are at risk of having presented a random solution. These findings – while studying sample and algorithm randomness separately – reflect the findings from prior review studies which conclude that general stability of segmentation solutions has not been investigated at all by 67% (Dolnicar 2003) and 85% (Tuma, Decker, and Scholz 2011) of studies, respectively.
How High Is the Risk of Random Solutions in Future Data-Driven Segmentation Studies?
Figure 4 shows how many of the 32 inspected data sets allow natural segmentation, reproducible segmentation, and how many require constructive segmentation. As can be seen, the vast majority of data sets (72%) fall into the category of reproducible segmentation; 22% can be classified as constructive segmentation, and only two data sets (6%) contain true, naturally occurring market segments.

Distribution of empirical tourism data sets across segmentation concepts.
One issue that affects these results is sample size. Dolnicar et al. (2014) recommend that the sample size should exceed 70 times the number of variables. This requirement is met by 22 of 32 (69%) data sets. Coding whether or not this requirement was met (as a binary variable in the data set) and testing whether meeting the sample size requirement is associated with the type of clustering (natural, reproducible, or constructive) for those particular data sets leads to the conclusion that this is not the case (Fisher’s exact test p = 0.3318).
Further, the scale type might have an influence on the stability as it is possible that the stability decreases with the increasing number of answer categories. In this instance, the scale type does not affect the type of clustering (Fisher’s exact test p = 0.5927). With only 32 data sets and a large range of scale types, a more thorough investigation of this issue is better left to a different study that contains a larger number of data sets and a more even distribution of scale types. Additionally, response styles that seem to occur in larger variety with increasing number of answer categories would need to be controlled for, by, for example, using a model that simultaneously groups individuals and corrects response styles (Grün and Dolnicar 2015). As a consequence, all data sets are retained.
One of the two data sets with naturally occurring segments is that on tourists’ vacation activities (discussed in detail above). Distinct market segments were those interested in sight-seeing, a sports and activities segment, cultural visitors, as well as a group visiting beaches and swimming pool/saunas.
The second data set with naturally occurring segments was based on a study of 4,794 participants who responded to the question “To me vacations away from home are…” by choosing a position along a bipolar 7-point ordinal scale. The 10 items were polar opposites, including “Important / Unimportant,” “Boring / Interesting,” “Exciting / Unexciting,” “Fascinating / Mundane” and “Not needed / Needed.” For this data set, the five-segment solution emerges as the optimal choice. The segment profiles of those five segments reveal that there are strong response styles across all segments where respondents ticked answer boxes in a straight vertical line, for example, one segment uses only negative categories, another segment uses only positive categories and another one middle options only. The remaining segments only pick categories in between swaying to either the positive or negative side of the scale. As there were no well-profiled segments, the managerial insight from this data set seemed rather limited.
The concerning aspect of this finding is that the proportion of empirical data sets that contain natural clusters is very small. This has major implications for market segmentation analysis in tourism. It means that the assumption underlying most of the market segmentation studies that were published in tourism in the past—the existence of homogeneous market segments in the marketplace—does not hold in most instances. As a consequence, the common approach to segmentation analysis where only a single calculation is run for each number of clusters is very risky as it generates only one of many possible—not necessarily the best—segmentation solution.
The encouraging finding is that the proportion of empirical data sets falling into the constructive segmentation category is relatively low: only one in five data sets falls in this category. It is the constructive segmentation case that does not allow the data analyst to make any recommendations about which market segmentation solution is the best, thus placing much of the responsibility on the user who ultimately needs to decide which of the many possible solutions is the most promising in terms of the development of marketing activities.
The very high proportion of empirical data sets that display characteristics of the reproducible segmentation concept also has immediate implications for data analysts and managers using market segmentation analyses: to obtain the best possible results under the reproducible market segmentation concept, data structure analysis in the lead-up to the actual final grouping of cases is essential. Such data structure analysis provides critical input into decisions that need to be made, most critically the selection of the number of clusters. Cluster numbers that generate stable segmentation solutions should be selected.
Conclusions
Data-driven market segmentation analysis is critical to knowledge development in academia and market insight in tourism industry. Data-driven market segmentation is by its very nature exploratory. It is critical, therefore, that data analysts are aware of the nature of the data they are analyzing. This enables them to determine whether the segmentation solution they arrive at reveals natural segments, creates entirely artificial (random) segments, or whether the data contain some structure that allows one or more segmentation solutions to be identified repeatedly.
The present study set out to assess the risk of data-driven market segmentation studies in tourism leading to random market segmentation solutions and to recommend systematic stability analysis as a way to protect oneself from selecting such random solutions.
Based on an analysis of data-driven market segmentation studies published recently in the academic tourism literature, it has to be concluded that algorithm randomness is frequently controlled for, but sample randomness is not. As a consequence, the risk of random market segmentation solutions resulting is high, as high as 92%.
The analysis of the data structure of unpublished tourism survey data sets suggests that real market segments are rarely present in empirical data (6% of data sets). Only when real segments exist in the data can sample and algorithm randomness be ignored. The low proportion of such data sets means that systematic stability analysis is essential in the lead-up to data-driven market segmentation studies. Results from the stability analysis inform the data analyst and the user about whether natural segments exist, whether market segments can at least be repeatedly identified, or whether each repeated calculation leads to entirely different results.
The fact that naturally occurring market segments rarely exist is bad news because it puts most data-driven market segmentation studies at risk of generating random solutions. The good news which emerges from the analysis of unpublished tourism survey data sets, however, is that only about one-fifth of data sets lack any structure at all. This means that about three-quarters of data sets contain at least some structure—even if it is not cluster structure—which can be harvested to select segmentation solutions that are stable.
These findings lead to the following practical implications:
The nature of empirical data resulting from survey studies in tourism implies that the occurrence of natural market segments is unlikely. Tourists come in all shapes and forms, rather than in neat and tidy groups. As a consequence, it cannot be assumed that calculating one run of one segmentation algorithm will identify naturally occurring segments.
Running one single run of one segmentation algorithm is likely to produce one of many possible groupings—a “random” segmentation solution. Such random solutions are not a strong basis upon which to base marketing planning or knowledge development.
Data analysts can protect themselves by conducting systematic stability analysis to determine which segmentation concept their data fall into: natural, reproducible, or constructive. Data structure can be analyzed using the approach and the visualizations illustrated in this article, relying on bootstrapping (to counteract sample randomness), repeated calculations with different starting points (to avoid algorithm randomness), and repeated calculations with different numbers of clusters.
Segmentation results based on different segmentation concepts have to be interpreted differently. Natural segments can be interpreted directly; for reproducible segments it is important to inform the user that these are not natural segments but that they emerge repeatedly, thus offering some confidence. In the case of constructive clustering, the data analyst must disclose openly that there are many alternative solutions, all of which are essentially artificially created and that it is entirely up to the user which of those solutions offers the most strategic benefit to them.
Maybe most importantly: one single calculation is never enough in data-driven market segmentation.
The above recommendations have the potential of improving the quality of 1/10th of articles published in tourism, that is, those that use cluster analysis to derive insights (Mazanec et al. 2010).
The present study has two main limitations: (1) although every attempt was made to quantify the criteria as much as possible, the classification into each of the three segmentation concepts ultimately is still made by a human. It is possible that other human judges may classify one or the other data set in a different way. While this is a limitation, the key message of this study would not change. Even if 30% of the data sets would point to natural clustering, 30% to reproducible clustering, and 30% to constructive clustering, a data analyst would need to run multiple calculations to assess which concept is most suitable for their data. It is clearly not the case that the majority of data sets contain natural clusters. In future, it would be interesting to attempt to automatize this process. Automatization, however, would require a very large number of data sets that would allow validation of the automated rules. (2) The data sets used to answer research question 2 are all data sets collected by the second author. As such, they are inherently biased by the second author’s questionnaire design principles. Future research could extend the investigation of research question 2 to other data sets free of this systematic bias.
Footnotes
Acknowledgements
We thank the Australian Research Council for contributing to the funding of this study through grant DP110101347. The computational results presented have been achieved using the Vienna Scientific Cluster. We thank Friedrich Leisch and Homa Hajibaba for feedback on previous versions of the manuscript.
Declaration of Conflicting Interests
The author(s) declared no potential conflicts of interest with respect to the research, authorship, and/or publication of this article.
Funding
The author(s) disclosed receipt of the following financial support for the research, authorship, and/or publication of this article: We thank the Australian Research Council (ARC) for contributing to the funding of this study through grant DP110101347.