
Abstract
This article aims to examine the conjecture that geographic dispersal of visitors follows the power law using data on international visitors’ spatial distribution in Australia. Our finding suggests that as tourism market matures, the pattern of tourist dispersal tends to converge toward a specific power law distribution. The article provides estimates of this unique power exponent for each country and tracks its temporal evolution using a novel method. One of the key implications for sustainable destination management is that for continued tourism growth, large destinations need a large number of small peripheral destinations. Our findings also shed light on the rich research literature that is fundamental in developing a power law–based theory to guide our understanding of the mechanics underpinning the spatial evolution of tourism.
Keywords
Introduction
There is evidence that tourism, if managed well, can be an important channel through which sustainable development can be achieved. Geographic dispersion of tourists is often considered to be an important part of achieving sustainable regional economies. This is clearly the case in Australia where greater regional dispersal is stated to be a long-term goal for the Australian Government (2011, 5) because greater dispersal generates socioeconomic benefits such as income, investment, employment, as well as diversification of an economy’s base in the regions, while relieving congestive pressures in urban areas. Provided that tourism is accepted as an appropriate form of development by the society, greater geographic distribution of the benefits of tourism can also be consistent with the principles of sustainable development outlined in the Brandt report (United Nations 1987) because the greater distribution contributes toward intragenerational equity.
Thus, it is not surprising that government policies are aiming for greater visitor dispersal. In the Australian context, an example is the “regional package” in international aviation policy. To facilitate direct air services into the regions, the Australian government offers unlimited capacity rights to foreign airlines willing to provide direct air services to peripheral regions. These are commonly defined as regions outside the main four, most populous and busy, cities in regards to air traffic: Sydney, Melbourne, Brisbane, and Perth (Australian Government 2009). Similar international air services incentives are pursued in many other countries through more liberalized bilateral and multilateral air services agreements. Region-specific route development schemes also exist to stimulate the regional economy (Halpern and Graham 2015).
The importance of visitor dispersal is also evident in government funding of tourism marketing and data intelligence. Tourism Research Australia (TRA), for instance, provides research and information support to the tourism industry by providing market profiles and analysis. A recent report by TRA (2015) suggests that one of the best ways to encourage dispersal of Chinese visitors is to stimulate accompanied travel by Chinese family and friends living in Australia. Dispersal of Chinese travelers is particularly of concern because, comparatively, the Chinese market has been geographically concentrated; for instance, 25% of total Chinese visitor nights have been within the four gateway cities of Australia in 2012 (30% in 2000), whereas the equivalent figures for the USA and Germany are, respectively, 17% and 16%. Other government-sponsored services such as Australian Tourism Exchange Conference (ATEC) helps regional tourism businesses to gain greater access to distributors in home countries to maximize regional product dissemination.
Dispersal, regardless of how we conceptualize it, is more or less operationalized as a ratio- or fraction-based measurement (Koo, Wu and Dwyer 2012). For example, it can be expressed as a proportion of nights spent in regions outside the key urban centers. The latter can include main gateway cities into a country, as well as other concentrated tourism formations. If this is a way in which we measure it, then presumably, in the future the priority is to keep this ratio stable (if deemed to be at a point of good geographic balance) or increase it—in the case of low-dispersal markets. Specifically, this means we are interested in each tourism region’s market share of visitor arrivals/nights/expenditures and how the share changes over time. In order to gain a better understanding of regional dispersion, our article invokes the power law as a guide to help us understand how a social system, such as that of tourism, spatially evolves. Our interest in the power law echoes Ulubasoglu and Hazari’s (2004) argument that if tourist arrival patterns exhibit the characteristics of the power law then “for each country the number of tourist arrivals can be predicted from the rank of the country,” which “would provide an excellent and simple guide to estimating tourist arrivals without involving the principles of comparative advantage and price competitiveness in tourism” (p. 460). With a few exceptions, power law, in general, is not considered in tourism research. The study by Ulubasoglu and Hazari (2004) is one of very few studies known to the authors that attempts to harness the value of the power law to explain the spatial distribution of tourists.
It is surprising that despite its prolific status in physics and economic geography, the power law is rarely harnessed as a theory to guide our understanding of the spatiality of tourism at a national and sub-national level. The widely demonstrated success in describing and predicting the geography of population and cities (Krugman 1996; Gabaix 1999) is a justifiable motivation for considering the applicability of the power law in tourism. In the case of aviation-reliant tourism destinations, the need to funnel incoming and outgoing traffic into few central places typically results in the distribution of tourists that follows the spatial distribution of air transport network, which relates closely to the geography of cities. In fact, a greater concentration may be expected because the optimal number of large hubs from an air transport network perspective is often less than the number of large cities. However, there is also a counterbalancing (dispersion) force because tourism destinations, especially those with a focus on nature-based tourism, can be disproportionately represented in remote peripheries with a relatively small local population.
Against this background, our aim in this article is to examine the conjecture that the spatial distribution of tourists across regions of a destination (e.g., a country) follows the power law and to explore why there may be variation in the way the law applies to different inbound markets. To what extent is the dispersal proportion of an inbound market malleable via policy? If there is an underlying “law” governing the spatial evolution of tourist distribution, then is there a predictable pattern (and limit) to the geographic distribution of tourists? In addition to seeking verification of power law in tourist dispersal, we also seek insights into these questions.
Finding evidence of power law in intranational tourist flows will do much more than simply to extend the long list of the domain in which the power law is applicable. Although not a substitute for existing regional tourism forecasting methods (e.g., please see Zhou-Grundy and Turner 2014 for a review), an affirmation of the power law in tourist dispersal could benefit aggregate-level forecasting of spatial tourist flows, often useful at the level of medium- to long-term strategy formulation and planning. In the event the established methods fail, the power law–based information may be a useful supplement for medium- to long-term forecasts. Importantly, evidence of power law pattern in the geography of tourist flows will open up numerous avenues for theory development in tourism. In particular, the rich and well-established literature on the economic, statistical and physical mechanics underpinning the power law become relevant to the analysis of tourism, meaning that a theoretical foundation can be developed for predicting the geographic dispersion of tourists, as well as its likely development trajectory. Profoundly, if we can extend the logic of power law to tourist dispersal, then it will be suggestive that the small number of large destinations and a large number of small peripheral destinations must always coexist. Ultimately, such knowledge can further strengthen the way we harness, monitor, and evaluate tourism as one path toward sustainable development.
The article is organized as follows. First, we provide a precise definition of the power law and provide an interpretative survey of relevant literature. Second, we outline how we approached the task of empirically testing our conjecture that the power law can explain tourist dispersion in Australia. The ensuing section presents the finding that not only power law applies to tourist dispersal but also that the dispersal pattern from a particular origin country converges to a unique spatial pattern, the pattern that can be encapsulated by a corresponding unique power exponent. We then discuss the implications of the findings for developing policies to support tourist dispersal. The article concludes with some comments on future research direction.
Power Law in Tourism
The Power Law
Although rare, there are several studies that attempt to evaluate the efficacy of power law in the developmental pattern of tourism and tourist behavior. Knowing that the power law exists in the phenomenon of interest may give us clues on the mechanics that may be responsible for it by helping us more accurately define the parameters of the research problem. Before we introduce the power law in the context of tourism, we first briefly provide a precise definition of the power law and the related distributions, namely, the Pareto and the Zipf.
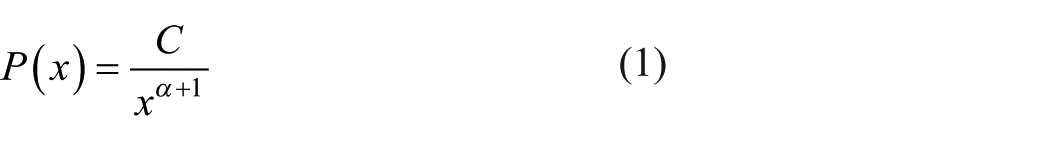
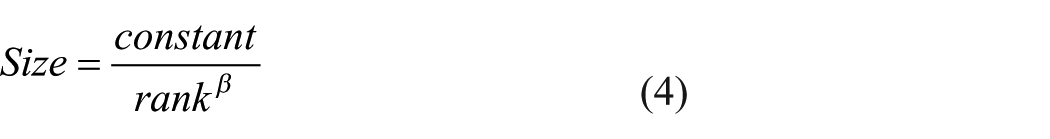
Mathematically, the power law can be readily summarized by a simple equation. In our illustration, we refer to a destination as the smallest spatial unit, followed by region and country. Equation 1 shows that the power law distribution (P(x)), which is a probability density distribution, is a function of constant (c), size (x), and the power law exponent (α + 1). In our study context, P(x) is the probability for a destination of size x to exist. It is a density distribution; thus, P(x) shows how visitors or visitor nights in a given country or region are distributed across destinations. Destinations can be delineated using politically and administratively salient boundaries such as the tourism region classification used by the nation’s statistics or tourism marketing bureau.
Finding evidence of the power law in data is extraordinarily common in natural and social sciences. Newman (2004) provides a survey of situations that power law behavior applies: the occurrences of word frequency in Moby Dick, citations of scientific papers, web hits, telephone calls, magnitude of earthquakes, diameter of moon craters, intensity of solar flares, intensity of wars, frequencies of family names, wealth of the richest people, and population of cities. Furthermore, it has been shown that the power law can be traced in financial market behavior (Gabaix, Gopikrishnan, Plerou and Stanley 2003), in occurrences of terrorism (Clauset, Young, and Gleditsch 2007), keywords used by tourists to describe China’s destination image (Pan and Li 2011), and much more. The findings described above suggest that it is reasonable to ask the question whether tourism dispersal, a geographic manifestation we know relatively little about, also follows this law.
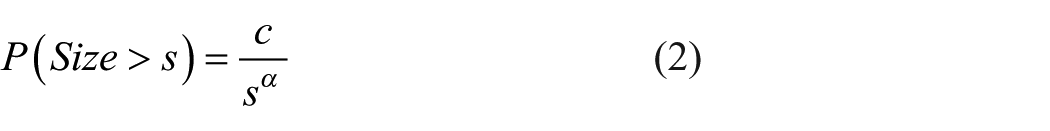
If the power law is valid, then Pareto distribution applies because the Pareto distribution is the cumulative density function of the power law distribution. Mathematically, the Pareto distribution is
To illustrate how common it is for the power law or power law–like distribution to come about, Figure 1 plots the rank and size of 100 hypothetical “seeds” with random growths iterated 1,000 times. As expected, a lognormal distribution results (Gibrat’s law 1 ). When the rank and size are log-transformed, the bottom portion of the plot has a close fit to a straight line (see Figure 2). A very close fit, measured by the high R-squared, is often considered to be evidence of power law in the research literature (e.g., Gabaix 2009). 2 The power law provides a very clear and accurate prediction of the size (e.g., visitor nights) of the rth ranked node (e.g., destination). Suppose that the size represents the number of visitor nights in a destination. The Pareto distribution of Figure 1 will show the cumulative density function of the visitor nights across destinations, that is, the proportion of destinations with visitor nights greater than s. This cumulative density function is also proportional to the rank of the destinations. The Pareto distribution has a parameter denoted α, which is equivalent to the α in parameter α + 1 in the power law probability density function in equation 1.
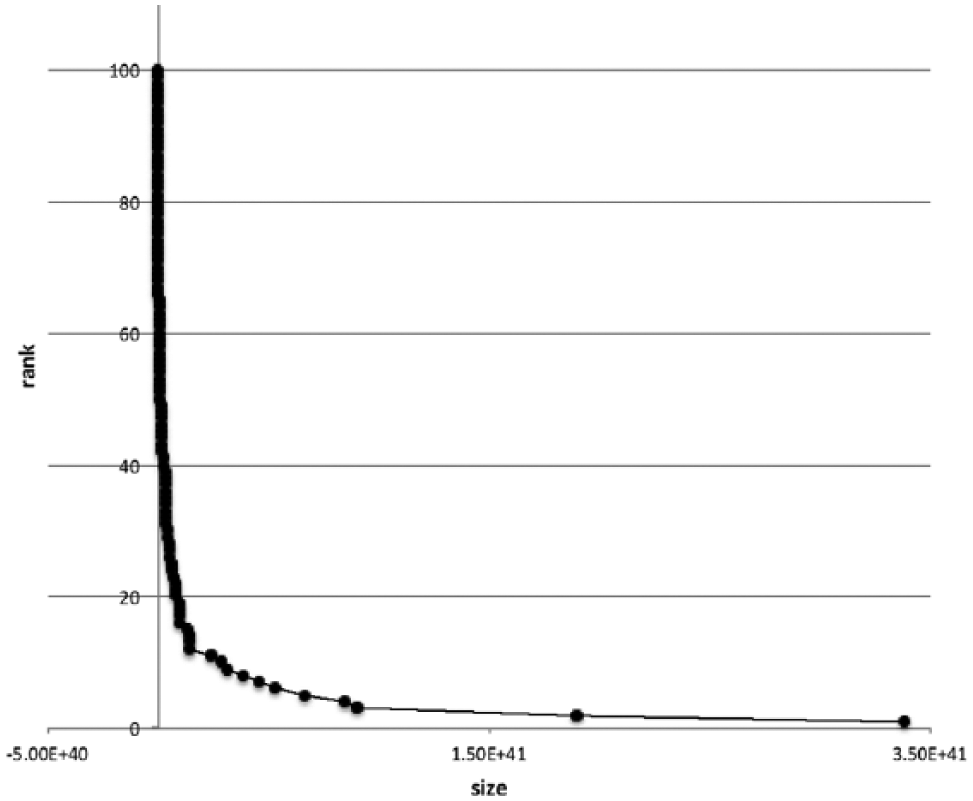
Lognormal distribution.
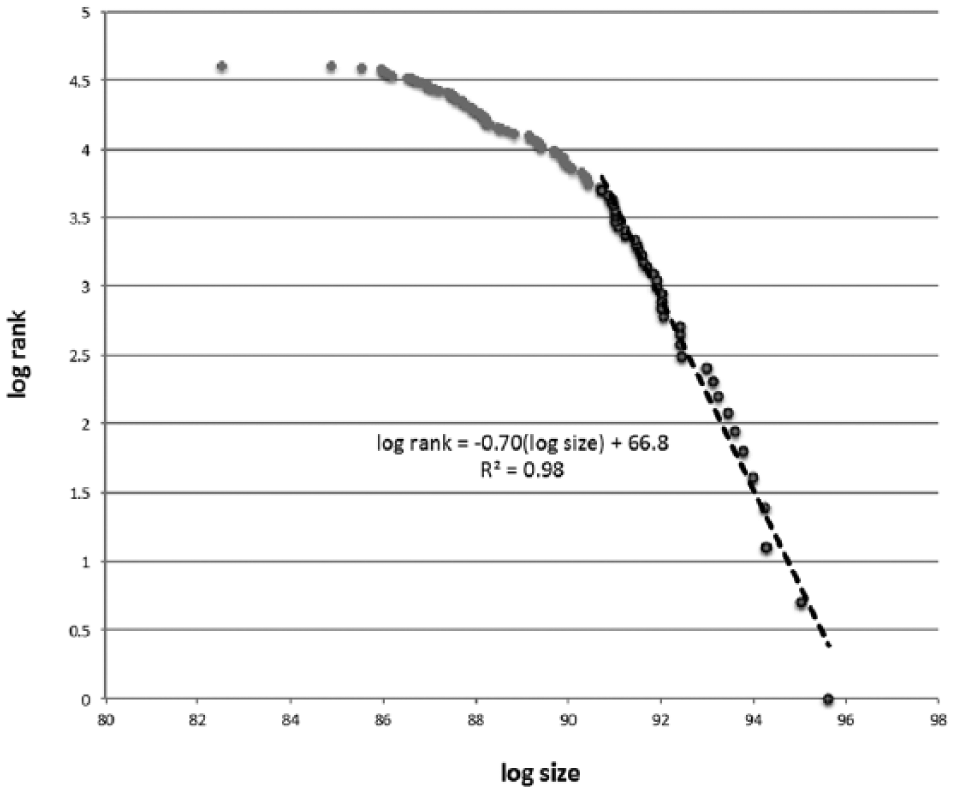
Log–log plot and the power law.
It is worth mentioning that the commonly mentioned Pareto rule, where 80% of some frequency (e.g., 80% of the total visitor nights in a country) is distributed among the top 20% rank (e.g., destinations in the 20th percentile), arises from a precise value of α, which is “1.1” (Newman 2006). The Pareto rule appears to apply to tourists’ distribution as a function of distance; for instance, McKercher, Chan, and Lam (2008) identify a classic Pareto relationship observing that 80% of international tourist departures are accounted for by 17% of total origin–destination pairs. When asserting Pareto principle, α of “1.1,” and by definition a power exponent (which is α + 1 in equation 1) of “2.1” is implicitly assumed. Finally, we note that the Pareto distribution is equivalent to the Zipf plot. The only difference is that the Zipf plot is a cumulative density distribution (the rank) against the size (visitor nights in our case), whereas the Pareto distribution is the size against the cumulative density distribution (the rank) (Newman 2006).
Interpreting Power Law in Tourism
One of the earliest applications of the power law to tourism was by Ulubasoglu and Hazari (2004). They ranked inbound tourist arrivals in 89 countries between 1986 and 1990 and found an almost perfect (98% of the variation) fit of the least-squares regression line. Miguéns and Mendes (2008) confirm the existence of power law using global tourist inbound and outbound data across 208 countries in 2004. In an intranational context, Provenzano (2012, 2014) found evidence of power law in the distribution of tourism accommodation (measured in a number of beds) across municipalities in Italy, Germany, and Portugal. Baggio, Scott, and Cooper (2010) show from a network science perspective that the network of linkages between tourism stakeholders in an Italian tourism town, Elba, follows the power law. Pan and Li (2011), using the keyword searches in Google, finds that the frequency distribution of the way tourism in China is described by users follows the power law, as well as its special case, the Pareto rule.
The study of the power law is important because it is a window into the statistical and physical mechanics underpinning them. Economic geographers and economists have been interested in the Zipf plot for some time. The key area in which power law is examined in economics and economic geography is the distribution of city and firm sizes (Krugman 1996; Gabaix 2009). They have been quite specific about their objective in regards to this: they proposed theories to explain why the coefficient is very close to “1” (otherwise known as the Zipf coefficient). There are mixed results on the applicability of the Zipf coefficient in tourism. Ulubasoglu and Hazari (2004) find a coefficient very close to one. Pan and Li (2011), approaching the issue of destination image from a linguistic perspective, finds evidence of the Pareto rule, which is suggestive of the support for Zipf coefficient. In a way, this result is a nice parallel to the original result by Zipf, who as a linguist, observed this regularity in the context of the frequency of words in the English language. However, other tourism studies (Provenzano 2012, 2014; Baggio, Scott, and Cooper 2010) cited in this article do not find the same results.
A rich source of information about the power law comes from physics, and this is indeed what Baggio, Scott, and Cooper (2010) show from a network science perspective. They note that tourism destinations resemble the characteristics of complex systems with a large number of (often nonlinearly) interacting elements, which react largely to local information. The system is thought to be often an open system and dependent on history. They note that the destination system evolves through reorganization phases, and although individual elements may be characterized by idiosyncratic behaviors, “the system as a whole may also be found to follow general ‘laws’” (p. 805). They explain that Butler’s destination lifecycle model is one such example where despite destination-specific peculiarities (and various critiques on the applicability of the lifecycle sequence) the model provides enduring insights about the evolution of a tourism destination. Against this background, Baggio, Scott, and Cooper (2010) illustrate that the distribution of the frequencies of links (e.g., membership lists) on nodes (e.g., tourism business associations) in the tourism-reliant island of Elba, Italy, follows a power-law. To be exact, they estimated the power exponent (α + 1) in equation 1 to be 2.32.
Self-organized criticality, due to Bak, Tang, and Wiesenfeld (1988), has been invoked by Provenzano (2012) as a potential explanation of the power law in the geographic distribution of tourism accommodation establishments in Portugal. Again, this means that the relationship between the number of beds across municipalities and the rank of the municipalities according to their number of beds can be accurately summarized by a log-linear relationship. Provenzano (2012) interprets the power law in tourism supply as an indication of complex systems that “self-organize” to be on a verge of instability—that small perturbations can cause the system to change form much like how the pile of sand can collapse as more sand is added to the pyramid-shaped pile. The implication is that the development of the inland destinations helps avoid and reduce already congested and deteriorating mature (and large) destinations along the coast while helping the entire tourism industry in the country to sustain a “more differentiated tourism supply” (p. 646). To use the sand pile analogy as has been done in Provenzano (2012), this means adding sand to the base of the pyramid, which strengthens the pile. Thus, the significance of observing the power-law in tourism may have an interesting policy and destination management interpretations.
In what follows, we aim to empirically examine the existence of power law pattern in the geographic dispersion of tourists. We then estimate the power exponent and devise a method to measure the exponent’s stability over time. Following this, we conduct a simple test to examine whether or not the power law in tourist dispersal has random growth theory as an underpinning mechanism—probably one of the more common processes proposed as an explanation in economic geography where city size distribution is concerned. We believe the research related to city distributions is the currently available literature most relevant to tourist dispersal. Finally, we discuss how the results help us forge new and different ways to think about the spatial distribution of visitors.
Methodology
Data
We examine the efficacy of power law in the context of a large continental destination, Australia. The spatial dispersal of international tourists is measured by the annual total visitor nights in each tourism region. The geographic information on each of the 80 or so tourism regions is available from Australian Bureau of Statistics (www.abs.gov.au). The tourism regions are spatial units of mutually exclusive boundaries used for tourism planning, marketing and governance by the tourism departments of States and Territory governments. International Visitor Survey (IVS) data managed by the government tourism research arm—Tourism Research Australia (TRA)—are used. Based on an annual sample of approximately 100,000 international visitors, the data are available in continuous series between 1999 and 2012 (inclusive) and can be spatially disaggregated at the level of tourism region by country of origin (aka inbound markets). The latter information (country of origin) enables us to examine country-specific power exponent if there is any.
To minimize the effect of sampling variability, the analysis focuses on Australia’s eight largest inbound markets by visitor nights: China, Germany, India, Japan, Korea Republic (“South”), New Zealand, the United Kingdom, and the USA.
Determining the “Cut-Off”
In Figure 2, it was shown that the power law applies only to a portion of the lognormal distribution; thus, there has to be a satisfactory explanation for the location of the cut-off. In the context of city sizes, this can be viewed as dismissing the very small towns, which are virtually indistinguishable from rural lands (Brakman et al. 1999). For tourism destinations, below the minimum point, “destinations” do not satisfy any of the important conditions necessary for them to be competitive. Such a destination can be interpreted as a location that does not have any access to the key elements of the destination competitiveness model (e.g., the elements in Ritchie and Crouch 2000, or Dwyer and Kim 2003). Thus, it is important to apply a scientific method to determine the cut-off. In the interest of flow, we provide a detailed explanation of the method we applied in choosing the cut-off in the appendix. Meanwhile, we note that the method has identified that the power law analysis should focus on the top 40 tourism regions in terms of visitor nights (also listed in the appendix).
Estimating the Power Exponent
To obtain the power coefficient (α in equation 1), we follow the common practice of fitting a straight line to the “log size–log rank” plot using the ordinary least squares (OLS) technique (e.g., Ulubasoglu and Hazari 2004). The cumulative distribution (Figure 2) is proportional to the rank of a region as shown in the following,

where
n is the rank of regions in descending order (i.e., 1 represents the largest),
N is the total number of regions, and
The rank-size regularity of the distribution is then
The slope
Moreover, it is known that the log-log size rank regression generates bias. Gabaix and Ibragimov (2007) proposed a way to improve the OLS estimation by subtracting the rank by ½ when fitting a regression line. Now the fitting becomes
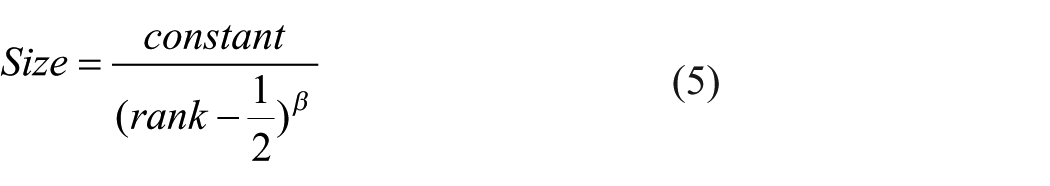
This is one of the simplest and most effective ways to estimate the exponents.
Evaluating Changes over Time
In order to gain a more complete understanding of the power law behavior, we examine how the power exponent evolves over time. If the exponent is stable over time, this suggests a constant dispersal proportion for that market, irrespective of the market size, that is, X% of visitor nights from country Y will “disperse” beyond the top Z cities. If the exponent changes over time, then it provides an indication that the dispersal proportion can change. If there is a pattern in the evolution of the exponent, then we can conclude that the dispersal proportion is converging toward a particular limit.
However, there is an important methodological issue in regards to evaluating the changes over time. The comparison of year-on-year least-squares estimates does not satisfy such an objective because the
In order to do so, the method needs to be able to establish a benchmark and consistently measure the “distance” of each distribution (e.g., the geographic dispersal of visitors each year) from the benchmark. The measuring method should be such that shorter distance indicates convergence toward the benchmark distribution. The convergence is suggestive of the existence of the inbound market’s natural limit to dispersal. This limiting distribution can be viewed as the inbound market’s unique power law exponent—the market’s dispersal characteristics summarized in a single number.
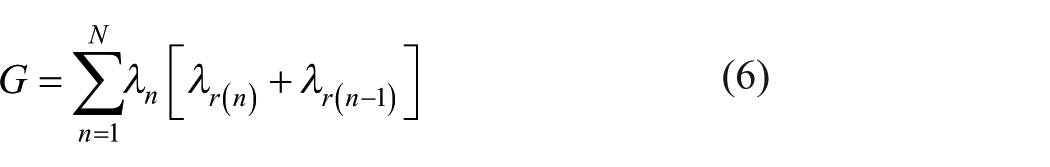
Gini coefficient is an ideal candidate for this task because it measures the area between the actual tourist’s distribution plot (the spatial tourism analogue of the well-known Lorenz curve) and a predetermined theoretical curve. The latter is usually the “equal distribution” curve and in our context is a scenario where each tourism region has an equal share of visitor nights. Thus, the Gini index calculates the deviation of a given curve from the theoretical “equal distribution” curve, that is, where visitor nights are spread equally across the 40 tourism regions. Obviously, the equal distribution case is unrealistic, and to directly measure the deviation of the tourist dispersal from its realistic benchmark, we replace the equal distribution line with the estimated power law distribution obtained from most recent data (the year 2012). This means that we modify the conventional Gini index as follows:
where
N is the total number of regions,
The above Gini is termed “relative Gini” in the economic geography literature (Combes, Mayer, and Thisse 2008) and has been adapted to encapsulate the spatial and temporal dependencies of airports (Koo et al., 2016). It mostly preserves the important properties of the conventional Gini index, for instance, scale invariance and the upper and lower bounds of 1 and 0. We examine the spatial evolution of tourist dispersal of each inbound market by tracking the relative Gini coefficients. If the coefficient approaches zero and remains stable, this is good evidence of convergence toward the market’s power law distribution. This is one direct method to quantitatively measure the conformance of the spatial and temporal evolution of tourist dispersal to the power law.
Results
Estimation of the Power Exponent
For each inbound market, OLS regression is applied on a “log-log nights rank plot” (log-rank plot, hereafter) of top 40 regions (listed in Table A1). Previous studies have used the
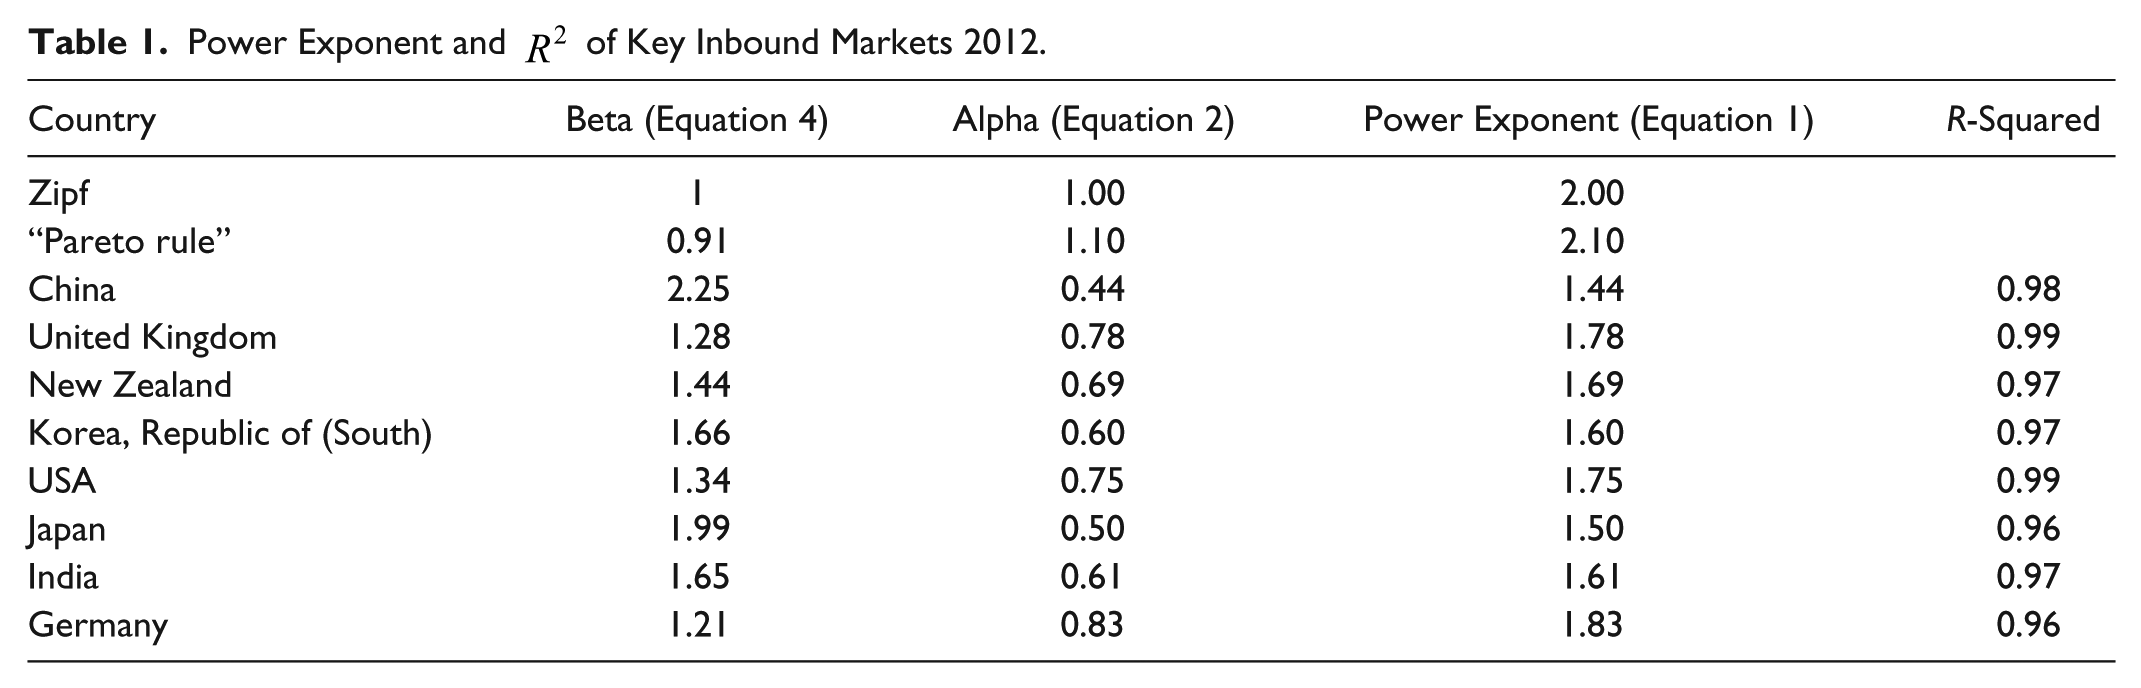
As shown in Table 1, unlike the spatial distribution of sizes of cities, for which there is evidence for the exponent (α) to be statistically equivalent to “1” in equation 2 (which means an exponent of “2” in equation 1 because the power exponent is α + 1), the coefficients obtained from tourism data vary from 1 and are country-specific. Thus, we confirm that while there is strong evidence for the power law, Zipf law does not appear to apply in the pattern of tourist dispersal in Australia. Furthermore, given that the estimated power exponent differs from 2.1, the commonly known 80–20 rule (that 80% of visitor nights occur in the destinations in the top 20th percentile) does not apply.
Power Exponent and
The log-transformed size-rank plots of the top eight inbound countries for 2012 are shown in Figure 3. The general observation that is persistent across all years examined (1999–2012) is that Western countries such as the UK, New Zealand, the USA, and Germany have relatively even (or “dispersed”) distribution (i.e. flatter slope coefficients), while Eastern countries such as China, Korea, Japan, and India have more concentrated patterns of distributions (i.e., steeper slope coefficients). Of note is the near perfect fit of USA (
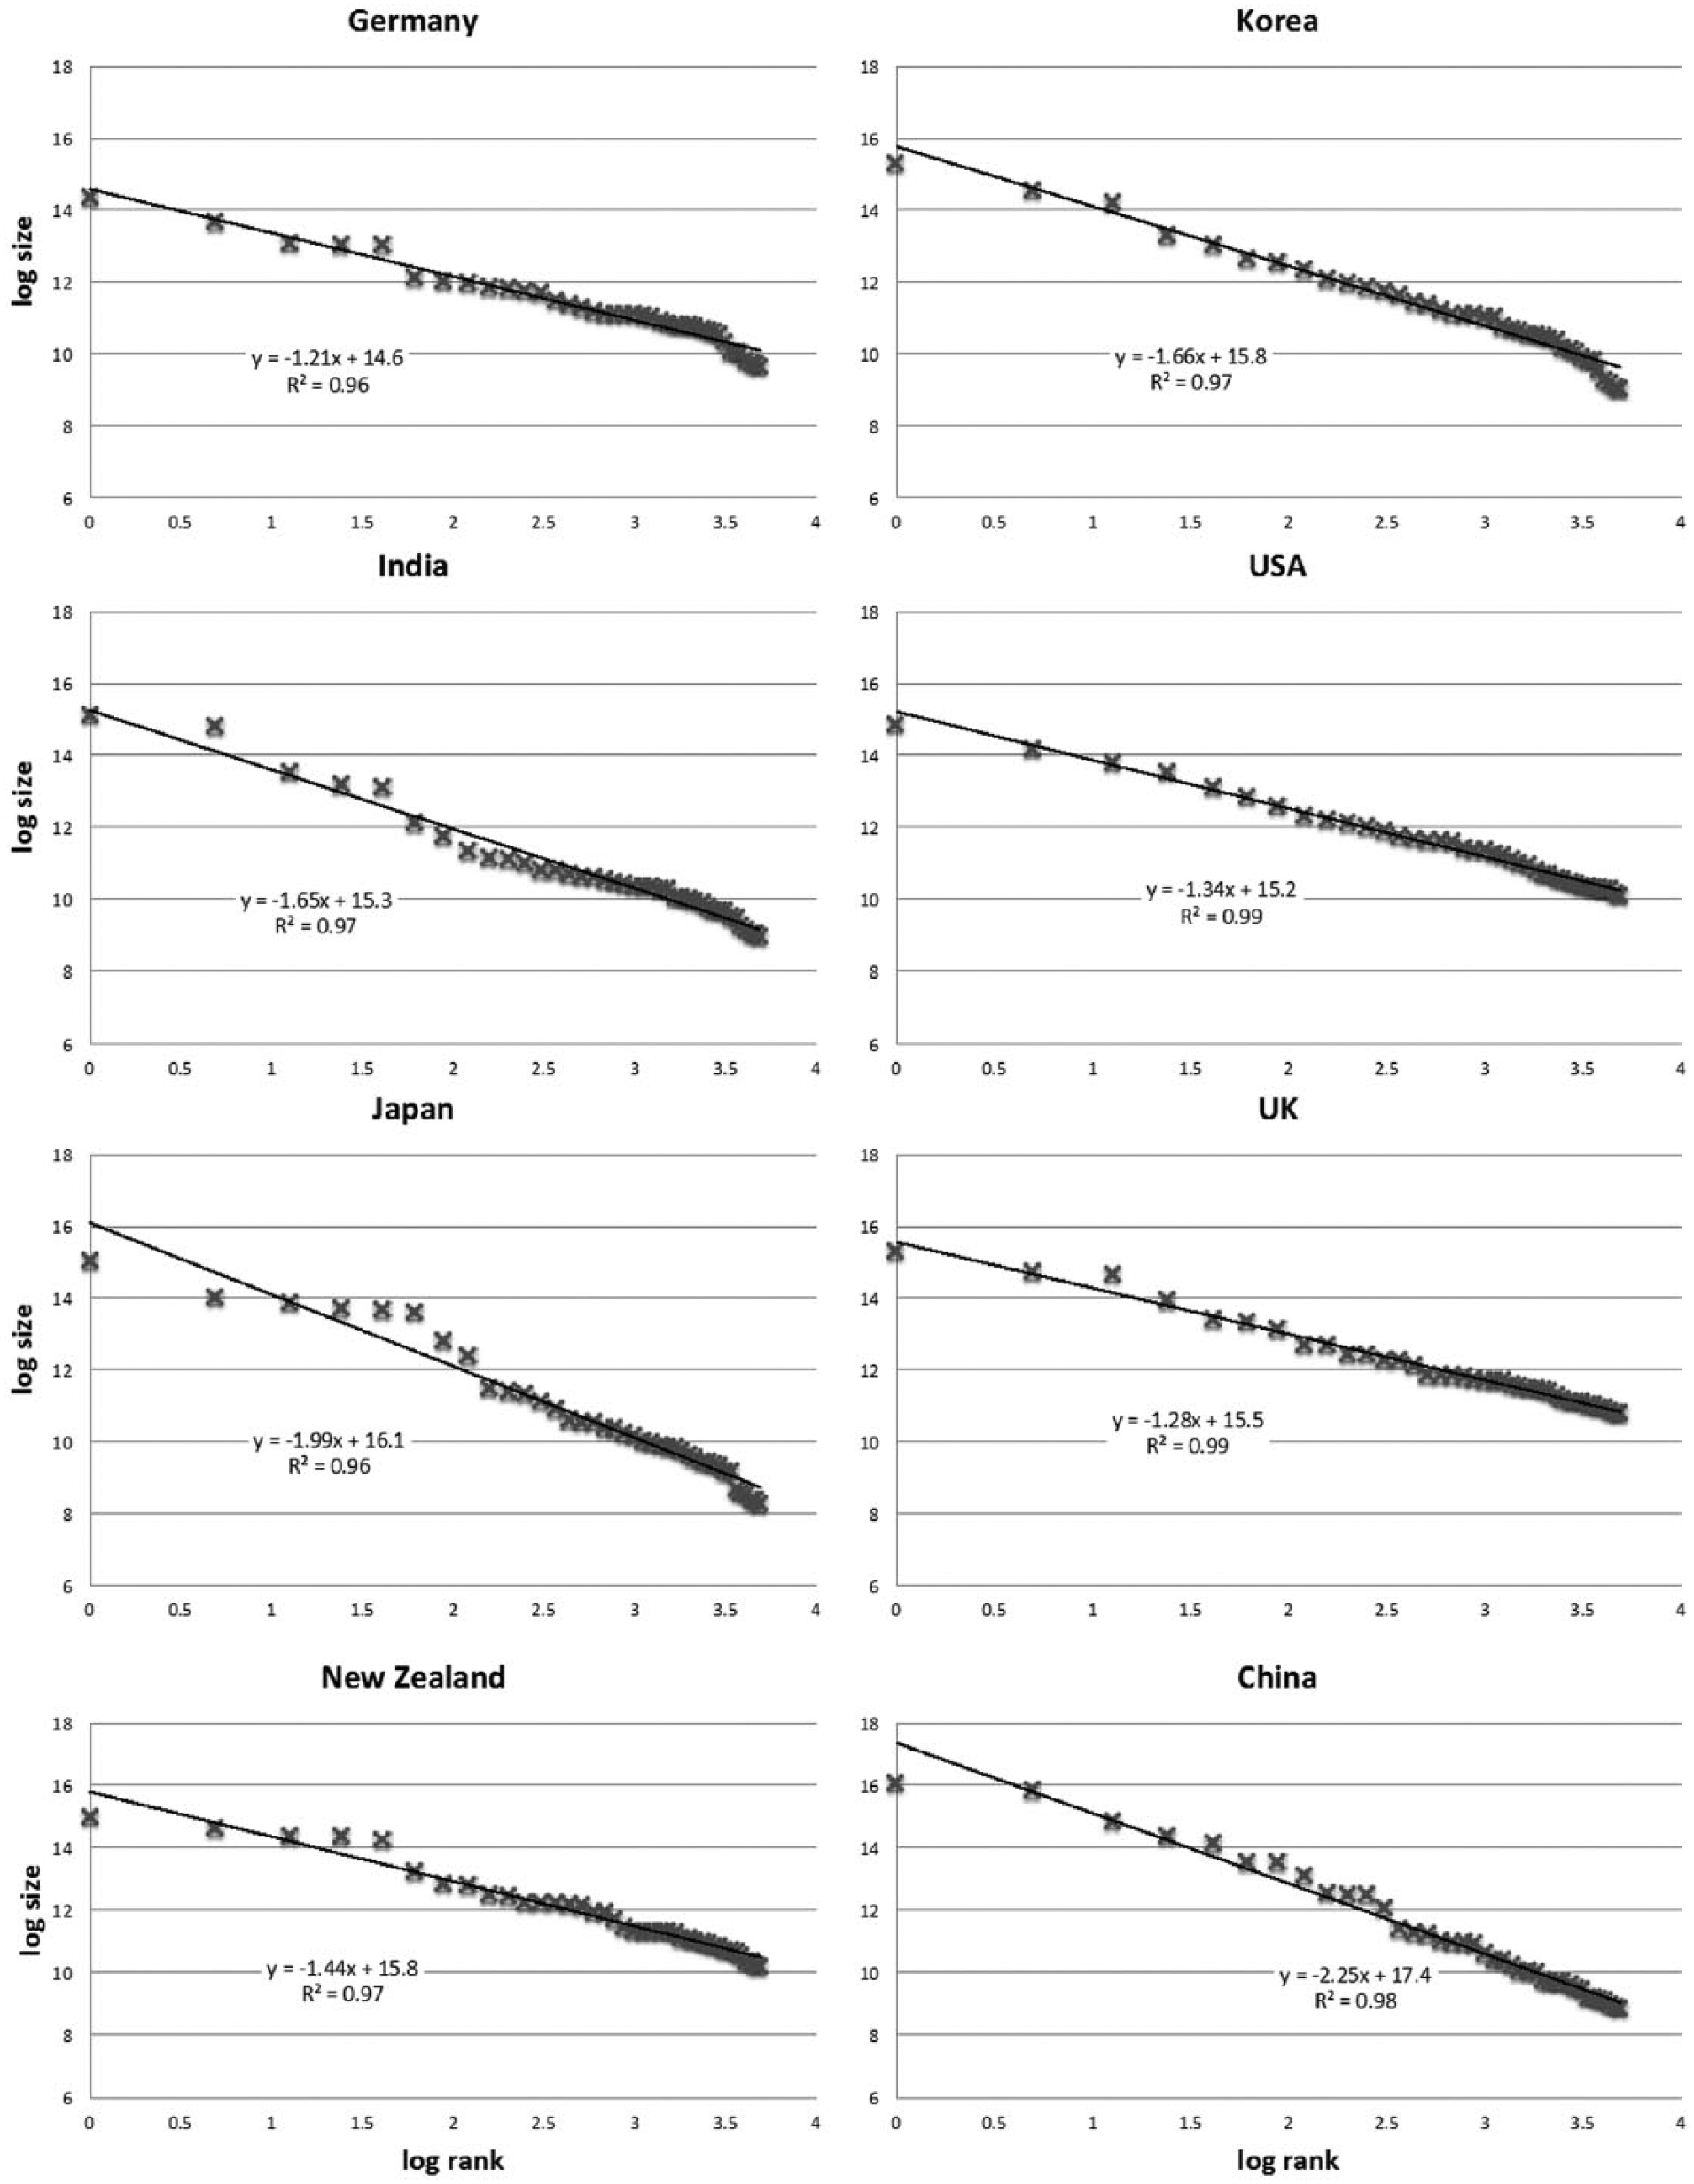
Size-rank plots in log scale and estimated
Of the inbound Eastern countries, China, India, and Korea can be viewed as tourism countries that have emerged relatively recently, with Australia becoming Approved Destination for Chinese leisure travelers in 1999. The four inbound Western markets can be regarded as mature markets in regards to their patronage of Australia as a tourism destination because of their longer bilateral tourism history.
Pattern of Dispersal over Time
The relative Gini coefficients of top eight countries of each year are shown below (Figure 4). Strictly speaking, these relative Gini are measuring the deviation between the distribution of a country in one year (say, China in 1999) with the ideal power law distribution, which is proxied by the coefficient obtained in the latest year of which the data are available (China in 2012). Using the best data available (1999–2012), it is verified that some convergence is occurring (the coefficients are decreasing over time), although the precise dynamics appear to be different for each inbound country. The convergence suggests an interesting idea that a group of visitors may have a certain power law exponent unique to that group. This unique numeric signature can be thought of as a term summarizing the innate and fundamental differences in dispersal propensities of each country. As discussed later, this “natural” dispersal propensity can change with important structural shift such as through strong policies and radical, innovative technologies.
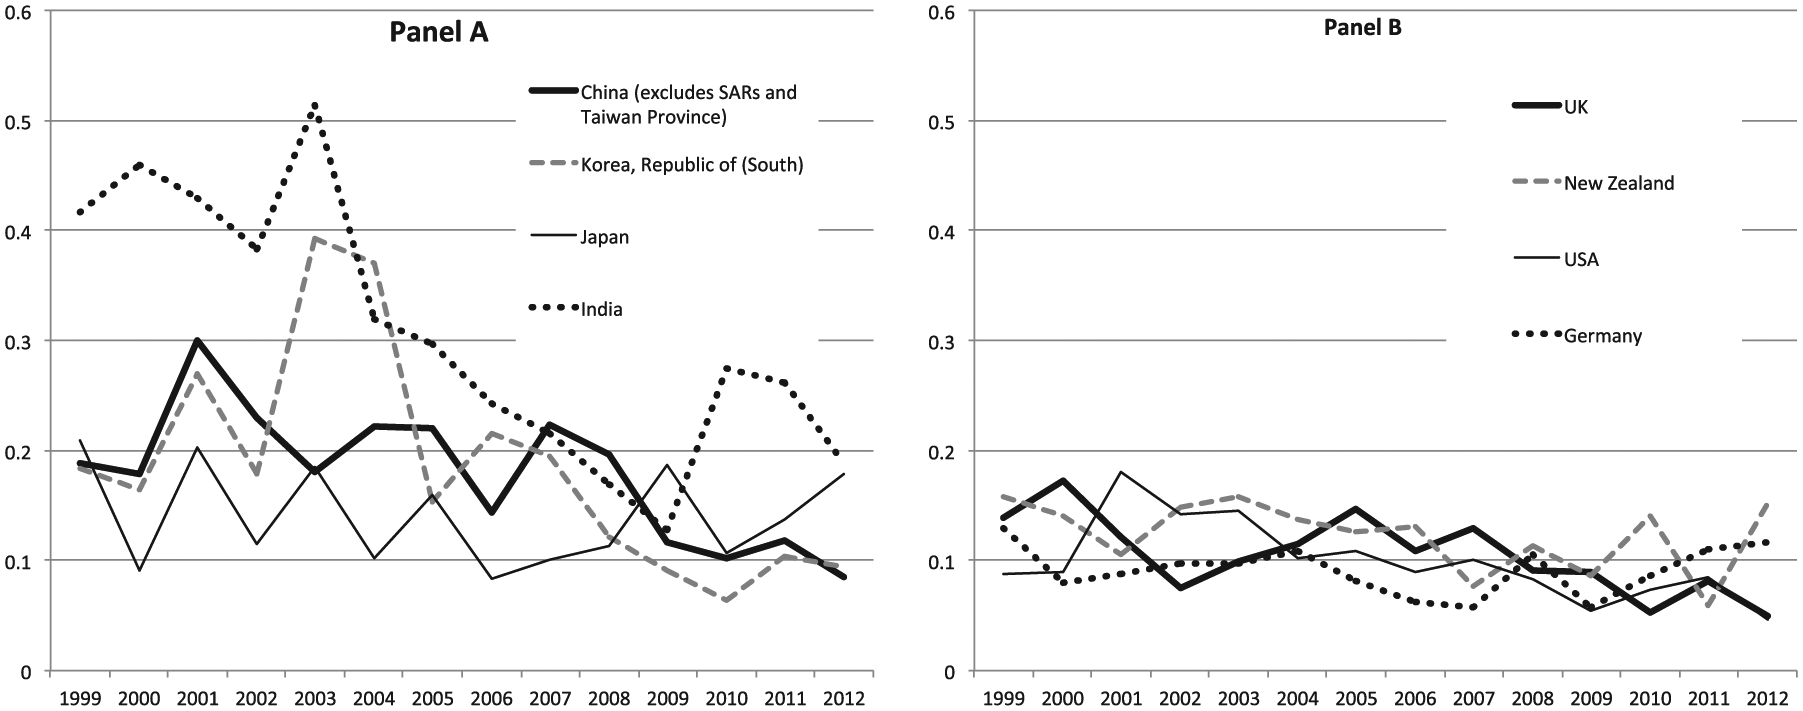
Power law over time (relative Gini coefficients).
Two patterns emerged: decreasing relative Gini coefficients (panel A); and relatively stable and low coefficients (panel B). It is clear that some countries are converging toward some value (a certain power exponent) while other countries appear to have already reached that value. An example of the former is China or Korea whose relative Gini coefficients are decreasing between 1999 and 2012, whereas the USA or Germany is an example of the latter with low and stable coefficients over the same period. Japan has relatively stable coefficients. It has been placed in panel A because the magnitude of the coefficients is more comparable to countries in that group.
Generally speaking, a relative Gini with stable coefficients over time suggests that the market has reached its maximum dispersal. The low Gini coefficient shows that the dispersal pattern is not only stable but it is also very close to a level of dispersal that is predicted by the power law. In a sense, one may conclude that the distributions of these countries have converged (or already very close to the limit) and a change in this pattern would require a major shift and innovation in technology or/and policy (see Discussion).
Contrary to the low and stable Gini cases, the emerging countries are yet to have fully revealed their signature power exponent. Clearly, this is the case for relatively new markets from an Australian tourism viewpoint: China, Korea, and India. The Gini drops from around 0.3 (0.5 for India) to approximately 0.1. For these countries, the dispersing process is likely to continue. There are markets, such as New Zealand and Germany, which have approached their dispersal limit, which is 0.15 and 0.12, respectively. Similarly, the UK and the USA, undergoing minimal dispersing process over the period examined, have 2012 coefficients of 0.05. Finally, the new markets such as China, Korea, and India are dispersing at a rapid pace and are yet to have converged to their limit in regards to dispersal.
Generally, there is a decreasing trend in the relative Gini coefficient. Because the relative Gini is based on deviations from 2012 pattern (which could mean an increase in concentration or dispersal), a decrease in the relative Gini coefficient is not automatically suggestive of dispersal. However, we can easily verify the direction of change (concentration or dispersal) by closer inspection of the data. For instance, one can examine the market share of the tourism regions with highest visitor nights against smaller destinations. Using this method, we can verify that the decreasing relative Gini coefficient is a result of greater dispersal in all eight cases.
Test of Gibrat’s Law
Because the research on power law and city-size distribution is the most relevant literature to tourist dispersal, we focus on the key explanations offered in that domain. To date, no satisfactory explanations exist in tourism. However, Gibrat’s law has been invoked by Ulubasoglu and Hazari (2004) in their appraisal of the global distribution of tourists. Following their approach, we conduct an F-test to examine for evidence of Gibrat’s law, which states that growth rate of firms (destinations) are random around the same mean and variance. Therefore, the null hypothesis tested was “the mean growth rate of destinations is equal.” This test is applied to the 40 destinations used earlier (list available in the appendix). In addition, the destinations were split into two according to size (1st–20th, 21st–40th largest) and the test applied to each group independently. We obtained mixed results: the constant mean growth rate hypothesis (over 1999–2012) could not be rejected among the top 20 regions, but it was rejected among the 40 regions.
Ulubasoglu and Hazari (2004) found evidence of Gibrat’s law across the entire distribution of global destinations using the same method. More empirical tests are necessary to find more conclusive evidence on the applicability of Gibrat’s law in explaining the power law in tourism. Our results potentially highlight a key difference in underlying mechanics of the distribution of cities from that of tourism destinations. Tourist distribution is unique in that it is often determined by the distribution of natural and cultural attractions, which can be located in the periphery very distant from cities. Thus, the same factors affecting the agglomeration of the cities, which are of course relevant to shaping tourist dispersal (e.g., the presence of international airports, etc.), do not entirely account for other complications such as the spatial configuration of attractions. The latter may not be linearly related to the distribution of the population and cities.
Discussion
Implications for Destination Management
The key insight from our analysis is evidence that the growth of destinations occurs in a way that preserves the log-linear relationship between size and rank. Thus, one may view the straight line between log-size and log-rank as the “natural limit” to dispersal, assuming the underlying important factors such as major policy or/and technology remain relatively unchanged. Significant changes in these factors can change the slope of the straight line (the power exponent), reflecting the changes in the pattern of dispersal at the macro level. We observe that this log-linear relationship appears to have reached a very stable pattern for mature tourism markets. Thus, accurate prediction can be made on the market share of each destination with respect to the mature inbound markets because there appears to be less uncertainty about the slope of the line.
Does the fact that the power law applies render the goal of “greater” dispersal futile? If we accept the efficacy of the power law in this context, the implication would be that greater dispersal can be achieved as long as the power exponent decreases. For power exponent to change, however, the entire distribution must be affected. Figure 5 illustrates how greater dispersal can be achieved (illustrated by the shift to a flatter slope). Without the distribution-wide change, destinations can increase their market share, but this will occur at the expense of others (this is illustrated by the movement along the line rather than a shift). Because the power law is assessed using the rank, improving destination rank can be thought as a way of increasing market share of that destination. However, this does not necessarily mean there will be greater dispersal in Australia. In fact, the power law suggests that the growth of one destination will crowd out other destinations in a way that keeps the straight-line, that is, a spike in the growth of one region will result in the swapping of the ranks over time. Indeed, the rank of some of the prominent Australian tourism destinations has changed over time; for instance, Adelaide climbed two ranks between 1999 and 2012 at the expense of Gold Coast and Tropical North Queensland.

Power exponent and dispersal.
For greater dispersal to occur, as demonstrated by the decreasing relative Gini coefficients among emerging markets, the power exponent must be affected. Because dispersal proportion is a snapshot of the more general power exponent, dispersal proportion will remain constant if the power exponent does not change. This is evident in Table 2 where the fluctuations in the dispersal ratios are related to the fluctuations in the relative Gini coefficients (Figure 4). For instance, the minimum–maximum dispersal proportion has changed by at least 0.13 points among China, India, and Korea, whereas the equivalent figure is 0.06 among the UK, Germany, and the USA. The average dispersal proportion is also lower among the latter group as well. The relatively stable and low relative Gini coefficient conforms well to the stable dispersal proportion. An exception is NZ, which shows stable and low Gini throughout 1999–2012 but recording rapidly increasing dispersal proportion in the same period (by 0.09 points). This is because the significant dispersal of NZ visitors occurred in the 5th rank–8th rank destinations.
Dispersal Proportion of Key Inbound Markets, 2000–2012.
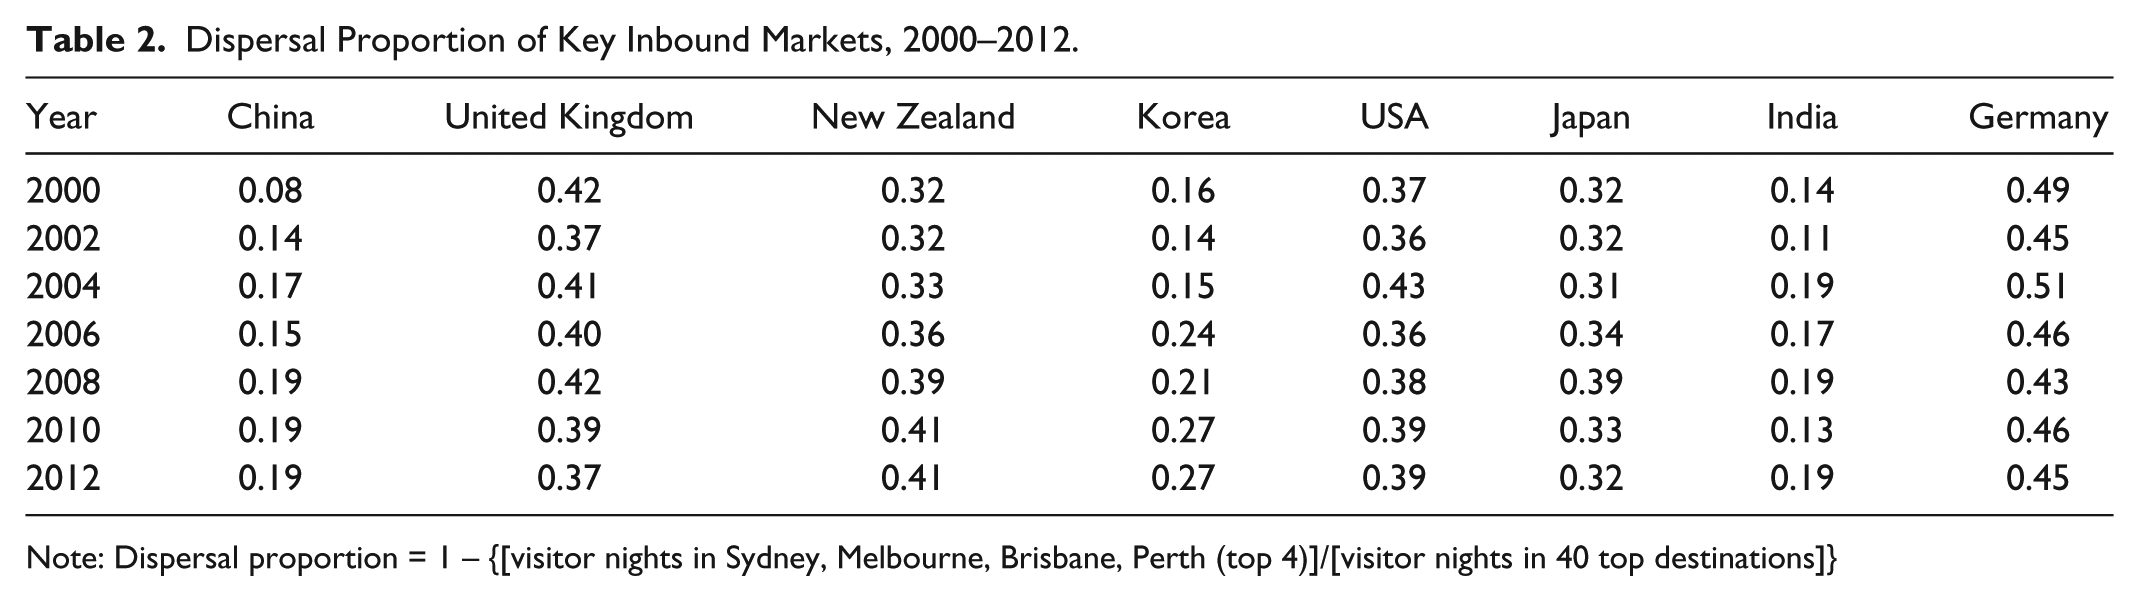
Note: Dispersal proportion = 1 – {[visitor nights in Sydney, Melbourne, Brisbane, Perth (top 4)]/[visitor nights in 40 top destinations]}
The power exponent can be affected as long as the entire distribution is affected. This means that a small number of large destinations and a large number of small peripheral destinations co-evolves akin to the earlier sand pile analogy, illustrating how adding sand to the base of the pyramid strengthens the pile. The large base represents a large number of small peripheral destinations, whereas the top of the pile represents the few number of large destinations.
In the tourism context, significant changes in the distribution may occur, for instance, if there is a major technological or policy-related change. Historically, technological revolutions such as the advent of railway and air travel have proven to change the pattern of dispersal by fueling mass tourism development, resulting in the emergence of top-tier mass tourism destinations. For instance, this has been the case with Mediterranean destinations with charter air travel (Papatheodorou 2004). During the industrial revolution era, it has been documented that the railway has resulted in the development of mass tourism in British seaside resorts by visitors from the industrial centers such as Manchester (Urry 1991). The advent of cruise ship tourism in certain parts of the Caribbean is another example. The development of long-haul aircraft technology has resulted in the bypass of Pacific Island destinations, resulting in a significant drop in the number of weekly services compared to other destinations (Bowen 2010).
Compared to other industries, aviation is heavily regulated (Holloway 2003). In this regard, the changes in aviation policy, in particular, the deregulating of the sector, can result in significant ripple effects. For instance, it is well documented that the proliferation of the low-cost carrier model, which is widely acknowledged as a consequence of deregulation of the aviation markets, has resulted in the emergence of second-tier airports and destinations (Meyer and Clinton 1987; Williams 2002; Dobruszkes 2006; Koo, Wu, and Dwyer 2010a). Indeed, in Australia some reconfiguration in the spatial pattern of tourist dispersal has occurred as a result of the innovations in the airline business model. The low-cost carrier model has increased domestic tourists’ regional dispersal to secondary destinations in Australia between 2001 and 2007 (Koo, Wu, and Dwyer 2010b). The long-haul low-cost model has been linked to the emergence of Gold Coast as a destination with low-cost international air terminal. Arguably, this is one of the important factors that has enabled the growth of Gold Coast as a tourism destination. It remains to be seen whether or not, and how, these human-induced structural changes (such as major changes in policy or technology) are compatible with the power law. However, at the macro level, we hypothesize that the human-induced structural changes can be captured by the changes in the power exponent.
Finally, in addition to the effect of technology and government policy, the evolution of travel motivations may be another important way through which power exponent may be affected. A key pattern of interest from a dispersal perspective is the influence of education-based travel. The education-based visits focus disproportionately on large metropolises—where the main colleges are located in Australia. For instance, 53% of Chinese visitor nights in 2012 were education related. The neighboring countries had much lower proportions (Japan, 24%; Korea, 24%; and India, 20%), although these are comparatively high when United States (17%), UK (5%), New Zealand (5%), and Germany (13%) are considered. Although it appears that the increase in the share of education decreases the dispersal of inbound markets, education is not the only travel purpose that has this effect. For instance, Chinese visitor nights are comparatively more concentrated among other travel purposes such as holiday and VFR as well.
Implications for Research
The economic mechanics offered to explain city size distributions (e.g., Gabaix 2009) appear to be a promising avenue for further research because of the expected correlations between tourism development and size of cities. Despite the evidence that the Zipf law holds in the city size distributions of many countries (Soo 2005; Giesen and Sudekum 2011; Soo 2014, etc.), our study found no evidence of Zipf law in the tourist dispersal pattern in Australia. However, significantly, we found strong evidence supporting the existence of the more general power law. An academic challenge is to investigate the statistical and physical mechanics that can explain the power law in tourism and human mobilities. To date, the literature concerning the power law in tourism has not done this explicitly. The study of the power law of tourism also provides a unique opportunity to develop further the mechanics put forward to explain city size distribution because of the interesting differences between the two distributions. For instance, distribution of natural and cultural attractions (called “locational fundamentals” or “factor endowments”), which is one of the important determinants of the pattern of tourist dispersal, may influence, but not necessarily align with, the spatial distribution of cities.
It is useful to consider our results in the context of sustainable development. In light of the fact that sustainable tourism is one aspect of sustainable development (Butler 1999), it is worth revisiting the question of whether or not tourism is the right path for the sustainable development objectives of many regions. As mentioned by Blackwell et al. (2011), the pattern of large become larger is at odds with sustainable tourism development. On the other hand, another interpretation of the power law suggests that large destinations cannot continue to grow without the supporting “base” of a large number of small destinations. For instance, large airports are supported by not just the demand to/from the city the airport is situated within but the demand from the wider region as well. The combined total demand will help the airport to capitalize on economies of scale, etc. Thus, there are important interdependencies between large and small cities, and these exist such that a large city requires several or many smaller towns and bigger hinterlands. For example, Melbourne is an important center for the residents of Geelong and Ballarat, including facilities such as international air services, a distribution point for imported goods and services, expensive surgery equipment, etc. The combined demand from Geelong and Ballarat (and many other smaller cities and towns) also contribute toward Melbourne’s capacity to achieve scale.
The correct interpretation of the power law in the tourism context requires much more work than that done here. As mentioned earlier, an important way this research can be improved is to examine the mechanics underlying the power law distribution. Also, more data and analysis are needed in order to assess the generalizability of our findings. This may take the form of an assessment of how the same inbound markets examined in this article spatially perform in other geographically comparable countries. Such work will not only provide further examination of the efficacy of the power law in tourist dispersal context but also equip policy makers with more scientific knowledge to make an informed decision on the role of tourism in the sustainable development of regions.
Conclusion
A more complete scientific understanding of the geographic distribution of tourists and tourism benefits is important from the viewpoint of sustainable tourism development and policy. The widely demonstrated success in describing and predicting the geography of population and cities is a justifiable motivation for considering the applicability of the power law in tourism. The prospect of exploring the relevance of power law in describing, explaining, and predicting patterns of tourism is very appealing. Using Australia as a context, this article has provided some evidence that while the Zipf law does not apply to tourist dispersal, the power law does. Thus, as demonstrated in the article, the rank is an excellent predictor of each destination’s market share of inbound tourism.
Importantly, using a novel method, the article has shed light on the possibility that a tourism market’s characteristic spatial behavior can be captured by a unique power exponent, and by implication, a unique “Pareto” rule. Furthermore, it was found that greater dispersal of a given inbound country can be achieved as long as the power exponent decreases. For power exponent to change, however, the entire distribution must be affected. Without the distribution-wide change, destinations can increase their size but only at the expense of others. Thus, enclave tourism growth strategies in the periphery will result in the swapping of the ranks but not necessarily greater dispersal.
The power law analysis has provided insights into the dispersal trajectory of key inbound markets. The relatively low dispersal propensities of emerging Asian markets deserve a closer look, especially given the Australian government’s recognition of the need to harness, and to build, the capacity to connect with Asia in what it has called the “Asian Century” (Australian Government 2012). Although too early to draw conclusions on the exact power exponent for emerging inbound countries, it is suggestive that the dispersal of these markets will continue into the future as the market matures. An important implication of the findings is that there is a need to push the peripheral Australian destinations into the awareness set of the inbound markets even though the overall visitation levels to these peripheral destinations are low. This is necessary to maintain tourist flows to the already popular destinations.
Finally, the key conceptual and practical challenges for the future is research designed to reveal hidden mechanics and processes that underpin the power law behavior in the geography of tourism. One promising avenue for research cross-fertilization in this regard is the field of tourist behavior and economic geography. The study of the power law of tourism also provides a unique opportunity to develop further the mechanics put forward to explain city size distribution because of the interesting differences and similarities between the spatiality of tourism and that of cities. Further work is required to examine the applicability of the power law in tourism and what this means for destination competition. It is anticipated that there will be a variation in the way the power law applies to different market segments and spatial scales.
Footnotes
Appendix
Acknowledgements
The authors would like to thank Tourism Research Australia (Austrade, Australian government) for providing the International Visitor Survey data used in this article. We would like to thank the anonymous reviewers for their helpful comments and suggestions.
Declaration of Conflicting Interests
The author(s) declared no potential conflicts of interest with respect to the research, authorship, and/or publication of this article.
Funding
The author(s) received no financial support for the research, authorship, and/or publication of this article.