
Abstract
The power law is considered one of the most enduring regularities in human geography. This article aims to develop an understanding of the circumstances that may result in the power law distribution in the geography of tourism activities. The finite Polya urn process is adopted as a device to model the preferential attachment process in the flow of tourists. The model generates a rank-size distribution of tourism regions along with intuitively appealing parameters. Empirically examined using two independent sets of Australian inbound and outbound tourism data, results show that the rank-size distribution emerging from the finite Polya urn process is a superior fit to the conventional power law curve. This rank-size distribution (termed the Polya urn process model of visitor distribution) is compatible with tourist behaviors such as habit persistence and word-of-mouth effects, and can be adopted by tourism modelers to predict and efficiently summarize the spatiality of tourism.
Keywords
Introduction
Although it is rare in the social sciences to refer to something as a “law,” several empirical regularities appear to be so pronounced that they come close to being laws of human behavior (Tobler 2004). An example is the Zipf’s law (a special case of power law). Zipf’s law is regarded as one of the most persistent observations in economics (Gabaix 1999), and it has been proven not an outcome of statistical tautology (Krugman 1996; Gabaix 2009). In tourism, the relevance of the Zipf’s law, and more generally the power law, has been investigated in the context of the distribution of the tourism industry (Provenzano 2012, 2014), network structure among tourism actors (Scott, Baggio, and Cooper 2008; Baggio, Scott, and Cooper 2010), destination image and keywords (Pan and Li 2011; Stepchenkova and Li 2012), and intranational geographic concentration and dispersion of visitors (Koo, Lau, and Dwyer 2017). Some researchers have approached power law and tourism from a complex network and statistical mechanics perspective (Miguéns and Mendes 2008), while Ulubasoglu and Hazari (2004) investigated the power law in international visitor arrivals from an economic geography perspective.
The power law, also known as the Pareto distribution and rank-size rule in the literature, states a log-linear relationship between ranks and sizes of units in a distribution. In the tourism context, the power law could be used to describe, for example, the rank-size relationship of tourism destinations where the size refers to the number of the visitor (nights). The rank-size distribution of the international visits among tourism regions in Australia in 2012 is displayed in Figure 1, which is a classical rank-size plot for the power law. The 40 largest tourism regions, which account for 97% of the total visitor nights, appear to obey a log-linear rank-size relationship with an almost perfect
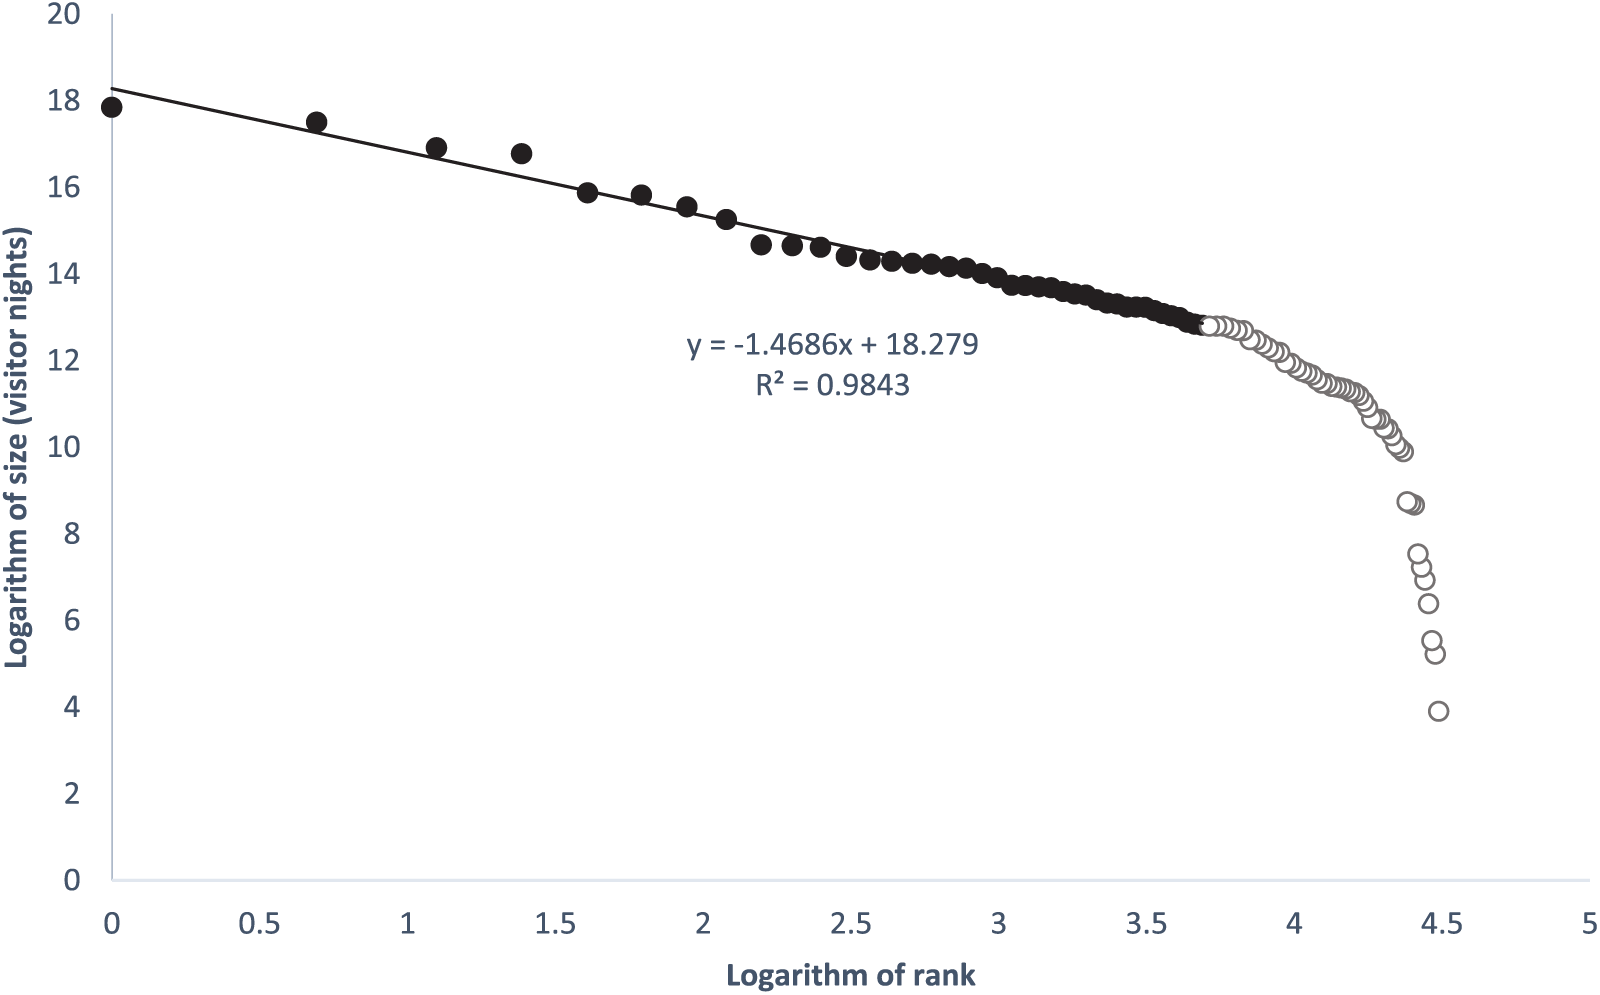
The rank-size distribution (in logarithm scale) of international tourists among 89 tourism regions in Australia in 2012. The black dots and the hollow grey dots correspond to the 40 largest regions and 41st–89th regions, respectively.
The power law is of interest in geography, economics, and statistical physics because of its persistence and useful theoretical properties. For instance, the estimated power law exponent can facilitate resilient network designs by analyzing the resilience of the network to shocks (Barabási and Albert 1999; Lordan, Sallan, and Simo 2014). In the context of international tourism, as noted by Ulubasoglu and Hazari (2004), the confirmation of the power law can “provide an excellent and simple guide to estimating tourists arrivals without involving the principles of comparative advantage and price competitiveness in tourism.” In addition, the approach can be a useful supplementary method to predict the spatial evolution of tourism development.
The verification of the power law could be straightforward but also ambiguous. In some scenarios, the power law could be statistically indistinguishable from other patterns in the tail distributions (Richardson 1973; Malevergne, Pisarenko, and Sornette 2005; Clauset, Shalizi, and Newman 2009). When the whole distribution is considered instead of just a part of a distribution, the validity of the power law could be more questionable (Rosen and Resnick 1980; Schaffar and Dimou 2012). The same issue exists in the power law fitting of Figure 1, where the 41st and smaller regions deviate from the log-linear fit and thus the power law. Therefore, it is possible for an analyst to falsely conclude the existence of a preconceived power law when, in fact, the underlying distributional pattern is something else.
Moreover, a theoretical mechanism to explain the observations of the power law is necessary and perhaps even more important than to obtain an appealing fit such as Figure 1. In many cases, despite a significant statistical fit, an identification of power law without mechanistic insights may be controversial, and the fitted parameter is “no more than anecdotal value” as noted by Stumpf and Porter (2012). Yet, seldom is a convincing mechanism proposed to explain the observations in tourism distributions. Although many power law studies in tourism observed the empirical regularity similar to Figure 1, there has been no analytical attempt to explain why this pattern arises (Koo, Lau, and Dwyer 2017). In fact, there is a range of well-established models for power law in other disciplines from which we can draw and adopt.
A popular theoretical mechanism adopted to explain the rank-size distribution is the Polya urn model family or, specifically, the preferential attachment process (Clauset, Shalizi, and Newman 2009). The Polya urn process models a situation that, given a number of existing urns, balls are added one by one repeatedly to one of the urns. The probability for each ball to be placed in an urn is proportional to the number of balls in that urn. The models examine how the distribution of balls among the urns evolves. Depending on the conditions and assumptions of the attachment process, these mathematical models can lead to various outcomes, such as monopoly, uniform share, power law, and others (Chung, Handjani, and Jungreis 2003). In the tourism context, this mechanism is a suitable device to model the situation where there is a preference for tourists to visit the destinations with more previous visits—by the same people or by others. Each ball is analogous to an additional visitor or additional night, while the urn is akin to a destination, which is mutually exclusive in every draw.
The above process is relevant for modeling tourism distribution because it is compatible with various situations known to be at work in tourist decision making, for example, word of mouth (Litvin, Goldsmith, and Pan 2008; Ye et al. 2011) and habit persistence (Bakkal 1991; Divisekera 2003; Song, Witt, and Li 2003), all of which refer to a degree of positive correlation between a tourist’s behavior and another. Most importantly, the Polya urn process can show how the power law emerges. However, there is a caveat. As proved mathematically by Chung, Handjani, and Jungreis (2003), the power law is an outcome of the infinite Polya urn process, where the number of urns (destinations in tourism context) is infinitely growing. On the other hand, the finite Polya urn process with a fixed number of urns will converge to an alternative distribution, which is different from the power law. As a mechanism, the finite Polya urn process is more appropriate for the study of spatial distribution of tourism demand because the number of destinations in a context such as Australia does not grow infinitely.
Thus, the article aims to apply the finite Polya urn process as a tool to explain the pattern in the geographic distribution of tourism activities. The article proceeds by establishing a mathematical expression of rank-size relations of the finite Polya urn process, which results in a distributional pattern different from the power law. We then empirically estimate the parameters of the rank-size equation of the finite Polya urn process using data on the distribution of international visitors across Australian tourism regions. As will be seen, rather than a power law, the empirical analysis reveals there is stronger evidence to support that the pattern observed in the geography of tourism is a “power law–like” pattern specifically attributed to a finite Polya urn process.
The contributions of this study are multifold. First, the developed Polya urn model of Visitor Distribution (“PVD” model) explicitly parameterizes the visitor distribution with self-explanatory parameters, which is absent in conventional power law studies in tourism. The parameterized rank-size rule may aid tourism modelers to summarize the spatial variation of aggregated tourism demand in simple but effective terms. Second, as will be seen, the rank-size rule equation developed in this article explains the variation in the data better than the conventional power law–based rank-size equation. Thus, the expected number of tourist visits can be estimated based on the rank of destinations with greater accuracy, which is useful for long-term forecasting of indicators of tourism sustainability such as tourism concentration and dispersion. Third, from a theoretical perspective, the model provides one potential microfoundational framework to represent the seemingly ubiquitous pattern in the geography of tourism activities. To our best knowledge, this is the first time such analytical framework has been devised specifically to explain the spatial distribution of tourism. From a tourism management perspective, the findings could provide new scientific insights into how destinations may increase their rankings.
Distribution, Mechanism, and Tourism
The Power Law
The power law and Pareto distribution (and Zipf’s law as a special case of power law) have been widely studied and identified in many phenomena in various fields (M. E. J. Newman 2005; Gabaix 2016). The power law is also often associated with the 80-20 rule in many phenomena (M. E. J. Newman 2005). An example with the frequent witnesses of the power law is city population (Soo 2005; Gabaix 2009; Giesen and Südekum 2010). Suppose there is a population composed of

where
With some mathematical manipulations, the famous rank-size rule is obtained (Gabaix 1999; M. E. J. Newman 2005). The rule is shown as follows:

The standard approach to validate a power law is to search for the log-linear relationship between the size and rank (or frequency). Once found, it often serves as primary evidence of power law. Researchers have also developed other advanced techniques to examine the validity of the power law (Clauset, Shalizi, and Newman 2009; Gabaix and Ibragimov 2011).
In the studies of the geographical distribution of tourism activities, the power law was investigated in the context of, for instance, tourist arrivals in different countries (Ulubasoglu and Hazari 2004), tourism supply of different sites in Portugal (Provenzano 2012), the lodging capacities of different destinations in Germany and Italy (Provenzano 2014), and tourist numbers in different tourism regions in Australia (Koo, Lau, and Dwyer 2017). Testing the applicability of the power law for a given phenomenon would be a convenient first attempt to study the rank-size distribution of tourism destinations. However, when various models of the mechanism are considered, we may realize that the power law could easily be confused with lognormal and other distributional patterns (M. E. J. Newman 2005; Clauset, Shalizi, and Newman 2009).
The Preferential Attachment and Polya Urn Process
Although the same law applies to many phenomena in various fields, the mechanisms accounting for the formation of the regularity can be different (Mitzenmacher 2004). M. E. J. Newman (2005) provides a survey of mechanisms relevant to power-law distributions. While some of those mechanisms are responsible for the natural phenomena such as distributions of moon craters and earthquakes, arguably the most relevant ones in explaining the patterns in the tourist distributions is the Yule (also known as preferential attachment and Polya urn) process.
There are various preferential attachment models available to explain the emergence of the power law in complex networks (Barabási, Albert, and Jeong 1999; Albert and Barabási 2002). For instance, Barabási, Albert, and Jeong (1999) developed a model to explain the power law observed in the distribution of links to pages on the World Wide Web. Starting from a single vertex, the network expands with a new vertex in every time interval in a random way but preferentially to the existing clusters according to the clusters’ size. As time elapses and the equilibrium is reached, a power law is formed in the distribution of connectivity. Such models are suitable for describing expanding networks or distributions with increasing number of members, for example, the distribution of species among genera represented by the famous Yule process (Yule 1925).
For cases with relatively stable or a fixed number of members such as the population distribution of cities in a country, the mechanism becomes less convincing because the number of cities is expected to be relatively constant over time. One attempt to apply the expanding preferential attachment model to explain the power law in city population is the model by Simon (1955). However, as Krugman (1996) and Gabaix (1999) argue, Simon’s model possesses some crucial problems: for the distribution to converge into a power law, the model requires infinite time. Furthermore, the mathematics requires the number of cities to be increasing at a rate comparable to the growth rate of the city population, which is unrealistic.
The inability of Simon’s model hints the problematic practice to adopt similar models to explain the power law in the phenomena with a stable number of nodes, and tourism distribution falls into this category, as one can expect new tourism destinations do not emerge rapidly in succession. The models with a growing number of nodes are just one branch of the preferential attachment model family. As discussed by Chung, Handjani, and Jungreis (2003), another branch of models with a fixed number of nodes are the finite Polya urn process, which will be the focus of this article.
Mechanisms Relevant to the Geography of Tourism Activities
One feature of the Polya urn process is “the rich get richer” mechanism as in many power law models. In our context, such a process may refer to the tendency of tourists to visit a destination that other visitors are also attracted to. Destination choice is a sociological as well as psychological process whereby the social groups are found to be able to reinforce, modify, and mold the motivation of vacationers (Crompton 1981; Pearce and Caltabiano 1983; Decrop and Snelders 2004). For example, the word-of-mouth effect could result in the convergence of decisions under various herding conditions (Banerjee and Fudenberg 2004). These behaviors are observed in a variety of context, ranging from selections between restaurants (Banerjee 1992) to decisions for investments (Scharfstein and Stein 1990). Given the growing importance of online channels, the term “e-word-of-mouth” emerged in online retail (Huang and Chen 2006; Doh and Hwang 2009; Moran, Muzellec, and Nolan 2014), restaurant choices (Zhang et al. 2010), and hotel booking (Ye et al. 2011). The main idea is that as more people purchase an item, more recommendations and experiences are shared, resulting in a greater number of clicks and searches, and so on, for the item. By receiving more information and seeing more “likes” for the item, other potential customers develop a higher chance to purchase the same product. Thus, the key mechanics is that, either intentionally or unintentionally, consumer’s choices could be influenced by one another.
In the specialist tourism literature, the influences of the word of mouth are observed in the choice of destinations. For instance, Song, Witt, and Li (2003) found that the demand for Thai tourism featured habit persistence and “word of mouth” effect in destination selection. Xiang and Gretzel (2010) confirmed the growing importance of online social media in supplying travel information and also confirmed that to an extent the information providers on the consumer side (e.g., other consumers) are overtaking the role of the traditional tourism channels. Litvin, Goldsmith, and Pan (2008) conceptualized the e-word-of-mouth in the travel product consumption, which is largely intangible and requires the others’ review for evaluations.
Another relevant behavior is habit persistence, which may be seen as the formation of the habit of re-consumptions of a product due to the past consumptions. In our context, habit persistence can represent the tendency for repeat visitations by an individual or groups and segments. Habit persistence is potentially compatible with the Polya urn process as it highlights that the travelers’ destination choices are related to their previous choices. There have been observations about habit persistence in the tourism literature. For example, in Bakkal’s (1991) study of West Germany’s international tourism demand, habit persistence was found to be one of the determinants of destination choice for those traveling to, for example, Italy. One conclusion was that vacationers might develop the habit of revisiting the same places if they are satisfied with the destinations. Divisekera (2003) applied a demand model to study inbound tourism demand from US, UK, Japan, and New Zealand to Australia. Relatively low price elasticity, which was considered as the impact of habit persistence, were found for the traditional destinations in Australia.
The word-of-mouth and habit persistence are examples that highlight the correlations between choices of one another. This means additional tourist visits are “preferentially attached” to destinations with more previous visits. The Polya urn model is able to capture these relations. Other tourist choice behaviors not mentioned above may also be compatible with the Polya urn model. Tourists can make their destination decisions based on one or more of these behaviors that, as long as the choices correlate to one another or satisfy “the rich get richer” principle, the decision process is consistent with the Polya urn model.
Polya Urn Model of Visitor Distribution (PVD Model)
The Derivation of the Rank-Size Rule
The preferential attachment processes consist of a wide variety of models with various configurations, characterizing the strength of attachment preference and the probability of establishing new nodes (Chung, Handjani, and Jungreis 2003; Collevecchio, Cotar, and LiCalzi 2013). The one with coherent constraints with tourism would be the finite Polya urn process. One application of the process was in the modeling of the explorative behavior of ants (Deneubourg et al. 1990; Shah et al. 2010). The forerunner ant explores the world from the nest randomly and leaves a trail of chemical pheromone. The latecomer ants then track the chemicals and possess a higher chance to follow them. Such a process could be analogous to tourist travels—the new visitors observe the footprints (i.e., information) left by the previous visitors and tend to follow them.
Suppose, at the initial state, there are
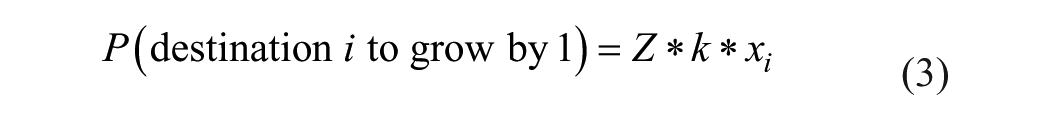
where
k is a proportionality constant, and
The equation states that the probability of a destination to grow by one night at each stage is proportional to its current size,
After
(For the details of the derivation, please refer to Appendix A.)
When

(For the details, please refer to Appendix B.)
In general, the PVD model states that if visitors choose the destinations following the rule stated by equation (3), the final size (the number of nights obtained) of

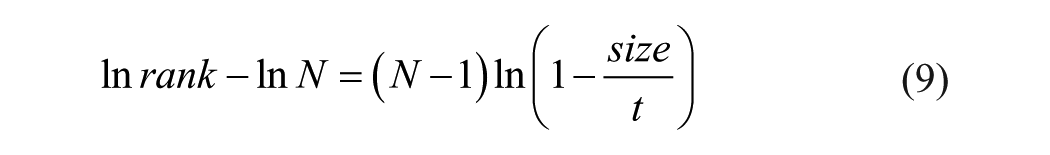
Following the traditional rank-size expression adopted to describe the power law, equation (6) can be written as

Essentially, equation (7) represents a “rank-size” rule, alternative to the one of power law as shown in equation (2). The rank-size relationship is governed by the two parameters,
Properties of the PVD Model
The PVD model formulates a set of reasonable assumptions at the individual level, which leads to a probabilistic spatial outcome at the aggregated level. The model does not lead to the power law, but an alternative pattern. The power law is known to have the problem of divergence (M. E. J. Newman 2005). From equation (1), it is evident that the predicted probability will be unrealistically large or even infinite when x is approaching zero and, thus, the probability density function is not normalizable. In the tourism context, very unpopular regions with few visits are considered as such small objects. This property implies there are infinitely many of such unpopular regions. This mathematical problem regarding small objects requires a lower limit of x such that all the “unwanted” predictions can be discarded. One common approach to achieve the truncation is to apply the Kolmogorov-Smirnov (KS) test (Goldstein, Morris, and Yen 2004), which was adopted to generate the rank-size fit in Figure 1 (and described in Koo, Lau, and Dwyer 2017). The inapplicability of the power law is usually explained by the statistical instability or the unimportance of the small objects. In comparison, there is no divergence problem for the PVD model. Inputting any x between 0 and
The rank-size rule given by the PVD model is parameterized by two parameters,
While the parameters in the PVD model carry naturally interpretable meanings, not all the power law studies do. Although some theories are developed to derive the power law parameters in some contexts, for example, network (Mitzenmacher 2004) and stock market (Gabaix et al. 2003), no similar work is established for the power law in tourism. Without a theoretical basis, the rank-size fitting of the power law in tourism studies lead to ambiguous parameters, particularly with respect to
Methodology
Estimation of Parameters in the PVD Model
The first step was to estimate the value of the parameters from the data such that the potential linear relationship between the rank and the right side of equation (7) could appear if such exists. Furthermore, whether or not the calculated values of the parameters can match the actual values of
In each iteration, the parameters
Estimation of
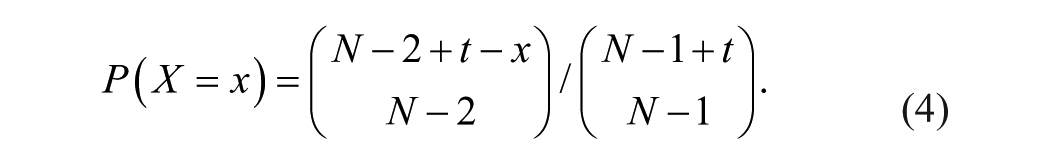
The likelihood function of the PDF in equation (4) is
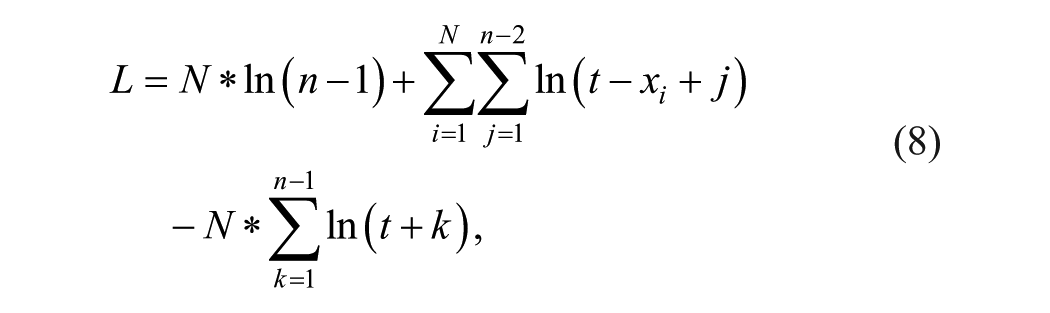
where
n is the fitted number of destinations, and
Given a value of
Estimation of
The logarithmic transformation of equation (7) yields
There were two ways to estimate
Data
The analysis was performed on the spatial distribution of international tourists across 89 tourism regions in Australia. The distribution was measured by the annual visitor nights in each mutually exclusive tourism region. The geographic information about the tourism regions is available from the Australian Bureau of Statistics (www.abs.gov.au). The International Visitor Survey (IVS) data, which is managed by the Australian government’s business unit, Tourism Research Australia (TRA), was based on annual samples of approximately 100,000 international visitors. The analysis in this article focused on visitor nights in each tourism region by country of origin and travel purpose for the year 2012. Additional validation of the PVD model was performed on the distribution of Australian residents’ outbound travel across different countries. The distribution was described in terms of the annual number of outbound visitor movements from Australia to each country. The distribution was based on the Overseas Arrivals and Departure (OAD) data, which was available from the Department of Immigration and Boarder Protection (DIBP) of the Australian government. The data were collected via the arrival and departure cards completed by passengers in international airports or seaports in Australia. The validation data set focused on the number of outbound movements by residents to each country of disembarkation, with the length of stay shorter than one year in the financial year ending 2014.
Results
Aggregate Distribution and Destination Groups
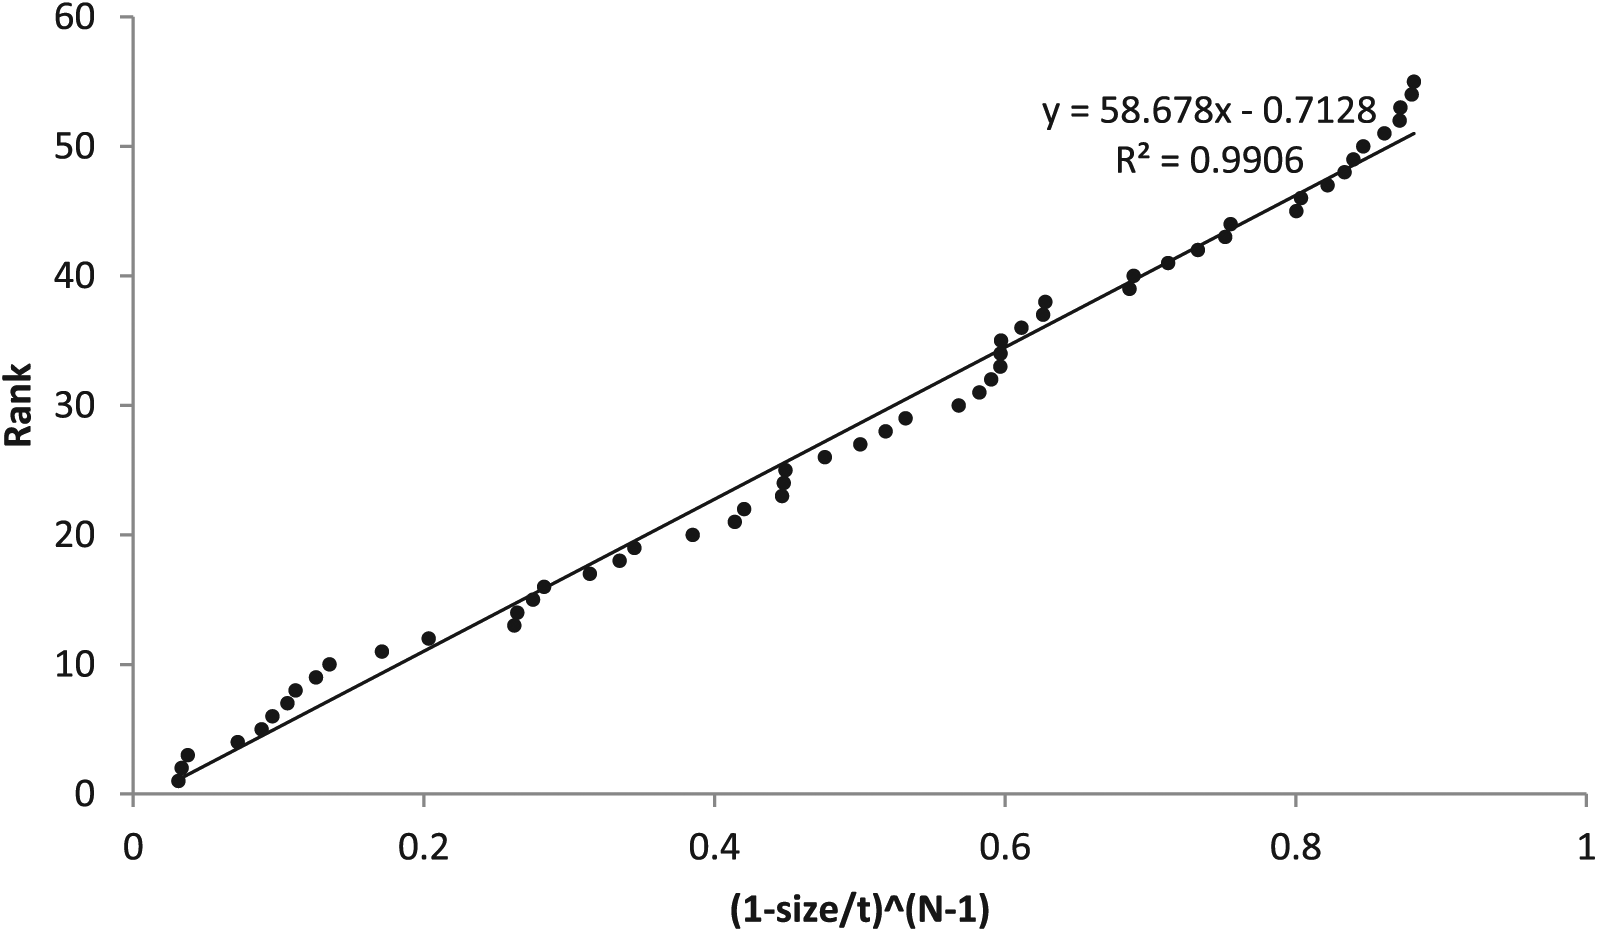
From equation (7), we can see that

The rank versus
The above observation was further verified when the actual size was compared with the expected size of destinations from the model. In Figure 3, the actual sizes of the top eight destinations are much larger than the predicted size, while the remaining destinations match the predicted size more closely. The curvature of the entire distribution suggests the existence of groups within which destinations are similar. This interpretation is comparable to the findings of destination clusters by Ulubasoglu and Hazari (2004), who attributes the existence of groups to destination attractiveness: destinations have a similar level of attractiveness within the group but not across.
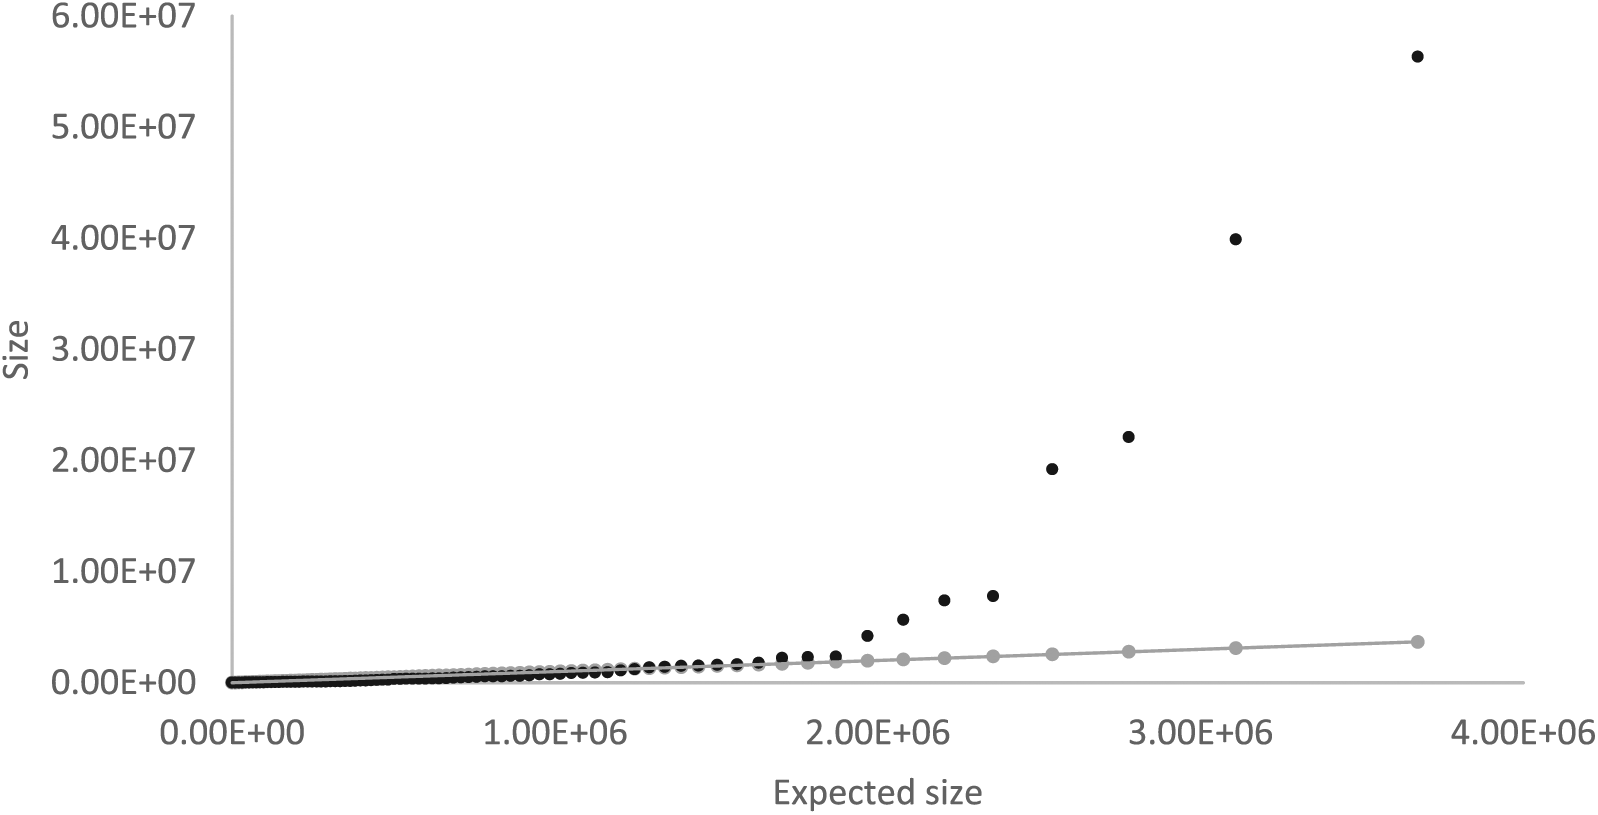
The actual size of destinations (black dots) and the expected size predicted by the model (gray dots with straight line).
Instead of one unique pattern that guides the entire distribution, on closer visual inspection of Figure 3, the 83 destinations were observed to be in three groups of different characteristics: (1) a large destination group including only the eight largest destinations (the destinations between rank 1 and 8 inclusive); (2) a middle-sized destination group, which is indicated by the straight line (the destinations between rank 9 and 63), and (3) a small destination group without a straight line (the destinations of rank 64 and above). 2 A natural extension was to apply the analysis to each group.
Figures 4 and 5 show that the distributions of visitor nights within group 1 and 2 destinations individually carry its own “straight line” with high

The rank versus
The rank versus
Distributions by Inbound Country and Travel Purpose
A further natural attempt would be to divide the aggregated data by inbound country as well as by travel purpose because we expect tourists with distinctive characteristics (i.e., country of origin and travel purpose) would behave differently in their travel decision making. It has been shown that there are Hofstede dimensions analog in tourism where nationality and cultural background of tourists affect their behaviors, including destination choice (Mihalik, Uysal, and Pan 1995). The spatial manifestation of cross-country differences in tourism can be seen in the variation in the power law exponents (Koo, Lau, and Dwyer 2017). One can use this fact in assessing the efficacy of the PVD model. Given the assumption it is built on, the PVD model, if it has some truth in it, is expected to better suit the behavioral pattern of tourists from collectivism-strong societies.
Travel purposes of tourists are also expected to have influences on their destination choice behaviors and thus their traveling patterns. The data used in the analysis combined visitors across multiple purposes including holiday, visiting friends and relatives (VFR), business, education, and others. It is imaginable that our assumption regarding choice behavior is more applicable to visitors with holiday purpose (because they have greater discretion as to where to go) but not, for example, those traveling for VFR, business, or education, whose destinations could be predetermined with limited flexibility. Because of the intangible nature of tourism, where the product cannot be experienced before purchase, visitors have to seek information prior to purchase. As marketing research has shown, the reliable sources of information for first-time visitors are through word of mouth and others including friends, the Internet, travel agents. Thus, we expect visitors on holiday to be most accurately represented by the PVD model.
Table 1 displays the destination grouping information for the visitor night distribution by holiday visitors from each inbound country. The number of destinations explored by visitors from Asian countries (29–55) was lower than that of Western countries (71–76). The finding is generally consistent with previous results about the geography of tourism activities where the nights spent by visitors from Asian countries were more concentrated than that of the Western countries (Koo, Wu, and Dwyer 2012; Lau, Koo, and Dwyer 2017). In the distribution of Japanese tourists, the top destination, Sydney, could not be grouped with the other group 1 destinations.
Holiday Travel Model Results: Destination Groups by Inbound Country.

As shown in Table 2, the model was found more applicable to Asian visitor night distributions across group 1 destinations, with closer matches between the actual and estimated values of parameters. The case of least-fit is the German visitors, where their night distribution did not fit the model. Precisely, the parameters did not converge to a stable value in the iterative fitting process, and hence no straight line was yielded for the plot.
Holiday Travel Model Results: Destination Group 1 Model Fit.
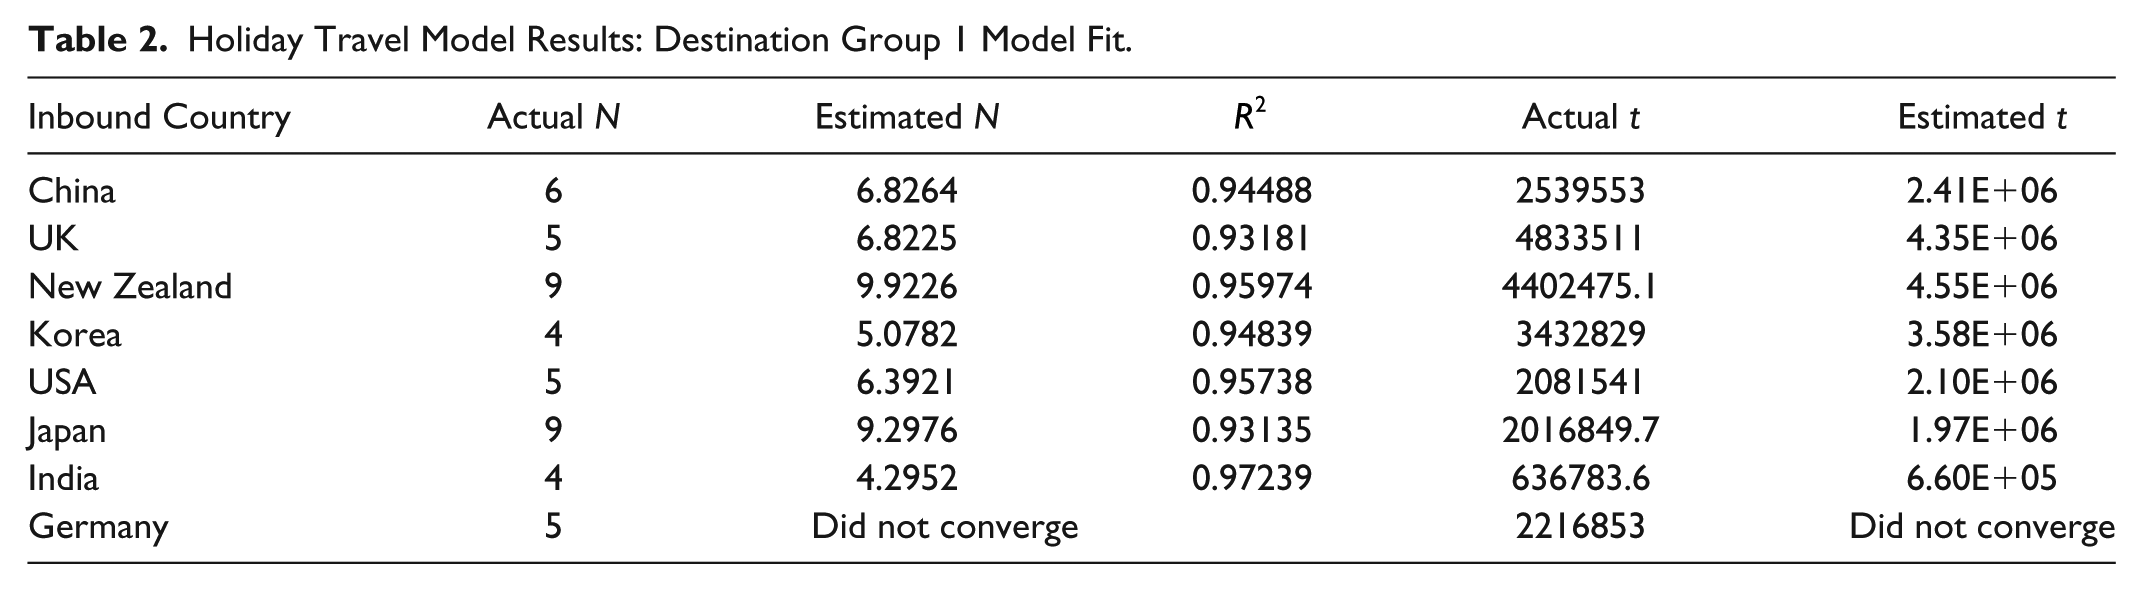
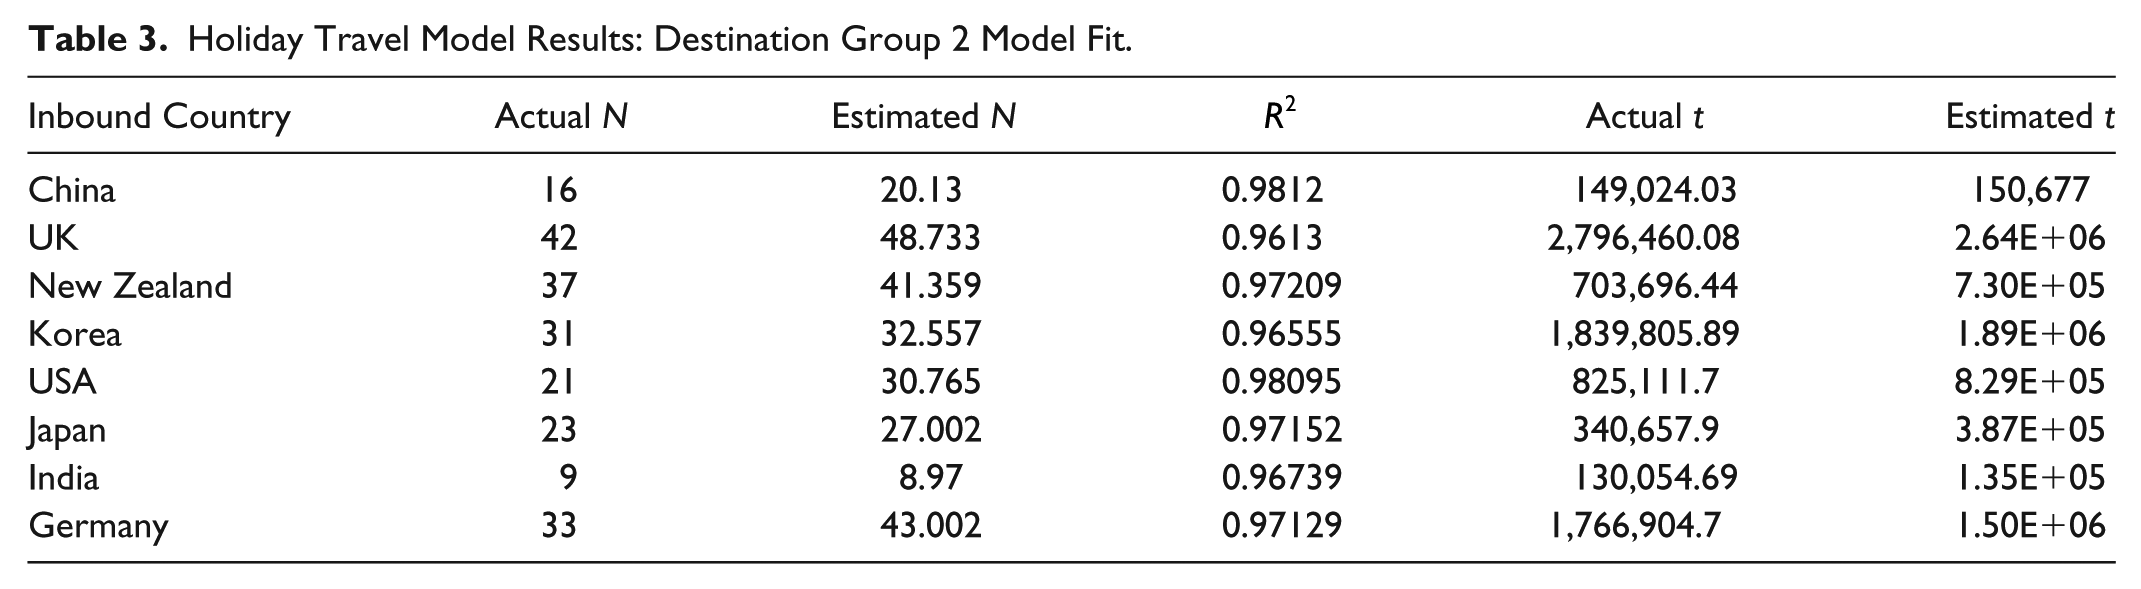
Table 3 indicates that the
Holiday Travel Model Results: Destination Group 2 Model Fit.
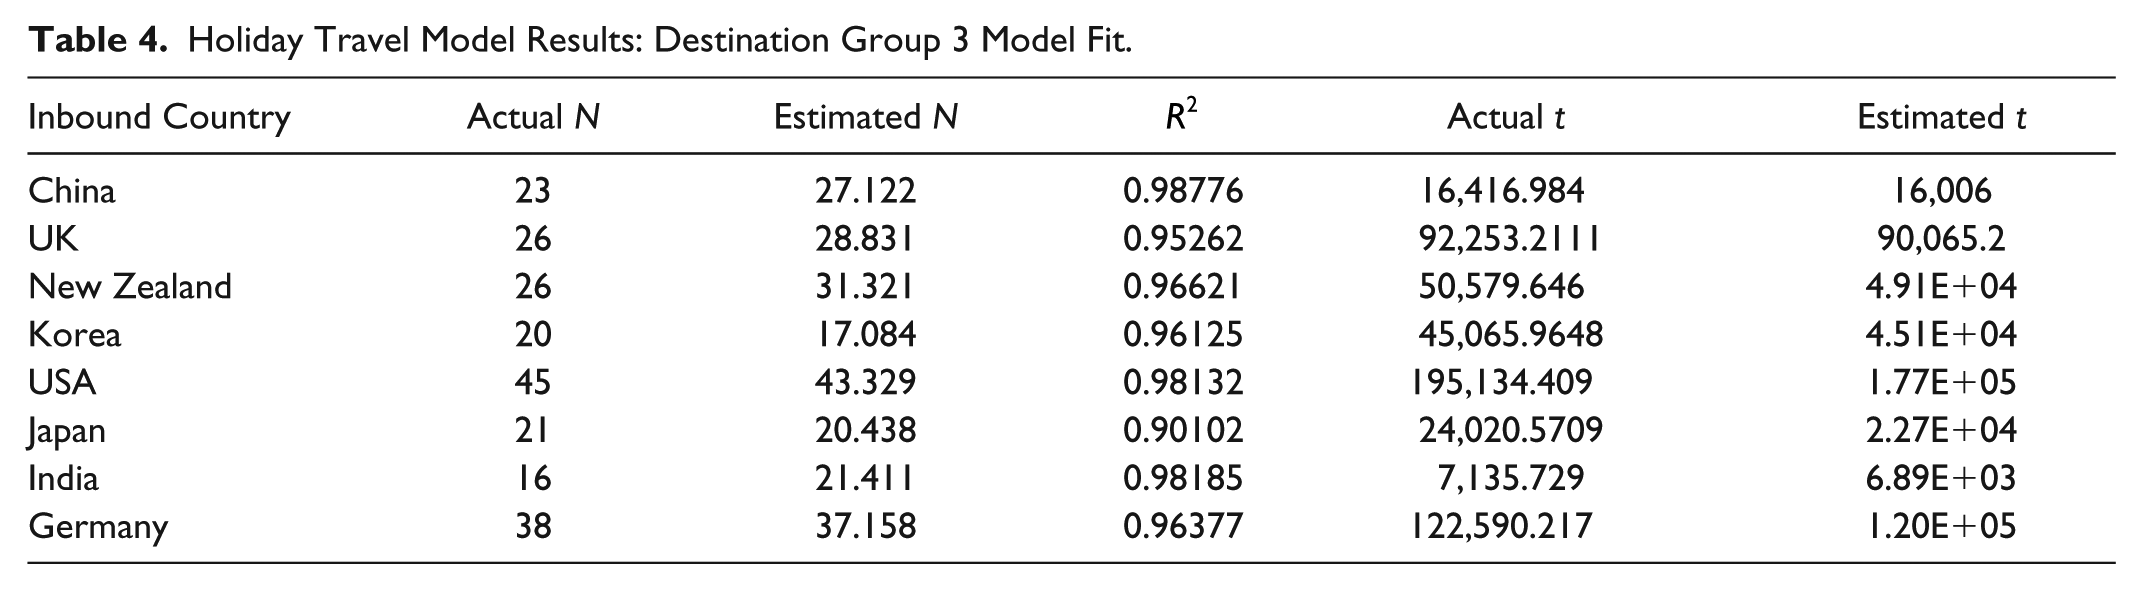
As illustrated in Table 4, the
Holiday Travel Model Results: Destination Group 3 Model Fit.
As shown in the results, the values of
Model Validation Set: Outbound Australian Visitors
The analysis was also conducted on an entirely separate set of data—outbound Australian travel distributions using data from the Department of Immigration and Citizenship. The “size” of a destination country referred to the number of Australian residents traveling outbound to the country in the financial YE2014 for a period less than one year. 3
The Australian residents traveled to a total of 144 countries in the financial YE2014. Holiday travelers visited 124 countries. Three groups were identified (the countries with the smallest numbers were excluded—with less than five visitors in the year).
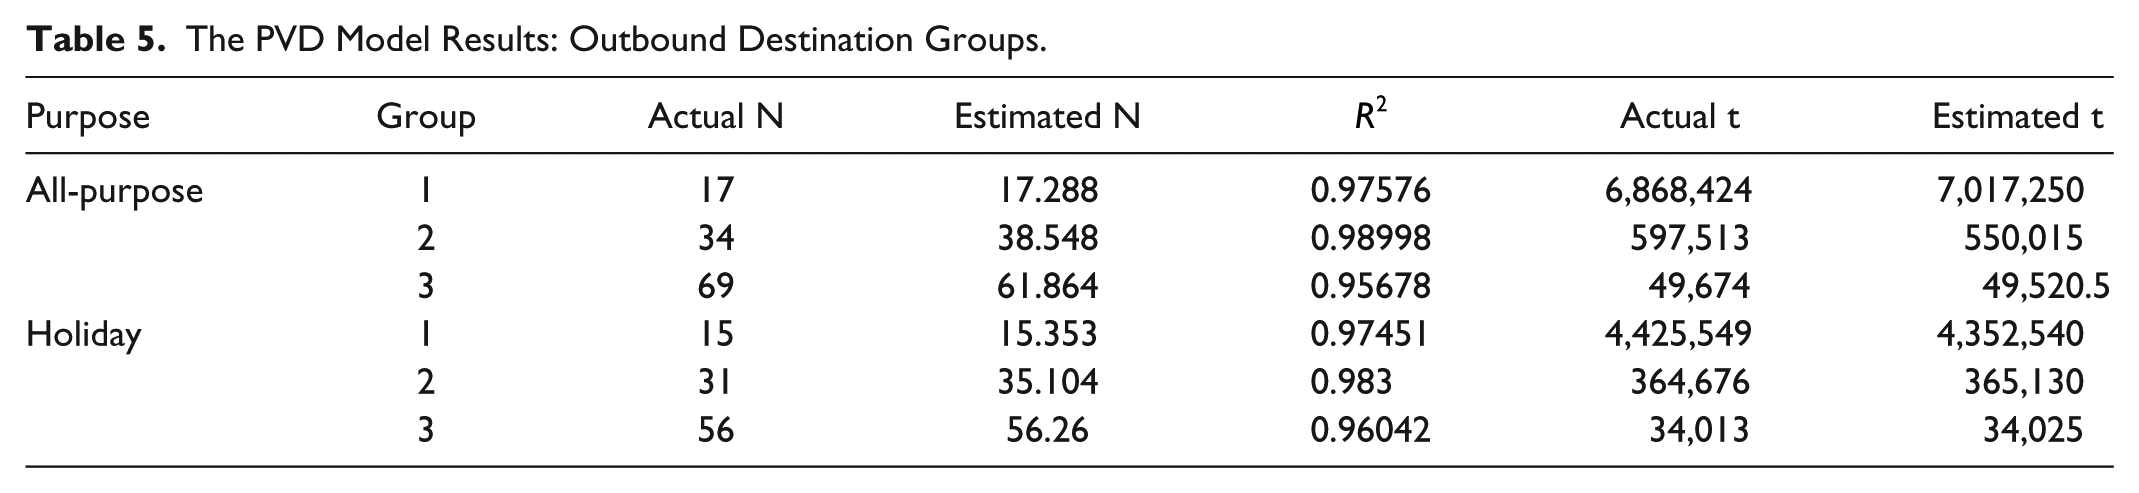
Table 5 diplays the PVD Model results for the outbound Australian tourists. Generally speaking, the model fit is good, with
The PVD Model Results: Outbound Destination Groups.
Discussion
The PVD model’s prediction originates from the assumption in equation (3), that is, the preferential attachment. The assumption states a simple rule on the way the visitors choose their destinations—tourist’s choice probability of choosing a destination is proportional to the number of times the destination, among all other destinations, has been chosen by all previous tourists. This statement is a general probabilistic criterion, and a range of mechanisms can be compatible with this assumption. This article alluded to habit persistence and word of mouth, in particular. Such a process gives rise to the new rank-size rule, which is different from the power law. Below we discuss how the PVD model may be interpreted.
Market concentration is a natural and unavoidable outcome of preferential attachment according to both the power law and the PVD model. Strictly speaking, if a distribution follows the PVD model or the power law, in the steady state, multiple large destinations of similar sizes will not coexist. For example, we shall not see another destination with the same size as Sydney over a long term. Two destinations may have similar size momentarily in the path toward the steady state, where swap in ranking between destinations may occur. However, such momentary equalities are expected to be unsustainable, and sooner or later one will emerge decisively over the other.
In the PVD model, one can see that the number of available destinations
This is not the first time destination grouping has been invoked in the discussion about the power law in tourism. Ulubasoglu and Hazari (2004) identified destination clusters in their power law analysis. These clusters represent geographically close and historically and culturally similar countries. They concluded with a behavioral interpretation of these coefficients, suggesting that the destinations at the upper end are readily substitutable from a tourist perspective, but this substitutability decreases toward the lower end. In comparison, the advantage of the PVD model application is that the grouping is endogenously determined (through the parameter N) from the micro-level assumptions of the model. The destination substitutability interpretation suggests that a destination improving itself without intrinsic changes in its characteristic may only advance the ranking within the same group of destinations. If, for example, a group 2 destination wishes to promote itself to group 1, the key is to acquire some unique advantages or characteristics possessed only by group 1 destinations (such as direct international air access). Simply developing or expanding the destination’s current characteristics will not be sufficient as such expansion may only help climbing the ranking within the same group, but not necessarily promoting to a higher tier group. These ideas are relevant to concepts such as city boosterism and global city hierarchies, where tourism is often an essential element.
The variations in model fit may reflect the different extent to which the choice mechanism adopted by the visitors follows the assumption of the model. The model was more applicable to visitor night distributions from China, India, and Korea than the visitors from NZ, UK, USA, and Germany. The relevance of Hofstede dimensions in explaining the variation in tourist behavior is well established in the literature (Reisinger and Turner 1997, 2002; Woodside, Hsu, and Marshall 2011), and this may help in explaining the differential applicability. On average, the theory predicts that tourists from Eastern countries tend to behave more toward collectivism while the tourists from Western countries tend to lean toward individualism. Based on a limited sample of countries, we tentatively conclude that the PVD model’s assumption is more readily satisfied by the former.
From a modeling perspective, the PVD model provides an alternative way to summarize the spatial distribution of tourism with few parameters such as the total number of tourists and the number of destinations. The benefit is analogous to the use of mean and variance to describe normal distributions. The model may be adopted by tourism modelers to parsimoniously account for spatiality in a system of tourism demand especially in a relatively “closed system” such as that characterizing the international tourism distribution within Australia. As previously mentioned, the rank-size rule can be an effective tool to supplement prediction efforts.
Conclusion
This study sought to venture beyond the verification of power law and aimed to develop an analytical framework of the distributions and the underlying mechanism that may give us the knowledge to explain the formation of the power law and relevant distribution in socioeconomic activities such as tourism. The finite Polya urn process was selected to satisfy the tourism context. The assumption of the model was supported by, although not limited to, the literature on tourists’ behaviors such as word-of-mouth effects and habit persistence. The resulting Polya urn process model of Visitor Distribution (the PVD model) yielded similarly shaped but a different rank-size distribution from the more familiar power law. Empirical research was carried out to examine the PVD model’s applicability to tourism data, finding that the PVD model not only yielded a better fit but generated intuitively meaningful parameters. For instance, destination groups were endogenously determined by the PVD model and the grouping information manifested in the parameter estimates. This is an appealing theory compared to the conventional power law equation because it provides an analytically tractable framework to explain how and why the power law distribution, or in this case a power law–like distribution, emerges in tourism. Tourism modelers can use this model to parsimoniously capture the spatial variation in tourism.
Studies of the power law in tourism to date has approached the geographic distribution of tourism using a log-linear regression fit of the power law–based rank-size equation. On the contrary, this study analytically built a rank-size equation based on a mechanism that satisfies the tourism context without being restricted to the power law distribution. The approach resulted in a distributional pattern that is similar to, but different from, the power law. The article is not claiming that PVD is the correct model for the distribution. Instead, the model application highlights that even though a distribution may resemble that of the power law, the conclusion is highly dependent on the analysts’ statistical judgments about what a “good linear fit” is. This uncertainty calls for a caution on the criteria adopted in the identification of the power law in social systems such as tourism. To this extent, the analytically traceable approach adopted in this article mitigates the risk of type I error on the hypothesis that there is a power law distribution in the distribution of inbound tourism in Australia. Although yet to be fully explored, it is possible that this article’s findings are also applicable to cognizant research areas such as the evolution of global cities system, and modeling of online tourism retail, e-word-of-mouth, and information sharing.
This study can be improved in a number of ways. First, while one of the immediate utilities of the PVD model may be in prediction, it remains to be seen whether the model enhances our understanding of tourist choice behavior. More systematic profiling of the relevant decision-making processes compatible with the PVD model will be beneficial for justifying the choice of the Polya urn process as a modeling tool, and ultimately result in the understanding of the scope and limit of the Polya urn process in contributing toward research in sustainable tourism. To this extent, it is worthwhile to note that the finite Polya urn model appears to have worked well in the Australian context because of its resemblance to a closed system. Power law distribution, arising from infinite Polya urn process, may be the correct distribution in a more open system such as the European tourism setting. From a methodological perspective, the fitting procedure can be improved. Since the PVD model is newly derived, the iterative procedure established in this study could be inefficient and cumbersome. Better fitting techniques with a solid statistical basis, which may quantify significance and confidence intervals, should be the next step.
Footnotes
Appendix A. The Calculation of the PDF from the Assumption
Suppose there are
where
At stage
In other words, the probability for destination
For illustration purposes, the probabilities for
For the probability for destination
Grouping and arranging the factors accordingly, equation (A3) becomes
In addition, using the fact that (
Appendix B: Approximation and Normalization of PDF
Acknowledgements
The author (Pong Lung Lau) would like to thank the support received from the Australian Commonwealth Government through the Australian Government Research Training Program Scholarship. The authors would also like to thank Tourism Research Australia (Australian Trade and Investment Commission) for data and advice.
Declaration of Conflicting Interests
The author(s) declared no potential conflicts of interest with respect to the research, authorship, and/or publication of this article.
Funding
The author(s) received no financial support for the research, authorship, and/or publication of this article.