



Abstract
The constructs of country and destination images have been used to understand attitudes and behaviors of consumers and tourists toward products and destinations. The constructs have evolved theoretically in two distinctive streams of literature and their relationship and interactions have not been empirically substantiated. Building on Keller’s brand equity framework (K. Keller, “Conceptualizing, Measuring, and Managing Customer-Based Brand Equity,” Journal of Marketing 57, no. 1 [1993]: 1–22) and biodiversity literature, the study proposes an approach to numerically describe and compare country and destination images of a place on ease of recall, richness and diversity of associations, as well as on strength, favorability, uniqueness, and types of these associations. The study empirically tests the proposed approach using the United States as an example. The approach contributes to better understanding of the two constructs and their relationships, and it is hoped that the study will aid countries and destinations in their branding and marketing efforts.
Keywords
Introduction
The constructs of country image and tourist destination image provide a useful theoretical lens to analyze human behavior. However, while these constructs have been conceptualized theoretically, their relationship, interactions, and interdependency have not been sufficiently researched. Destination image has been extensively studied in the tourism literature but country image has not. Similarly, country-of-origin and product-country images have been researched in the marketing literature, but destination image has not. Systematic reviews of literature on country (Roth and Diamantopoulos 2009) and destination (Gallarza, Saura, and Garcia 2002) images have noticed the variety of conceptualizations (and the lack thereof) of the respective constructs. To date, there have been only a few empirical studies that incorporate both country and destination images in the models of tourist behavior (Elliot, Papadopoulos, and Kim 2011). Interestingly, there have been no studies at all that examine and compare country image and destination image pertaining to the same place to empirically support or refute existing theoretical conceptualizations.
The purpose of this study is to propose a framework to numerically describe and, ultimately, compare country and destination images of a place. The approach builds on Keller’s (1993) work on brand equity to conceptualize the dimensions for comparison and their indicators: ease of recall, richness and diversity of image associations, as well as strength, favorability, uniqueness, and types of image associations. To operationalize the richness and diversity indicators, the study adopts quantitative measures from biodiversity literature that are used to differentiate between various bio-communities on the diversity of their species assemblage. The study uses the United States as an example of a place to empirically test the proposed approach; it is set in the U.S.–Russia context, where Russia is the tourism-generating region and the United States is the vacation destination. The rationale for the choice of these two countries is based on the long-standing history of mutual relationships between Russia and the United States that includes periods when the two countries were friends and foes. It is reasoned that such a history will be conducive to evoking a rich pool of associations that Russian consumers of tourist products have about the United States as a country and as a destination.
Country Image and Destination Image
The concept of image (Boulding 1956) has been studied since the 1960s in such disciplines as social and environmental psychology, marketing, and consumer behavior (e.g., Gensch 1978; Herzog 1963), and since the 1970s it has found its way into the tourism literature (Hunt 1971). Nonetheless, the concepts of country image and tourist destination image have been developed in respective literatures with almost no interaction, and only relatively recently the integration of the two has been initiated in empirical studies. In business and marketing literature, country image pertains primarily to country-of-origin image (e.g., Martin and Eroglu 1993), product image (e.g., Nagashima 1970), and product-country image (e.g., Papadopoulos and Heslop 2003), with more than 400 articles published in peer-reviewed journals (Roth and Diamantopoulos 2009). The driver for such an intense interest has been the need to understand consumers’ buying preferences for products, and the manufacturing country has been determined a highly important factor. Country image, that is, country-of-origin image, was defined from the perspective of organizations and consumers as “based on country’s economic condition, political structure, culture, conflict with other countries, labor conditions, and stand on environmental issues” (Allred, Chakraborty, and Miller 1999, 36). In this tradition, country image is the “mental maps or knowledge structures related to countries” (Nadeau et al. 2008, 87) encompassing political, economic, technological, and societal aspects (Martin and Eroglu 1993). The other stream of definitions stems from the product-country literature, focusing on “consumers’ general perceptions of quality for products made in a given country” (Han 1989, 222). In this tradition, the dimensional aspects of country image would be technical advancement, prestige, workmanship, economy, and serviceability (Han and Terpstra 1988).
Destination image has been understood as “consisting of an individual’s mental representation of knowledge (beliefs), feelings, and global impression about . . . destination” (Baloglu and McCleary 1999, 870). While researchers have recognized the importance of the holistic aspect of image, operationalization of destination image relied primarily on lists of relevant attributes (Echtner and Ritchie 1993), the reason being that “products seldom are measured or evaluated as lump sum entities; rather, it is the attributes of the alternatives that are measured, compared, and form the basis for choice” (Gensch 1978, cited in Gartner 1986, 636). Destination attributes have been classified into more functional, or tangible (e.g., climate), and more psychological, or intangible (e.g., friendly people), features (Echtner and Ritchie 1993). One more dimension for measurement of destination image, besides “holistic-attribute-based” and “functional-psychological” is the “common-unique” axis, where attributes like hotels or restaurants are considered common to each destination, while long, white sandy beaches or reggae music could be considered the unique assets of a particular destination, in this case, Jamaica (Echtner and Ritchie 1993).
In the late 1990s, the country-of-origin, product-country image, and tourist destination image began to be considered as components of the broader or “general” country image. General country image has been referred to as “the sum of beliefs and impressions people hold about places . . . a simplification of a large number of associations and pieces of information connected with a place” (Kotler, Haider, and Rein 1993, 141). Mossberg and Kleppe (2005) theorized that this general country image has a hierarchical structure. All image definitions pertaining to a particular place had a common denominator, that is, the pool of all associations pertaining to the country in general. The feature that discriminates among the definitions is the focal point of the image, that is, an object or a location to which the image is attached. Thus, general country image was placed on the highest level of the hierarchy. On the next level, Mossberg and Kleppe placed the product-country image, which encompasses all aspects of country-of-origin and product images. Destination, as being one of the products that “originate” in a respective country, shares some image components with the product-country image; however, by being a place, destination also shares some components with the general country image at the top level of the hierarchy. Finally, Mossberg and Kleppe placed a particular object or location on the third level. At this level, product-country image can be a production place, design, product brand, or an attraction. For destination image, it can be a state, a region, a city, or a particular location or attraction. Thus, according to the conceptualization by Mossberg and Kleppe (2005), destination image overlaps with general country image and product-country image. These conceptualizations, however, have not been empirically tested, which limits their usability in tourism studies.
Elliot, Papadopoulos, and Kim (2011) surveyed the body of literature on country-destination image and noticed a lack of empirical research into the structure and interaction of the two image domains. Among a few studies on the topic, the study by Papadopoulos and Heslop (1986) looked at travel as a correlate of product and country images; however, the researchers did not include tourism-specific measures that would have comprised the destination image. Hallberg (1998) examined the link between general country image and a tourist product (a foreign hotel chain in China) and, by manipulating the country-of-origin for the hotel chain, found the effect of the country image on the image of the hotel chain. Using the experimental design, Mossberg and Hallberg (1999) examined effects of a mega sport event on product and tourism images of Goteborg and Sweden and found none. Nadeau et al. (2008) investigated the link between the country and destination images of Nepal taking their measures of the general country image from the product-country literature. In addition to studies reviewed by Elliot, Papadopoulos, and Kim (2011), Phillips, Asperin, and Wolfe (2013) examined the effect of country image of South Korea on the willingness of people from the American Midwest to consume Hansik cuisine in ethnic Korean restaurants as well as to visit South Korea; however, no relationship between country and destination image was tested in the model. Also, Lee and Lockshin (2011) studied the halo effect of tourists’ destination image on domestic product perceptions: the hypothesized link between image and product preference was not supported. Finally, Elliot, Papadopoulos, and Kim (2011) themselves investigated the relationships among different facets of country and destination images using the attitude framework where the behavioral component of attitudes was presented by the constructs of product and destination receptivity. Interestingly, the link between the U.S. country image and destination beliefs was not supported.
In a situation when there is no universally accepted conceptualization of country and destination images (Gallarza, Saura, and Garcia 2002; Roth and Diamantopoulos 2009), examining relationships and interactions between these constructs via theoretical models and statistical analysis seems to be wrought with problems, as the aforementioned review suggests. An empirical investigation is needed at the very foundational level to study associations pertaining to the two image domains of a place—country and destination. What are the most prominent association types in each domain? Do they pertain to people, nature, politics, products, or something else? Which pool of associations is more rich and diverse? More favorable? More unique? Do the two image domains overlap or interact in any way? A comparison of country and destination images pertaining to the same place entity seems necessary. This study selected the United States to compare images of its country and destination domains as perceived by Russian tourists.
Theoretical Framework
Theoretical foundation for the proposed approach to compare the two image domains, country and destination, rests on the work by Keller (1993) who conceptualized the dimensions of brand equity. The definition of a brand given by the American Marketing Association is “a name, term, sign, symbol, or design, or combination of them which is intended to identify the goods and services of one seller or group of sellers and to differentiate them from those of competitors” (as cited in Kotler 1991, 442). While this definition pertains to products and services in general, countries, and destinations in particular, revert to branding strategies to ensure high awareness and recognition as well as positive associations in the consumer’s mind (Kotler 1991). Image in the tourism destination context is “an important building block in developing destination brands” (Tasci and Kozak 2006, 304), as destinations select a consistent element mix to distinguish themselves from their competitors through positive image building (Cai 2002). While tourism researchers still debate the relationship between destination image and destination brand (Qu, Kim, and Im 2011; Tasci and Kozak 2006), generally, the term “destination image” is used when researchers are to identify consumers’ perceptions of a particular destination, while the term “destination brand” pertains more to the image-building efforts conducted by destinations’ management and marketing organizations (Day, Skidmore, and Koller 2002). When destination brands are established, their images as perceived by consumers of tourist products can be studied very much the same way as destination images. That is why, in today’s tourism research, destination image and destination branding studies are converging (Li and Kaplanidou 2013) and destination images and destination brand associations are viewed as “essentially the two sides of the same coin” (Stepchenkova and Li 2014, 48).
Keller (1993) defined consumer brand knowledge as having two components: brand awareness and brand image. Brand awareness is associated with brand recall, recognition, and occasionally familiarity (Agarwal and Rao 1996). Research on consumer brands defines brand recall as a name that first comes to mind when a particular product category is mentioned; for example, if on a cue “car” a consumer thinks about a Mercedes, then the Mercedes brand has a high recall, and, potentially, recognition and familiarity. Research recognizes top-of-mind, spontaneous, and aided brand awareness, with the top-of-mind awareness being the most rigorous measure (Laurent, Karfererand, and Roussel 1995) as it is the most salient and, therefore, the most retrievable portion of consumer’s brand memory. In the context of tourism research, Stepchenkova and Li (2014) interpreted brand awareness as the ability to come with a set of associations pertaining to a particular destination and viewed the very first association as a top-of-mind recall and the other two associations as unaided recall.
Brand image constitutes all “perceptions about a brand as reflected by the brand associations held in consumer memory” (Keller 1993, 2). Following the theory of adaptive control of thought (Anderson 1983a, 1983b), it has been posited that all these associations are organized in the person’s memory as a network of nodes connected to each other, where each node presents an association to the brand (Keller 1993). A prompt in a form of the brand name triggers network activation, and the most salient brand associations (nodes) are activated first. Then, the activation of the memory network is spread to nodes that have the strongest associations with the nodes already activated. Thus, the adaptive control of thought theory posits that the activation is spread along the path that is determined by the strength of the linkages between the nodes. Keller posits that types of brand associations include attributes that can be product- and non–product-related. Besides various attributes, brand associations are characterized by their favorability, strength, and uniqueness. Strength of brand associations is directly related to how quickly retrievable this association is in the consumer’s memory, that is, how quickly the respective node is activated on a brand name cue. Favorability, according to Keller, is inherently connected with the association strength, as consumers are unlikely to view any form of brand association as favorable (or unfavorable) if they do not deem it as important (or strong). Uniqueness of brand associations relates to how much associations are shared with other brands, that is, whether a particular association contributes to the unique selling proposition of the brand.
In this study, a place entity, that is, the United States, is viewed as having two image domains: country image and destination image. The Keller’s framework (1993) is extended in the sense that the components of that framework are now interpreted from the perspective of the “collective consumer,” rather than an individual consumer. The overall knowledge that the “collective consumer” has about the United States is characterized by the pool of associations pertaining to the United States, which is obtained by combining the most salient associations of a large number of individual consumers. One characteristic of that pool, awareness, deals with the ease of retrieval of these associations from the memory of “collective consumer” and describes how large, rich, and diverse the association pool is. While it is tempting to assume that for a high-profile country like the United States awareness among actual and potential tourists is close to 100%, the empirical research by Stepchenkova and Li (2012, 2014) does not support this assumption. These researchers studied America’s destination image as perceived by Chinese actual and potential tourists and reported a large amount of missing data, that is, when survey respondents could not come up with three allowable associations pertaining to the United States.
Thus, awareness in this study is conceptualized in Stepchenkova and Li’s (2014) sense as the first unaided responses given by people on a country/destination “cue,” as these responses represent the most salient associations in the consumer mind that are connected to the place. In other words, it measures how many nodes in the collective memory system are activated when subjects are prompted with the U.S. name in the respective domain (country or destination), that is, how far the spreading activation goes. Within this conceptualization, the percentage of missing data in the total amount of allowable responses serves as one of the indicators of the overall awareness. Other dimensions of awareness are the richness and diversity of the pool of all associations related to the place in the collective mind of respondents. Conceptualization of richness and diversity of the pool of all image associations has its origins in biodiversity literature where various indicators have been developed to study diversity of various bio-communities. In using bio-diversity measures, this study follows Stepchenkova and Li (2012, 2014), who introduced these indicators to tourism literature, and to destination image studies, specifically. The extended citation below helps to illustrate the statistical model for calculating the diversity indicators for a community of various species (Gotelli and Colwell 2010, 41):
Snacking from a jar of mixed jellybeans provides a good analogy for biodiversity sampling (Longino et al. 2002). Each jellybean represents a single individual, and the different colours represent the different species in the jellybean “assemblage”—in a typical sample, some colours are common, but most are rare. Collecting a sample of biodiversity data is equivalent to taking a small handful of jellybeans from the jar and examining them one by one. From this incomplete sample, we try to make inferences about the number of colours (species) in the entire jar. This process of statistical inference depends critically on the biological assumption that the community is “closed,” with an unchanging total number of species and a steady species abundance distribution. Jellybeans may be added or removed from the jar, but the proportional representation of colours is assumed to remain the same.
This analogy works for the image context as well. Images with distinctive codes can be considered as different species (colors in the jellybean assemblage); some of these species are common (many people share these images), and some are rare. The community is “closed” in the sense that the number of images is finite. It has been shown that destination image follows a power law distribution (Pan and Li 2011; Stepchenkova and Li 2012); therefore, one can reasonably expect that when more people from the same population are randomly selected and added to the sample, the proportional representation of various images in the total “assemblage” will remain the same. The approach to operationalize awareness and formulas for the diversity indicators are detailed in the “Method” section (subsection “Awareness”).
Further, each image association is a node in the U.S. knowledge map. The more salient the association is in the collective mind of respondents, the more strong this association is. When, in a survey, associations are collected from the respondents, similar formulations of the same concept (e.g., rich country and wealthy country) are assigned a distinctive image code (association ID). Thus, the frequency of image codes can represent the strength of corresponding associations: the more often respondents name a particular image, the stronger this association is linked to the United States in the collective mind of respondents. As each respondent provides their most salient associations on the country or destination cue, favorability is the intrinsic quality of the supplied associations. When a number of respondents share a particular association, favorability of individual associations can be averaged, provided that the individual scores are known. The uniqueness of a particular association is understood as whether this association is “uniquely American,” that is, whether it can be unequivocally linked to the United States. For example, the image of New York is a unique feature of the United States, while the images of large metropolitan areas and city parks are not. Finally, associations pertaining to a particular topic, or theme, like for example sports, cultural icons, or nature, can be viewed as representing a particular association type, and the concept of “type” can be a useful tool to transition from a large pool of all associations and individual image codes to a much smaller number of image types. The above-mentioned conceptualizations are summarized in Table 1. Operationalization of the respective indicators is detailed in the “Method” section.
Diversity Indices.
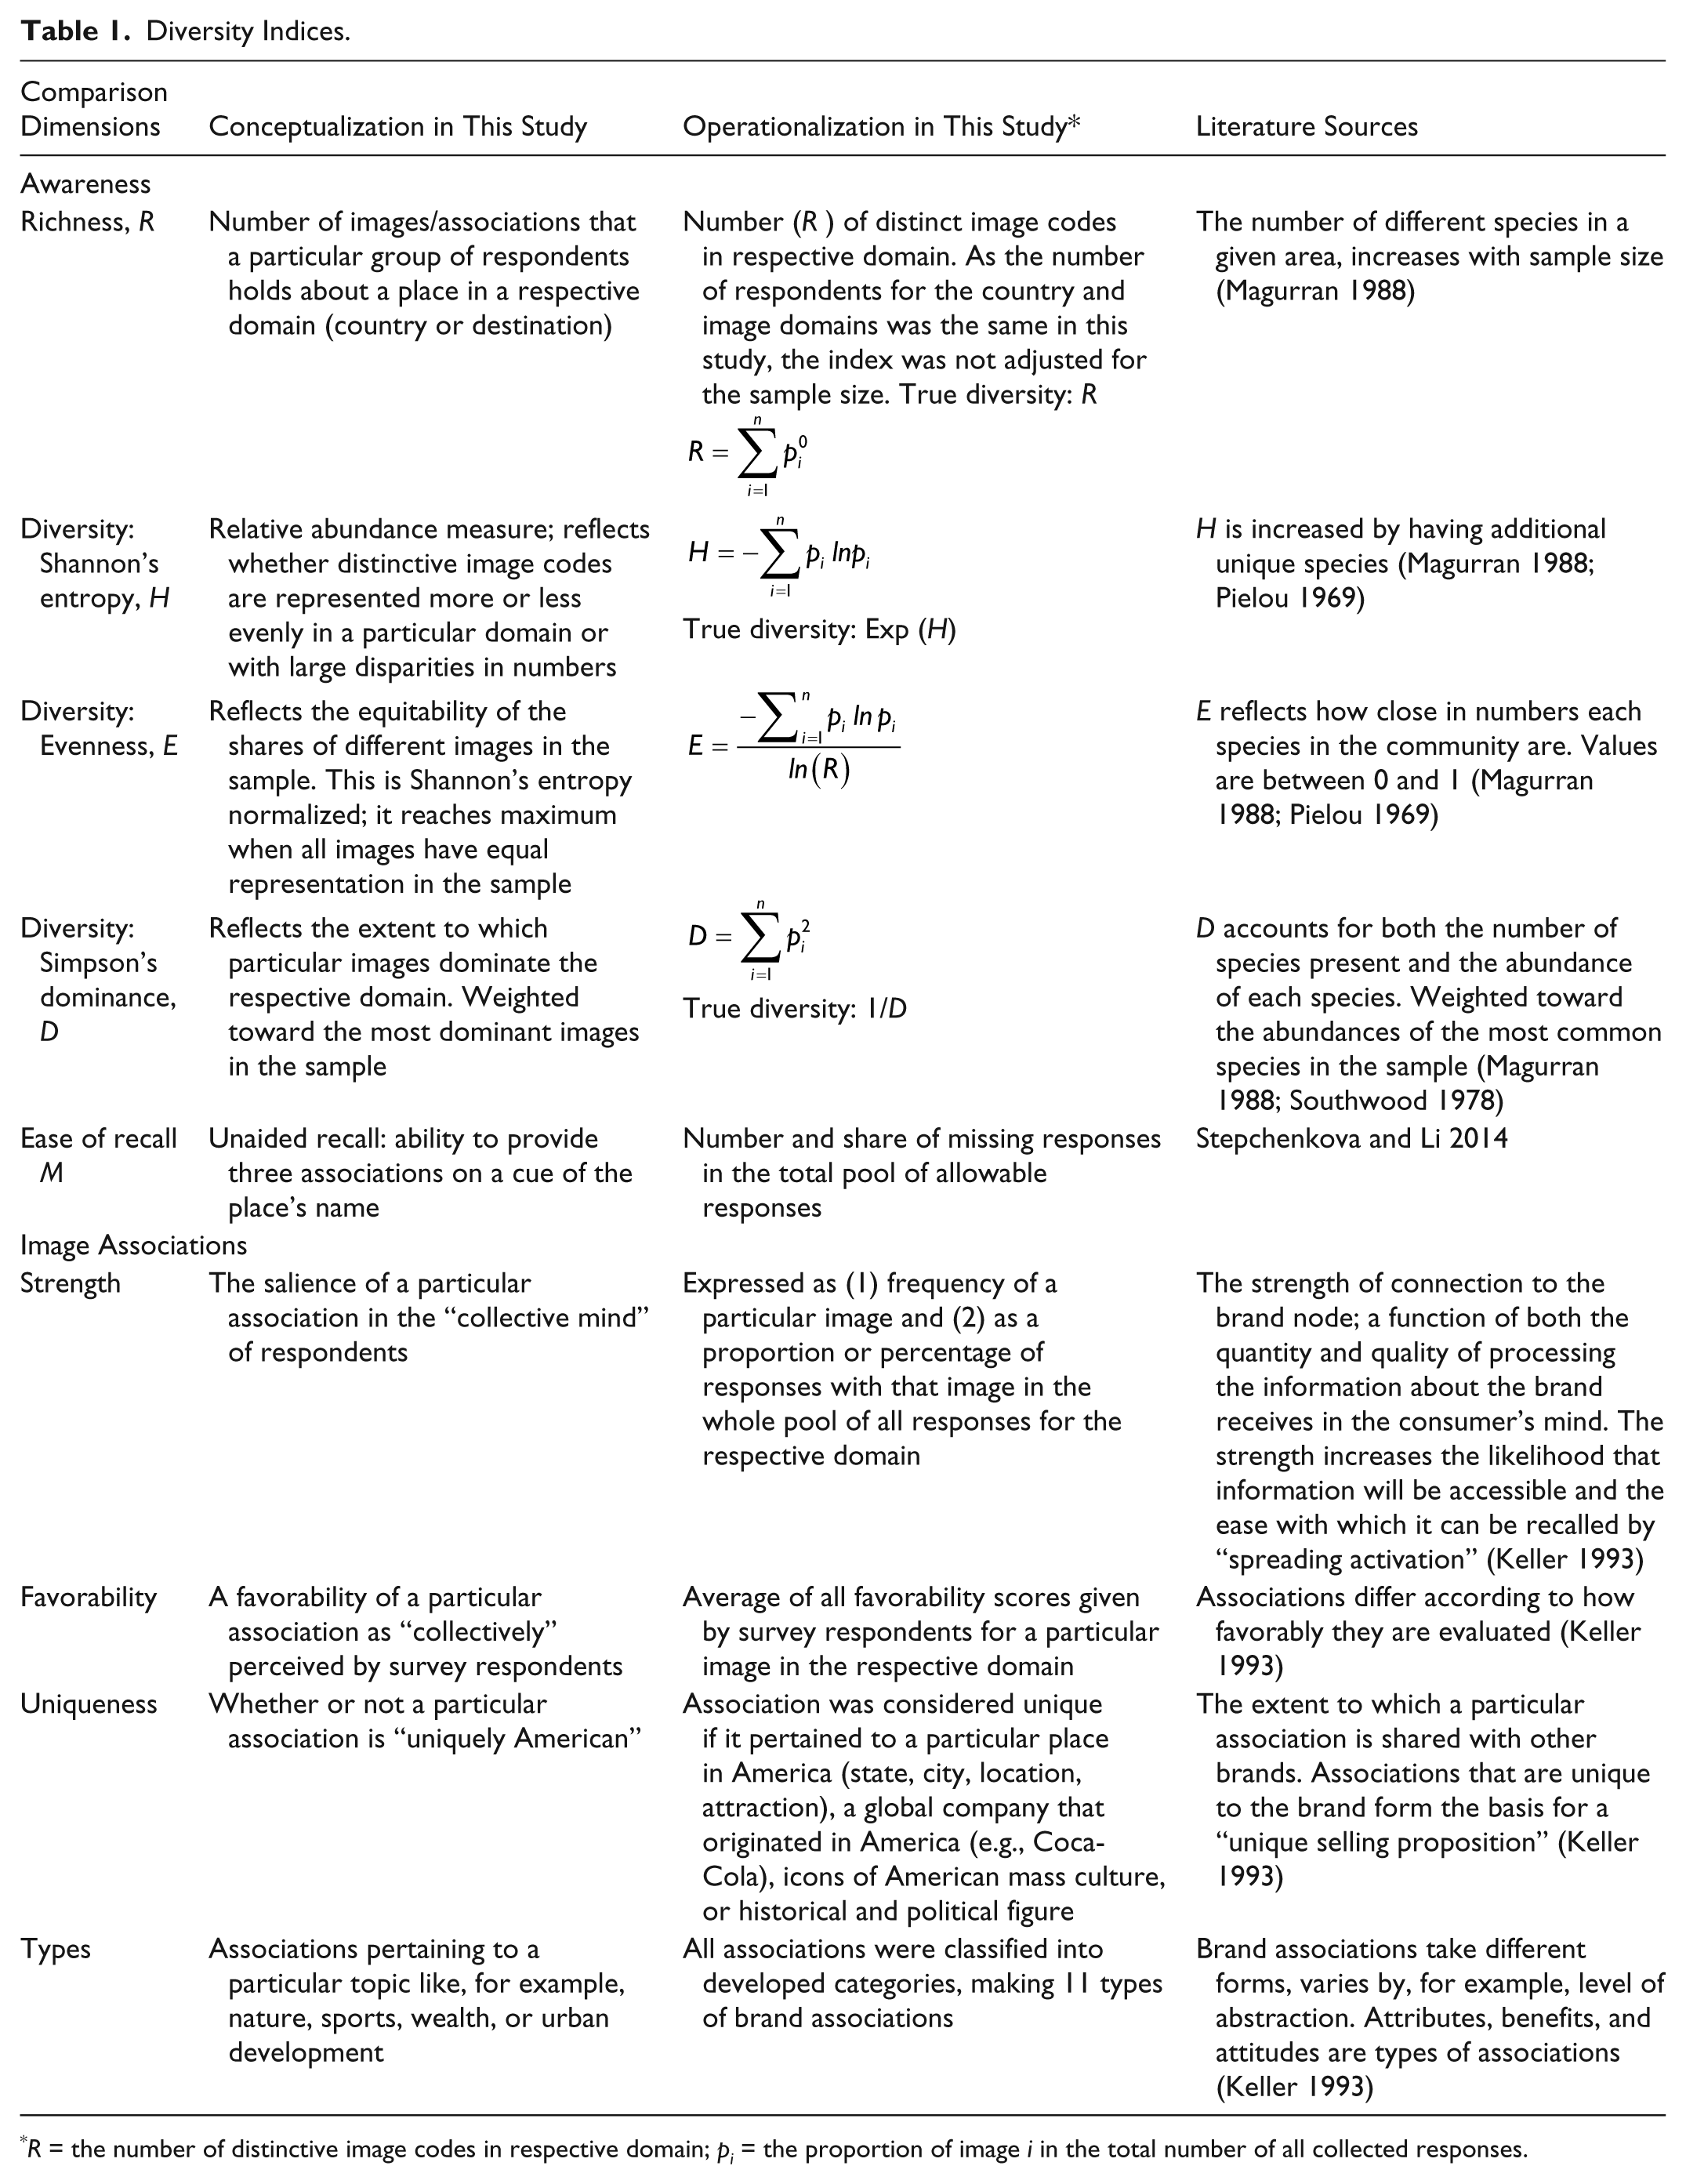
R = the number of distinctive image codes in respective domain; pi = the proportion of image i in the total number of all collected responses.
Method
Echtner and Ritchie (1993) proposed a mixed-methods approach for studying destination image that combined Likert scale–type questions that gauge respondents’ perceptions about prespecified destination features with open-ended questions to get insights into the overall destination image. The open-ended questions were designed to elicit the most salient destination attributes, feelings and emotions toward the destination, as well as the unique destination features. Implementation of Echtner and Ritchie’s approach in consumer surveys transformed the original “free-flow” format, which asked respondents to describe their perceptions of a destination in their own words without restrictions, into the “reduced” format, when respondents are instructed to list the top three words or short phrases that they associate with a destination. This new format became quite popular (e.g., Choi, Chan, and Wu 1999; Grosspietsch 2006; O’Leary and Deegan 2003; Pan and Li 2011), as it makes data collection more convenient, reduces the burden on the respondents and increases their willingness to provide answers, aids in converting textual data to the structured format, and, overall, results in savings of time and manpower during the data analysis stage. Thus, this study combined open-ended questions (Q1) to collect the most salient images associated with the United States as a country and as a vacation destination with Likert-type questions (Q2) to obtain favorability scores of those associations. In addition, one more question (Q3) was asked to reflect favorability of the overall attitudes toward the United States as a country and as a tourist destination:
Using data obtained as responses to questions Q1, Q2, and Q3, the study investigated the most salient associations pertaining to the United States, in country and destination domains. The study numerically described the richness and diversity of these associations, their strength, favorability, and uniqueness and, further, compared the respective numerical data for the two domains: country and destination. The study also identified the main association types pertaining to the United States and quantified them in terms of their strength and favorability. Finally, it analyzed what association types influence the overall attitudes of Russian tourists toward the United States as a country and as a destination.
Data
The data for the study were collected in a survey of 405 students at a large regional university in Russia in November–December 2014. This convenience sample represents a homogeneous set of young urban Russian people from a relatively well-off and educated stratum of society that can be considered the Russian middle class. By the time of the survey, 73 percent of respondents had already traveled internationally, and it is very likely that they will be Russian outbound tourists in the near future. In addition, this group of people grew through the times when political, social, and economic cooperation between the United States and Russia has been gradually changing to a more conflicting and adversarial relationship. Thus, this group of respondents was considered suitable to test the proposed approach (Lepp, Gibson, and Lane 2011) and provide data that would allow comparative analysis of the two U.S. image domains, country and destination.
A pilot survey (30 respondents) was conducted to identify inaccuracies in wording and presentational issues. As a result, the main study controlled for question order: half questionnaires had the country image questions first and half had the destination image questions first. All surveys were conducted in the same manner by two trained researchers. The whole procedure, from reading information on the participants’ rights to completion of the survey, took approximately 25–30 minutes, as there were other questions in the survey that did not pertain directly to this particular study. Respondents who participated in the pilot survey were not part of the main survey. The gender split of the respondents was 38% (males) to 62% (females). With respect to age, 97 percent of respondents were 24 years old or younger; the median age was 19 years. Eighty-nine percent identified themselves as being Russian, and the remainder represented various nationalities within the Russian Federation. Eleven percent had visited the United States before the survey took place and 33% had either friends or relatives living in the United States. Seventy-two percent followed news about the United States occasionally, 16% on a regular basis, and 12% were not interested. Seventy-nine percent evaluated their knowledge of English as either intermediate or advanced, 15% identified themselves as beginners, and only 6% reported no knowledge of the English language. The median number of trips abroad in the 5 years preceding the survey was two; 27% of respondents had no trips, while 14% had more than five trips.
Twenty-six observations had missing data for both Q1 (textual responses) and Q2 (corresponding favorability scores); examination of these cases revealed that the respondents had large amounts of missing data in other parts of the survey (results on which are not presented in this paper) as well. Therefore, the missing data in these 26 cases were interpreted not as the difficulty with recall but as a sign of no interest in the study and, therefore, were removed. In the final data set, there were 379 observations, and each image supplied by a respondent had a corresponding favorability score. No influence of question order on overall favorability (Q3) was found (country: p = 0.531; destination: p = 0.222).
Analytical Approach and Results
Awareness
Measures of biodiversity are richness R, evenness E, and Simpson’s dominance D (Magurran 1988). The species richness R is the number of species present in the sample. It is typical, however, that not all species that exist in the community are present in the sample: a number of rare species are not represented at all, and some species are only represented by one (singletons) or two (doubletons) individuals. Therefore, the richness of a sample is bound to be less than the number of all species in the community (abundance). To estimate abundance of the whole community, several statistical methods have been proposed, and the most well known include the Chao’s (1984) and the first- and second-order Jackknife methods. All three methods estimate the number of species that have escaped detection in the sample by using the numbers of singletons and doubletons in the sample.
The richness index R does not account for the relative abundance of species in a community: two communities both composed of two species yet substantially different in species abundance will have the same R index of two. However, a community with equally abundant species is considered to be more diverse than a community with the same richness but that has large differences in species abundance. Evenness E provides additional information on community composition by accounting for differences in the population sizes of the species. Its numerator H (Shannon-Wiener entropy) is an indicator that independently arises in various disciplines (Jost 2006), and the denominator is the value at which the Shannon’s H reaches its maximum (Pielou 1969). Thus, the evenness E ranges between 0 and 1 and reaches a value of 1 when all species are equally abundant. Further, while E places a greater weight on the equality of the population sizes of different species, Simpson’s D calculates the probability that two individuals randomly selected from a sample will belong to the same species (Magurran 1988). When a few species dominate the community, it is reflected in a larger value of D.
The richness R for any two communities can be directly compared, but this is not true with Shannon’s H and Simpson’s D: if, for example, Shannon’s H for one community is twice as large as for the other, it does not mean that the diversity of the first community is two times higher. For each value of Shannon’s H and Simpson’s D, there is an entire class of communities that vary in abundance of individual species. Among these communities, there is just one community in which the species are equally abundant. The number of species in that community is a “true” diversity for the entire class of “equivalent” communities with the same diversity index (see Jost 2006, 364, for a more detailed explanation). Conversion of indices to their “true” values makes interpretability of all indicators consistent: “the larger the index, the larger the diversity.” Taken together, these indicators effectively describe the diversity of a bio-community from various aspects. For a more detailed explanation, see Stepchenkova and Li (2014).
Reverting to the image context, the key indicators of image diversity—richness R, evenness E, and dominance D—are interpreted as follows. Image richness R is the number of distinctive image codes in country and destination image domains. Shannon’ H and evenness E reflect whether distinctive image codes are represented more or less evenly in a particular image domain or with large disparities in numbers. Finally, dominance D indices reflect the extent to which particular images dominate the respective domain. Therefore, following Keller (1993), awareness is defined in terms of richness and diversity of associations pertaining to the place and its particular domain. In addition, the third characteristic of awareness, that is, ease of recall, is defined as the amount of missing data in the total amount of allowable survey responses. Table 1 provides a summary of all awareness dimensions on which the country and destination image domains of the United States are compared.
The results of the awareness analyses are given in Table 2. The total number of responses in the country and destination domains were 1,048 and 1,047, respectively, indicating the comparable recall. For all image codes, the probability of a distinct image code to appear in the country and destination data was calculated as the ratio of the particular image frequency to the total number of collected responses, and these were used to obtain the diversity indices according to formulas provided in Table 1. The number of singletons and doubletons in the data were counted, and the abundance data for the country and destination domains were estimated using Chao’s 1st-order Jackknife and 2nd-order Jackknife (Chao 1984). Overall, the indices point out that the U.S. country image is more diverse; that is, it has more distinctive images in it (152 vs. 128), is more even (true Shannon’s H = 77 vs. 56), and is less dominated by a few most frequent images (true Simpson’s D = 44 vs. 33). However, estimations of the total abundance provide inconclusive results: first-order Jackknife favors the country domain, while Chao’s favors the destination domain. Second-order Jackknife gives very close results, in a slight favor of the destination domain. Nonetheless, as the total abundance index is only an estimate, it was concluded that the calculated indices, taken together, point toward a country image of the United States being more rich and diverse.
Awareness: Country and Destination Domains.

Strength, favorability, and uniqueness of associations
For each image with a distinctive code, its favorability was calculated as the average of all favorability scores provided by respondents for that image (Table 1). If a particular image was supplied in both country and destination domains, two respective favorability scores were calculated. Table 3 lists images that have the strongest association with the United States (those with frequencies no less than 10) in the respective domain, along with their corresponding “share of mind” in the collective memory system and the mean favorability score. As can be seen, the most frequently given country images (i.e., Democracy, Barack Obama, Stature of Liberty, Fast food, Aggression, Expansion) have negative mean favorability scores (with the exception of Statue of Liberty), while the most popular destination images (i.e., New York, Statue of Liberty, Grand Canyon, California, Miami) all have positive means. Among the strongest associations in the destination domain (Table 3), there were only three images with favorability below the “neutral point” of 5.5: Fast food (2.91), White House (4.92), and McDonald’s (4.55). These results indicate that associations pertaining to the destination domain are generally more favorable than those pertaining to the country domain. This finding is supported by a formal comparison of overall attitudes (Q3) toward the United States as a country (mean favorability score is 5.39) and a destination (mean favorability score is 7.04): t-test for matched pairs, t = −14.634, df = 354, p < 0.0001.
Strength and Favorability of Associations: Country and Destination Domains.
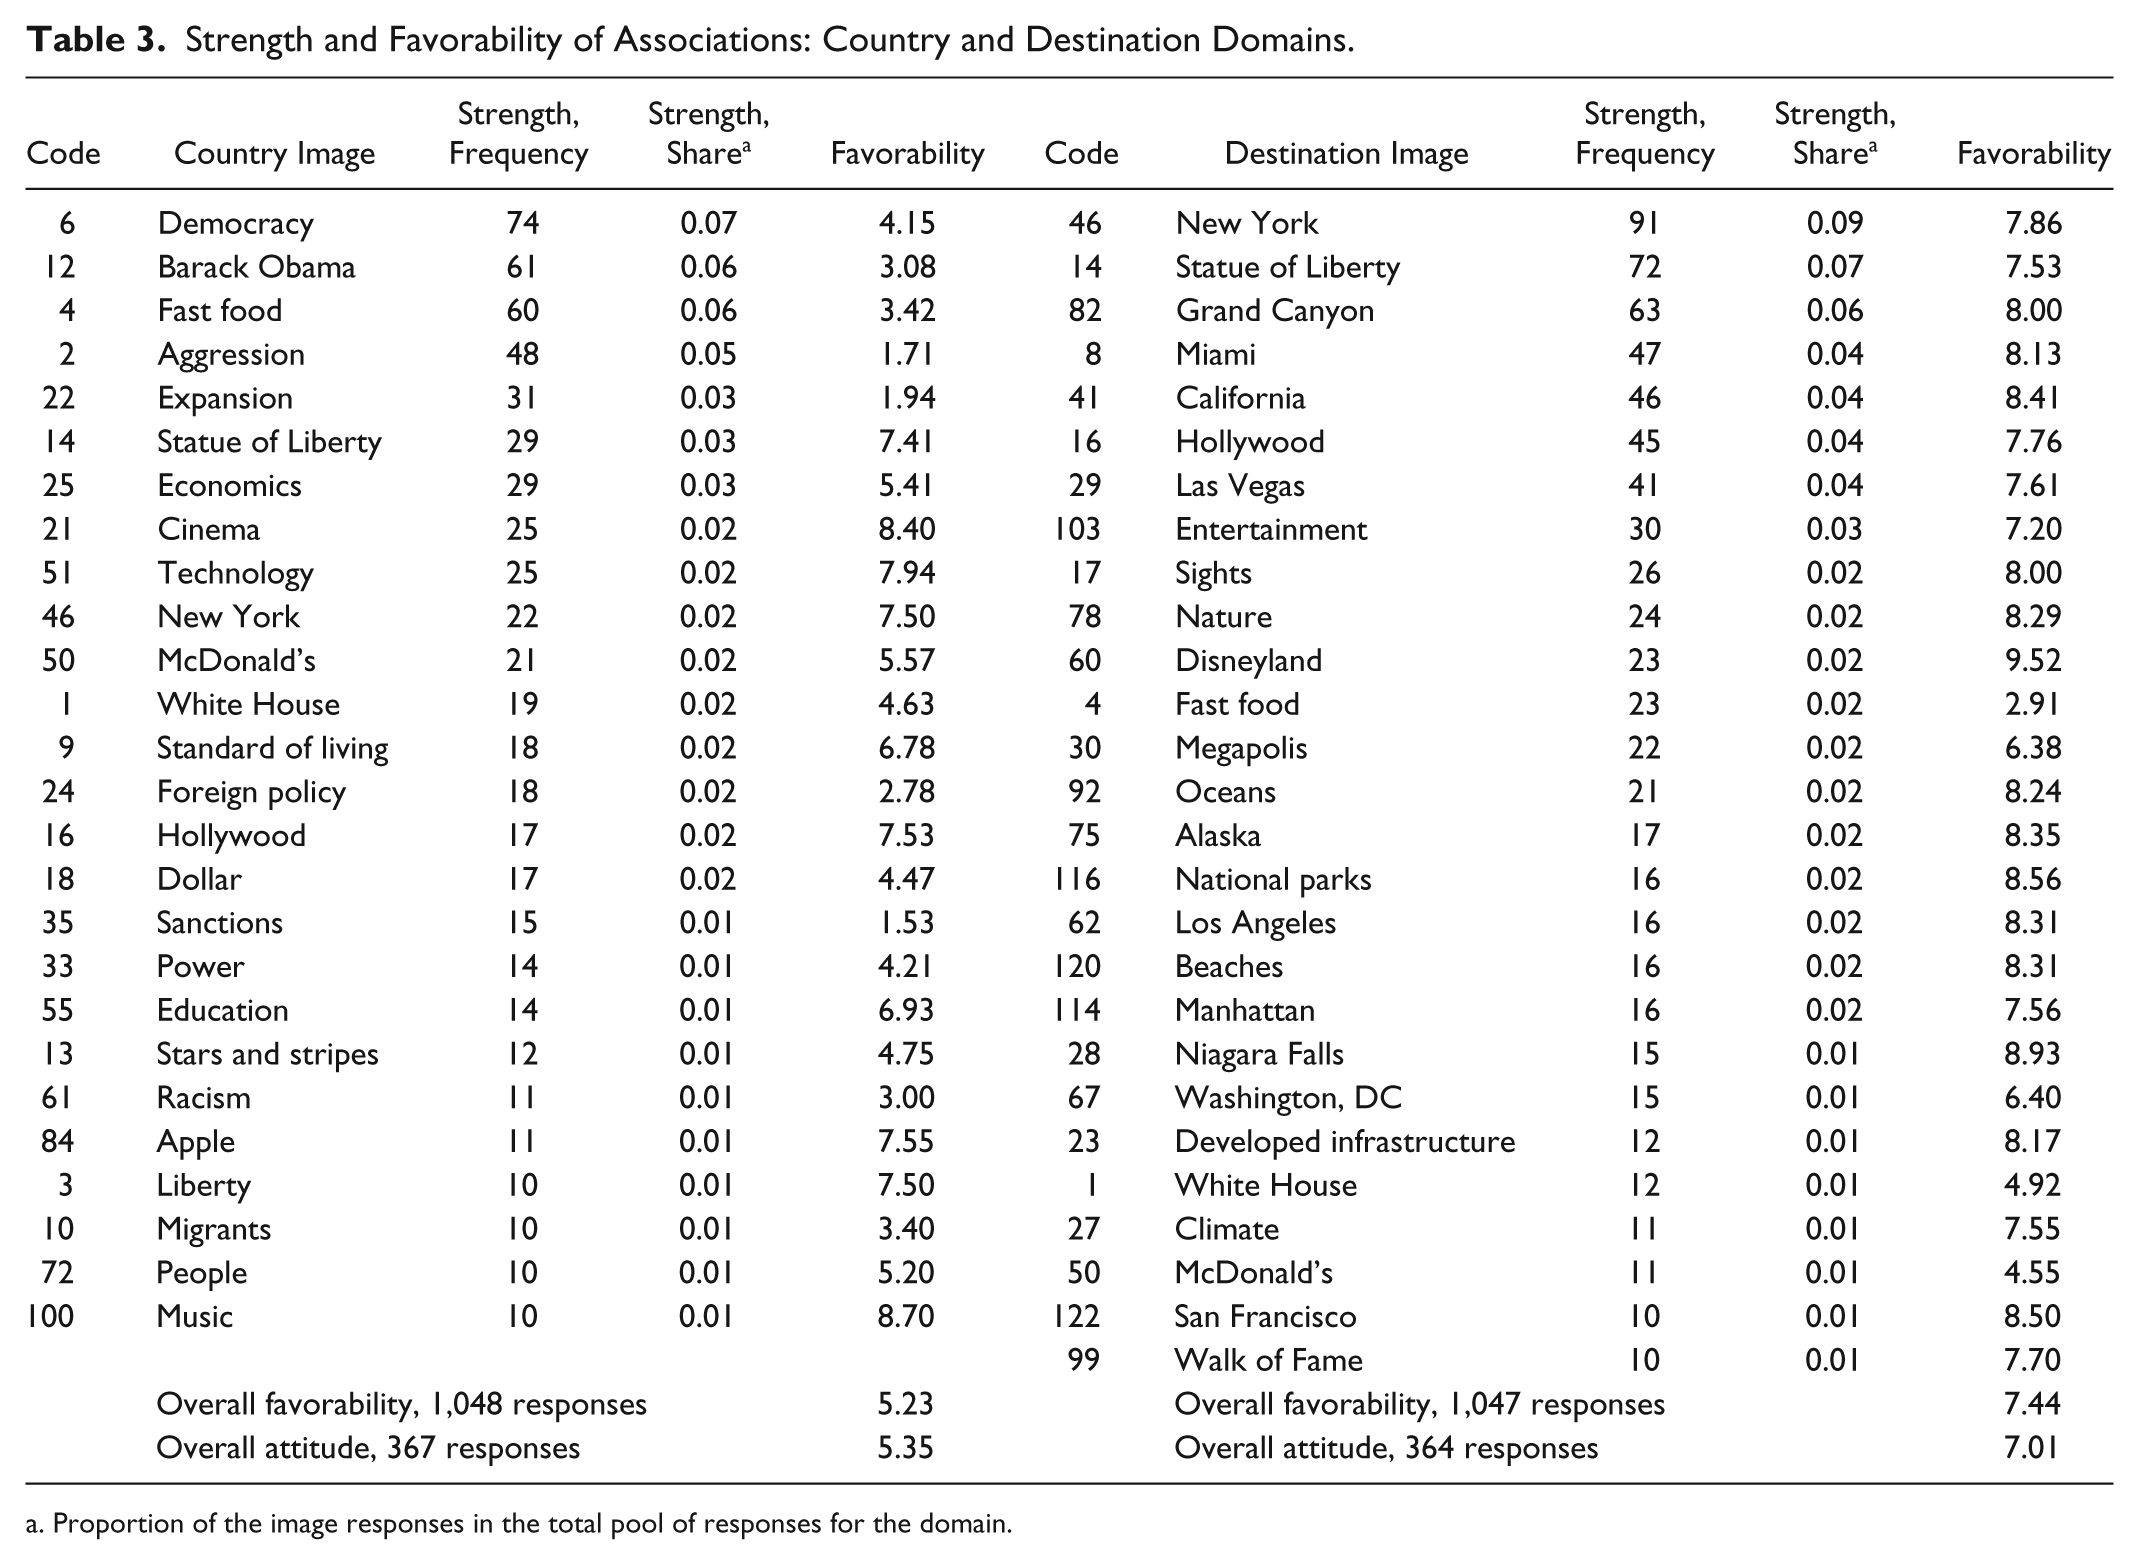
Proportion of the image responses in the total pool of responses for the domain.
All images with distinctive codes (184 in total) were evaluated for uniqueness of associations. The image was coded as unique to the United States if it was associated with a particular place in America such as a state (e.g., Hawaii), a city (e.g., Miami), a location (e.g., Broadway), or a geographical or tourist attraction (e.g., Great Lakes or Route 66). Images of global companies that originated in the United States such as McDonald’s, Coca-Cola, or Apple were also considered unique. Historical events (e.g., Civil War), political figures (e.g., George Bush), and icons of American mass culture such as cowboys or jeans were also considered unique in Keller’s (1993) sense. The gray area was associations pertaining to the U.S. political system and foreign policy, for example, bicameral Congress or the Vietnam War. Considering the fair amount of ambiguity, it was decided not to count such images as unique to the United States. Overall, the counts produced 66 distinctive image codes (out of 184) for associations that were considered “uniquely American.” These image codes accounted for 992 out of 2,095 total responses (47.35%). In the country and destination domains, there were 47 and 54 unique image codes, respectively; these codes accounted for 336 (32.06%) and 656 (62.65%) of all responses in the respective domains. Thus, the destination domain, while being less diverse, nevertheless contained more favorable images and more associations that uniquely belonged to the United States.
Types of Associations
To proceed from a large variety of U.S. associations to a smaller set of association types, the following question was posed: Do images that have the same code but were submitted under different domains have different connotations and are, in fact, different images? For example, if McDonald’s image is named under both country and destination domains, does it mean the same thing to those people who provided this image? Isn’t it possible that McDonald’s-country is primarily associated with quick service, convenience, and the overall effectiveness of the business model, while McDonald’s-destination is primarily associated with limited and not-so-healthy food choices for the traveler? If this is the case, the difference in associations may be reflected by the difference in favorability scores for a particular image code in the respective domain; in the case of McDonald’s, 5.57 (country) versus 4.55 (destination). To answer this question precisely, favorability analysis for the images at the intersection of the country and destination domains was conducted. The assumption was that if a group of people provides a particular image under the country domain (Ici), and another group of people provides image I under the destination domain (Idi), then if the favorability scores of Ici and Idi are statistically different, then it is likely that these scores pertain to different images with different connotations. If the favorability scores of Ici and Idi are not statistically different, then they most likely pertain to the same image with similar connotations.
There were 96 distinctive images that were given as answers to Q1 in both the country and destination domains (further referred to as images in the intersection of the two domains). As expected, there were large disparities in frequencies of the same image codes. For example, only six top image codes (Table 4) were in the intersection of both domains: Fast food, Statue of Liberty, New York, McDonald’s, White House, and Hollywood. These images had relatively large and comparable in size frequency numbers and, therefore, their favorability scores were subjected to the t-test analysis for independent samples (since images were provided by different people). Images with large disparities in frequencies or small frequency numbers were subjected to the Mann-Whitney U test, which is a nonparametric analog of the t test for independent samples. No analysis was conducted if at least one frequency number was less than 5. Thus, the favorability of 23 images were compared using either parametric or nonparametric tests. Remarkably, not a single test returned a significant result, indicating that an image with a distinctive code provided under the country and destination domains is likely to have the same connotations. This result supports the view that image domain has no effect on image connotations and favorability (Table 4).
Intersection of the Country and Destination Domains: Favorability Analysis.
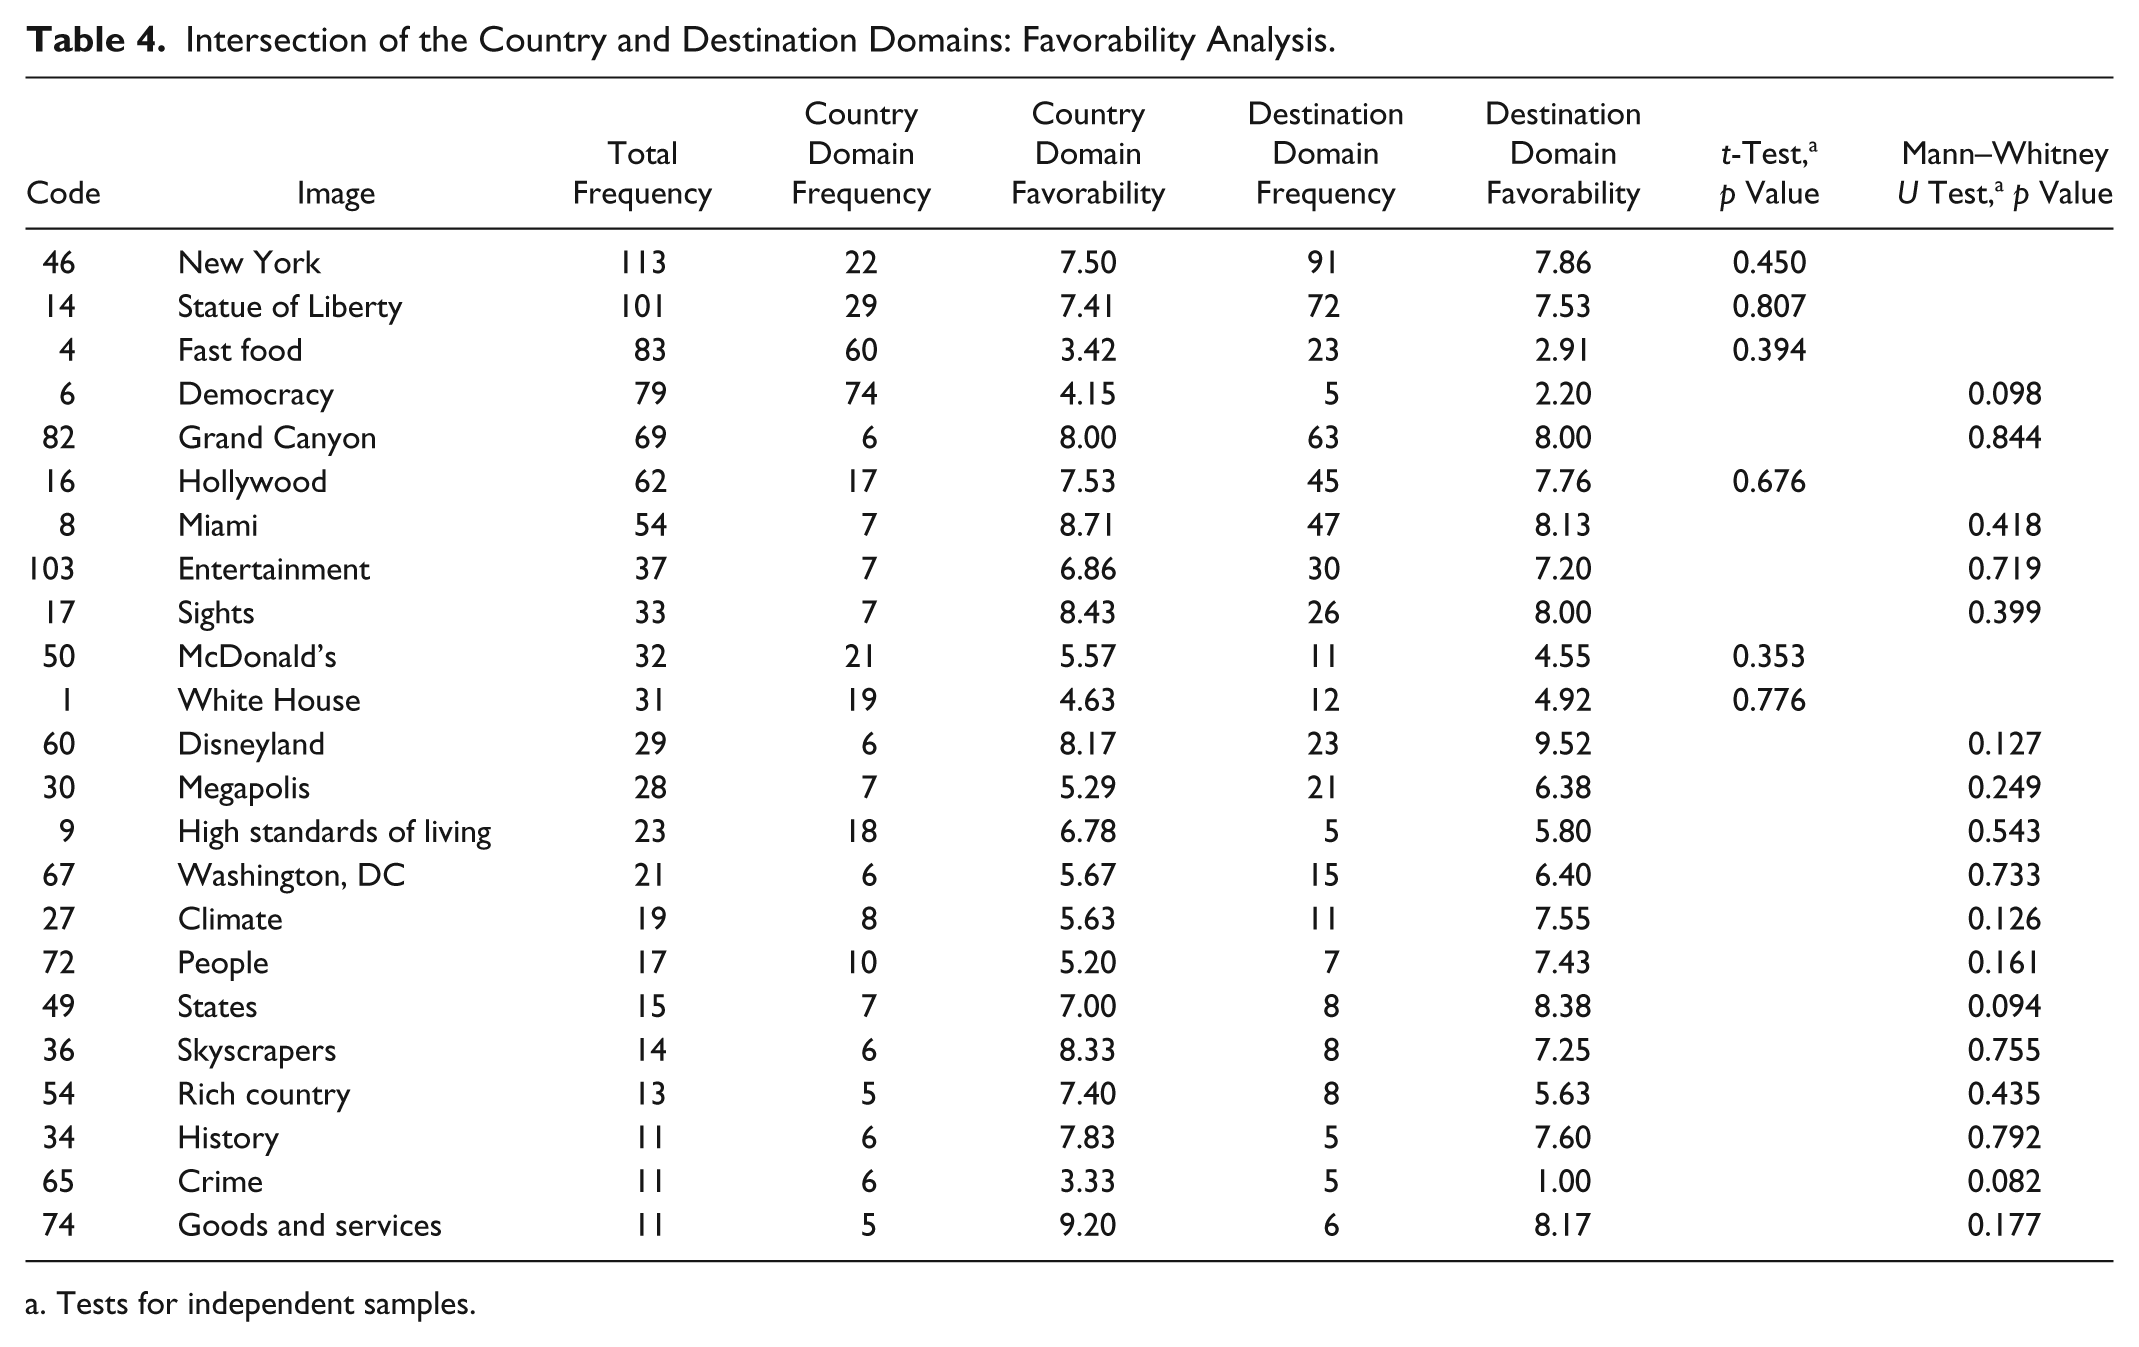
Tests for independent samples.
The next step was to compress 184 image codes into a smaller, more manageable set of categories, or types of image associations. As it had been found that unique image codes carry the same associations irrespective of the domain, one category system had to be established for all images supplied by respondents. Thus, McDonald’s should belong to the same category, irrespective of whether the image was named under the country or destination domain. Construction of the category system for image classification was guided by literature, previous and ongoing research by the authors, and favorability scores that respondents assigned to images. With respect to country image, standard of living, wealth, technology, economy, democracy, infrastructure, product quality, and innovativeness are prominent country attributes (e.g., Martin and Eroglu 1993; Roth and Diamantopoulos 2009). Therefore, all these categories were considered as well as categories identified by Li and Stepchenkova (2012) who studied America’s destination image from the perspective of Chinese tourists and classified images as pertaining to the following types: U.S. states, cities, and attractions; scenic beauty, excitement, entertainment, free democratic society, and economy.
Ongoing research by the authors (qualitative interviews with Russian tourists) and knowledge of current events and media discourse in Russia have provided further insights into what meaning Russian active and potential tourists may attach to various images. In addition, favorability scores provided guidance in situations when it was not immediately clear how to classify a particular image, especially if this image was a rare one. For example, the image of media was included into Entertainment, Pop-Culture, rather than into Societal Issues or International Politics, Superpower category, based on the fact that the mean favorability for the media image was positive (similar to all images in the Entertainment, Pop-Culture category), while the other two categories were composed of the images that had mostly negative favorability. Finally, 11 types of associations were established, which are briefly described below. It should be pointed out that the names for categories are based on the most frequent images rather than less frequent or rare images. Association types are arranged by the overall frequency, and the numbers in parentheses indicate responses from the country and destination domains, respectively (Table 5).
Types of Associations: Country and Destination Domains.
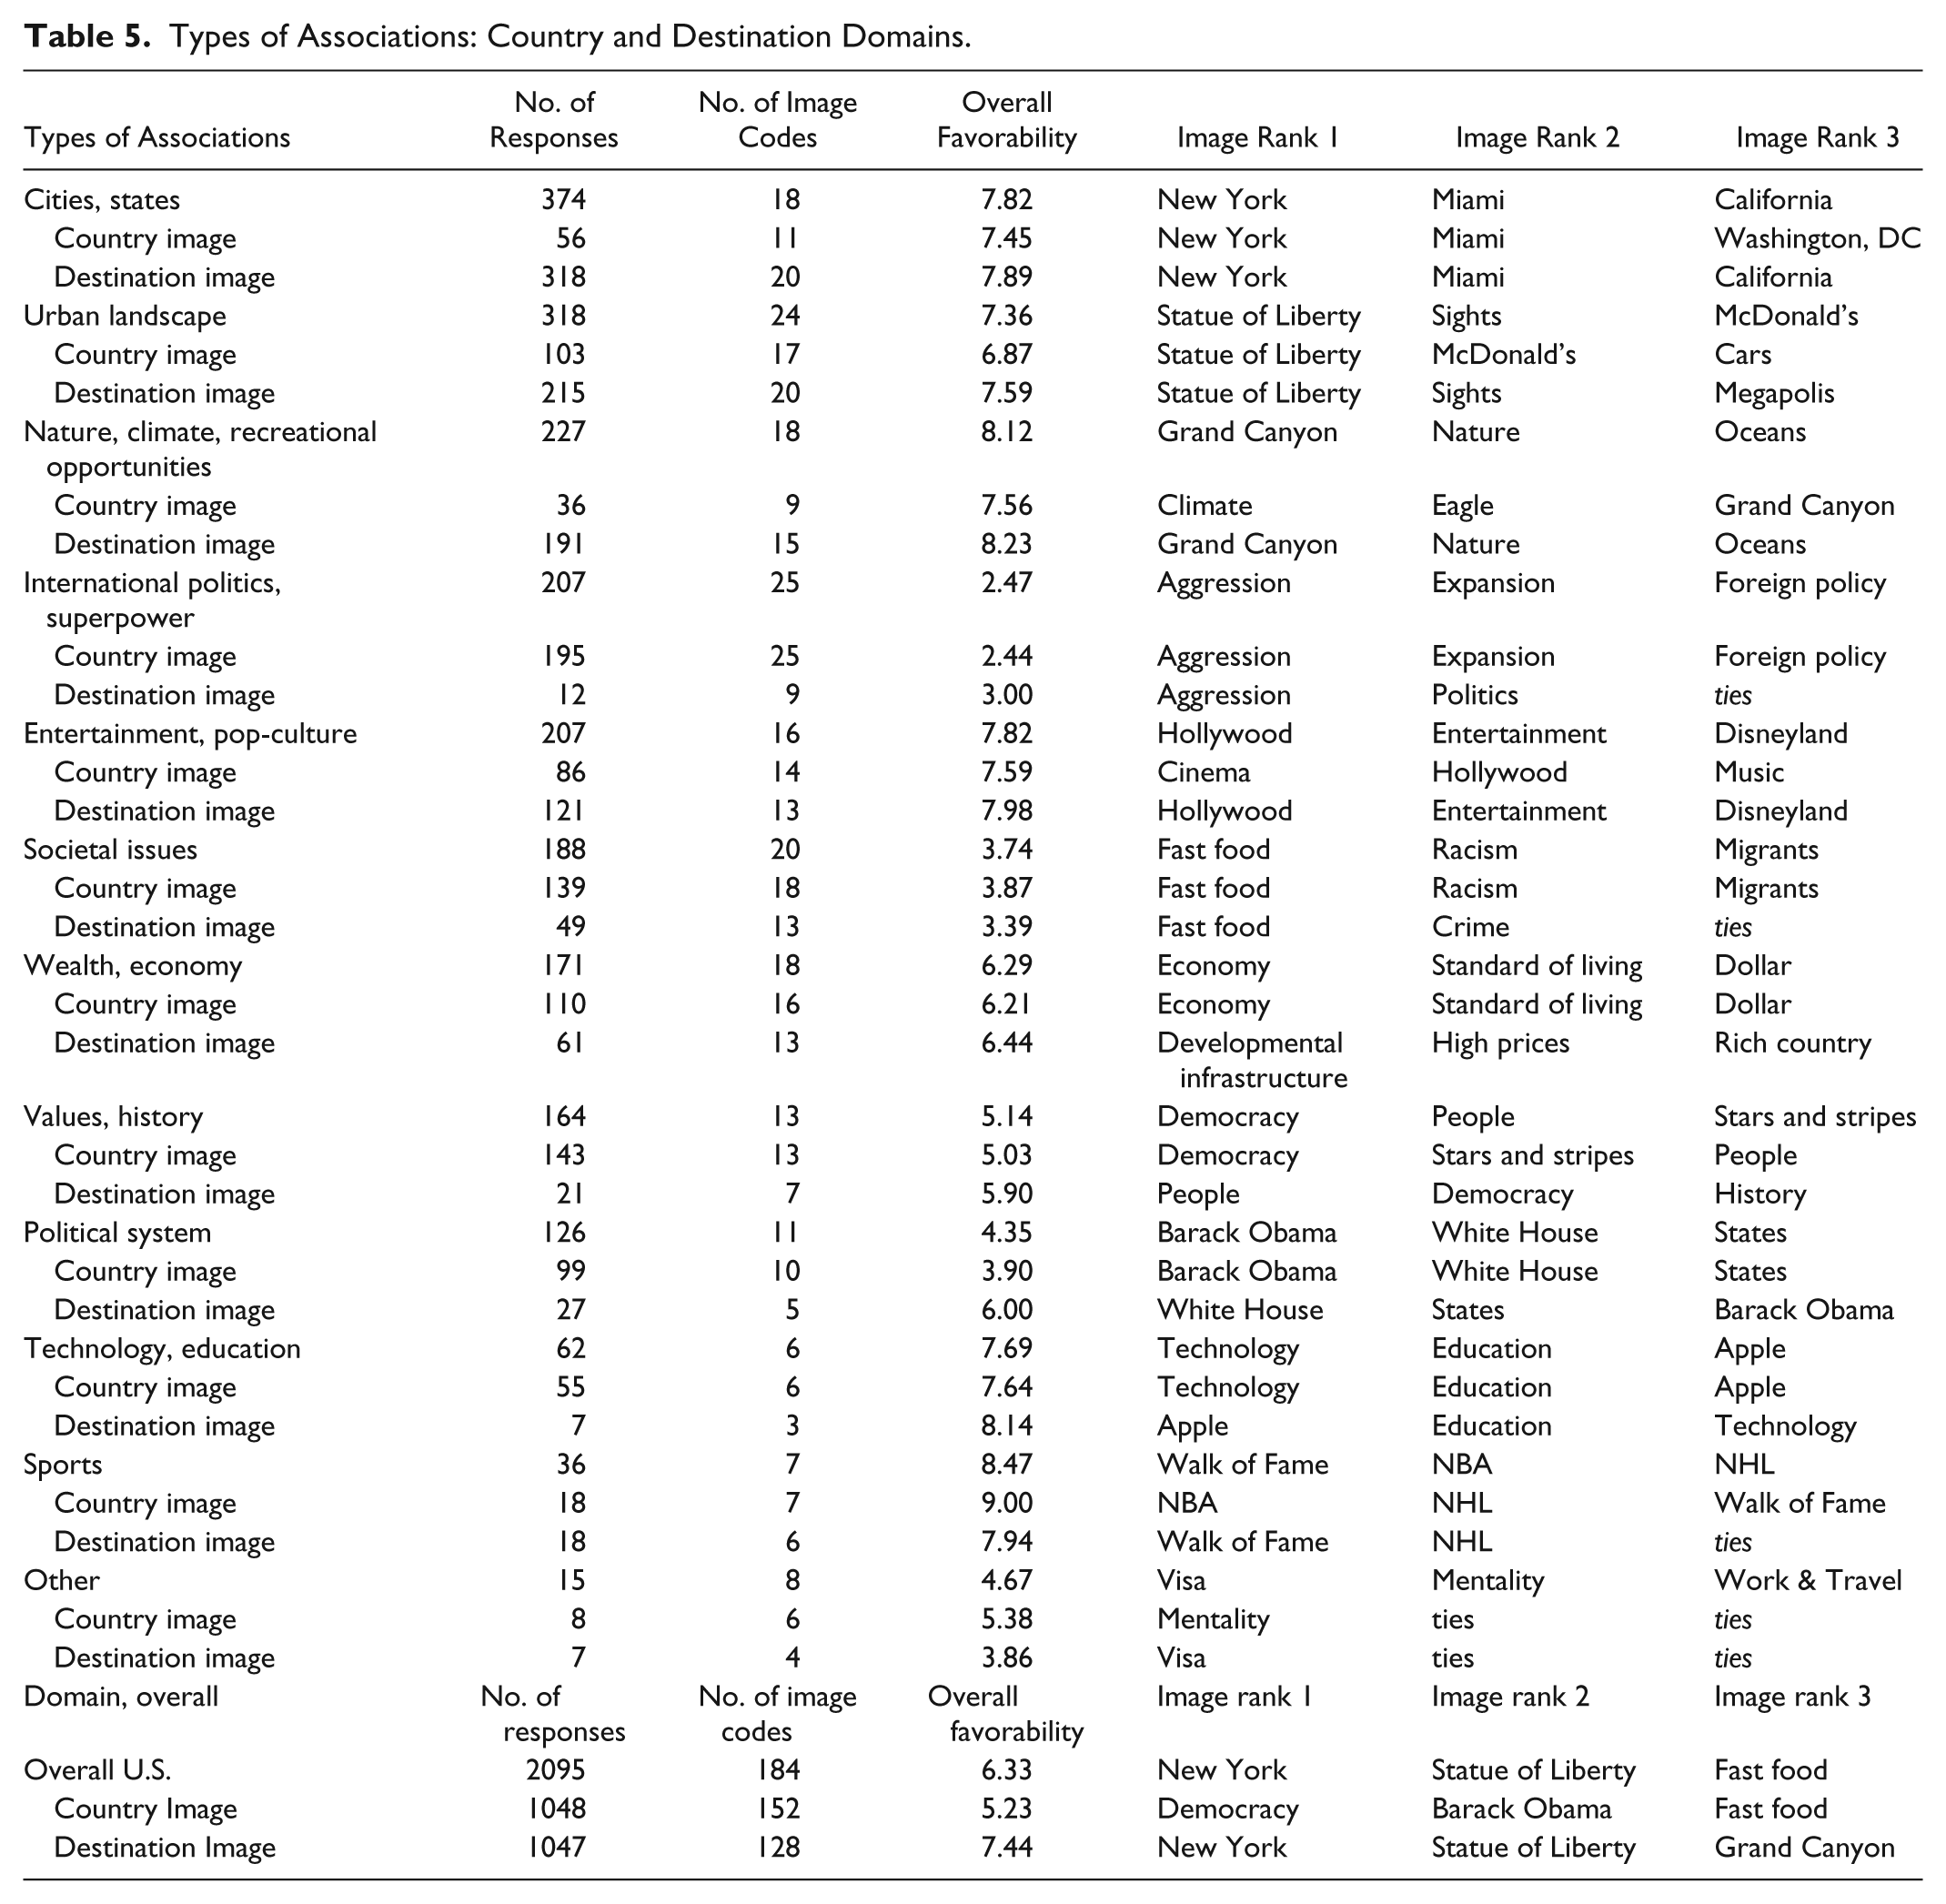
Cities, States (56/318)
This category included images of U.S. cities and states (18 image codes). New York, Miami, and Las Vegas were the most frequently mentioned cities, and California, Alaska, and Florida were the most frequently mentioned states. Images in this category were predominantly given under the destination domain. All images had mean favorability above the “neutral” point of 5.5, and the overall favorability score for the entire category is 7.82.
Urban Landscape (103/215)
Urban image of America is one of the dominant images (Li and Stepchenkova 2012), and it has a strong presence in this study (24 image codes). The image is formed around the city of New York. The Urban landscape image includes the Statue of Liberty, large metropolitan areas, sights, Manhattan, skyscrapers, cars, McDonald’s and Starbucks, museums, Times Square, bridges, and city parks. In a few instances, respondents mentioned the World Trade Center, Broadway, and Empire State Building. Images in this category were overwhelmingly positive, with just a few exceptions. The overall category favorability is 7.36.
Nature, Climate, Recreational Opportunities (36/191)
Images in this category were given predominantly under the destination domain and included 18 image codes. Images of the Grand Canyon, nature, oceans, and national parks dominate this category. Respondents also named such natural attractions as Niagara Falls, Yellowstone, Great Lakes, Death Valley, and Route 66. The overall favorability of the category is 8.12.
International Politics, Superpower (195/12)
This is a predominantly country image category (25 codes in total). It is dominated by the images of aggression, expansion, foreign policy, and sanctions. The themes of NATO, Cold war, Ukraine, Iraq war, CIA, and Pentagon are also present. Images in this category are overwhelmingly negative, with overall category favorability of 2.47.
Entertainment, Pop-Culture (86/121)
The category is primarily composed of the images of Hollywood, entertainment, Disneyland, movies, and celebrities (16 codes in total). Images of fashion, casinos, media, and Coca-Cola were also included into this category. This is a strongly positive category, with the overall favorability score of 7.82.
Societal Issues (139/49)
This is another negative category (overall favorability score is 3.74) with 20 codes. Images in this category were supplied predominantly under the country domain. The most frequent image is fast food. Other strong images are racism, migrants, crime, and obesity.
Wealth, Economy (110/61)
This category was built with the images of economy, high standards of living, dollar, opportunity for business, well-developed infrastructure, high prices, rich country, tourism, and goods and services (18 codes in total). The overall favorability of the category is 6.29.
Values, History (143/21)
Images in this category were provided mostly under the country domain. The most popular image by far was Democracy, which interestingly did not always have a positive favorability score. Other images included people, history, stars and stripes, liberty, diversity, American Dream, independence, tolerance, patriotism, leadership, as well as Abraham Lincoln and Civil War (13 codes in total). The overall favorability is 5.14.
Political System (99/27)
This category was composed of 11 distinctive images, including Barack Obama, White House, states, and George Bush. The overall favorability is 4.35.
Technology, Education (55/7)
This is a highly positive category (overall favorability is 7.69) composed of six images. The three most popular images are technology, education, and Apple. Harvard, innovations, and Microsoft provided just a few responses each.
Sports (18/18)
This is yet another small (seven image codes) but highly positive category (overall favorability is 8.47). The most popular images are Walk of Fame, NBA, and NHL.
Other (8/7)
Eight distinctive image codes: visa, work and travel, Panama Canal, Central America, mentality, sponsors, marvel, and suicide.
Attitudes toward the United States
As has been already mentioned, overall attitudes toward the United States as a country and as a destination (responses to Q3) differed significantly (5.35 vs. 7.01). Favorability scores of overall attitudes toward the United States as a country and as a travel destination were regressed on favorability scores of three most salient images in the respective domain (responses to Q2). The results indicate that three top-of-mind associations (answer choices 1, 2, and 3) are strong predictors of overall attitudes toward the United States as a country (R2 = 0.327, F(3, 320) = 51.775, all betas significant at the 0.001 level) and as a destination (R2 = 0.455, F(3, 322) = 89.640, all betas significant at the 0.001 level). In order to further probe into what association types contribute most strongly to the favorability of the overall U.S. country and destination images, the data set was reconfigured: survey subjects remained observations, while association types (image categories) became variables (11 in each domain). Every subject could have a score of 0, 1, 2, or 3 on any particular variable. For example, if a respondent gave New York, skyscrapers, and beaches as the three answers to Q1 in the destination domain, then she or he would have a score of 1 for the categories Cities, States; Urban Landscape; and Nature, Climate, Recreational Opportunities and a score of 0 for all other categories in the destination domain. If that person gave aggression, expansion, and foreign policy as the three answers to Q1 in the country domain, then she or he would have a score of 3 for the International Politics, Superpower category and a score of 0 in all other categories in the CI domain.
The results of the regression analysis for the country domain indicate (R2 = 0.123, F(4, 362) = 12.639, p < 0.001) that Entertainment, Pop-Culture (β = 0.509; p = 0.020) and Technology, Education (β = 0.597; p = 0.028) association types positively influence the overall attitudes toward the United States as a country. The associations pertaining to Political System (β = −0.538; p = 0.008) and International Politics, Superpower (β = −0.728; p < 0.001) influence it negatively. In the destination image domain (R2 = 0.028, F(2, 361) = 5.198, p = 0.006), Political System (β = −0.852; p = 0.040) and International Politics, Superpower (β = −1.261; p = 0.020) were the only types of associations that had a tendency to influence the overall favorability of attitudes toward the United States (Table 6). When included into analysis, sociodemographic variables were not significant.
Regression Analysis: Country and Destination Domains.

Discussion
The study proposes a framework to numerically describe the image of a place, that is, a wealth of all associations pertaining to that place, and empirically tests the proposed approach by comparing the country and the destination image domains using the United States as an example. Conceptualization and operationalization of the framework indicators are primarily guided by Keller’s (1993) work and the literature on biodiversity in biology. The building blocks of Keller’s framework are conceptually extended to the perspective of the “collective consumer”; therefore, the proposed measures are aggregative in nature. Thus, brand awareness, the customers’ share of mind (Day and Pratt 1971), is understood in terms of “ease of recall” as well as richness and diversity of collectively supplied associations. The indicators to operationalize the richness and diversity are taken from the biology literature, where they are used to describe and compare different bio-communities (Table 1); in this, the authors follow Stepchenkova and Li (2012, 2014) who first applied bio-diversity measures in the destination image context. The strength of a particular image association is operationalized as the overall frequency, and share, of that association in the total pool of responses in the respective domain. Favorability of that particular association is obtained by averaging favorability scores across all respondents that supplied that image. Uniqueness is the most subjective measure in this study, as interpretations of whether a particular image uniquely belongs to the United States were done by researchers themselves; in future studies, the measure of uniqueness can be included in the questionnaire and obtained directly from respondents. Finally, 184 distinctive image codes are classified into 11 association types based on the topic, or theme, that they represent.
The study found that, overall, the country and destination image domains of the United States have the same “ease of recall,” that is, the same number of supplied responses and, correspondingly, the same share of missing values (approximately, 8%) in the total pool of all allowable responses. However, the richness and diversity of associations are higher in the country image domain, as indicated by the richness R, Shannon’s H, evenness E, and Simpson’s dominance D indices (Table 2). Interestingly, the richness and diversity indices for destination domain are comparable in magnitude to those obtained in the studies by Stepchenkova and Li (2012, 2014) on America’s destination images of Chinese tourists, which, to the authors’ view, testifies to the stability and validity of the proposed approach. In general, associations pertaining to the destination domain are more positive than those pertaining to the country domain (weighted average of all favorability scores is 7.44 vs. 5.23), which seems to indicate that in the process of spreading activation, the “destination” cue activates the nodes that are on average more positive than the nodes activated under the “country” cue. In addition, aggregated favorability scores for each domain are very close to the favorability of the overall attitude for the respective domain, as supplied by respondents themselves in Q3: for country domain, it is 5.23 versus 5.35, and for destination, it is 7.44 versus 7.01 (Table 3). These results suggest that the proposed approach captures the overall attitudes of respondents in both domains, which is interpreted as yet another indicator of its validity.
Further, the study classified the wealth of supplied images into 11 association types. Since it was established that associations with the same image code but provided under different domains have the same favorability and, therefore, same connotations (Table 4), one category system is established for all associations (Table 5). The positive association types are Sports (8.47); Nature, Climate, Recreational Opportunities (8.12); Cities, States (7.82); Entertainment, Pop-Culture (7.82); Technology, Education (7.69); Urban Landscape (7.36); and Wealth, Economy (6.29). Negative associations belong to International Politics, Superpower (2.47); Societal Issues (3.74); and Political System (4.35), while associations pertaining to Values, History have a favorability score (5.14) just slightly below the “neutral” point. In general, the two domains country and destination overlap noticeably, as they share 52% of all image codes (96 out of 184) that account for 85% of all responses. Some of identified association types pertain to one domain more than to the other. Thus, association types Cities, States; Urban Landscape; and Nature, Climate, Recreational Opportunities appeared more frequently under the destination domain, while International Politics, Superpower; Societal Issues; Values, History; Political System; and Technology, Education are more strongly represented under the country domain. Associations pertaining to Entertainment, Pop-Culture; Sports; and Wealth, Economy are more or less equally present in both domains.
The obtained results indicate that the destination domain of the image is likely to be a subset of the country image (or “general” country image) domain, as the images in the intersection of the two have the same favorability and, as such, are likely to have the same connotations attached to them (Table 4). The fact that not all images from the destination pool were found in the country pool has, very likely, to deal with the procedure of image collection: each respondent in this study could supply only three most salient images. On the “country” cue, these top-of-mind associations were, in most cases, the U.S. iconic images (e.g., Statue of Liberty), stereotypes and schemas (e.g., fast food), as well as associations reflecting the conflicting bilateral relationship between the two countries at present (e.g., sanctions). On the “destination” cue, however, the spreading activation changes the route and goes through other, generally more positive, nodes. For people with more nuanced and developed images, activation in three steps (the number of allowed responses per person) reaches the nodes that are not among the most salient for the main body of respondents (Stepchenkova and Li, 2012); hence, there is a fair number of images that are given under the destination but not the country domain. This explanation is supported by the data: 32 image codes (17.4%) that appeared exclusively under the destination domain produced collectively only 137 responses (6.5%): the images of Manhattan and San-Francisco were the strongest (16 and 10 responses, respectively), with a mean frequency of 4.3 responses per image (Table 2).
The results seem to support the conceptualization of image given by Mossberg and Kleppe (2005) as a multitiered hierarchical structure. In that structure, general country image occupies the top level, with various associations pertaining to the place. At the second tier, the product-country image, that is, all associations pertaining to the country as a manufacturer of goods and services, are placed, including associations related to quality of the products produced in that country. In this study, association types Wealth, Economy and Technology, Education contain associations pertaining to the product- country image as specified by Mossberg and Kleppe (2005). A large number of associations supplied under the destination domain were found under the country domain as well. Some of these associations related to places in the United States (e.g., cities, states, national parks) and American products and brands (e.g., Apple, Coca-Cola). In the authors’ view, it indicates that (1) destination image shares attributes of both a place and a product; (2) place associations and product associations are subsets of the general country image; and (3) destination image and product-country image overlap.
While this study is more concerned with theoretical and methodological aspects of the country image–destination image relationship, it has practical implications as well, which may be helpful for destinations that are undertaking branding efforts and specifically for the Brand USA. First, the study has shown that different types of associations carry images that vary in favorability and, second, that some of these association types influence overall attitudes toward the country and destination more than others. For the country domain, Entertainment, Pop-Culture and Technology, Education affected overall attitudes positively, while Political System, and International Politics, Superpower affected them negatively. For the destination domain, only the Political System and International Politics, Superpower association types significantly influenced the respondents’ attitudes. It should be noted that in both regression analyses, the negative influence of the International Politics, Superpower category was the strongest.
The impact of certain association types on the overall attitudes is likely to depend on the sociodemographic characteristics of the market segments. Thus, favorable perceptions of the U.S. technology, high-tech brands, education, entertainment, music, and movies had a positive impact on respondents’ overall attitudes toward the United States as a country, the result which is likely to be reflective of the age and education level of the survey respondents, who are university students in this particular study. Because of the sample composition, the results are not generalizable on the entire population of Russian tourists, and additional research is required to determine what association types are the most influential for other tourist segments. It should be pointed out that a sample representative of the entire population of Russian travelers would have been a desirable research property, but the lack of representativeness is not a crucial limitation in this study because the focus of the research is not on obtaining the U.S. image but on the framework for comparison of two theoretical constructs. What is more important is that both country and destination images of the United States come from the same group of people, which allows for fair quantitative comparisons of country and destination image domains.
Furthermore, the results indicate that images that are induced by media and carry negative affect can be very strong and, thus, can overpower positive organic associations in their impact on the overall country or destination attitudes. In this study, the International Politics, Superpower association type has a large share (19%) in the overall recall in the country image domain and is populated with very negative images such as aggression (1.71), expansion (1.94), foreign policy (2.78), sanctions (1.58), etc. As these associations are very much “induced” by the current discourse of the political and economic conflict between the United States and Russia in the Russian general and social media, the result indicates that associations laden with negative affect can overtake the more positive organic stereotypes, schemas, and cultural markers in forming attitudes toward countries and destinations. In addition, examining favorability scores for some of the strongest images, that is, those with the largest share in the collective mind, such as democracy, would in this case reveal that for quite a few respondents, this image was not positive at all (mean favorability for the country domain is 4.15). Whatever the reasons for such an assessment, knowing it may be helpful in calibrating the Brand USA message on the Russian market.
It should be noted that the conflicting nature of the current relationship between the United States and Russia was likely to affect the U.S. image and reported metrics. When we were working on this article in April 2016, after more than a year and a half from the moment of data collection, the survey of public opinion by Levada Center (www.levada.ru/eng), a Russian nongovernmental research organization that conducts sociological research and monitors various social indices, reported the decrease in antagonistic attitudes of Russian people toward the United States and the West in general, for the first time since 2013. It is entirely possible that if the same study is conducted now, the obtained pools of images and respective favorability scores would differ from what is reported in this article. However, since the purpose of this research was not to obtain the image of the United States but to test the framework for quantitative comparisons of country and destination images, a conflicting nature of the relationship between the United States and Russia during the study was judged as conducive for the study objectives. It was reasoned that in a situation of strained bilateral relationships, the two constructs—country and destination images—are better delineated in the minds of actual and potential tourists, which allows to demonstrate more convincingly that (1) the constructs are indeed different, (2) spreading activation takes different routes for country image and destination image cues, and (3) the proposed framework is capable to capture these differences.
Methodological Issues and Future Research
For a balanced appreciation of research findings, the readers are reminded that several issues might have affected the study results in an unintended way. The first issue deals with the question of how well the pool of associations pertaining to the United States is represented by the three short answers to Q1. Since Q1 does not explicitly ask about emotions that respondents feel toward the United States, doesn’t it invalidate the comparisons and the overall framework? Previous studies have shown that the first question by Echtner and Ritchie (1993) about the most salient destination features (i.e., What images or characteristics come to mind when you think of XXXXX as a travel destination?) generates the largest pool of image responses and that the two subsequent questions regarding atmosphere or mood while at the destination and the destination’s unique features include a substantial share of images that have been already provided by respondents in their answers to the first question (Li and Stepchenkova 2012; Stepchenkova and Li 2012). In this study, it was reasoned that since Q1 does not restrict respondents with respect to the nature of supplied associations, the most salient responses could be physical things, places, attributes of a more psychological nature, stereotypes or schemas, feelings and emotions, etc. In the obtained pool of responses, however, the most salient “things” or “characteristics” were not emotions per se. The affective component of the image was, rather, expressed by the favorability scores that respondents gave to their associations (Q2) as well as the overall attitude toward the United States as a country and as a destination (Q3). In the future studies, the framework can incorporate a separate question on the emotions that a particular place elicits as a country and/or as a destination as well as the question on how unique the supplied associations are.
Second, the survey was conducted in the Russian language; therefore, short textual responses to Q1 were translated to English first, and responses with similar meaning (synonyms or those expressing the same idea) were grouped under the same image code. This transition from unstructured data in Russian to structured data in English introduced error to the data, which is difficult to estimate numerically. While the shortness of respondents’ answers made the task manageable, some of the classification decisions were unavoidably subjective. The task of assigning image codes to textual responses was conducted by a Russian graduate student with advanced knowledge of the English language. It was reasoned that if the coder had the same cultural and demographic background as the survey respondents, it would help her to better understand the meaning that participants attached to their responses. At the same time, not being a participant in the study would help the coder to distance herself from the data and, therefore, be more objective. In addition, the first author of the paper, being a Russian native speaker, implemented a quality control procedure on obtained image codes and checked 20 randomly selected original responses (in Russian), their translation (in English), and assigned codes. No inadequacies were registered. It was decided that the data were duly translated and carefully coded.
Third, some answers to Q2 (favorability scores for the three associations supplied in Q1) could have been considered as outliers that introduced error in calculating aggregated favorability scores. For example, one person gave a favorability score of 10 to the image of mafia, and another person gave a score of 1 to the image of democracy. However, as there was no way to check whether such cases were a mistake, a joke, or the scores, in fact, represented the respondents’ views on the subject, the scores were kept in the data. The influence of outliers for frequent images like democracy was reduced by averaging the individual scores. Outlying values for rare associations like mafia (three responses in total) noticeably impacted the overall score; however, since the image itself was rare, the [potentially] distorted score did not significantly affect the favorability score of the respective association type.
Fourth, in the process of data reduction, the main objective was to reduce the number of image associations to a more manageable number (in this case, 11) of association types that would represent various aspects of image mentioned in the literature. Several classification schemes have been considered (and tried to some extent) before it was concluded that the current system represents the data the best. It is acknowledged, however, that different classification schemes, with fewer or larger number of categories, can be used as well. While the authors strived to be as objective as possible in classifying images into established association types utilizing favorability scores as a guiding instrument, in some cases, classification of associations into one category or another was unavoidably a decision call. Nonetheless, since all association types are quite large, the influence of “ambiguous” cases on the type favorability or regression results is small. The only association types that are relatively poorly populated are Sports and Technology, Education, but all associations included into these categories are quite “straightforward.”
Future research on the nature and structure of place image and associative image networks can be conducted taking the framework proposed in this study as the starting point. Numerical comparisons of country and destination images pertaining to places other than the United States are needed to validate, improve, and/or amend the proposed approach. Such studies will contribute to deeper insights into the structure of place image and its domains as well as the relationships between these domains. The comparisons between the general country, product-country, and destination images can branch from this research as an extension study. From a more practical standpoint, the framework can be used in evaluating awareness and image of a set of competing destinations. Finally, the framework can be “scaled down” and applied to locales such as provinces or cities within a particular country and, thus, can have relevance for a large number of destination management and marketing organizations.
Footnotes
Acknowledgements
We acknowledge the valuable input of our student Valeria Vyahireva in translation and coding open-ended responses into English.
Declaration of Conflicting Interests
The author(s) declared no potential conflicts of interest with respect to the research, authorship, and/or publication of this article.
Funding
The author(s) received no financial support for the research, authorship, and/or publication of this article.