



Abstract
This study proposes that the structure of visitor flows within a destination significantly influences the overall economic value generated by visitors. In particular, destination network metrics (i.e., density, in-degree centralization, out-degree centralization, betweenness centralization, and global clustering coefficient) for 29 Florida counties were derived from 4.3 million geotagged photos found on the photo sharing service Flickr and then correlated with visitor-related spending reported by the Florida Department of Revenue. The results of regression analyses indicate that density, out-degree centralization, and in-degree centralization are negatively correlated with total visitor-related spending within a destination, while betweenness centralization is found to have a positive relationship. Based on these findings, it is concluded that the economic value generated by tourism is constrained by the destination network structure of supply-side and demand-side interactions. Further, it is argued that a “network orchestrator” approach to management can be used to better manage economic impacts within a destination.
Keywords
Introduction
In a desire to improve destination performance and competitiveness, destination management organizations (DMOs) are often challenged to understand how travelers’ activities within a destination create value, and to this end, several authors have suggested that new approaches to destination management are needed (Zach and Gretzel 2011; Wang and Fesenmaier 2007; Wang and Xiang 2007; Meriläinen and Lemmetyinen 2011). In response to this challenge, this study argues that a value network paradigm of destination can be quite useful for modeling and, ultimately, managing value creation within tourism destinations. This value network perspective is consistent with the tenets of service-dominant logic (Lusch, Vargo, and Tanniru 2010; Vargo and Lusch 2011; Wieland et al. 2012) wherein travelers are empowered by information technology to cocreate unique and personalized destination experiences (Gretzel 2010). We further argue that travelers’ aggregated experiences within a tourism destination generate a type of networked destination system that reflects the value cocreation processes between both supply- and demand-side actors. As such, we contend that the macrostructures of these value creation networks within a destination significantly affect the overall economic impact generated by tourism within a destination, and therefore a network paradigm of value creation serves as a useful framework guiding the “network orchestration” approach to destination management.
A tourism destination is often understood as a system comprised of distinct supply-side actors that are interrelated to each other through a variety of activities and the sharing of resources (Zach and Gretzel 2011); it has been argued by many scholars that understanding such relationships is crucial for evaluating the potential benefits of collaborative activities among the various destination firms (Wang and Fesenmaier 2007). As such, considerable research has been conducted to understand the relationships among destination stakeholders through applications of resource dependency theory, transaction cost economics, strategic management theory, and network analysis (e.g., Miguéns and Mendes 2008; Gnoth and Jaeger 2007; Del Chiappa and Presenza 2013; Zach and Gretzel 2011; Sfandla and Björk 2013). Indeed, network analysis has been used to understand interorganizational relationships in general since the 1960s (e.g., Levine and White 1961; Aiken and Hage 1968), and network analysis of tourism destinations has been employed since at least the 1990s (e.g., van der Heijden 1996; Baggio, Scott, and Cooper 2010). While the network paradigm is not uncommon in visitor-related research, it has been applied mostly to understand stakeholder relationships within a destination (e.g., Kubickova and Wang 2011; Wang and Fesenmaier 2007; Wang and Xiang 2007; Scott, Cooper, and Baggio 2008; Williams et al. 2017), or to describe the nature and characteristics of the destination using network metrics (e.g., Pavlovich 2003; Shih 2006; Wang and Xiang 2007; Kimbu and Ngoasong 2013).
Recent research, however, supports the proposition that the network structure of aggregate demand (i.e., travelers’ activities within the destination) significantly affects the value created within a destination. For example, studies by Stienmetz and Fesenmaier (2015a, 2015b) indicate that the patterns in which different destination attractions are combined during visitor journeys can predict quite well the overall aggregate visitor spending at attractions within the destination. While these studies and others (e.g., Sfandla and Björk 2013; Tax, McCutcheon, and Wilkinson 2013; Tham 2015; Zach and Gretzel 2011) provide a valuable base for this current research, it is important to note that this research mostly has been conducted at the individual actor level of analysis and within relatively simple destination systems (i.e., the various actors, activities, attractions, or touchpoints that together comprise the overall destination). So while the research examining network models of destination value creation has focused primarily on the value created from dyadic relationships between destination stakeholders, few studies have been conducted to understand how larger macro-level network structures can influence value created within a destination. As such, it is argued that this study makes an important contribution to the tourism literature by examining the relationship between a destination’s macro-level network structures and the value created within a number of destinations with the goal of identifying visitor flow patterns that maximize the economic impact of travel within the overall region (i.e., the State of Florida).
Measuring Value-Creating Networks within Tourism Destinations
The tourism destination is generally understood as being comprised of a series of supply-side stakeholders (e.g., transportation, accommodation, and attraction firms) and is often modelled as a value chain where value is created when visitors move (i.e., travel) through the destination before eventually returning home (UNWTO 2007; Poon 1993). The conceptualization of the tourism value chain is based on Porter’s (1985) deconstruction of a firm into its strategically relevant processes such as designing, producing, marketing, delivering, and supporting its products. Within this perspective, value can be interpreted in many different ways, such as the hedonic value experienced while partaking in a leisure activity (Gallarza and Gil Saura 2006; Yoon and Uysal 2005) or the economic value of tourism transactions (Sánchez et al. 2006; Pechlaner, Smeral, and Matzier 2002). As such, it is important to note that within the tourism destination, there are numerous processes that create value and therefore no single stakeholder controls all the elements of the destination value chain.
More recently, the tourism value chain model has evolved to reflect a networked perspective (e.g., Tham 2015; Gnoth and Jaeger 2007) so as to capture the way travelers actually plan, experience, and share travel (Fesenmaier and Xiang 2014; Gretzel 2010; Beritelli, Bieger, and Laesser 2013). No longer linear or static, value networks can be used to describe the multitude of potential destination touchpoint combinations, whereby individual value chains within the system are activated as travelers cocreate their own unique destination experiences (Zach and Gretzel 2011; Sfandla and Björk 2013). Within the context of changing patterns of tourism demand caused by travelers’ use of information technology, Stienmetz and Fesenmaier (2013) proposed the destination value system (DVS), which conceptualizes a tourism destination as a constellation of networks representing matrixed and simultaneous value-creating interactions between both supply-side and demand-side actors. That is, visitor flows (which include both spatial movement patterns and virtual dimensions of traveler experiences) cocreate value within a tourism destination (Baggio and Scaglione 2017). Thus, the “variable geometry” of visitor flow networks provide valuable information about the interconnectedness of a tourism destination system from both supply- and demand-side perspectives (Beritelli et al. 2015, p. 200) and signifies an important shift from a “value added” paradigm (i.e., the return on investment from marketing and sales activities) to a “value creation” paradigm (i.e., customer journeys across destination touchpoints), which highlights relationships between stakeholders that can enhance differentiation or reduce costs (Porter 1985).
The visitor flow network approach to describing destination value creation is consistent with the idea of DMO as “network orchestrator” which emphasizes the broader responsibilities of leading, facilitating, and organizing the collaboration and cooperative efforts of the individual actors/stakeholders that comprise the destination (Zach and Gretzel 2011; Wang and Fesenmaier 2007; Wang and Xiang 2007; Meriläinen and Lemmetyinen 2011; Beritelli et al. 2015). That is, network orchestrators can create value by encouraging actors representing both supply and demand to connect, interact, and transact (Libert, Beck, and Wind 2017). Further, these authors argue that the measurement of value creation networks are essential (Mauboussin 2012) as they provide the foundation for the development of strategies that can enable the destination to become more competitive (Ritchie and Crouch 2003; Ritchie and Ritchie 2002; Wöber 2002). The following provides a brief overview of the basic network metrics used to assess the structural relationships within the visitor flow network.
Network Density
Network density is a macro-level measure of the overall connectedness of a system and is calculated by dividing the total number of connections or relationships observed within a network by the total number of possible connections, referred to as ties, that could occur within that network (Aggarwal 2011, p. 180); thus, network density is expressed as a proportion ranging from 0 to 1 (see equation 1) where the more ties that are realized, the denser the destination network is considered to be.

where L is the number of ties realized in the network and g is the number of nodes in the network.
As a network’s density increases, so too does its embeddedness. Embeddedness refers to “the stockpiling of reciprocal obligations through social relations that act as the glue that binds interests together in patterns and webs of integration” (Scott, Baggio, and Cooper 2008, p. 81). Studies show that the embeddedness of tourism organizations fosters interorganizational trust and the promotion of knowledge transfer and learning (Bhat and Milne 2008). Thus, it is argued that as the density of a visitor flow network increases, the embeddedness of the destination increases, resulting in shared values and conformity within the network. Further, it is argued that shared values, conformity, and reciprocal obligations are expected to increase overall destination performance and competitiveness (Ritchie and Crouch 2011). These studies provide the foundation for the following hypothesis:
Hypothesis 1: Destination visitor flow network density will have a significant positive effect on total travel-related spending within the destination.
In-Degree and Out-Degree Centralization
There are several micro-level metrics used to describe the importance, or centrality, of individual actors within a social system. One common metric of network micro-structure is degree centrality, k, which is the count of ties that an individual node has with all the other nodes in the network. When networks are specified with ties that have weighted values representing the intensity or strength of the relationships between actors, then weighted degree centrality—also known as node strength
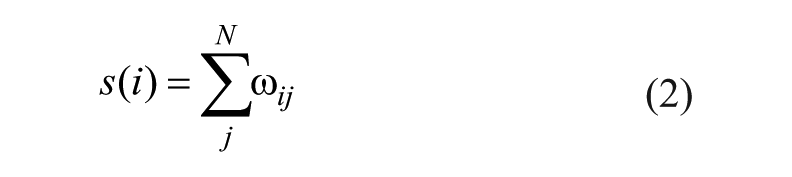
Weighted degree centrality is, therefore, a measure of the extent to which a particular actor is connected with the rest of the system. An actor with high centrality is usually considered more powerful or influential than other actors because of greater access to exchanged resources (Bhat and Milne 2008); as such, it is argued that touchpoints with high degree centrality within a destination visitor flow network should be considered especially important in determining the competitiveness of a destination (Stienmetz and Fesenmaier 2013).
The macro-level equivalent of centrality is known as network centralization. Centralization metrics quantify how “centralized–decentralized” the actors within a system are (Freeman 1978). The general formula for network centralization is shown as equation 3, where
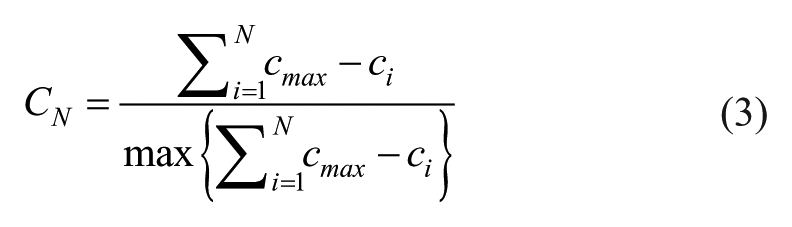
Thus centralization metrics take values from 0 to 1; networks with high centralization are characterized by having relatively few actors with high centrality serving as hubs within the system, and networks with low centralization are characterized as having most actors with similar levels of connectedness. A network with a centralization of 1 is often referred to as a star network and is characterized by the existence of some node i such that every link in the network involves node i (Jackson 2010, p. 27). Conversely, a network with a centralization of 0 would be a circle network where all actors have exactly the same centrality (Freeman 1978; Kang 2007).
For directed networks where the direction of each relationship between actors is specified (i.e., the flow of visitors from touchpoint A to touchpoint B is distinct from the flow of visitors from touchpoint B to touchpoint A), two separate measures of in-degree centrality and out-degree centrality can be determined for each node, and network measures of both in-degree centralization and out-degree centralization are expected to relate to total visitor-related spending. Within social systems (such as tourism destinations), out-degree centralization often represents coordination functions among the distinct actors (Bhat and Milne 2008). In the case of destination visitor flow networks, out-degree centrality represents the extent to which one touchpoint “distributes” tourists to other touchpoints within the system, thereby elevating its level of influence on the system and creating an opportunity for other touchpoints to make use of its resources. In-degree centralization, on the other hand, represents the processes of resource procurement and utilization. In the case of destination visitor flow networks, in-degree centrality characterizes the extent to which one touchpoint “receives” tourists from other touchpoints within the system.
Issues of inequity affect actors within a social system in terms of how they interact and whether resources (such as tourists) are received (Easterby-Smith, Lyles, and Tsang 2008). Likewise, touchpoints within a destination are not equal; that is, the uniqueness and attractiveness of destination touchpoints vary significantly, as do the resources that touchpoints can leverage in order to improve their competiveness within the market. The access to resources, therefore, may have a direct correlation with a touchpoint’s ties within the destination (Cooper 2006). Further, key attractions with high out-degree centrality may be an essential element of the destination experience as a wide variety of other touchpoints are then receiving the travelers from these highly central hubs (Pearce 2001). Thus, within the context of destination visitor flows networks, increased out-degree centralization would suggest that key touchpoint hubs within the destination spread resources and can increase a destination’s capacity to create value. This research leads to the following hypothesis:
Hypothesis 2: The out-degree centralization of a destination visitor flow network will have a significant positive effect on total travel-related spending within the destination.
Interestingly, while high in-degree centrality might be an objective for an attraction within a destination, high in-degree centralization of the overall visitor flow network indicates that only a few attractions (i.e., touchpoints) are successfully attracting visitors relative to the competition of alternative destination touchpoints. Alternatively, a visitor flow network with low in-degree centralization describes a system with a variety of attractions of equal resources. Thus, actors with relatively high in-degree centrality are more “powerful” as they control more resources at the point of value creation (i.e., tourists within the destination) and therefore can influence the behavior of other touchpoints. Power asymmetries may result in some actors within the value network being disadvantaged and unable to maximize value creation (Ford, Wang, and Vestal 2012), which would have implications for the total value created within the system. That is, the greater the in-degree centralization of a destination, the more dominated it would be by a few key attractions receiving resources. As such, the following hypothesis is proposed:
Hypothesis 3: The in-degree centralization of a destination visitor flow networks will have a significant negative effect on total travel-related spending within the destination.
Betweenness Centralization
Node betweenness centrality is a measure of the extent to which a particular node lies between various other nodes within the network. The formula for calculating weighted betweenness centrality (
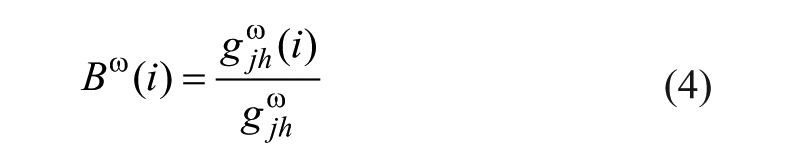
Weak ties theory and structural holes theory suggest that nodes that have fewer nonredundant ties connecting the clusters of nodes surrounding them have key brokerage positions within the network (Burt 2004, 1980). Nodes with high betweenness centrality can, therefore, be considered bridges or boundary spanners—actors with the ability to more easily communicate with other clusters of actors within the network. Studies show that boundary spanners can play critical roles in determining the overall success of a network as the flow of resources (such as knowledge or travelers) in part depends on the ability of boundary spanners to create key relationships between other nodes within the network (Easterby-Smith, Lyles, and Tsang 2008). Furthermore, studies suggest that the more diverse attractions within the tourism destination, the more critical the role of a boundary spanner is for the flow of resources between DVS subcommunities (Carlile 2002). Bridging ties may also benefit the tourism destination and increase value creation as they promote imitation and innovation at the destination, as boundary spanners facilitate the spreading of best practices (Haugland et al. 2011; Ness et al. 2013). Based on this literature, the following hypothesis is formed:
Hypothesis 4: The betweenness centralization of a destination visitor flow network will have a significant positive effect on total visitor-related spending within the destination.
Global Clustering
Clustering is a micro-structure metric that describes the extent to which an actor and its immediate neighbors are all directly linked to each other within a social system (Freeman 2011). Clustering is based upon the ties within all triplets (sets of three nodes) found in a network. Equation 5 shows the formula for determining a node’s weighted clustering coefficient

The macrostructure equivalent of nodal clustering coefficient, referred to as the global clustering coefficient (or network transitivity), is the ratio of closed triplets (three ties connecting three nodes) to partially connected triplets within a network (Jackson 2010, p. 35). Thus, global clustering coefficient is a macrostructure measure of the cohesiveness of the system and an indication of the probability of actors forming subcommunities, which again benefit from high embeddedness (Jackson 2010). The formation of network subcommunities has been shown to lead to homophily and a sharing of common values among cluster members (McPherson, Smith-Lovin, and Cook 2001). This suggests that collaborations among actors within a system subcommunity are more likely to be successful compared to collaborations with actors outside the subcommunity.
Studies indicate that subcommunities within a destination visitor flow network may represent a distinct community of practice, where processes, languages, systems, etc. are different from other actors within the system at large (Star and Griesemer 1989; Easterby-Smith, Lyles, and Tsang 2008; Van Wijk, Jansen, and Lyles 2008). Therefore, global clustering coefficient describes the diversity within a social system such as a tourism destination. Studies on the effects of network diversity have had mixed conclusions. For example, studies of multinational corporations have found that diversity in supplier networks led to a decrease in profitability (Goerzen and Beamish 2005); however, network diversity has also been found to increase innovation within organizational systems (Hargadon and Sutton 1997). While challenges may be involved with spanning boundaries that exist between different subcommunities (Carlile 2002), it is expected that the more diverse the destination system, the more overall advantage will be gained based upon the unique perspectives of each subcommunity. That is, when linked together network subcommunities can provide a diversity of resources for competitiveness. Recent research in social-economic networks suggests diversity in network ties improves opportunity for community success (Eagle, Macy, and Claxton 2010). Furthermore, studies indicate that the diversity of a system is a key component of system resiliency, as diversity of network actors is necessary to balance systemwide homophily, which may otherwise stifle a system’s ability to react to unexpected change (Newman and Dale 2005). These findings lead to the following final hypothesis:
Hypothesis 5: Global clustering coefficient of a destination visitor flow network will have a significant positive effect on total visitor-related spending within the destination.
Methodology
A quasi-experimental approach was used for hypotheses testing by first deriving the visitor flows networks of 29 Florida counties from the volunteered geographic information (VGI) of 4.3 million geotagged photos found on the photo-sharing service Flickr and then correlating network structures (i.e., density, in-degree centralization, out-degree centralization, betweenness centralization, and global clustering coefficient) with visitor-related spending reported by the Florida Department of Revenue. Quarterly network and spending data were generated for each county from 2007 through 2015 in order to control for individual heterogeneity of counties over time (i.e., marketing budget, population, average temperature, etc.) and econometric analysis of panel data was undertaken.
The analysis of VGI metadata has become an established methodology that allows researchers to reliably trace visitor flows through a destination (e.g., Kádár 2014; Purves and Hollenstein 2010; Vrotsou et al. 2011). In particular, VGI shared on social media are now used to guide destination marketing, advertising, and development decisions (Xiang and Fesenmaier 2017). Flickr is a popular and ideal source of secondary VGI for travel-related research for several reasons. First, an advantageous characteristic of Flickr users is their motivation to create an extensive archive of personal photos and to then share their photos with their friends and social networks (Angus and Thelwall 2010). This archiving behavior suggests Flickr users upload nearly all photos taken during travel (Murray 2008), thereby creating a reasonably complete record of places visited. Secondly, as much as 28.8% of Flickr users are estimated to geotag their photos, thereby voluntarily opting in to share the time and location (i.e., VGI) of where their photos are taken (Purves and Hollenstein 2010). Furthermore, another study was conducted to assess the validity of Flickr VGI in describing “real” travel behavior; in particular, Stienmetz and Fesenmaier (2016) found a strong correlation between network structures based on Flickr VGI and network structures based on reliable visitor survey data.
In order to match visitor flow networks with visitor-related spending, tourism destination boundaries were operationalized as the individual counties in the State of Florida. This was an essential requirement as sales data was only reported at the county level. While it is acknowledged that regional administrative boundaries have little bearing on the flow of travelers (Beritelli, Bieger, and Laesser 2013), it is important to point out that each Florida county has its own autonomous policies regulating travel and tourism. For example, each county in Florida has the discretion to charge a “bed tax” which ranges from zero to 6% of transient room sales. Further, while the state tourism office (e.g., Visit Florida) is responsible for the overall promotion of tourism for the State of Florida, each county also has a Tourism Development Council (TDC) which uses the bed tax revenue to promote and develop tourism within the county (Florida Department of Revenue 2016).
The collection of VGI data was carried out using the Flickr API (Flickr 2016) between March 1, 2016, and April 15, 2016. This resulted in a database containing a total of 4,256,236 unique photos and related metadata that were taken in the State of Florida between January 1, 2007, and December 31, 2015. The relevant metadata captured for each photo included the unique identifier of each photo, the username, the time and date the photo was taken, and the latitude and longitude where the photo was taken. Photos were uploaded by a total of 85,393 unique users, and while the average number of photos uploaded per user is 53.9, there is substantial variation (standard deviation of 385.2 photos per user). The number of photos uploaded per user follows a power-law distribution, where the majority of users take relatively few photos, and a minority of users upload a very large number of photos. Indeed, analysis reveals that 22,230 users uploaded only one photo, while the most photos uploaded by a single user was 42,315.
Several data-cleaning and data-processing steps were required in order to construct the destination visitor flow networks. First, 528,883 photos were excluded from analysis because the latitude and longitude data were not recorded at a street-level or better accuracy (Flickr 2016). For the purposes of this study, destination touchpoints were operationalized as the specific locations in physical space in which photos were taken within destinations. In order to maintain a manageable number of touchpoints for each destination visitor flow network and ensure adequate coverage of touchpoints (i.e., enough travelers to each touchpoint), this study follows Vrotsou et al. (2011) and rounds the latitude and longitude coordinates of each photo down to a precision of three decimal places. In this way, all photos geotagged within an approximately one city block area were aggregated to a single touchpoint. Additionally, because the original data set obtained from Flickr contained photos that were not tourism related, steps were taken following Vrotsou et al. (2011) whereby visitor-related touchpoints were operationalized as being photographed by at least five unique Flickr users; therefore touchpoints photographed by fewer than five unique users where excluded from further analysis.
Visitors were operationalized as any unique Flickr user that photographed (i.e., visited) at least one touchpoint within the county. Consequently, this analysis did not consider whether or not a Flickr user was a local inhabitant or whether or not they were staying overnight in the destination. Instead, this operational definition of visitor captures both the resident and nonresident activity which both contribute to the total visitor-related spending within the county. Related to the visitor construct, a trip segment (i.e., tie connecting two touchpoints) was defined as a visitor’s movement from one touchpoint to another within a seven-day period beginning on a Wednesday and ending on a Tuesday. If visits between attractions occurred within different weeks, they were then treated as independent events and were not considered to be connected by a specific trip segment.
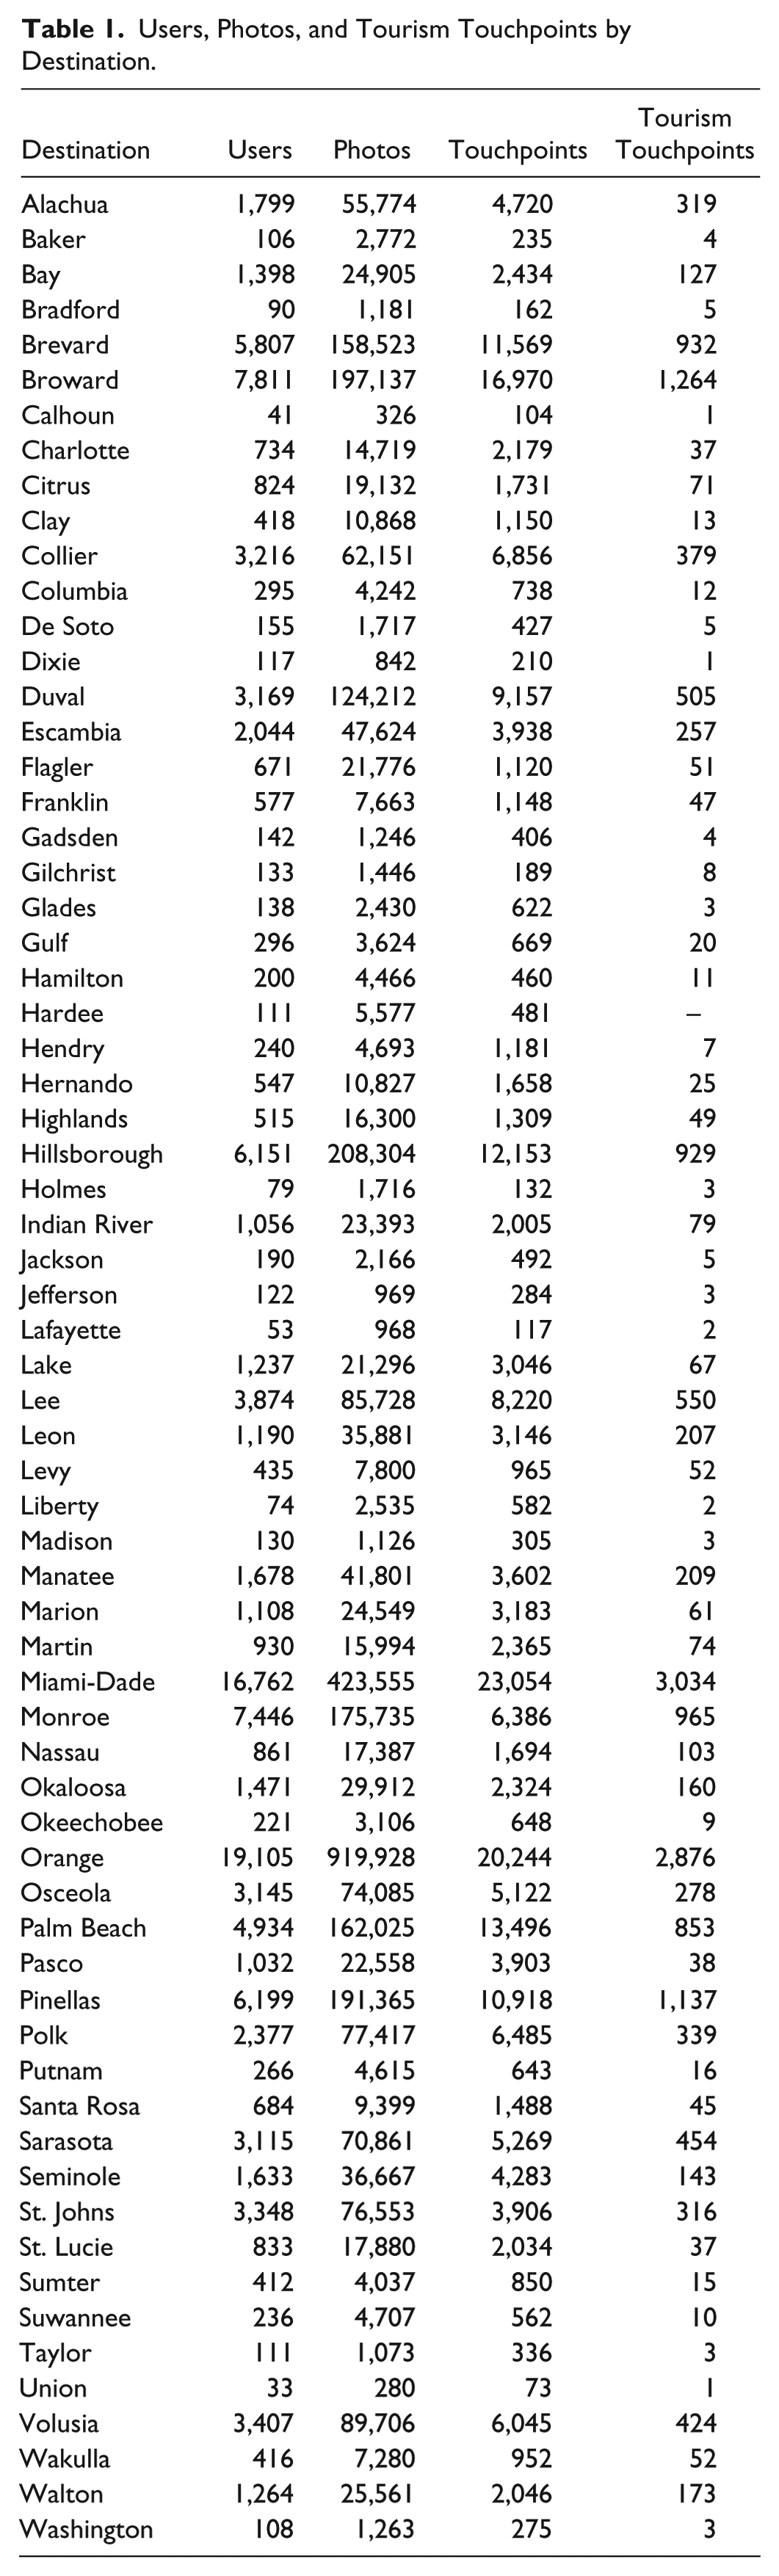
Table 1 shows the total number of users, photos taken, and touchpoints, and visitor-related touchpoints (i.e., attractions visited), and as expected, there is considerable variation in the number of touchpoints observed for each county. The median number of visitor-related touchpoints was 49. Miami-Dade County had the most touchpoints (3,034), while Hardee County did not include any visitor-related touchpoints. And as one might expect, the most popular touchpoint in the data set was located in the heart of Walt Disney’s Magic Kingdom theme park (Orange County) and was photographed by a total of 2,315 unique users.
Users, Photos, and Tourism Touchpoints by Destination.
Based on the above operational definitions, the set of photos taken by each visitor was identified and sequenced for each county and quarterly period according to time taken (as reflected in the metadata of the photo). This generated a list of times and places that a visitor was in the destination, which in turn was used to create an adjacency matrix representing each connection made between touchpoints pairs. Next, all visitor adjacency matrices for each county and quarterly time period were summed, which resulted in a weighted adjacency matrix where each cell value was the weight of the tie (i.e., how many visitors took that trip segment) connecting two touchpoints nodes. Each weighted adjacency matrix was then used as the input for generating quarterly network metrics describing that destination’s macrostructure (i.e., density, in-degree centralization, out-degree centralization, betweenness centralization, and global clustering coefficient). Further, the creation of network metrics was dependent on a sufficiently large sample of VGI data for each destination for each quarter. Consequently, a number of panel observations were omitted and considered missing because the metrics could not be reliably calculated. Also, following Nunnally (1967) those Florida destinations with fewer than 10 quarterly observations were excluded from further statistical analysis. As a result, the final panel used for hypothesis testing consisted of 29 separate destinations spanning 36 quarterly time periods for a total of 765 observations.
Last, the Florida Department of Revenue classifies the sales generated from 12 distinct sectors of the Florida economy as visitor-related: Hotels and Motels, Bars and Restaurants, Liquor Stores, Photo and Art Stores, Gift Shops, Admissions, Sporting Goods, Rentals, and Jewelry Stores (Sayed 2016). Thus, the total quarterly visitor-related sales for each county were calculated by aggregating the monthly taxable sales for each of these 12 sectors as reported by the Florida Department of Revenue (2015). The econometric model used for hypothesis testing is specified below (see equation 6).

where the subindex i is for one of the 29 Florida destinations included in the panel and t is for one of 36 quarterly time periods between the years 2007 and 2015. Variables in the model are specified below:
Ln
Findings
The summary descriptive statistics of model variables are reported in Table 2 where the mean log total visitor-related sales, FLPI, density, in-degree centralization, out-degree centralization, betweenness centralization, and global clustering coefficient were 19.8, 4.6, −5.2, −3.3, −3.3, −4.2, and −1.9, respectively; note that the macro-level network metrics describing destination value networks all take values between 0 and 1, which is why the log transformations for these variables have negative values.
Summary Statistics of Visitor Flow Network Characteristics, n = 765.

Because of the similarities in the inputs on which network metrics are calculated, particularly for in-degree centralization and out-degree centralization (see equations 2 and 3), a number of diagnostics were conducted to ensure collinearity was not an issue and that other basic assumptions of regression were met. In particular, the highest VIF values correspond to LN out-degree centralization, LN in-degree centralization, and density, which are 6.5, 6.2, and 5.1, respectively. These values are all under the recommended threshold VIF value of 10 (e.g., Hair et al. 1998, p. 193) which indicates that collinearity was not a concern.
Model Estimation
A multi-step process was used to determine the most efficient and consistent estimation of the model specified in equation 6. A number of estimation methods were evaluated including pooled ordinary least squares (OLS), fixed effects, random effects, first differences, two-way fixed effects, and feasible generalized least squares (FGLS). First, a pooled OLS estimation was tested, which explained 78% of the variance in total visitor-related spending in the destination, R2 = .78, F(6, 758) = 456.92, p < .001. However, the Hausman specification test (Greene 2000) determined that the fixed effects model was more consistent than a pooled OLS (χ2 = 420.79, df = 6, p < .001) or random effects model (χ2 = 1049.3, df = 6, p < .001), and Breusch-Godfrey tests (Wooldridge 2002, pp. 328–34) revealed that serial correlation was problematic in both fixed effects (χ2 = 194.13, df = 6, p < .001), two-way (χ2 = 131.81, df = 6, p < .001), and first differences (χ2 = 341.78, df = 6, p < .001) estimations. Based on the results of these diagnostic tests, the FGLS estimation method was selected as the most appropriate. The advantage of the FGLS variation of the fixed effects model is that it is robust to serial correlation in the idiosyncratic errors and heteroscedasticity (Hansen 2007; Wooldridge 2002, pp. 276–78). The FGLS estimator involves a two-step process in which an OLS model is first estimated and then its residuals
Feasible Generalized Least Squares Estimation of Destination Visitor Flow Network Structure and Total Visitor-Related Spending.

Significance at .001, *significance at .05.
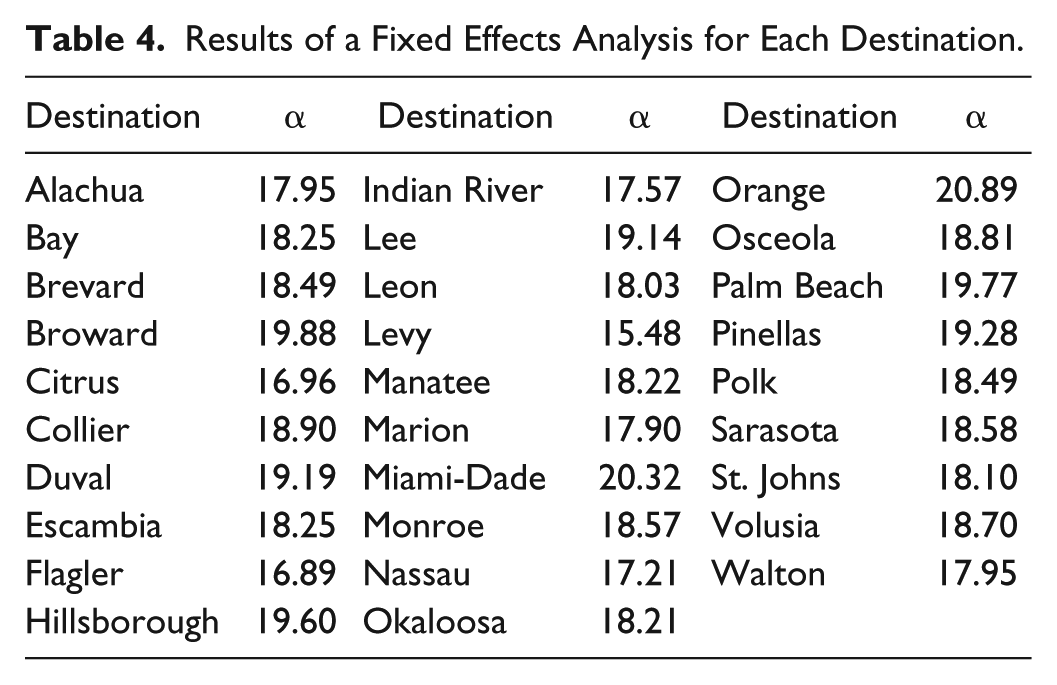
Results of a Fixed Effects Analysis for Each Destination.
The log–log coefficients presented in Table 3 can be interpreted as elasticities, which indicates that a 1% increase in the betweenness centralization of a destination visitor flow network results in a 0.021% increase in total visitor-related sales. Further, the three characteristics of network macrostructure (density, out-degree centralization, and in-degree centralization) are found to have negative effects, while betweenness centralization is found to have a positive effect on total visitor-related sales. In order to test the research hypotheses of this study, the regression coefficients of the final FGLS model were considered. As shown in Table 3, hypothesis 1 is not supported as the estimated coefficient
Discussion
The results of this study provide strong support for the proposed destination value systems (DVS) perspective in that it confirms that the structure of relationships between attractions within a destination affects the economic impact of its visitors and that tourism destinations are not simply “amalgams” of independent touchpoints (i.e., attractions), but instead are dynamic systems where outcomes are dependent on the patterns of interaction between both demand- and supply-side actors, and must be managed accordingly. In particular, this study indicates (unexpectedly) that network density has a negative relationship with visitor-related spending. A potential explanation for this unexpected finding is that it is not the number of connections or ties connecting touchpoints (i.e., attractions) within a destination that are important, but rather the quality (i.e., strength) of the ties. That is, related to the hypotheses of betweenness centrality, the ties connecting the touchpoints are what can influence the ways in which destination resources within a destination are utilized for value creation; importantly Granovetter (1973) found that strong ties as characterized by high-volume flows are persistent and generally dependable. Therefore, in the context of visitor flow networks, a low number of strong ties is a potential explanation for the negative relationship between density and value creation in that a larger number of ties within a destination are unnecessary, thereby leading to lower levels of efficiency. Further, weak ties (low-volume flows) are generally associated with unique exchanges that are often of high value (Jack 2005), but may also be harder to detect as they are activated far less frequently than strong ties. Thus, low DVS density indicates that only a small portion of all potential paths are well traveled within a destination, and that these paths are taken by numerous travelers. This finding suggests, then, that common routes within a destination should be promoted instead of trying to encourage every connection between the respective destination touchpoints.
In practice, visitor flows are often constrained or limited by the transportation infrastructure of a destination, wherein visitors generally take the most direct and lowest cost route. Infrastructure, however, is not the only potential means by which network density could be managed; other strategies for managing DVS network density might include the development of various marketing, distribution, or collaboration processes. For example, specific travel “routes” or attraction packages can be promoted within a destination whereby strategically designed bundles of touchpoints may result in many travelers taking the same designated paths, with less variation, thus creating a low-density network with very strong ties. Further, certain touchpoints within a destination may be encouraged to collaborate with each other in ways such as sharing visitor information or recommending each other’s services to their clientele, which in turn, may lead to the development of strong, frequently traveled ties. Indeed, from an environmental sustainability perspective, a low-density network enables destination managers to focus on supporting and hardening key touchpoints that, in turn, increase the carrying capacity and reduce negative environmental impacts.
The results of the regression analyses also indicate that there is a significant (α = 0.05) negative relationship between DVS network out-degree centralization and destination value creation. A possible explanation for this small, but statistically significant, negative effect may be that the number of paths leading out of hubs is indicative of a highly competitive destination, which includes a number of touchpoints and lower prices that, in turn, limits the overall travel-related sales within a destination. This analysis also shows that DVS network in-degree centralization has a negative relationship with destination value creation, and supports the informal (and long held) conclusion that highly central hubs play an essential role in distributing travelers throughout the DVS network. As such, it is argued that these ‘special’ touchpoints should take priority as they directly influence overall value creation and, therefore, the competitiveness of the destination. Interestingly, these findings suggest that a “star”-shaped network of visitor movement (both in and out of touchpoints) may be undesirable from a destination management perspective. That is, the results indicate that when there are several key touchpoints that dominate as “hubs” within the destination, value creation is significantly lower because of decreased competitiveness among touchpoints. Further, the findings suggest that it may be more desirable to encourage “circle” networks that distribute economic value through a wider variety of secondary touchpoints for the purposes of community economic development. Thus, it is concluded that the less reliant a destination is on only one or two main attractions the better and, therefore, destination management policies should be developed that encourage visits to multiple touchpoints, so as to foster collaboration and competition among touchpoints, and to avoid scenarios where highly centralized touchpoints dominate destination resources.
Finally, the nonsignificant relationship between network global clustering coefficient and destination value creation and the significant positive relationship between network betweenness centralization and destination value creation indicate that the simple presence of diverse clusters or themes of touchpoints alone does not impact visitor-related spending; rather, only when the diverse subcommunities are linked via boundary spanners are positive economic impacts observed. This finding is consistent with previous studies that show boundary spanners are crucial for the distribution of social capital and for information exchange within networks (Burt 2004). These findings are important for destination managers, suggesting that they need to be “active” in ensuring that subcommunities within the destination do not become too isolated or disconnected. As such, destination managers (taking the perspective as an orchestrator) should focus on working to strengthen ties within subcommunities and between subcommunities where it is argued that the more “cross pollination” of ideas and practices, the more likely that traveler needs will be met, thereby increasing destination competitiveness (Wang and Xiang 2007).
There are several limitations of this study that must be acknowledged. A challenge with network research is always defining which nodes should be included in the network and which should be excluded (Borgatti et al. 2009), and this study used administrative boundaries of counties to define destinations. Future research should move beyond these artificial confines and base DVS networks predominately on traveler behavior so that important network connections are not excluded from a destination value system model. An additional limitation of this study is related to the VGI data from Flickr used for panel creation. It is important to acknowledge that not all visitors take photos at every value-creating touchpoint and that photos uploaded by Flickr users are not a perfect measure of value creation (i.e., photos are not always taken in the locations that spending occurs). Based on the quality assessment, it is apparent that secondary network structures are not measurable without a sufficiently large number of observations. As a result, smaller destinations were excluded from analysis; thus, the characteristics and relationships between DVS network structures and value creation for less visited destinations are not documented. Further, while the effects of certain network structures are now better understood, much research is needed to move beyond a basic structuralist perspective of destination networks to one that, following Song, Liu, and Chen (2013), sees the destination manager as a “network orchestrator” of a dynamic system. Further, while this study has focused on economic value creation (i.e., visitor expenditures), it is essential to understand the differential effects of DVS network structures on other aspects of the visit, including visitor satisfaction, first-time versus repeat visitors, and trip length. Finally, as the digital visitor economy continues to grow in importance, both virtual and physical touchpoints must be integrated into network models of value creation in order to manage a range of value creation processes and their simultaneous interaction effects within the entire destination system.
Footnotes
Declaration of Conflicting Interests
The author(s) declared no potential conflicts of interest with respect to the research, authorship, and/or publication of this article.
Funding
The author(s) received no financial support for the research, authorship, and/or publication of this article.