
Abstract
The objective of this article is to analyze travel expenses across and within types. The empirical application examines the determinant factors of total expenses, controlling for potential endogeneity, and relies on quantile regression to analyze the effects of information search behavior on the distribution of total expenses as well as accommodation, shopping, food and beverages, and local transportation expenses. The role of information sources in predicting travel spending behaviors is a new dimension in the literature on expenses, and a sample of 48,113 travelers has led to the detection of effects of variables with relevant managerial implications (e.g., while official information centers show positive impacts at the upper levels of accommodation expenses, they present null effects at the highest levels of shopping expenses) as well as theoretical implications (special attention should be drawn to the variable length of stay, which, after being controlled by endogeneity, completely loses its significance).
Introduction
Tourist expenditure provides a substantial contribution to economic growth at the national and regional levels (Marrocu, Paci, and Zara 2015). For example, the World Travel and Tourism Council (WTTC 2015) reported that the direct contribution of travel and tourism to the gross domestic product (GDP) in South Korea was 2.0% in 2014 and is expected to rise by 2.9% per annum between 2015 and 2025. In terms of total contribution—direct and indirect—income generated from travel and tourism is estimated to be 5.8% of the GDP in 2014 and is forecast to reach 6.0% in 2025 (WTTC 2015).
The study of tourist expenditure is crucial because “tourism is an expenditure-driven economic activity” and “the consumption of tourism is at the center of the economic measurement of tourism and the foundation of its economic impacts” (Mihalic 2002, p. 88), which helps to clarify the gross added value that destinations generate (Eugenio-Martin and Campos-Soria 2014; Eugenio-Martin and Inchausti-Sintes 2016). In particular, identifying the factors that affect tourist consumption behaviors and estimating the effect of these factors on tourist expenditure patterns are of the utmost importance. From the destination marketing perspective, this knowledge could help to discern “profitable tourists,” who stay relatively longer and spend more during their trips, and to develop effective marketing strategies and policies contingent on viable market segmentations (Nicolau and Mas 2005; Lin, Mao, and Song 2015).
While macroeconomic approaches provide global understanding of tourist expenditure patterns (Jang and Ham 2009; Wu, Zhang, and Fujiwara 2013; Lin, Mao, and Song 2015; Serra, Correia, and Rodrigues 2015; Konstantakis, Soklis, and Michaelides 2017), these aggregated expense analyses do not fully consider product-specific issues (Laesser and Crouch 2006). Moreover, the aggregation of macrodata averages out individual idiosyncrasies, and thus provides less valuable information to tourism marketers (Y. Wang and Davidson 2010a). Today, analyzing microdata by examining individual consumption is clearly needed, which allows consideration of the diversity and heterogeneity of travel behaviors and preferences (Lin, Mao, and Song 2015). Furthermore, with regard to the nature of tourism, it is vital to consider many facets of travel decisions because travel is not a single product but a number of interrelated subproducts (Fesenmaier and Jeng 2000).
Indeed, travelers are required not only to make a destination decision but also to arrange numerous subset decisions, such as accommodation, restaurants, and transportation (Park, Nicolau, and Fesenmaier 2013). It becomes evident that, on account of the different nature of these subdecisions, a particular determinant factor is not expected to show the same effect on all of them (across expense-category analyses). Moreover, that determinant factor may have varying impacts on a specific expenditure type, depending on its level (within expense-category analysis). Consequently, the effect of prices can be different between accommodation and restaurants, but it can vary within accommodation as well, depending on whether the level of expenditures in accommodation is high or low. Accordingly, this article uses four sets of determinant factors (demographics, tripographics, prices, and information sources) with the objective to explain, first, their effects on the total amount of tourist expenditure, and second, the varying effects of these information sources on expenses for accommodation, shopping, food and beverages (F&B), and local transportation (Park, Nicolau, and Fesenmaier 2013). The use of information search behavior fills a gap in the literature on expenses.
Determinant Factors of Tourism Expenses
The effects of the determinant factors on purchasing behaviors can vary across and within many facets of a trip because travel decisions have distinct levels of complexity (Nysveen 2003) and flexibility (or centrality) (Fesenmaier and Jeng 2000) that are contingent on the products or services involved, shaping the traveler’s engagement and/or commitment to planning the decisions (Park and Fesenmaier 2014). Consequently, the dimensions that lead consumers to purchase specific travel products vary according to the product type (accommodation, restaurant, etc.). Expense is a dimension in which this variability can be notably evidenced as it is a manner whereby tourists show their consumption patterns quantitatively.
Across Expense-Type Analysis
Considering the different nature of the aforementioned subdecisions, the ease or complexity on which people base their expenditure decisions—for example, accommodation and theater tickets—changes substantially as not only does the amount of money required vary but so does the duration of the service (two hours of dissatisfaction in the theater can be less painful and easier to recover from than two days of dissatisfaction during a stay in a hotel). Therefore, the factors that have a significant impact on the level of expenses may vary from one decision to another as well as the size, if any, of such impact.
Within Expense-Type Analysis
The determinant factors may also have varying effects on a specific expense type, depending on whether its cost is high or low. In other words, the determinant factors may have a nonconstant effect on the distribution of a specific expense type, in such a way that a factor may have a null effect at one region of the distribution (e.g., the lowest level of expenses) and a positive (or negative) effect in another part (e.g., the highest level of expenses). To analyze these varying effects, we focus on the variable “information search behavior,” whose role in predicting travel spending behaviors is a new dimension used in the analysis of the determinants of expenditure.
Determinant Factors
To carry out analyses across and within expense-types, according to the literature, four sets of determinant factors are investigated—demographics, tripographics, prices, and information search behavior (Y. Wang et al. 2006; Brida and Scuderi 2013). It is important to note that the relevant literature offers inconsistent empirical evidence for the influence of sociodemographic and trip-related characteristics on tourist expenditure (Y. Wang and Davidson 2010a). The consideration of information-search behavior has been largely limited in understanding expenditure patterns, although it has been recognized as a crucial aspect of travel decision-making behaviors (Choi et al. 2012). The following paragraphs discuss these four categories of determinants: sociodemographics (age and income), tripographics (type of travel arrangement, length of stay, visit to additional destinations, purpose of trip, travel companions, and type of accommodation), prices, and information search behavior (types of information sources).
Regarding sociodemographic characteristics, age is regarded as a vital demographic dimension in explaining travel behaviors and expenditure (Pearce 1982). The findings of previous studies examining the relationship between age and travel expenditure do not seem to be consistent. On the one hand, age has a significant influence on travel expenditure. Either old travelers are more likely to overspend than relatively young travelers (Thrane 2002; Jang et al. 2004) or tourist expenditure declines with age (Dardis et al. 1981; Mok and Iverson 2000). Jang and Ham (2009) attribute the different behavioral patterns of travel expenditure to the social and political environments people experienced between temporal generations. Another group of studies indicates that the age variable does not affect the trip budget (Chhabra, Sills, and Rea 2002; Wu, Zhang, and Fujiwara 2013). Walsh et al. (1992) demonstrate a nonlinear relationship where middle-aged travelers are more likely to spend more on their travel expenditure than young and old travelers (i.e., a concave relationship).
Level of Income
The literature regards income as a personal budget restriction that conditions people’s purchasing capacity (Marrocu, Paci, and Zara 2015) such that higher income levels bring about higher consumption levels. Information on income is not always available—as is the case for this article—so two standard proxies are used in the literature (Fleischer and Felsenstein 2004; Marcussen 2011): occupation and education. Regarding occupation, it might reflect social class (Y. Wang et al. 2006), so it would be expected that travel expenditure would increase with the level of occupational prestige (Hong, Morrison, and Cai 1996). In other words, white-collar professionals are likely to spend more on trips than other types of occupations in general (see Jang et al. 2004). The literature also finds a positive relationship between education and expenses (Parker 1976; Nicolau and Mas 2005).
Concerning tripographics, the following variables are considered to have an effect on travel expenditure (Abbruzzo, Brida, and Scuderi 2014):
Types of Travel Arrangement
Thanks to the development of information technology, travelers have many different channels to book travel products. The advancement of online travel agencies (e.g., Expedia and Booking.com), in particular, enables individuals to organize the journey themselves. Alternatively, tour operators offer dynamic travel packages so that travelers facilitate managing diverse facets of the entire trip (Money and Crotts 2003). These various types of booking methods lead to different levels of travel expenditure (Brida and Scuderi 2013). Accordingly, travelers who organize their entire trip with tour operators tend to spend more than those who do not make any reservations in advance and reserve partial elements of the trip (e.g., transportation and accommodation) (Perez and Juaneda 2000).
Length of Stay
Duration of stay is regarded as one of the crucial elements determining travel expenditure. The longer travelers stay at the destination, the greater amount of the total budget is spent (Mok and Iverson 2000; Jang et al. 2004; L. Wang et al. 2017). One reason is that people who stay longer at hotels are more likely to order food and beverages and obtain transportation services and entertainment activities (Downward and Lumsdon 2004; Driml, Ballantyne, and Packer 2017; Vu et al. 2017). In contrast, Thrane and Farstad (2011) indicate that in domestic travel, the positive magnitude declines as the length of stay increases. Some studies also identify a nonlinear relationship between length of stay and travel spending. Roehl and Fesenmaier (1996), for instance, demonstrate a diminishing positive effect of length of stay on expenditures, which, at a certain duration point, becomes negative.
Number of Destinations
Many vacations include multiple destinations or touring in nature (C. C. Lue, Crompton, and Fesenmaier 1993). Given that current travelers have greater mobility, they often visit more than one destination. The relevant studies found that travelers who visit multiple destinations tend to be higher spenders than those going to a single destination (Y. Wang and Davidson 2010b). It is recognized that travelers can achieve variety in their travel experiences by visiting multiple destinations, enhancing individual levels of arousal (C. C. Lue, Crompton, and Fesenmaier 1993). Thus, the patterns of travel behavior and spending would be different between travelers with a single destination and those with multiple destinations.
Purpose of Trip
Laesser and Crouch (2006) propose a segmentation method using travel expenditure patterns and identify heterogeneity in travel purposes across the segmented groups. Travel purpose inherently represents travelers’ needs and motivations when visiting a destination. As a result, the different purposes shape different amounts of expenditure to achieve the desired levels of satisfaction (Serra, Correia, and Rodrigues 2015). Laesser and Crouch’s study (2006) finds that travelers whose main purpose is attending a conference at the destination appear to have relatively higher expenditure. In contrast, travelers visiting friends and relatives (VFR) spend less compared to general leisure travelers. Other tourism studies demonstrate consistent results, which show that business travelers tend to spend almost twice as much as VFR travelers (Jang, Yu, and Pearson 2003). When focusing on specific shopping expenditure, however, the opposite pattern is identified. Leisure travelers have the highest shopping expenditure, followed by VFR and business travelers (Lehto et al. 2004).
Travel Companions
Since travel is often a highly social event, travel companions play an important role in determining not only travel behaviors but also expenditure (Gitelson and Kerstetter 1995; Park and Fesenmaier 2014). Several approaches can be used to assess the composition of travel groups, such as party size, presence of companion, number of adults and children (Y. Wang and Davidson 2010a), and the specific composition of a travel party (Serra, Correia, and Rodrigues 2015). The literature appears to show heterogeneous results according to the different measurements used and specific travel context investigated (inbound vs. outbound travelers). For example, Y. Wang et al. (2006) show the positive effect of number of adults on travel expenditure, while Jang et al. (2004) demonstrate the unimportance of travel party size (Wu, Zhang, and Fujiwara 2013). A negative sign of travel party size is associated with the travel budget per person (Mok and Iverson 2000). Serra, Correia, and Rodrigues (2015) examine the arrangement of travel groups and conclude that family travelers spend more on travel expenditures than other types, including people who travel alone or with friends.
Types of Accommodation
The analysis of accommodation types is important at certain destinations, such as South Korea, that involve diverse forms of accommodation. Previous literature consistently shows that travel expenditure varies depending on the type of accommodation. Agarwal and Yochum (1999) indicate that hotel accommodation is associated with higher expenditure compared to other accommodations, such as cottages, camping sites, and condos or apartments. This proposition is consistent with the results of other travel studies (e.g., Nicolau and Mas 2005; Laesser and Crouch 2006; Marrocu, Paci, and Zara 2015), implying that relatively higher room rates in hotels are linked with higher travel expenditure.
Prices
The generalized finding in the literature on prices shows that the demand for tourism products behaves as an ordinary good, so that price increases reduce consumption (Smith 1995). As Marrocu, Paci, and Zara (2015) indicate, observing specific prices for tourism products is not always feasible. However, considering the international character of this research, it seems to be appropriate to follow Eymann and Ronning’s (1992) proposal, which puts forth that the adequate procedure to show the prices of a tourist market is to observe destination prices vis-à-vis the home market’s prices. Accordingly, these authors employ purchase parity differentials between the origin and respective destinations, measured by the corresponding consumer price indexes.
Information Search
Finally, the information search–related factor is expressed as an information source. The information sources used by travelers represent information search strategy, inherently characterizing the information environment (Fodness and Murray 1998). Evidence has been found for systematic relationships between information search strategies and individual and situational characteristics of the travelers (David-Negre et al. 2018; Iinuma et al. 2018; Park, Wang, and Fesenmaier 2011; Van der Zee and Bertocchi 2018). More pertinently, several researchers explore the link between information search behaviors and travel outcomes, including trip expenditure (Kambele, Li, and Zhou 2015). Murphy and Olaru (2009) classify travelers according to their information foraging strategies: (1) sharks, who are active and have high information needs and (2) spiders, who are passive and mostly rely on personal experience. Based upon information foraging theory (Pirolli and Card 1999), the difference is equivalent to a well-recognized distinction in behavioral ecology between widely foraging predators, such as sharks, and sit-and-wait foragers, such as spiders. The former voraciously seeks a wide range of information sources and contents, while the latter wanders in a few convenient sources.
As expected, the study by Murphy and Olaru (2009) shows that travelers categorized as sharks are likely to use more varied and up-to-date sources of information than those categorized as spiders. In terms of travel behaviors, the shark group tends to have larger travel budgets than the spider group. Consistently, different levels of entertainment expenditure are recognized according to different clusters that use different information search strategies. Travelers who visit the local tourist office or check travel guides tend to spend more than other groups (Fodness and Murray 1999).
Apart from examining the search strategy, some studies investigate the associations of specific information sources used to reach travel outcomes. The results show that travelers who use the Internet to obtain information are likely to incur higher spending than those who utilize other sources (e.g., destination sources, travel agents, and recommendations from friends/relatives) (Luo, Feng, and Cai 2005). Also, travel expenditure increases when TV is used as a main information source as opposed to not considering information from TV (Taylor, Fletcher, and Clabaugh 1993).
Methodology
Data Analysis
To carry out the analysis of the determinants of total expenses, we apply different estimation procedures: ordinary least squares (OLS), two-stage least squares (2SLS), the Heckit model, and quantile regression (QR). We start by getting the most basic estimates via OLS. In particular, the following standard linear relation is formulated:
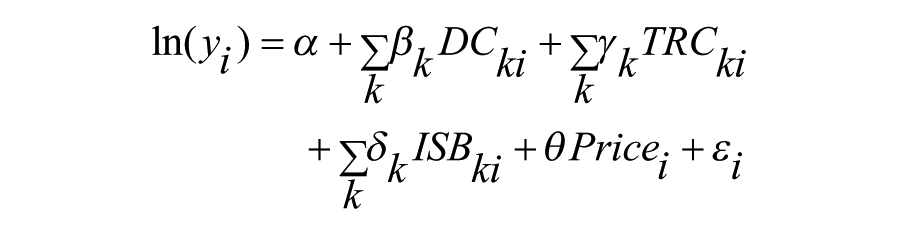
where yi is the expenses per person (we apply the log-transformation so that the resulting parameters are directly interpreted as semi-elasticities), α is a constant term, β k is the coefficient of the k-th independent variable related to demographic characteristics DCki, γk is the coefficient of the k-th independent variable associated with trip-related characteristics TRCki, δk is the coefficient of the k-th independent variable related to information search behavior ISBki, θ is the coefficient of the price-related variable Pricei, and ε is an error that follows a normal distribution.
On estimating this model, however, a potential endogeneity issue might arise, as the causality of the decisions “how much to spend,” “how long to stay,” and “where to stay” is not straightforward. To handle this potential endogeneity, we resort to the two-stage least squares (2SLS) regression to explicitly deal with the variable “length of stay” and the Heckit model to control for the potential effect of “accommodation type” on other variables. The 2SLS estimation requires the use of instrumental variables. In line with Thrane (2015), the variable length of stay can be instrumented via “number of previous visits to the destination” and “level of satisfaction.”
As for the Heckit model, we split the consumer choice process into the “expense decision” and the “accommodation decision,” so that the model takes the following form:
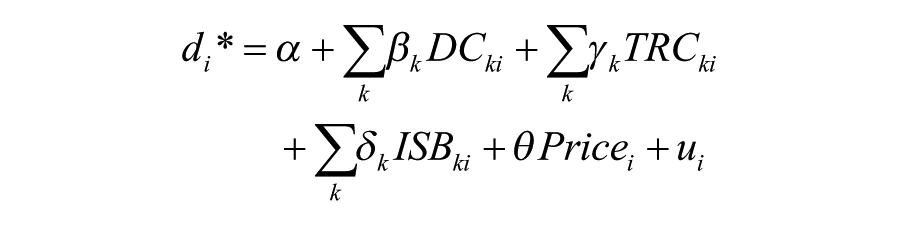

where the disturbances ui and εi follow a bivariate normal distribution with a zero mean, variances σu and σε respectively, and covariance σεu. di is a dichotomic variable, which takes a value of one when the latent variable di*>0, and a value of zero when di*<0. In this way, di=1 indicates the decision to stay in a hotel and di=0 in any other type of accommodation. We use maximum likelihood to estimate the model.
Finally, we use quantile regression to enrich the results and find out whether the effect of the determinant factors is constant over the range of the dependent variable (expenses), or varies depending on the level of expenses. In particular, we will focus on information search behavior, which represents one of this article’s main contributions to the literature. In this way, we test the potential differentiated effects of each characteristic over the distribution of the variable “overall expenses,” along with “accommodation,” “shopping,” “food and beverages,” and “local transportation.”
The advantage of QR over OLS is that the former attempts to model the conditional mean of the dependent variable, while the latter tries to model the conditional τth quantile of the dependent variable, being τ ∈ (0, 1). It is standard in the literature that the 10th, 25th, 50th, 75th, and 90th quantiles are estimated, as it encompasses the whole distribution of the variable (Marrocu, Paci, and Zara 2015). Thus, QR permits the detection of potential varying impacts of “information sources” (that capture the information search behavior) on the whole range of the variable “expenses.”
Data Collection
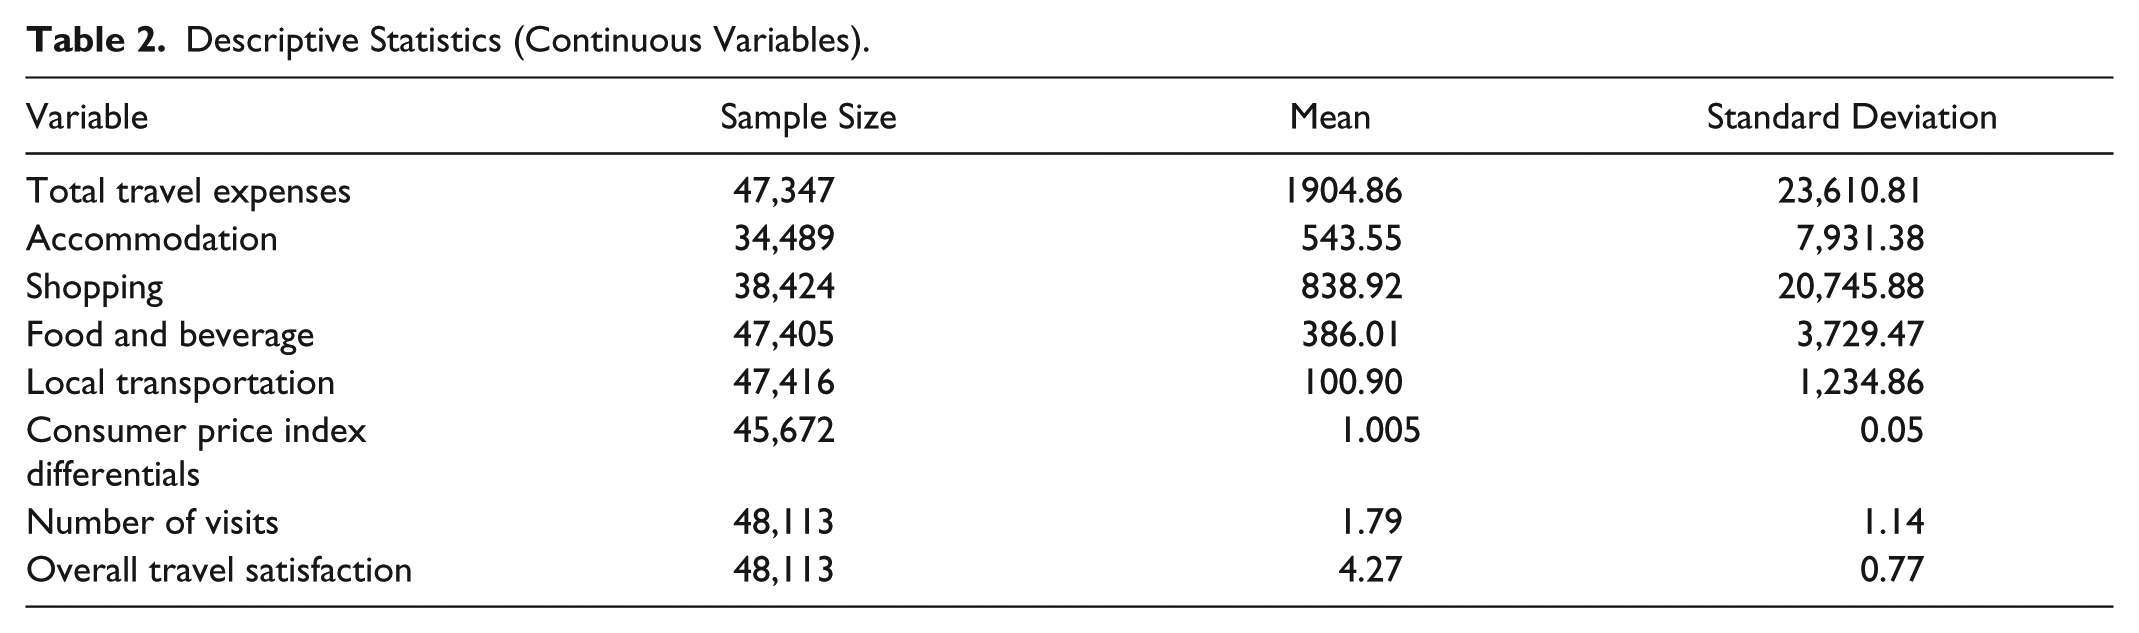
A series of surveys was used to collect data representing the behaviors of international travelers who visited South Korea from 2011 to 2014. The subjects were more than 18 years old and stayed in South Korea for more than a day and less than a year. Four international airports, including Incheon, Gimpo, Gimhae, and Jeju Island, as well as two international harbors (Incheon and Busan), were selected to contact the respondents at the end of their trips. This study used a stratified sampling method according to origin destinations. Specifically, after identifying international visitors across countries in previous years, the target number of samples for each country could be calculated at a confidence level of 95%. Furthermore, to control for the seasonality effect, the data collection was made over all 12 months consistently, with about 1,000 respondents across four years. As a result, the total number of respondents used in this data analysis was 48,113, consisting of 12,038 in 2011; 12,021 in 2012; 12,030 in 2013; and 12,024 in 2014. Tables 1 and 2 show the descriptive statistics of the sample for the categorical and continuous variables, respectively.
Descriptive Statistics (Categorical Variables).

Descriptive Statistics (Continuous Variables).
Measurements
There were two sections in this visitor survey. The first part asked the international travelers about their behaviors while visiting South Korea: types of travel arrangement (independent or package tour), length of stay, number of destinations (just visiting South Korea or visiting other destinations), purpose of trip (participants were asked to choose up to three of the following purposes: leisure, recreation, and holiday; health, medical treatment; religion or pilgrimage; shopping; VFR; business or professional activities; and education), information sources (participants could choose the three sources they relied on the most: travel agencies, relatives and friends, the Internet, traveler’s guides, media, tourist offices, airlines, or hotels), travel companion (alone, family and relatives, friends, coworkers, and others), types of accommodation (hotel, guesthouse, condominium, family/relatives, school/dormitory, temple, and other) (Yoon and Shafer 1997; Park, Nicolau, and Fesenmaier 2013), and travel expenditures (accommodation, shopping, food and beverages, local transportation, entertainment, expenses in travel agencies in Korea, cultural activities, and sports activities) (Y. Wang et al. 2006; Abbruzzo, Brida, and Scuderi 2014). The last part includes demographic questions, such as age, educational level, and occupation. As for prices, in keeping with Eymann and Ronning (1992), we use consumer price index differentials among home markets and destinations, published by the World Bank, which show the cost of living in each place of origin and destination.
Results
Profiles of Respondents
More than half of respondents are 40 years or younger and have obtained college/university degrees. The distribution of occupation and nationality shows that the sample covers all the categories with no particular bias toward a specific category. Regarding travel characteristics, 73% of travelers made individual trips and 88% of them visited only Korea. In terms of information sources, as expected, Internet has been recognized as the most frequently used source (see Table 1).
Table 2 shows the sample size and mean/standard deviation of the continuous variables use: total travel expenses as well as four different travel facets along with consumer price index differentials, number of visits, and overall travel satisfaction.
Model Estimation
Before estimating the models, the potential existence of collinearity is tested. Two variance inflation factors (VIF) are larger than the recommended value of 10 (Neter et al. 1989; Hair et al. 1995): “health, medical treatment” and “religion or pilgrimage.” As both items represent a very small proportion of the sample (1% and 0.8%, respectively), we have integrated them into the reference alternative. After confirming that all VIFs are still below 10, we proceed with the estimation of the models.
Table 3 shows the results of the four models estimated: OLS, 2SLS, Heckit, 1 and QR. According to the procedure outlined in the methodology section, in order to guarantee that the parameters are not affected by endogeneity, we rely on those parameters that are significant in all models and have the same sign.
Determinant Factors of Total Expenses per Person (OLS, 2SLS, Heckit, and QR).

Notes: OLS = ordinary least squares; 2SLS = two-stage least squares; QR = quantile regression.
a = p < 1%; b = p < 5%.
Regarding occupation, “self-employed” and “student” have a positive effect (the largest) and a negative effect (the smallest), respectively, compared to the alternative reference (“other”). Concerning education, “college” and “graduate school” have a significant and positive impact in comparison with “other.” As proxies for income, both variables show that income has, as expected, a positive impact on expenditures.
As for countries, China, Singapore, Taiwan, Malaysia, and Saudi Arabia present positive and significant parameters, while Japan shows a negative and significant parameter compared to the alternative “other.”
Regarding length of stay, it is important to comment on this variable as it has been instrumented to control for endogeneity. Interestingly, while in all other models it is significant, when the 2SLS estimation is applied, its size is reduced and its significance disappears. This reduction in size is in line with the results obtained by Thrane (2015), as the other models do not control for endogeneity, and consequently, attribute the whole effect of length of stay on expenses to this variable.
“Visiting only Korea”—compared to visiting multiple destinations—leads to greater total expenses as the parameter is positive and significant. This result is contrary to the existing empirical results (Y. Wang and Davidson 2010b); it seems that for the same number of days, tourists tend to spend more if they only visit Korea. Considering the distinction between vacationers (who remain in one destination during their vacation in order to “experience” in detail the characteristics of the place) and sightseers (who visit various destinations in order to see, on a superficial level, their main sights), it seems that the former try to make the most of the destination, which leads to higher expenses.
Regarding purposes of trip, the top spenders in total expenses are those whose purposes are “leisure, recreation, and holiday” and “shopping” compared to the reference “other,” and those who “visit friends and relatives” and do “business or professional activities” spend less than “others,” in line with the results of Jang, Yu, and Pearson (2003). Concerning travel companions, when traveling with family and relatives and with friends, people tend to spend more; conversely, traveling alone or with a coworker leads to lower total expenses. This outcome is in line with Y. Wang et al. (2006) and Serra, Correia, and Rodrigues (2015).
In total expenses, active information search is generally associated with greater spending; that is, “sharks” spend more than “spiders,” in line with the terminology and results found by Murphy and Olaru (2009). In other words, travelers who use up-to-date information sources incurred more travel expenditure than those who sought other sources.
The consumer price index differential is significant and positive, so when the country of origin has higher prices, people tend to spend more in Korea, which is in accordance with the prevailing negative relationship between price and demand (Smith 1995).
Table 4 shows the effects of information sources on total expenses per person and Table 5 on accommodation, shopping, F&B, and local transportation, which are QR parameters estimated at the 10th, 25th, 50th, 75th, and 90th quantiles. These tables show the significance of each quantile parameter for the information sources.
Effect of Information Sources on Total Expenses per Person (QR).
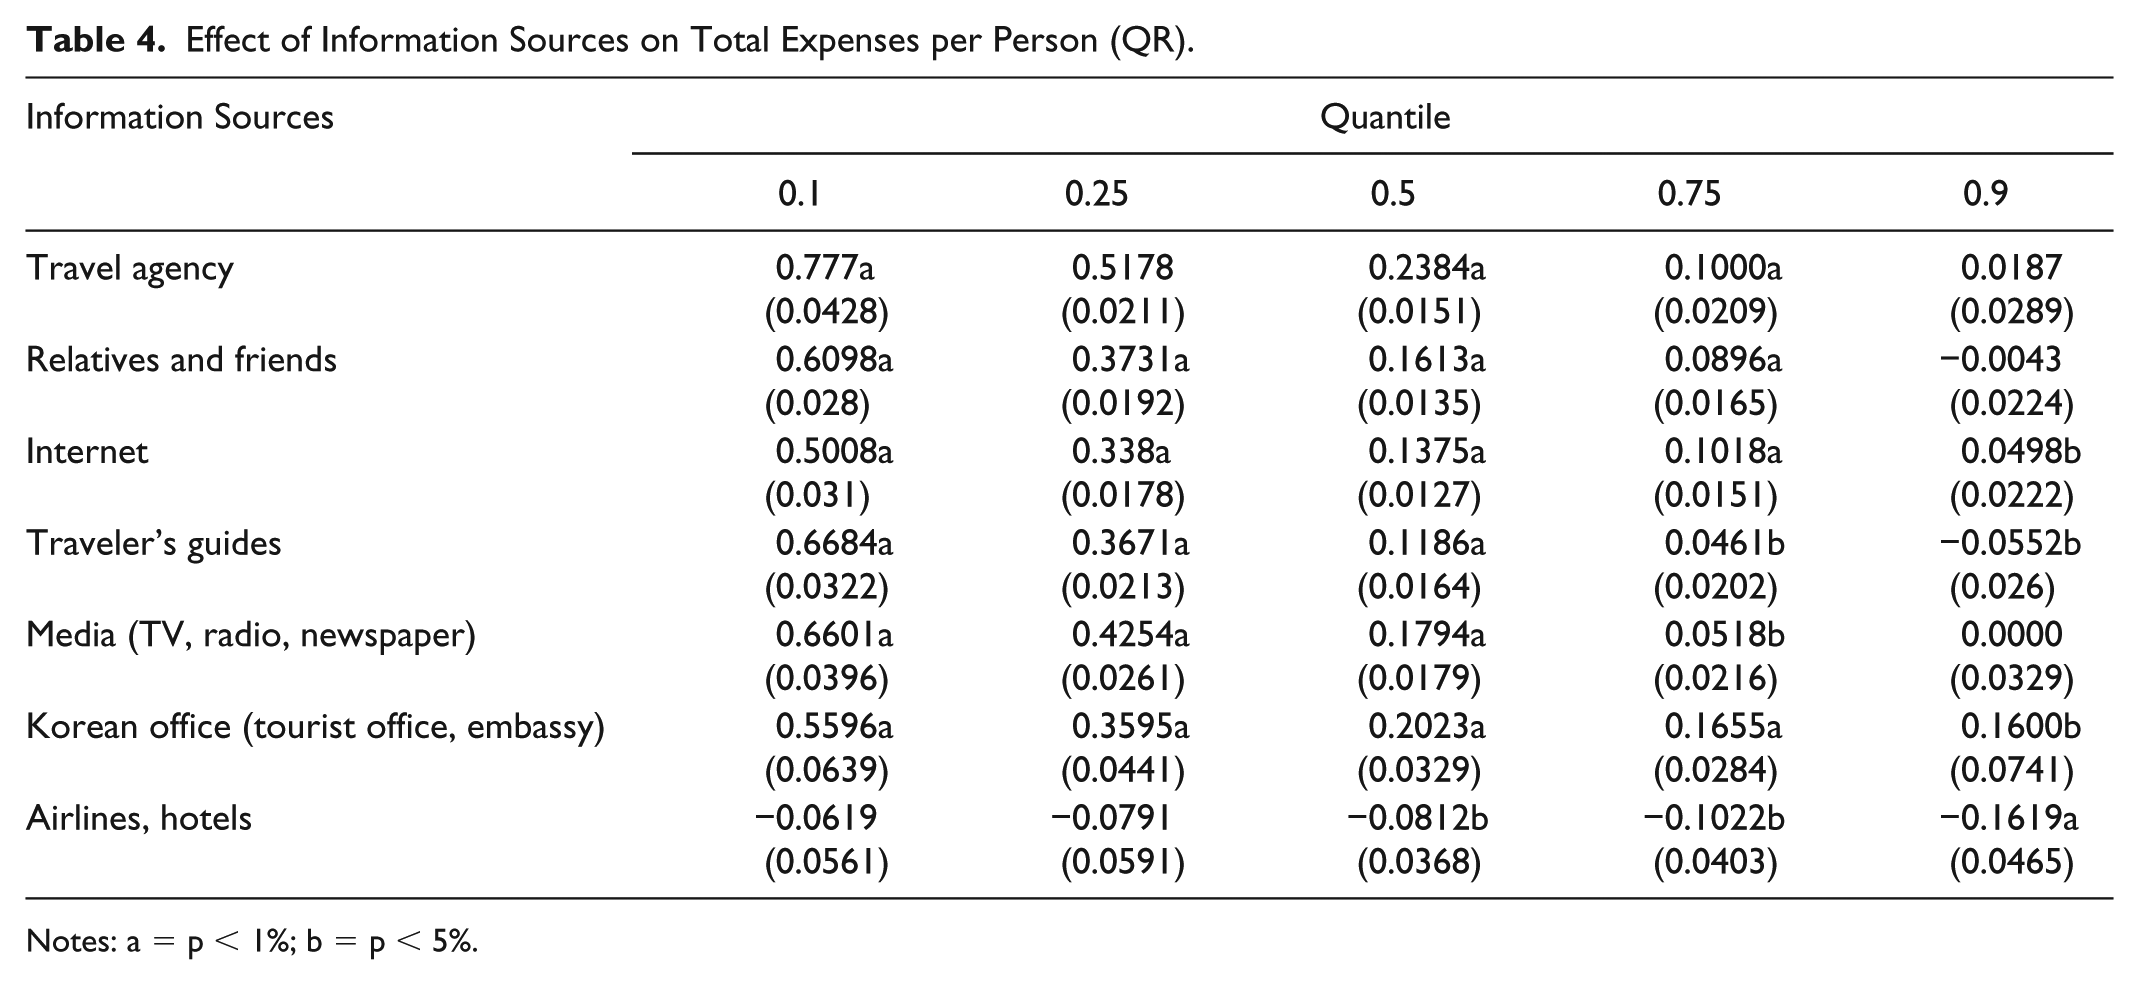
Notes: a = p < 1%; b = p < 5%.
Effect of Information Sources on Accommodation, Shopping, F&B, and Local Transportation Expenses per Person (QR).

Note: F&B, food and beverage.
Regarding total expenses, it is observed, with no exception, that the effect of any information source at the low level of expenses is higher than the reference variable “other,” and at high levels of expense it is lower than this reference variable. This decrease in the size of the effect might become null for the top level of expenses, as in “media,” or even negative, as in “relatives and friends” and “traveler’s guides.” Note that “airlines and hotels” as information sources have no effect on the lower levels of expenses and an increasing negative effect on higher levels of expenses.
Concerning expenses for accommodation, different patterns are found depending on the level of expenses. While travel agencies, relatives and friends, and traveler’s guides have positive effects at the middle levels of expenses, their effects become negative at the upper levels (75th and 90th quantiles). In fact, only the Korean office (or information center) and hotels show positive and significant parameters at these upper levels. As for expenses on shopping, a general decreasing effect is found as the level of expenses rises. It is interesting to see that traveler’s guides and the Korean office have negative and null effects, respectively, at the top level of expenses. For F&B, the sources associated with higher expenses seem to be relatives and friends, with positive parameters for the 50th, 75th, and 90th quantiles. It is relevant to note that the Internet, traveler’s guides, media, and the Korean office have positive effects at the middle levels of expenses but null or negative impacts at the top level. Regarding expenses for local transportation, all sources except for travel agencies have positive effects at the upper levels of expenses. Airlines and hotels have no significant effects.
Discussion and Conclusions
Given that recognizing the importance of tourism to local economies and understanding expenditure behaviors of international travelers are crucial for tourism business and destination marketing organizations (Lin, Mao, and Song 2015), this study analyzes expenditure patterns of a sample of 48,113 international travelers who visited South Korea between 2011 and 2014. To increase the generalizability of the findings, a stratified sampling method based on original destinations and a controlled seasonality effect with consistent numbers of survey responses across 12 months are applied.
According to the methodology used that attempts to consider potential endogeneity, the determinant factors that have a positive effect on expenditures are occupation (self-employed); education (college and graduate schools); originating from China, Singapore, Taiwan, Malaysia, or Saudi Arabia; visiting Korea only, trip purposes (“leisure, recreation, and holiday” and “shopping”), traveling with family and relatives and with friends, information sources, and consumer price index differential.
Regarding the quantile regression estimates, the fact that a diversity of effects is found for a particular variable depending on the level of expenses implies that the use of quantile regression is relevant to detecting potential intricacies in the determinants of expenses. This article has focused on information search behavior, whose role in predicting travel spending behaviors analyzed in the application represents new possibilities for analyzing the determinants of expenditure. The analysis has found that, for total expenses, a decreasing effect occurs over the distribution of the variable expenses, with higher effects at the low levels of expense and lower impact at the high levels. For the specific expenses analyzed, some interesting results are found: for example, while the Korean office shows positive and significant parameters at the upper levels of accommodation expenses, it presents null effects at the top levels of shopping expenses. Even more intricate are the cases of traveler’s guides and media that show positive, negative, or null effects at the top level of expenses depending on the specific type of expenses. In particular, traveler’s guides have null effects on accommodation, negative effects on shopping and F&B, and positive effects on local transportation. Media has a null impact on accommodation, a positive impact on shopping and local transportation, and a negative impact on F&B.
As for theoretical implications, special attention should be drawn to the variable length of stay which, after controlling for endogeneity, loses its significance. While some previous literature has tackled this issue, this empirical result reinforces the idea that controlling for endogeneity is not a minor issue. It is not a mere reduction in the size of the effect but a complete cancellation of the effect.
As for managerial implications, several issues can be considered: (1) For destination marketing organizations, policies that favor a general pattern of expenditures can be misleading if they do not consider that the same variable can have different effects on tourist expenses, depending on the product or service purchased. This is illustrated by the aforementioned cases of the Korean office, traveler’s guides and media. (2) Similarly, for DMOs and decision makers in tourism firms, a specific variable not having the same effect over the range of the variable expenditures opens up new courses of action for segmentation, as heavy and light spenders are influenced differently by their information search behavior (remember that the effect of the information sources at low levels of expense is higher than at high levels of expense).
Several limitations of this study could be addressed in future research. While this research examines a variety of factors reflecting travel behaviors, some others would also be relevant, such as perceptions and motivations as well as other sensorial external effects such as the impact of weather on expenditures (Wilkins et al. 2017). The analysis conducted on firms—rather than destinations—would allow the detection of different effects across types of firms; for example, a hotel with different levels of service for specific types of rooms might find (and quantify) that a change in a specific variable may have distinct impacts on expenditures, depending on the level of those expenditures.
Footnotes
Declaration of Conflicting Interests
The author(s) declared no potential conflicts of interest with respect to the research, authorship, and/or publication of this article.
Funding
The author(s) received no financial support for the research, authorship, and/or publication of this article.