
Abstract
The tourism phenomenon essentially entails a quest and encounter with the otherness, which are often articulated in the traveler’s involvement with worlds, values, and lives of those inhabiting other cultures. Tourists however, as ordinary people, are not immune to intergroup biases, which constitute important behavioral determinants. Drawing on seminal accounts from intercultural communication, marketing, and psychology, the authors propose a Generalized Approach to Tourist Ethnocentrism (GATE) which considers biased perceptions toward out-group members and their culture, while moving beyond the traditional scope of the home country’s economy. Additionally, the study explored and modeled the Generalized Ethnocentrism (GenE) scale for application in tourism research. A second data set (n=302) further confirmed the psychometric properties, along with the fit and robustness of the proposed model. The GenE is presented to tourism research as a Type II reflective first-order formative second-order construct, whose causal indicators include cultural bias and personal prejudice. Research implications are discussed.
Keywords
Introduction
In the field of social sciences, tourism and ethnocentrism can be seen as two important phenomena with respect to human mobility. Tourism is described as a sociocultural consumption phenomenon whose processes involve human mobility across geographical and cultural boundaries (Jafari 1977; Pizam and Milman 1986). Ethnocentrism on the other hand, is a nearly universal sociopsychological trait, which is summarized into the tendency of judging other cultures [the out-group’s] according to the standards of one’s own [the in-group’s], and the beliefs that one’s ethnic and cultural group is superior to others (Sumner 1906; LeVine and Campbell 1972). Considering that tourists travel within an environmental bubble that tends to dictate the degree to which one exposes himself or herself to the strangeness of the host society (E. Cohen and Cooper 1986), it therefore can be argued that the concept of ethnocentrism can play an important role in the study of tourist behavior at different levels of the consumption process.
Tourist behavior (TB) as a field of study is the application of Consumer Behavior (CB) concepts, theories, and models to investigate the processes involved when tourists select, purchase, use, or dispose of goods, services, ideas, or experiences for the satisfaction of their needs and desires (Engel, Blackwell, and Miniard 1995). The quantification of ethnocentrism for the study of international consumer behavior began with Shimp and Sharma’s (1987) seminal work on the Consumer Ethnocentrism Tendency (CET) scale. Their approach to ethnocentrism essentially underpinned purchase behavior to socioeconomic dimensions such as economic morality, economic animosity, and economic rationality (Mavondo and Tan 1999; Marcoux, Filiatrault, and Chéron 1997). As such, consumer ethnocentrism has been defined as “the beliefs held by consumers about the appropriateness, indeed morality, of purchasing foreign-made products” (Shimp and Sharma 1987, p. 280). Though specific empirical addresses to ethnocentrism remain limited in tourist behavior literature (e.g., Fan 2016; F. Kock et al. 2019; Stepchenkova, Su, and Shichkova 2019), the fragmented dimensions of the concept however appear to have been implicitly documented. That is, for instance, the case for tourism works alluding to the dimension of animosity, such as F. Kock, Josiassen, and Assaf’s (2019) article on tourist xenophobia that investigates a tourist’s perceptual discomfort and anxiety associated with strangers encountered at foreign destinations; Tung, King, and Tse’s (2020) work on tourist stereotypes that focuses on one’s perception of the other to study positive and negative stereotypes that residents hold toward tourists; Chen, Lin, and Petrick’s (2013) study that also builds on social identity to investigate the process of international stereotyping when two countries have conflicts; and Tung’s (2019) study on metastereotypes that explores residents’ reactions to tourists’ negative (or positive) stereotypes of them. Similarly, the dimensions of morality and rationality could allude to applications of the self-concept (actual, ideal, social, and ideal social self-image in tourism; Sirgy and Su 2000; Todd 2001) or to the recently developed concept of tourist ethnocentrism (F. Kock et al. 2019). Essentially, this related body of literature expresses the idea of in-group–out-group dichotomy through which tourists see residents as outsiders (Caton and Santos 2009), and residents treat tourists as outsiders (Laxson 1991; McNaughton 2006). Nevertheless, they mainly appear to emphasize interpersonal relationships between the “self” and the “other,” while paying less attention to the biased perceptions that one may hold toward the other’s culture. While perceptions of the out-group have been found to affect willingness to interact (LeVine and Campbell 1972; Singh and Ho 2000), the apparent irrationality underlying hedonic or emotionally driven behavior with respect to holiday tourism (Gnoth 1997) calls for considerations of perceptions of the out-group’s culture. As such, tourists may feel a certain way toward a destination, but not necessarily feel the same toward its locals, thus expressing the need for a multidimensional tool for the investigation of intergroup biases both in a personal and cultural context.
As probably the first study to extend the concept of ethnocentrism to a tourism-specific context, F. Kock et al. (2019) also proposed the Tourist Ethnocentrism (TE) scale, which appears to use a similar socioeconomic lens as Shimp and Sharma’s (1987). TE was described as a positive in-group bias specifically concerned with the domestic tourism economy and its stakeholders. As such, spending a holiday at a domestic destination is socially expected, and a way for ethnocentric tourists to secure domestic jobs. Qualitative assessments can reveal that the six items contained in the TE scale appear to be heavily reliant on the conceptual field and items used in the CET scale (i.e., the emphasis on the consumer’s moral duty toward his or her domestic economy). Such conceptual similarity may call for the investigation of discriminant validity between the TE scale and the multidimensional CET scale (10-item and 17-item versions) proposed by Shimp and Sharma (1987). In line therewith, we note that the extant measurements of ethnocentrism in CB literature mainly appear to view ethnocentric purchase behavior as a direct response to the perceived consequences of consumption choices on the domestic economy. As a result, the current applications of ethnocentrism in the study of tourism (F. Kock et al. 2019) and consumer behavior (Shimp and Sharma 1987; Siamagka and Balabanis 2015) remain limited to the scope of the tourist’s home country’s economy (i.e., the demand side of the tourism system).
Alternatively, we propose an approach to ethnocentrism beyond the economic concerns over the tourist-generating region, by integrating the perceptions of the “other” and the “other’s culture” in the investigation of psychological responses to tourism supply and experience elements. Aiming to make a contribution to the burgeoning tourist behavior literature on intergroup biases, the proposed approach draws on social and psychological accounts on ethnocentrism (Sumner 1906; Neuliep and McCroskey 1997) while tapping into the intercultural nature of tourism, hence suggesting that in view of getting involved with worlds, values, and lives of those inhabiting other cultures, tourists, as ordinary people, may not necessarily escape negative out-group biases that constitute important determinants of behavior. In this manner, we approach the notion of ethnocentrism in tourism from a sociocultural lens to reconceptualize it as the biased attitudes that tourists may hold toward foreign destinations, in view of preferential judgments they bestow on elements of their own cultures, or of a destination that is culturally similar to theirs. The label “bias” in that sense is used to imply an unjustifiable predisposition to an extent where it goes beyond objective quality criteria. Two major discrepancies would transpire from a comparison between the proposed approach (sociocultural), and the current approach to ethnocentrism used in tourism (socioeconomic). These are (1) the applicability of TE in the study of international tourist behavior and (2) the degree to which the attitude object influences the tourist’s behavior.
With regard to the first constraint, we argue that the conceptual domain of TE may not be as effective when used to predict tourists’ choices between two or more foreign destinations. For instance, TE may be efficient in investigating Japanese tourists’ choices between traveling within Japan or to South Korea. In that case, the feelings of economic morality and patriotism captured by TE may be hypothesized to play an influential role in the decision. However, if the investigation of the same tourists involved choices confined between traveling to South Korea or to China, the use of TE would be limited, as traveling to either of those countries could not be justified as beneficial to the socioeconomic situation of the tourist’s domestic economy. Exceptions to the above example might include the case of business travels, or the existence of a tourism trade agreement between Japan and one of the proposed destinations.
The second limitation can be explained through the functions that attitudes may serve on the basis of the Attitude Function Theory (Katz 1960; Herek 1987). For instance, a tourist’s responsibility toward his or her domestic economy [socioeconomic approach] triggers expressive psychological functions such as ego-defensiveness, value expressiveness, and social adjustment (Herek 1987). In the tourist’s mind, these functions may result from the need for seeking acceptance by other in-group members; the need to express one’s concern over the socioeconomic well-being of the domestic economy; and the need to protect one’s home environment from socioeconomic threats such as job losses. These functions do not strongly rely on the attitude object (i.e., destination attributes) but rather on the tourist’s personality (Katz 1960). In the context of a multiple regression model, this implies that the strength of the relationship between ethnocentrism (IV) and the destination choice (DV) would be strongly influenced by personality (M1), rather than the destination attributes (M2). Thus, we conclude that the TE approach would provide a weaker evaluation of the destination and its attributes. In contrast, we propose that a tourism approach to ethnocentrism that draws on evaluative psychological functions (i.e., sociocultural approach) could prove to offer a stronger focus on the destination and its attributes. This is argued on the basis that evaluative attitudes, unlike expressive ones, are strongly dependent on the attitude object (Herek 1987). Thus, they would derive their attractiveness or averseness from the intrinsic properties of the destination (i.e., M2).
The study at hand is a tourism address of the overemphasized socioeconomic approach to ethnocentrism, which has prevailed in the consumer behavior literature since the mid-1980s. It is conducted at both a conceptual and an empirical level. The conceptual part of this study proposes a Generalized Approach to Tourist Ethnocentrism (GATE), which introduces a sociocultural perspective within the nascent study of ethnocentrism in tourist behavior. The empirical part assesses the GenE scale as a suggested measurement for the study of ethnocentrism in international tourist behavior. Three research objectives have been devised in relation to the empirical aim of this study. They consist of (1) exploring the underlying factor structure of the GenE scale; (2) assessing the psychometric properties of the identified factor structure; and (3) assessing the fit and robustness of the proposed model. The processes taking part in this study are summarized in Figure 1.

Study processes.
Literature
Ethnocentrism
Comprehensive reviews such as Bizumic (2014, 2015) note that the concept of ethnocentrism was initially employed by sociologists and psychologists. In one of the earliest documented uses of the concept, sociologist Gumplowicz (1881) considers ethnocentrism as a similar concept to “geocentrism” and “anthropocentrism.” The former, geocentrism, relates to the Ptolemaic system in the field of astronomy, which believes that the earth is the center of the universe (Inglis 2015). The latter, anthropocentrism, refers to the belief that humans are the center of the universe (Goralnik and Nelson 2012). Within the same conceptual analogy, Gumplowicz (1881) defined the focus of ethnocentrism to a group ethnicity level, which is ruled by the assumption that one’s own group is better than any other. Pertaining to this conceptual development, two main beliefs are of primary importance: the notion of group and the notion of centrality. Etymological analyses concur with the meanings of these two notions within the concept of ethnocentrism. For instance, literature notes that ethnocentrism is made of two words of Greek origin. The first word is ethnos. It refers to nation, and it is also related to the Greek word ethnikos, which means belonging to the ethnic group (Reisinger and Dimanche 2010). The second word, kentron, refers to center (Klopf 1995), which literally translates into the view that one’s country is the center of the universe.
Influenced by the works of Gumplowicz (1883, 1892) on ethnocentrism, Sumner (1906) subsequently described ethnocentrism around the conceptual boundaries of centrality and grouping (Bizumic 2014). Researchers, however, note Sumner’s (1906) emphasis on the terms in-group and out-group, and his later work that included additional intragroup characteristics (e.g., devotion, group cohesion) and intergroup characteristics such as the defense of the in-group interest against the out-group (Sumner 1911). Alternatively stated, Sumner clearly drew attention to two essential attitudinal components of an ethnocentric behavior. These include the attitudes toward the in-group (which are expected to be positive), and the attitudes toward the out-groups, which are expected to be negative (Segall 1979). Thus, owing to these fundamental conceptualizations, the classic definition of ethnocentrism states that ethnocentrism is “the technical name for the view of things in which one’s own group is the center of everything, and all others are scaled and rated with reference to it” (Sumner 1906, p. 13).
Over the years, the concept has been adopted in various fields of study, where its quantification has led to the development of several measurement instruments. For instance, the California Ethnocentrism (E) Scale by Adorno et al. (1950); the British Ethnocentrism Scale (Warr, Faust, and Harrison 1967); the Australian Ethnocentrism Scale (Beswick and Hills 1969); the Black Ethnocentrism Scale (Chang and Ritter 1976); the Consumer Ethnocentric Tendency (CET) Scale by Shimp and Sharma (1987); the United States Ethnocentrism (USE) Scale; the Generalized Ethnocentrism (GenE) Scale by Neuliep and McCroskey (1997); the Consumer Ethnocentrism Extended (CEE) Scale by Siamagka and Balabanis (2015); and the Tourism Ethnocentrism (TE) Scale by F. Kock et al. (2019).
The GenE scale, which is of primary concern to the current investigation, has been developed in response to a lack of empirical studies focusing on the impacts of ethnocentrism on intercultural communication. Communication researchers consider ethnocentrism as a perceptual window through which all cultures interpret and judge other cultures (Samovar and Porter 1997). Indications of how ethnocentrism impacts the way one responds to the environment have been widely documented. Aside from typical attitudinal and behavioral manifestations characterized by in-group favoritism (Neuliep and McCroskey 1997) and out-group negativity (Neuliep, Hintz, and McCroskey 2005), ethnocentrism has also been found to be an obstacle in intercultural communication competence. For instance, Gudykunst and Kim (1997) argue that high levels of ethnocentrism are dysfunctional with respect to intercultural communication, as it influences the way people communicate with others. Furthermore, Varner and Beamer (1995) indicate that ethnocentrism can lead to a state of complacency, in a sense that one’s voluntary refusal to look beyond his or her own culture may result in them seeing little importance in understanding other cultures. Similarly for tourist destination image, the effects of ethnocentrism could also be exemplified with the case of Conative Image. Conative Image (CI) is a constituent of Destination Image (DI) along with Cognitive Image and Affective image. While DI entails a subjective interpretation of a destination (Hunt 1975; Tasci and Gartner 2007), CI as one of its latent causal indicators (Rasoolimanesh and Ali 2018) refers to the mental impression assigned to behavioral intent toward the destination, that is, the individual’s actual conduct or intention to revisit and recommend the destination to others (Gartner 1994), or even to spread positive word of mouth (Baker and Crompton 2000). TE, as a positive in-group bias, has been found to have a positive effect on word of mouth and willingness to engage in domestic tourism (F. Kock et al. 2019). Negative out-group biases such as tourist xenophobia (F. Kock, Josiassen, and Assaf 2019) have been found to negatively affect willingness to engage in foreign tourism and try local food. These results concur with findings from other fields stating that perceived out-group similarity leads to greater willingness to associate (LeVine and Campbell 1972; Osbeck, Moghaddam, and Perreault 1997), whereas difference in attitudes can lead to dislike and avoidance (Singh and Ho 2000).
A Generalized Approach to Tourist Ethnocentrism
The GenE scale presents interesting theoretical prospects for the study of tourist behavior. Motives for its assessment for application to the field of tourism are diverse. For instance, theory maintains that culture influences communication, and that intercultural communication does not only focus on language use but also recognizes how culture outlines who we are, how we behave, how we think, and how we speak (Dodd 1995). Since tourism is a cross-cultural phenomenon, intercultural communication in tourism therefore involves the interaction between tourists of different cultural backgrounds, between tourists and the local populations where they spend their stay, between tourists and specialized personnel with whom they meet, etc. Hence, intercultural communication can be viewed as a process within tourism. In view of such theoretical interrelatedness, the GenE scale as a tool developed to assess ethnocentrism in intercultural communication can be applied in the study of human interactions across space, time, and cultures.
In order to efficiently capture ethnocentrism in the tourism context, we suggest that a proposed construct should essentially account for the meaning of “place” on both sides of the tourism system. This is argued on the accounts of environmental psychology, in which place is predominantly defined by a physical environment constructed based on its interrelationship with individuals’ internal psychological and social processes, attributes, and activities conducted at the place (Smaldone, Harris, and Sanyal 2005). This implies that a place is a manifestation of human culture, consequently making it difficult to remove the human element from the destination (Gieryn 2000). To integrate this argument to the current discussion, we suggest that the tourist’s home environment (demand side) be viewed within the hierarchical framework of place attachment (D. R. Williams et al. 1992), where place dependence and place identity would affect levels of ethnocentrism and shape the tourist’s behavior. Similarly, on the supply side of the system, the tourist destination needs to equally be viewed within the multidimensionality of the concept of place. This also concurs with the notion that the concept of place is physical as well as psychological (Montgomery 1998). Hence, calling for a multidimensional approach where not only functional, but most important, psychological attributes of the destination (e.g., the customs and the way of life of residents) would interact with tourist ethnocentrism and thus shape his or her behavior before, during, and even after the travel experience. A conceptual model (Figure 2) is provided in line with the proposed Generalized Approach to Tourist Ethnocentrism (GATE).
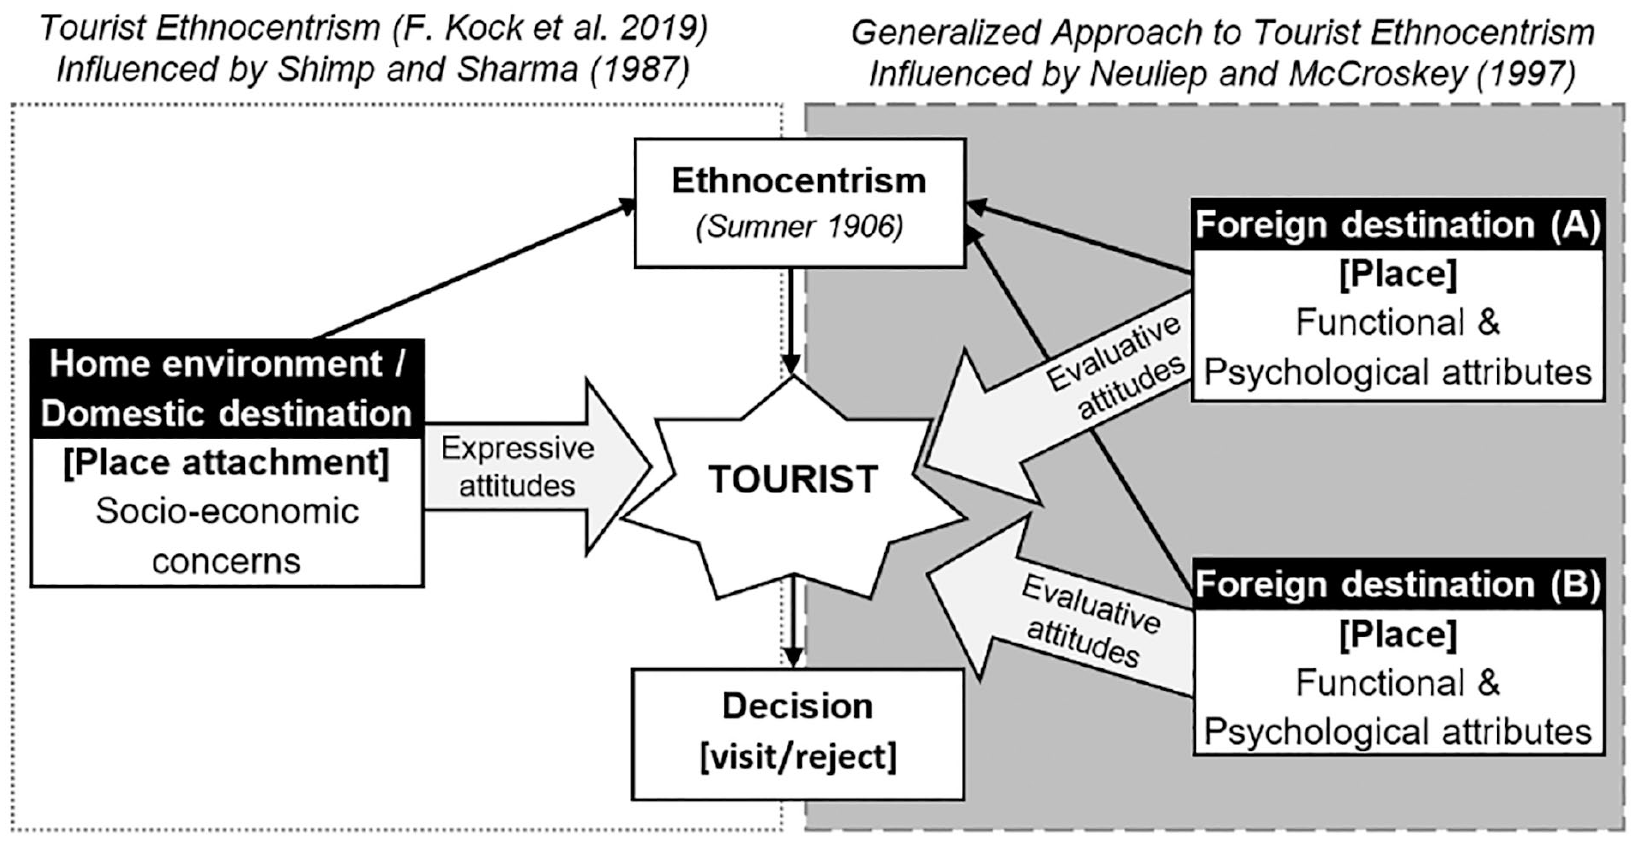
Generalized Approach to Tourist Ethnocentrism (GATE).
Unidimensionality and the GenE scale
The measurement of human behavior belongs to the widely accepted positivist view that, in turn, is an empirical-analytic approach to discern reality (Smallbone and Quinton 2003). Since most behavioral research takes place within this paradigm, there is a general consensus among scientists that a measurement device or procedure is useful only to the extent that it is valid and reliable (Drost 2011).
The GenE scale not only aligns with the sociocultural notion implied by Sumner’s definition, but has also been designed to measure ethnocentrism regardless of cultures (Neuliep and McCroskey 1997). Hence, it has been argued to possess good generalizability, along with satisfactory validity and reliability results (.76 ≤ α ≤ .90) in various cultural contexts including Japan, China, Korea, Romania, and the United States (Lin and Rancer 2003; Neuliep, Chaudoir, and McCroskey 2001; Pettijohn and Naples 2009). Since its publication, however, the construct has been in circulation in the field of social science with neither sufficient nor accessible evidence detailing its exploratory and confirmatory analytical procedures. For instance, Neuliep, Chaudoir, and McCroskey (2001) subjected all 22 scale items to factor analysis, and subsequently identified a single dimension as 18 items loaded on the first factor, while the remaining items did not form a factor (p. 143). Whereas Neuliep (2002) cites McCroskey (unpublished data, 2001), which maintains that “the 15 items used for scoring ethnocentrism consistently form a single factor when subjected to factor analysis” (p. 10), in contrast, fairly recent scale analysis studies reveal that although including reverse-worded items in a scale reduces acquiescence bias in the response style, [which happens to be the case for the GenE scale], it nonetheless raises the likelihood of method effect taking place within the factor structure (Zhang, Noor, and Savalei 2016). In line therewith, we point that the occurrence of such effect is not documented in the body of literature surrounding the GenE scale, and the scale’s dimensionality structure also remains unchallenged. Moreover, we observe that a common trait among studies reporting on the GenE scale’s reliability is the persistent use of coefficient alpha as the only measure of reliability (e.g., Goldstein and Keller 2015; Pettijohn and Naples 2009; Neuliep 2002; Neuliep, Chaudoir, and McCroskey 2001).
Reliability refers to the degree to which “measurement of individuals on different occasions, or by different observers or by similar or parallel tests, produce the same or similar results” (Streiner and Norman 1995, p. 6). For instance, Neuliep (2002) explains that if the GenE scale was to be administered to a group of students on Monday, we would expect to obtain similar results from the same group of students if administered to them again on Friday (i.e., provided that nothing happened to the students during the week that might influence their ethnocentrism). Thus, reliability essentially reflects consistency and replicability over time. Consistency refers to the inter-relatedness among the scale’s items, to a sufficient degree for them to be combined with one another (Cortina 1993; Serbetar and Sedlar 2016). This implies that if the GenE scale is to tap a single construct or domain (i.e., unidimensionality), then it should consist of items that sample the entire domain and not include items that tap other abilities or constructs. Under the above condition, such items are said to be homogeneous (R. J. Cohen and Swerdlik 2010).
Coefficient alpha (Cronbach 1951), usually known as Cronbach’s alpha or simply α, is probably the most widely used reliability estimate (Serbetar and Sedlar 2016). Among its numerous designations (e.g., estimate of reliability, or estimate of internal consistency), coefficient alpha is perhaps best described as an index of internal consistency of a scale. Homogeneity, as a pre-requisite for internal consistency, affirms unidimensionality as a key assumption of Cronbach’s alpha. When in violation, (i.e. presence of heterogeneous items), it could result in major underestimation of reliability (Serbetar and Sedlar 2016; Tavakol and Dennick 2011). Therefore, the coefficient alpha calculated from the GenE scale would be useful only to the extent of interitem correlation and single trait measurement. It should, however, be noted that there are conditions that might result in acceptable values of alpha (α > .7; Nunnally 1978), even in the presence of a multidimensional scale. These may include sample size and number of items (Cortina 1993; Serbetar and Sedlar 2016). For instance, in the case of the number of items in the scale, Streiner (2003) stresses that scales containing more than 20 items or so (which is also the case for the GenE scale) will have acceptable values of alpha even if they consist of orthogonal dimensions. Hence, in view that a high alpha does not guarantee homogeneity or unidimensionality of the scale, Cortina (1993) notes “that those who make decisions about the adequacy of a scale on the basis of nothing more than the level of alpha are missing the point of empirically estimating reliability” (p. 102). Regardless of the above, the GenE scale has been cited by more than 300 research papers.
Methods
Adopting the GenE Scale in Tourism
Literature on measurement constructs development highlights the importance of including the voices of experts in the initial stage of scale development (Churchill 1979; Hinkin 1995). These refer to expert judges and target population judges (Morgado et al. 2018). The former consists of experts in scale development or experts in the target construct, whereas target population judges include potential users of the scale. Although theoretical interrelatedness between tourism and intercultural communication has been argued to justify the application of the GenE scale in tourism, a methodological concern relating to content validity still remains. The GenE scale was directly adopted in the current study without additional item generation procedures aiming for construct adaptation. Justifications are provided in two parts: (1) theoretical assessments that argue the inclusive nature of the scale’s items, and the universality of ethnocentrism across human samples; and (2) an inbound approach to foreign travel experience (FTE) that supports the argument for content validity and also informs sampling decisions in subsequent parts of the study.
First, the GenE scale’s items were generated deductively. This process was supported by definitions of ethnocentrism and existing theory in various areas of social sciences (Neuliep and McCroskey 1997). These include works mainly published in the fields of sociology and cross-cultural psychology (e.g., Sumner 1906; Segall 1979; Islam and Hewstone 1993). Though not considered tourism-specific studies, they nonetheless share human behavior as a common denominator with the study of tourist behavior. As such, the inclusive nature of these generated items can be implied under the assumption of multidisciplinarity, which justifies the frequent importation of tourism theories from these areas of social sciences (Okumus and Van Niekerk 2015).
Additionally, ethnocentrism is nearly universal (LeVine and Campbell 1972). Its pervasiveness has been implied through socioconstructivist and sociobiological perspectives. Socioconstructivist scholars view ethnocentric orientations as learned habits resulting from particular socialization experiences (Samovar and Porter 1997). For instance, Allport (1954) indicates that ethnocentrism may be strongly established in children’s memories at an early age, well before they are even capable of critically evaluating and questioning its appropriateness. Within the premises of this assertion, family, school, and friends are often cited as socialization routes through which an individual is believed to implicitly develop ethnocentric behavior (Siamagka and Balabanis 2015). Sociobiological scholars explain this social behavior from the lens of evolution. They view ethnocentrism as a general predisposition that is a part of human nature (Gudykunst 2004). Accordingly, humans are believed to be more or less ethnocentric because of genetic inheritance (Sober and Wilson 1998; Kinder and Kam 2009). The universal prevalence of ethnocentric orientations across human samples implies that the validity of the GenE scale’s content is not necessarily limited to intercultural communication. Instead, these items are equally relevant to tourism, because tourists are essentially human beings who are not only genetically predisposed to harbor ethnocentric tendencies, but who also go through similar socialization routes.
Furthermore, the GenE scale has been designed to reflect a conceptualization of ethnocentrism that may be experienced by anyone regardless of culture (Neuliep and McCroskey 1997). Hence, generating items from a tourism sample for the sake of adaptation could possibly seem appropriate at face value. Internally, however, these items would still be tapping into a similar construct domain as the GenE scale. As a result, they would not provide new dimensions that could not have been identifiable when surveying the general population. Also, proceeding as such (e.g., using en route surveys) could severely heighten the occurrence of social desirability bias, because of the existing incongruity between the nature of the sample (tourism) and the phenomenon under study (ethnocentrism). The former entails a quest and an encounter with the otherness (Hollinshead 1993; Peillon 1984), whereas the latter denotes a state of cultural narrowness. Besides, exposure to other cultures has been found to reduce ethnocentrism (Nijssen and Douglas 2008, 2011).
Second, we note that FTE generally denotes temporary human mobility across international borders, during which cross-cultural interaction occurs as a result of the immersive nature of the tourism experience. From this outbound perspective (i.e., the visitor), suppressing cross-cultural human encounters in the transit and the destination regions could spark the argument that the views collected from such tourists lack the voices of “tourists.” On the other hand, suppressing spatial, temporal, and economic dimensions, while still maintaining cross-cultural human encounter (i.e., inbound tourism), would certainly nullify the argument. That is essentially because how much, how long, or even how far a tourist would travel and spend on a safari in Zimbabwe could not be justified to have a major effect on how that tourist feels about Zimbabweans or their culture, if he or she did not have any encounters with the hosts or their culture. In that sense, we propose that the momentary immersion into the out-group’s culture, as denoted by FTE, can also occur without traveling abroad. That is, the host (study sample) is predisposed to experience foreign culture within his or her home environment, because tourism is known to expose host environments to a wide range of impacts resulting from the values and behavioral modes that tourists carry—cultural baggage (Jafari 1987; E. Cohen and Cooper 1986; Rojek and Urry 1997). Though we recognize that the proposed inbound approach to FTE may not be as immersive as the outbound approach, we nevertheless point that it can offer a longer and higher frequency of exposure as it can include migration and is not severely impacted by economic constraints incurred by the host (e.g., accommodation or transportation costs).
To integrate this approach to the current justification, we note that Neuliep and McCroskey (1997) assessed the content adequacy of the deductively generated items by administering them to a sample of 396 students enrolled at a four-year liberal arts college, in the Midwestern United States, located in a metropolitan area of approximately 200,000 people. One hundred thirty-six of the participants were male and 256 were female (p. 390). Considering the nature of the sampling frame (metropolitan area) and the above approach to FTE, we conclude that the drawn sample contained a number of respondents who were (1) socially or genetically predisposed to experience the phenomenon under study and (2) had also engaged in cross-cultural interactions either from outbound or inbound travel perspectives.
Measures
We employed a quantitative design. Primary data were collected using structured pre-coded surveys consisting of two parts. The first part collected data on sociodemographic characteristics of respondents. These included variables such as gender, age, race, level of education, and FTE. The race matrix was adopted from the South African population group classification in use by Statistics South Africa (StatsSA 2012). Racial categorizations may differ in various parts of the world, yet it should be noted that black and colored have been seen as two distinct racial groups in South Africa since the apartheid era (Adhikari 2005). While there have been increasing calls by academics, heritage activists, and members predominantly from colored communities for the term to be abolished, others neither want to be classified as black or white because they are mixed-race and possess their own cultural identity (IOL 2018). Therefore, it should be noted that the use of the term “colored” in this study is not intended to reinforce stereotyping or marginalization, but instead, it is used to objectively reflect the current racial landscape of South Africa.
The second part focused on generalized ethnocentrism. We used the updated version of the GenE scale (Neuliep 2002). As a later version of Neuliep and McCroskey (1997), the revised scale also consists of 22-items which however display slight variations in wording (see Supplemental Figure S1). Half of them are phrased positively, while the other 11 are negatively stated. Fifteen items act as measurement items, whereas the remaining 7 items act as fillers (Lin, Rancer, and Trimbitas 2005). All items are in the form of statements placed on a 5-point Likert scale, from 1 being ‘strongly disagree’ to 5 being ‘strongly agree’. Ethnocentrism scores are calculated following reverse-coding and aggregation steps described by Neuliep and McCroskey (2013).
Though research objective 3 focused on the measurement model, a nomological net had to be created in order to achieve model identification. That is because composites cannot be estimated in isolation but need at least one other variable to have a relation with (Bagozzi 2011). Thus, Conative image (CI) was selected as an endogenous variable based on theoretical considerations. Three items suggested by Agapito, Mendes, and Valle (2013) were adapted to measure conative image: intention to visit, intention to recommend, intention to spread positive word of mouth. They were placed on a five-point Likert-type scale ranging from 1 (definitely no) to 5 (definitely yes).
Sampling
The Republic of South Africa (RSA) is a culturally and racially diverse country, which is often referred to as the rainbow nation. With an estimated population of 57.7 million, it is Africa’s second-largest economy, after Nigeria (Asuelime 2018). South Africa received an estimated 10.3 million international tourists in 2017. It has a high concentration of foreign nationals that, according to the South African National Census of 2011, is estimated at 2.1 million (StatsSA 2012). Some reports, however, consider this figure as an underestimation because of the high number of undocumented border crossings, while further indicating that Zimbabwean migration since the 2000s has been the largest concentration flow in South African history (de Jager and Musuva 2016). Over the years, South Africa has had various episodes of widespread xenophobia. These were mainly triggered by socioeconomic problems such as high unemployment and crime rates (Gordon 2016; Tella 2016). African migrants, who are often blamed for these societal problems, constitute the main target of these attacks. These essentially include Nigerians and Zimbabweans (Lee 2017). The pejorative term Kwerekwere is used by black South Africans when referring to unwanted African foreigners (Saayman 2016; Weda and de Villiers 2019). Studies have even reported cases of medical xenophobia in public health facilities (Crush and Tawodzera 2014; Zihindula, Meyer-Weitz, and Akintola 2017). In view of the above, South African citizens were selected as respondents, while Zimbabwe was selected as the proposed destination. The target population was not restricted to South African citizens who had previously traveled abroad. Instead, we extended that range by taking into account cross-cultural interactions that occur within the respondents’ home environment, transit routes, or attractions as a result of inbound tourism and migration in this era of globalization.
Data were collected in two phases by the Inter African Research Consultancy (IARC) at different dates and in different areas of the city of Pretoria (South Africa). Familiarity and ease of access informed the choice of collection sites. Accordingly, data were collected near tertiary learning institutions in the northern and eastern parts of Pretoria. Though limitations inherent to the use of a student sample are acknowledged, we nonetheless note that high literacy rate and previous cross-cultural experiences gained by either traveling internationally or by living in this cosmopolitan city were attributes sought for in each respondent. We collected a total of 260 usable surveys (data set 1), which was intended for research objectives 1 and 2. Sample size guidelines for intended statistical tests suggest 200 observations as fair and 300 as good (B. Williams, Onsman, and Brown 1996). Others suggest a minimum of 5 or ideally 20 observations per variable (Comrey and Lee 1992).
The second collection phase occurred in central and western parts of Pretoria. It generated a total of 302 usable surveys (data set 2), which was intended for research objective 3 (i.e., confirmatory analyses). It was collected to avoid double-dipping during cross-validation (Cudeck and Brown 1983). A sampling guideline for partial least squares (PLS) structural equation modeling (SEM) suggests that the minimum sample size should be 10 times the largest number of indicators used to measure a construct (Hair et al. 2014). Accordingly, it was concluded that the current study has a sufficient sample size for estimating the proposed model (N = 302). The survey’s technical specifications (Table 1) and descriptive statistics of respondents’ sociodemographics (Table 2) for both data sets are provided.
Survey Technical Specifications.
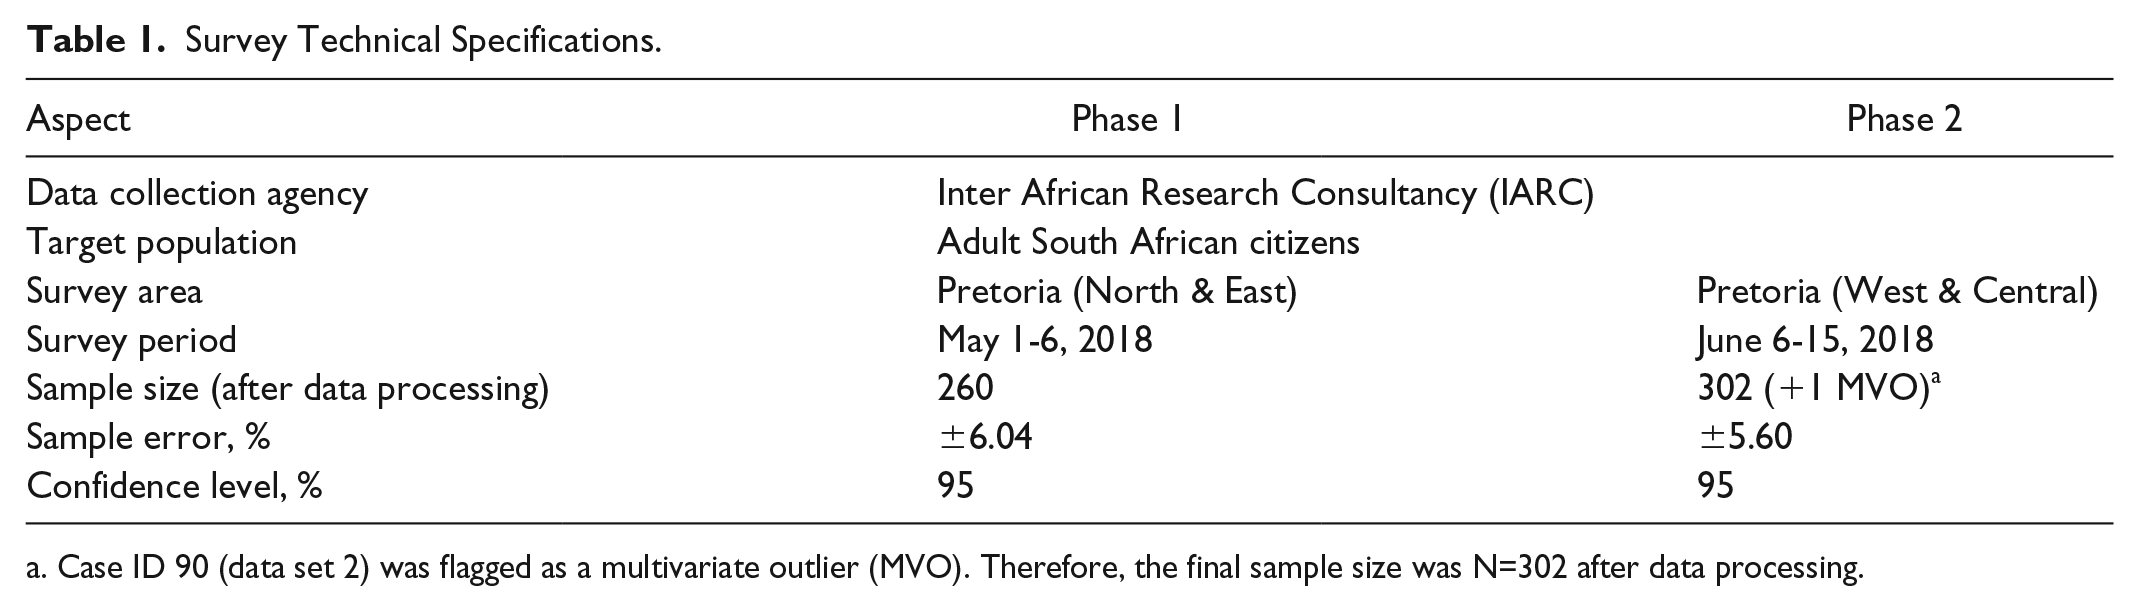
Case ID 90 (data set 2) was flagged as a multivariate outlier (MVO). Therefore, the final sample size was N=302 after data processing.
Sample Demographic Profile.

Race matrix adopted from the South African population group classification (StatsSA 2012).
Data Processing
Data processing was conducted with the aim of assessing the nature and suitability of the data, in order to support the choices of statistical analysis tools and methods. Missing value analyses reported no missing data in both data sets. We tested for extreme case scores that may have a higher influence on statistical results (i.e., univariate and multivariate outliers). With regard to the former, Z scores greater than 3.3 as an absolute value were not reported (Tabachnick and Fidell 2001). Inspections of histograms and boxplots at the interquartile range (IQR) rule multipliers of 1.5 and 3.0 further confirmed the absence of problematic univariate outliers in either data set (Tukey 1977). Multivariate outliers were identified in data set 2 when computing the Mahalanobis distance, which was then compared to a chi-squared distribution assessed at p <0.001. The output suggested the deletion of case ID 90 (see Table 1). Assessments of values of symmetry and peakedness suggested that the data are not significantly departing from normality within a univariate distribution context. Skewness and kurtosis values were reported within the recommended range of −2 and +2 (George and Mallery 2010). These preliminary tests confirmed the appropriateness of both data sets for subsequent analyses as no significant violations were found.
Data Analysis
Owing to the nature of the specified model, SEM techniques such as the covariance-based SEM (CB-SEM) through SPSS AMOS (Arbuckle 2005) were found inappropriate for the second part of the study (Sarstedt et al. 2016). Instead, we relied on variance-based SEM such as SmartPLS 3 (Ringle, Wende, and Becker 2015) because of its ability to consistently model, estimate, and test composite second-order constructs made up of reflective first-order constructs. SmartPLS is a software for PLS analysis that also provides confirmatory factor analysis functions.
Ethnocentrism was modeled as a composite construct and estimated using the Three-Stage Approach described by van Riel et al. (2017). Given that this study focuses on model assessment, reports of causal relationships within the structural model were excluded as they fall out of the scope of this investigation. Rather, we have focused on the composing relationships between ethnocentrism and its causal indicators. For that reason, we have followed the Three-Stage Approach up until the eighth step, which consisted of re-estimating the model with reliability-adjusted single indicators. Advantages of using the Three-Stage Approach over the Repeated Indicators Approach (Wold 1982), the Two-Stage Approach (Chin, Marcolin, and Newsted 2003), and the Hybrid Approach (Wilson and Henseler 2007) are discussed by van Riel et al. (2017).
Results
Study 1: Dimensionality Analysis
Exploratory factor analysis (EFA) was carried out to identify the underlying dimensions of the GenE scale. Following the recommendations of Neuliep and McCroskey (2013), Items GenE 4, 7, and 9 were reverse coded. The abbreviation “RC” was added to these items as an indication of reverse-coding. Items GenE 3, 6, 12, 15, 16, 17, and 19 were deleted from further analysis, as they act as fillers. The remaining 15 measurement items were submitted to dimensional analysis. Bartlett’s test of sphericity (1133.124; p < 0.001) confirmed the appropriateness of conducting EFA on the data, while the Kaiser-Meyer-Olkin (KMO) confirmed the sample size adequacy with a value of 0.767 (Hair et al. 2010).
Factor extraction
Five factors were extracted from the first EFA round, using principal components analysis (PCA) and the eigenvalues >1 criterion (Kaiser 1958). Factor 1 had an eigenvalue of 4.029; factor 2, 2.207; factor 3, 1.256; factor 4, 1.114; and factor 5, 1.020. Horn (1965) parallel analysis (PA) was conducted as a confirmatory measure to support factor retention criteria based on eigenvalue >1. According to this procedure, the factors to be retained should display greater eigenvalues in the EFA compared with the PA. The results suggested the removal of factor 4 and factor 5, which displayed eigenvalues of 1.196 and 1.134, respectively, in the PA. We however allowed factor 3 to remain in the analysis because its eigenvalue difference between the PA (1.257) and the EFA (1.256) was merely 0.001, thus not providing sufficient justification for its removal, especially since the PA can be sensitive to sample size (Tran and Formann 2009; Turner 1998).
Rotation
A second round of EFA was conducted with the aim of mathematically determining the type of rotation to be used. The eigenvalue criterion was dropped, while the number of factors was fixed at three based on the PA results. The direct oblimin rotation was used since it allows a nonorthogonal solution (i.e., correlated factors). Coefficients with absolute values <0.4 were suppressed. The component correlation matrix output (Table 3) showed that all factors were uncorrelated. These were interpreted as an orthogonal matrix, thus leading to the choice of the varimax rotation method as recommended by Kaiser (1958).
Component Correlation Matrix.
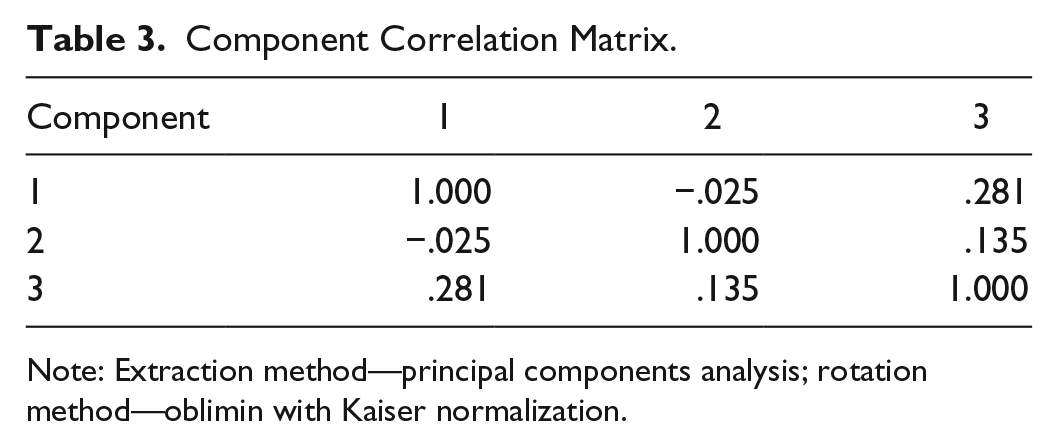
Note: Extraction method—principal components analysis; rotation method—oblimin with Kaiser normalization.
Items and factor deletion
An additional series of EFA was performed using the varimax rotation method. Item deletion essentially took place under consideration of statistical guidelines from literature. These included the following: (a) factor loading should be >0.4 (Hair et al. 2010); (b) item-to-total correlation should be >0.4 (Churchill 1979); (c) at least three significant loadings per factors (Comrey 1988); (d) cross-loadings should not be >0.4; (e) communalities should be >0.4; (f) minimum threshold of the total variance explained should be 60% (Hair et al. 2010); (g) internal consistency reliability should be >0.7 for Cronbach’s alpha and composite reliability (Nunnally 1978; Jiménez-Guerrero, Gázquez-Abad, and Linares-Agüera 2014). This assessment provided a three-factor structure whose rotated matrix is illustrated in Table 4.
Rotated Component Matrix.
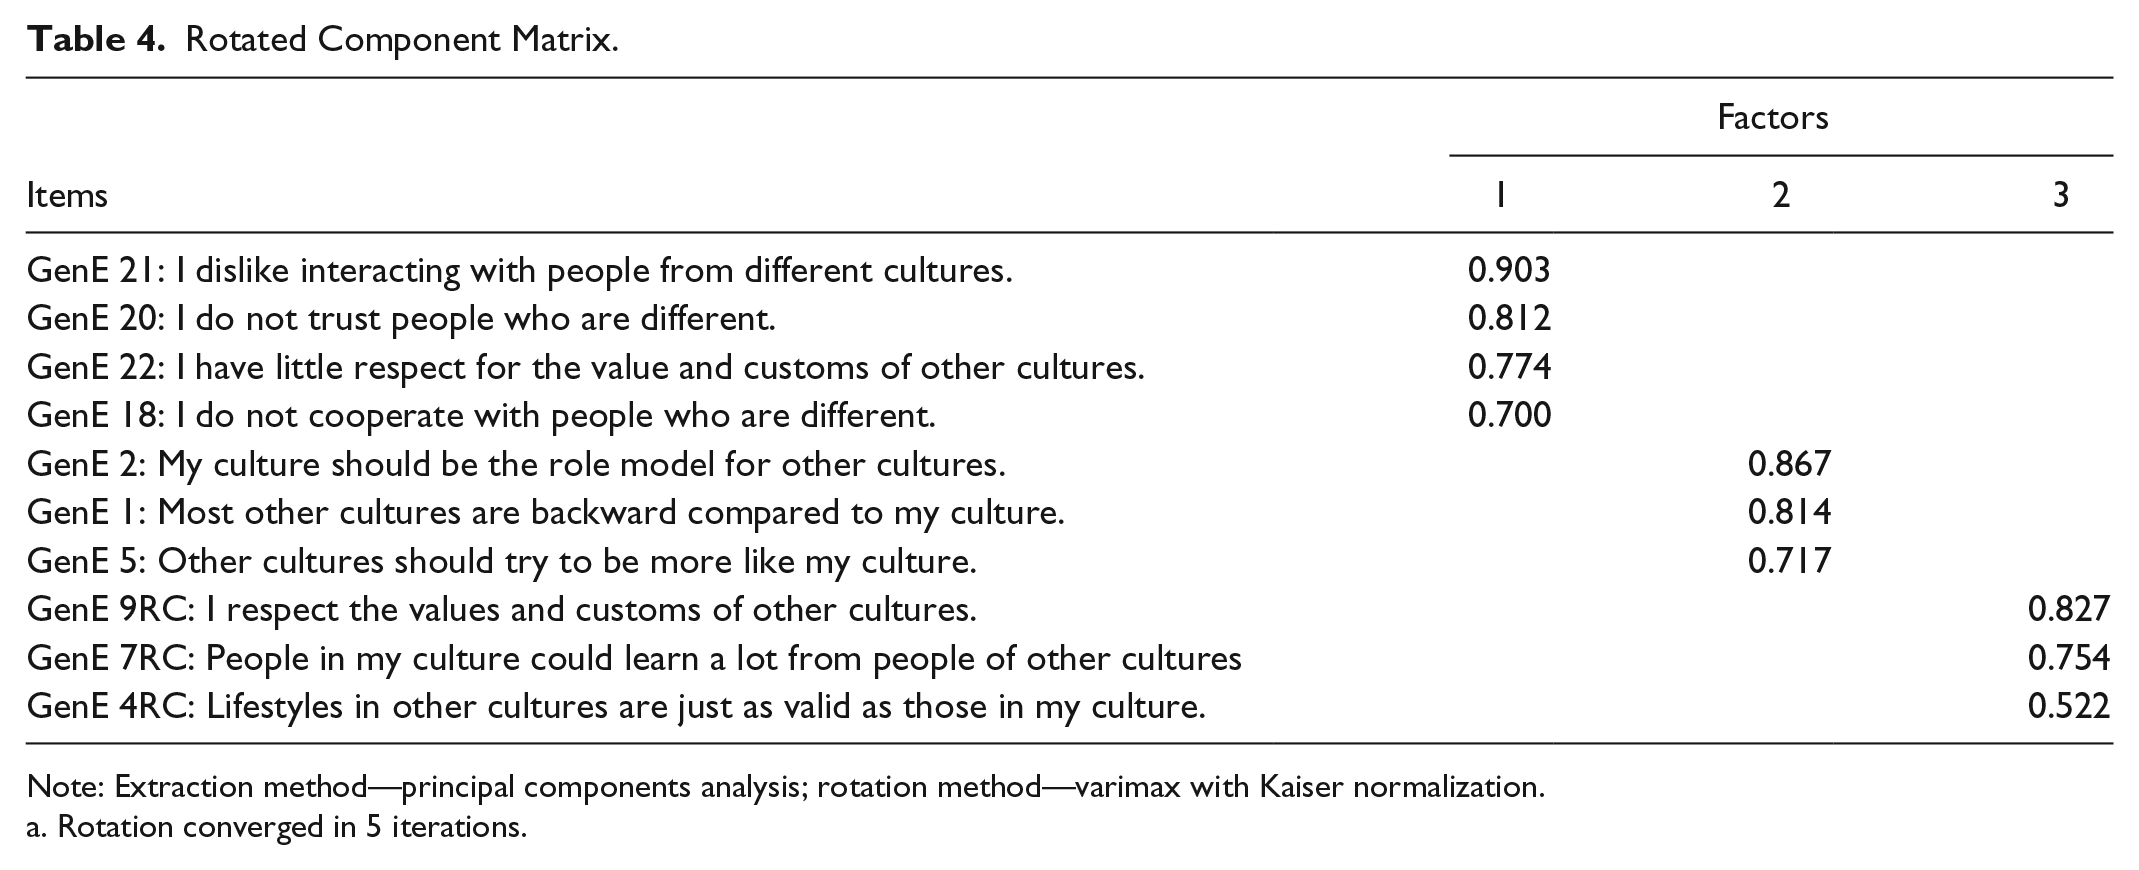
Note: Extraction method—principal components analysis; rotation method—varimax with Kaiser normalization.
Rotation converged in 5 iterations.
Worthington and Whittaker (2006) suggest that a factor should be retained only if it can be interpreted in a meaningful way, no matter how solid the evidence for its retention based on the empirical criteria. Accordingly, the obtained factors were assessed against the theoretical bases that support the conceptualization of ethnocentrism, in order to provide an overview of the latent factors’ alignment with their higher-order construct (i.e., ethnocentrism). It was observed that factor 1 and factor 2 are mainly associated with a biased comparison between “us/my” and “the others,” in the context of cross-cultural interaction. These two factors are consistent with the definition of ethnocentrism and its various designations. For instance, literature shows that ethnocentrism essentially denotes elements of cultural bias (Applebaum 1996), cultural narrowness (Adorno et al. 1950), in-group favoritism (Neuliep and McCroskey 1997), out-group negativity (Altemeyer 2003), and a state of complacency (Varner and Beamer 1995). These elements are entrenched in the items measuring factor 1 and factor 2. Factor 3, on the other hand, appears to reflect a notion that is opposite to what ethnocentrism symbolizes, although also related to the theme of cross-cultural comparison and interaction. Its items consist of negated and polar opposite statements (Sonderen, Sanderman, and Coyne 2013), which represent elements of cultural openness and tolerance (Nijssen and Douglas 2011). Therefore, owing to the use of reverse-worded items in the GenE scale design (Neuliep and McCroskey 2013), we have identified factor 3 as a method factor (DiStefano and Motl 2006), which appears to be formed by RC items as depicted in Table 4 (Zhang, Noor, and Savalei 2016).
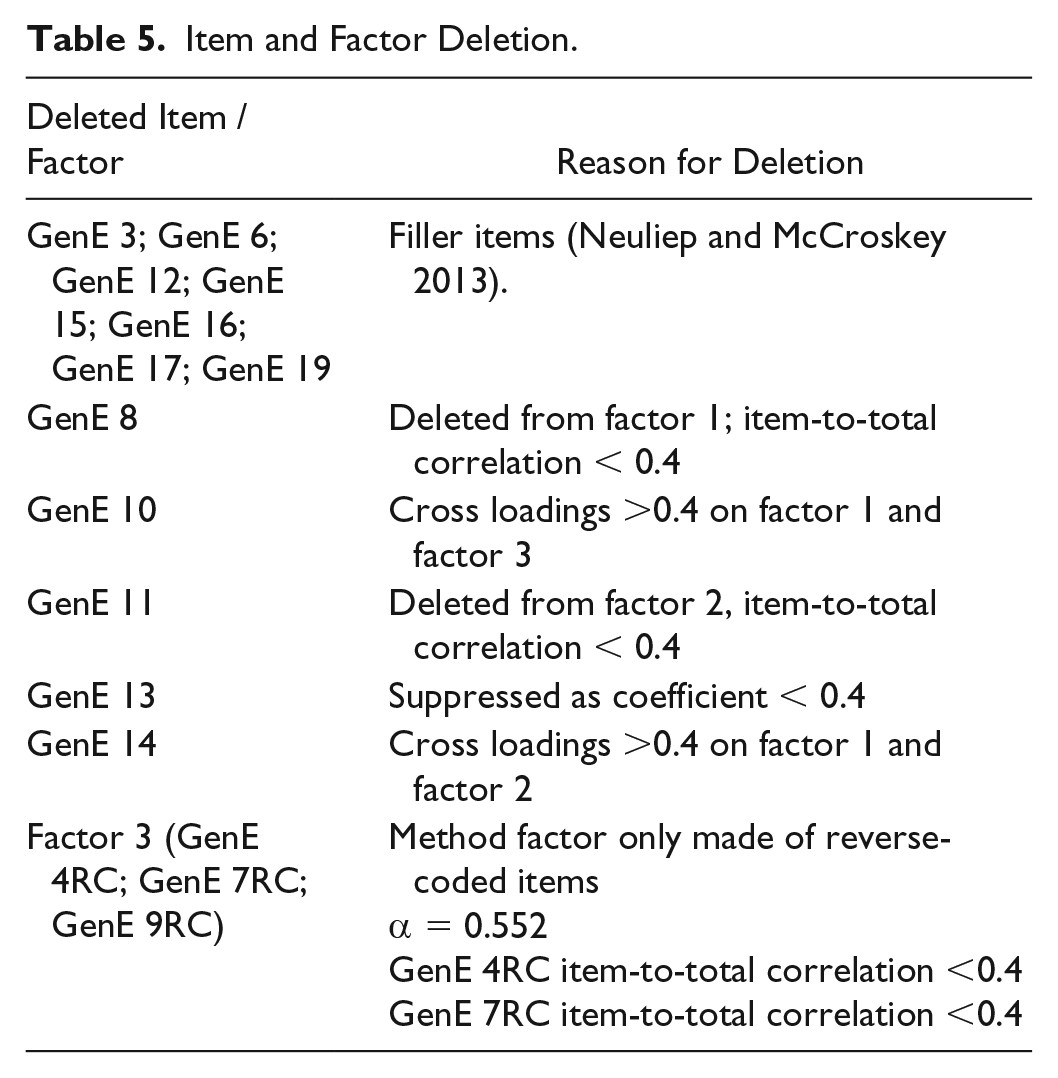
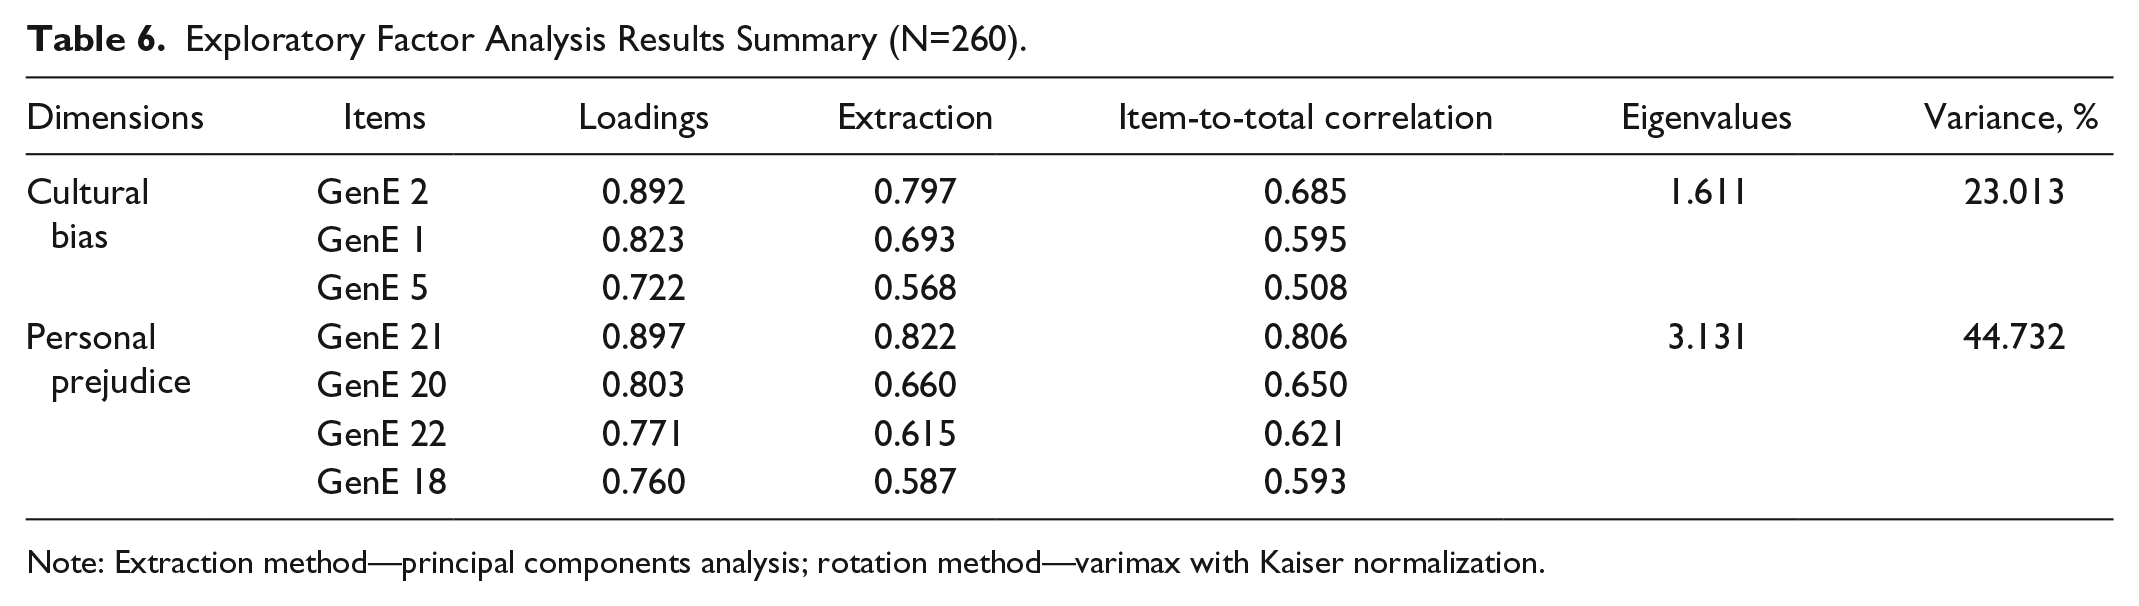
The final stage of this purification process focused on internal consistency. Factor 3 revealed that two of its item-to-total correlations were <0.4, while its Cronbach’s alpha (α = 0.552) was below the recommended range for this study. This was an indication of poor internal consistency among items in this factor. This argument was considered as a sufficient basis for the removal of factor 3 from further analysis. Table 5 presents a list of all deleted items, while Table 6 summarizes the final EFA results.
Item and Factor Deletion.
Exploratory Factor Analysis Results Summary (N=260).
Note: Extraction method—principal components analysis; rotation method—varimax with Kaiser normalization.
Psychometric properties
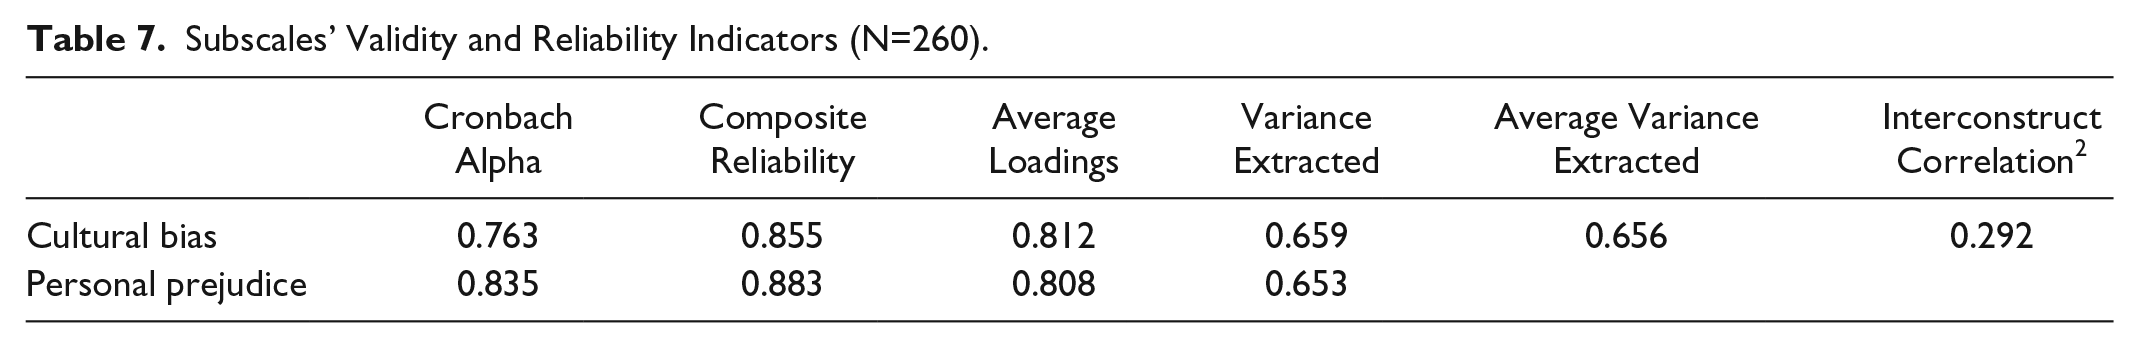
The psychometric properties of the retained factors were subsequently assessed by means of validity and reliability tests. Considering the multidimensional nature of the construct, the analyses were conducted by using the following suggested thresholds: Cronbach’s alpha >0.7 at the subscale level (Nunnally 1978) and composite reliability (CR) >0.7 (Hair et al. 2010) for internal consistency; average variance extracted (AVE) >0.5 (Hair et al. 2010) for convergent validity; CR >AVE and AVE >squared interconstruct correlation (Hair et al. 2014; Kim, Ritchie, and McCormick 2010) for discriminant validity. The analysis results as reported in Table 7 were within all suggested thresholds. It was therefore concluded that the extracted factors illustrate adequate psychometric properties in terms of internal consistency, composite reliability, convergent validity, and discriminant validity.
Subscales’ Validity and Reliability Indicators (N=260).
Scales’ Reliability.
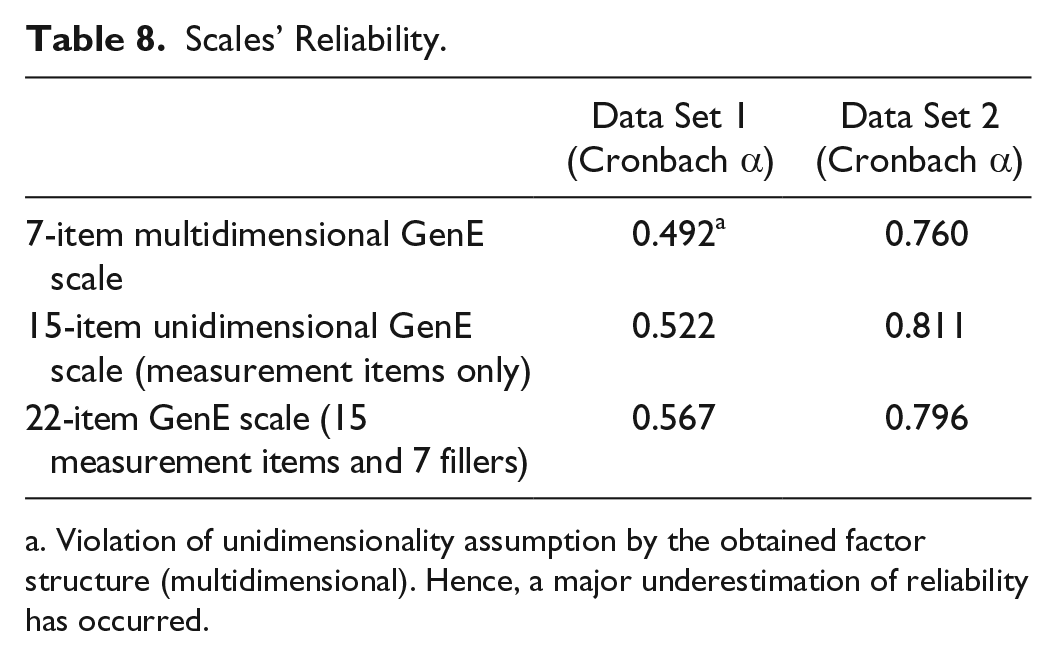
Violation of unidimensionality assumption by the obtained factor structure (multidimensional). Hence, a major underestimation of reliability has occurred.
Modeling ethnocentrism as a hierarchical construct
We interpreted the identified two-factor structure as a formative measurement model (Bollen and Diamantopoulos 2017). Precisely, the identified model is specified as a type II reflective first-order formative second-order construct (Jarvis, MacKenzie, and Podsakoff 2003). This interpretation implies that Cultural Bias and Personal Prejudice, as causal indicators, are theoretically viewed as causes of ethnocentrism, rather than its consequences. In view of the formative part of the model (i.e., inner model), it has been established that latent variables measured by causal indicators do not fully form the composite (Henseler, Hubona, and Ray 2016). For that reason, we have added a disturbance term (δ1) to the composite, to denote all the other causes of ethnocentrism that have not been included in the model (Diamantopoulos 2006). With regard to the reflective part of the model (outer model), literature indicates that the covariance of each indicator is shared with all the other indicators, while the random variance for each indicator is treated as error for that indicator, which is therefore reflected separately for each indicator (Law and Wong 1999). For that reason, we have also added error terms (ε) to each indicator of the first-order latent variables to denote the unexplained variance for those indicators. Additionally, theoretical and empirical considerations that have guided model evaluation included the direction of causality; content assessment between causal indicators (see Table 4); orthogonality of causal indicators (see Table 3); implied internal consistency at indicator level (see Table 7); and the alteration of the construct domain if a causal indicator is to be removed (Jarvis, MacKenzie, and Podsakoff 2003). Based on these observations, we have modeled ethnocentrism as a formative second-order construct consisting of two reflective first-order dimensions, which are respectively measured by three and four interchangeable observed items. The hierarchical model is presented in Figure 3.
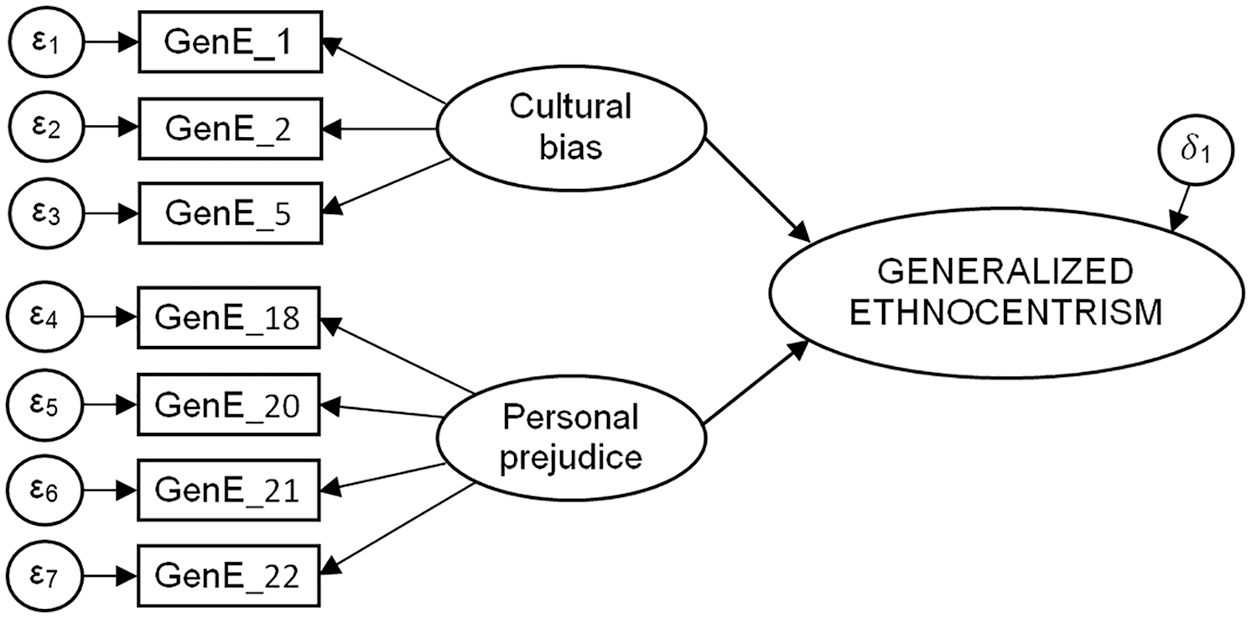
Hierarchical model of generalized ethnocentrism.
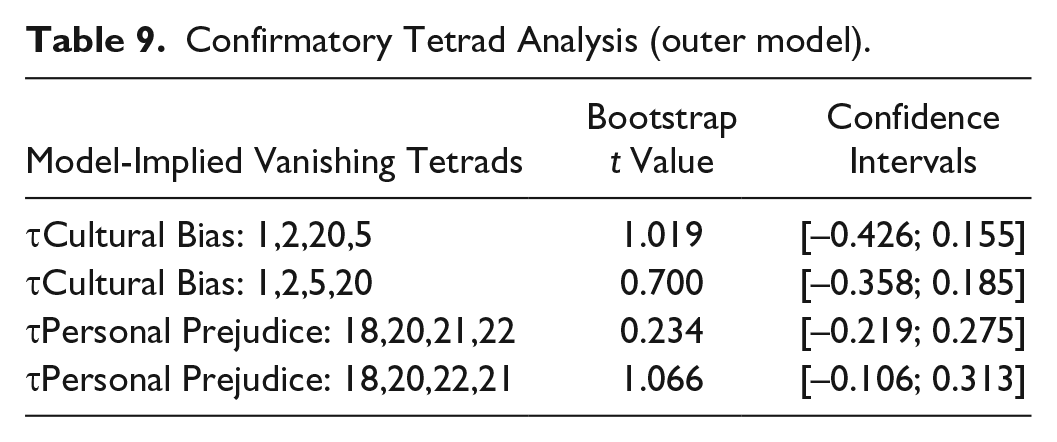
Confirmatory tetrad analysis (CTA) was conducted to provide empirical support for the specified outer parts of the model (Gudergan et al. 2008). Given that Cultural Bias was observed by less than four indicators, we borrowed one indicator from Personal Prejudice in order for CTA-PLS to be applied (Gudergan et al. 2008). The results from 5,000 bootstrapping subsamples displayed in Table 9 showed that all model-implied vanishing tetrads are not significantly different from zero. This provides evidence of the reflective nature of CB and PP.
Confirmatory Tetrad Analysis (outer model).
Study 2: Model Assessment
Assessment of the measurement model
The psychometric properties of the measurement model were assessed using data set 2. Three first-order constructs were evaluated: Cultural Bias (CB), Personal Prejudice (PP), and Conative Image (CI). Extant validity and reliability coefficients such as Cronbach’s alpha (
Measurement Model Assessment.
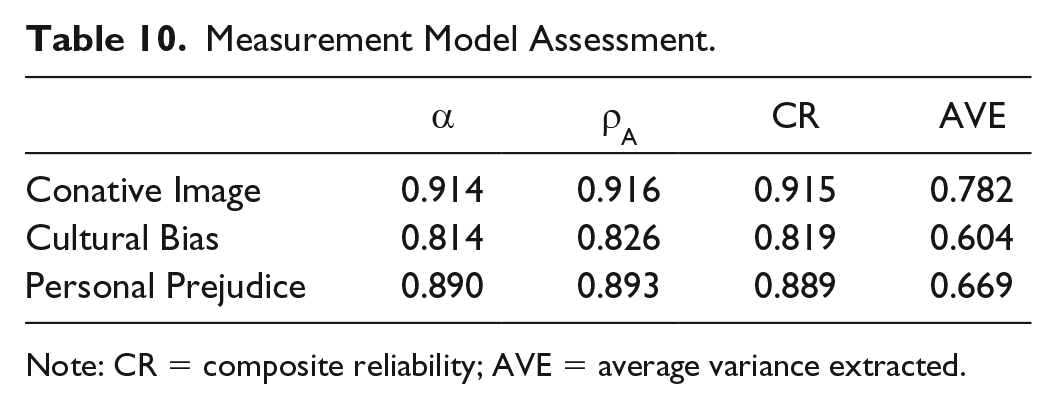
Note: CR = composite reliability; AVE = average variance extracted.
Discriminant Validity (HTMT0.85 Criterion).
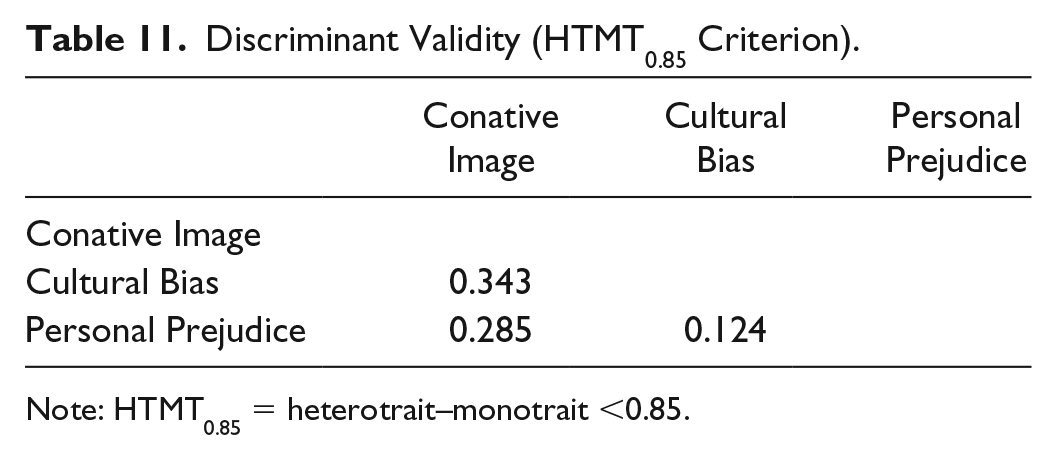
Note: HTMT0.85 = heterotrait–monotrait <0.85.
Hierarchical assessment of the structural model
We proceeded to assess the fit indices of the structural model at two levels. First-level assessment focused on the fit of the measurement model without the second-order composite (see Figure 4). Bootstrap-based exact fit measures as well as approximate fit measures, such as the standardized root mean square residual (SRMR) and the normed fit index (NFI), were employed. Recommended thresholds include SRMR = 0 for a perfect fit and SRMR <0.05 for an acceptable fit (B. M. Byrne 2008). A less conservative threshold has been suggested as SRMR <0.08 (Hu and Bentler 1999). For reflective models, NFI values above 0.90 are considered acceptable (B. M. Byrne 2008). Though thresholds for formative models are still to be determined (Henseler, Hubona, and Ray 2016), we nevertheless opted for NFI >0.90 for this study. The first-level assessment results revealed an acceptable model fit with SRMR = 0.041, and NFI = 0.942.
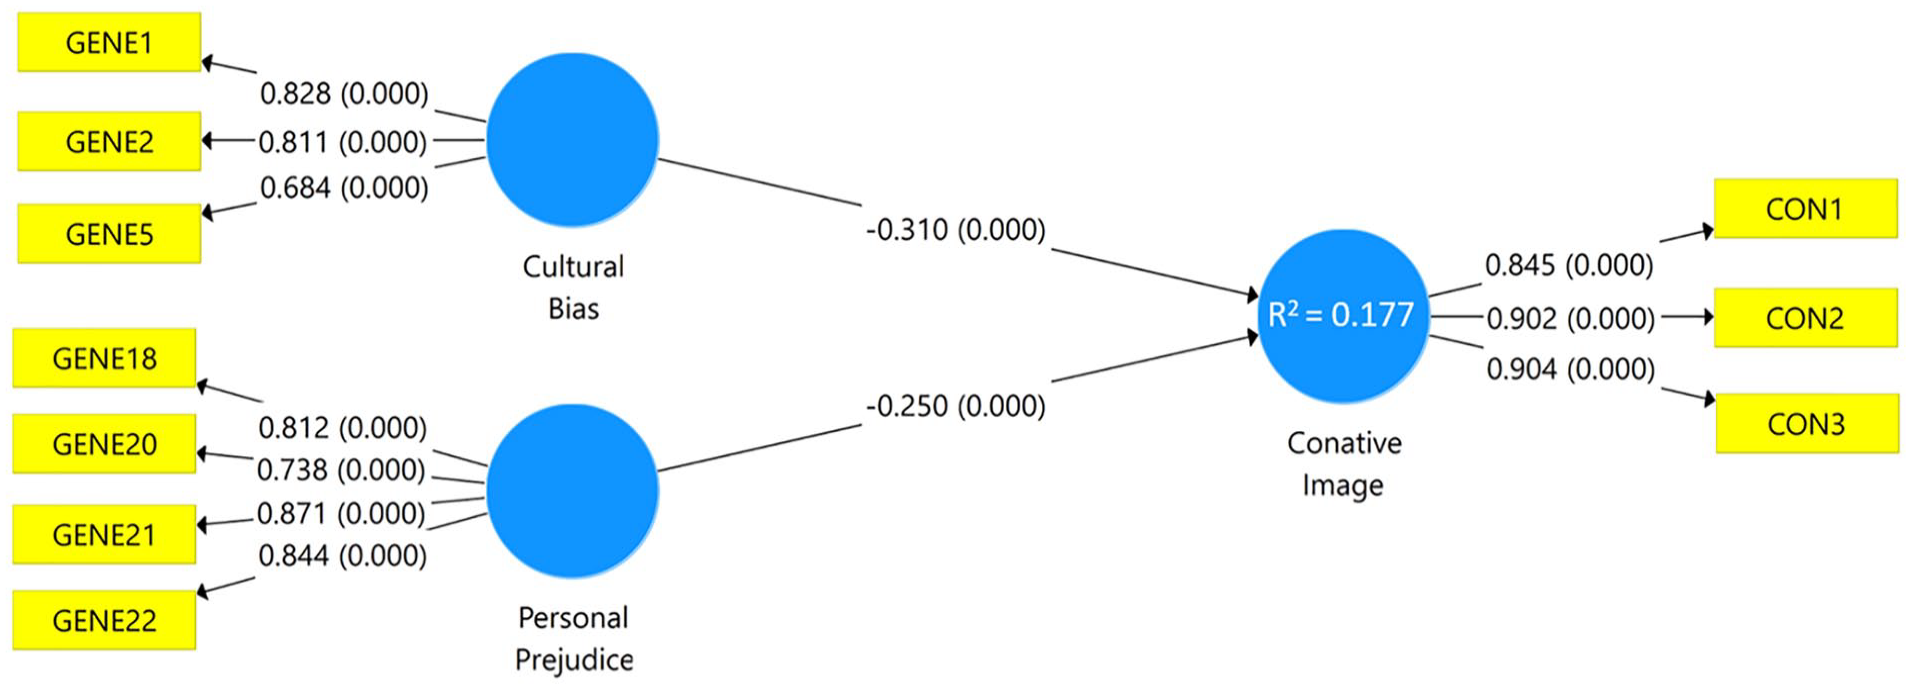
Model without second-order composite.
The second-level assessment focused on the model without first-order constructs. It was conducted once the measurement model of the second-order construct was modeled as a composite (Mode B) by means of extracted standardized scores (see Figure 5). All fit indicators were reported within the recommended threshold (SRMR = 0.009 and NFI = 0.994).
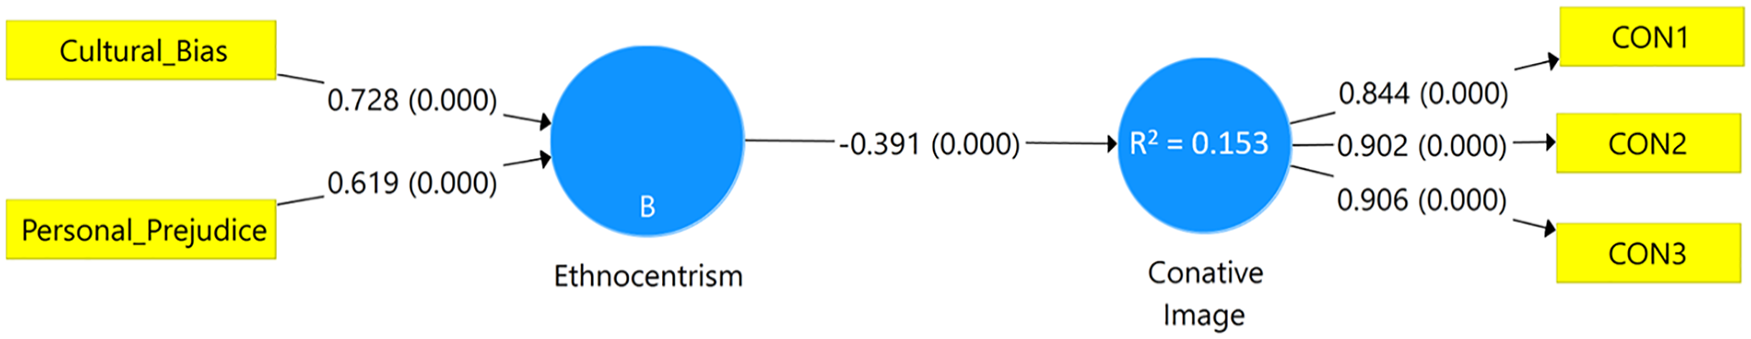
Model as second-order composite.
Reliability of the second-order composite
The reliability of the second-order composite (i.e., ethnocentrism) was assessed. Reliability of composite constructs cannot be accurately calculated using extant coefficients such as Dijkstra-Henseler’s
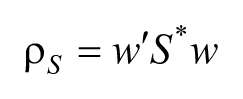
Within this equation, w represents the column vector containing the indicator weights of Cultural Bias (wCB = 0.728) and Personal Prejudice (wPP = 0.619) on Ethnocentrism (see Figure 4). S* represents the consistent correlation between the causal indicators (see Supplemental Table S1), i.e. Cultural Bias and Personal Prejudice (S = 0.114). We added Dijkstra-Henseler’s
Structural Model Robustness
We assessed the robustness of the structural model through tests of common method bias (CMB) and nonlinear effects. CMB was examined by using Harman’s one-factor test in SPSS. The result revealed that a single factor (31.56%) did not account for the majority of the variance (Podsakoff et al. 2003). This suggested that CMB does not affect the study results. Additionally, N. Kock (2015) collinearity assessment was conducted in view of potential limitations to Harman’s one-factor test when dealing with formative models (Sarstedt et al. 2016). The factor-level variance inflated factors (VIF) were within the 3.3 critical threshold. This provided further assurance that no problems with CMB existed.
Nonlinear effects were assessed using guidelines provided by Sarstedt et al. (2019). The test was conducted on the common-factor model and on the composite factor model in SmartPLS 3. With regard to the former, we added interaction terms to Conative Image (CI) in order to represent quadratic effects of (1) Cultural Bias on CI, and (2) Personal Prejudice on CI. The two-stage calculation method was implemented since the assessment was conducted at the common factor level (Henseler et al. 2012). For the composite factor model, an interaction term was added to CI to represent the quadratic effect of Ethnocentrism on CI. The product indicator (Chin, Marcolin, and Newsted 2003) calculation method was used because the composite already contained latent variables scores. The results obtained from 5,000 bootstrapping subsamples (Table 12) indicated nonsignificant linear effects in neither of the models. We therefore concluded that the linear effects model is robust.
Assessment of Nonlinear Effects (5,000 Bootstrapping Samples).

Discussion of Results
This study assessed the GenE scale for application to the study of international tourist behavior by (1) exploring its underlying factor structure, (2) assessing the psychometric properties of the identified factor structure, and (3) assessing the fit of the identified model. Beyond this empirical endeavor, the study also proposed a Generalized Approach to Tourist Ethnocentrism (GATE), which provided conceptual support for the application of the GenE scale in the study of international tourist behavior.
Results derived from EFA revealed that the GenE scale is a hierarchical construct, whose dimensions approach human interaction from two perspectives: intercultural, and interpersonal. At an intercultural level, the scale has been shown to capture biased judgments that in-group members hold toward the culture (i.e., values, customs, norms, and behaviors) of other groups (Applebaum 1996). In the tourism context, this dimension can be interpreted as the biased views that tourists may hold toward the cultural attributes of some destinations, when comparing to either their own or, possibly, to one that is perceived as culturally similar. This dimension is operationalized by three items that are collectively named Cultural Bias. At an interpersonal level, the in-group’s bias judgments were found not to be directed toward the culture, but instead they were aimed at the out-group members (Adorno et al. 1950). Similarly, it can be argued that tourists, as ordinary people, can also hold biased judgments toward members of local communities for a wide range of reasons, which may extend well beyond cultural differences. Four items have been identified under that dimension. They have been collectively named Personal Prejudice.
Convergent and discriminant validity results indicated that CB and PP are not only conceptually distinct but are also interacting latent causes of ethnocentrism. Both dimensions are consistent with tourist behavior studies which mention the occurrence of intergroup biases and tourists’ prejudicial attitudes toward the hosts (Pearce and Stringer 1991; Laxson 1991; F. Kock, Josiassen, and Assaf 2019). For instance, some studies building on previous stereotyping and contact research have reported an increase in aversion toward the hosts after the travel experience. These include Pearce (1980) on tourists’ perceptions of Moroccans after traveling to Morocco; Pizam, Jafari, and Milman (1991) on US students’ perceptions of the Soviet people before and after visiting the former USSR; Anastasopoulos (1992) in a study of a group of Greek tourists visiting Turkey; and also Laxson (1991) on upper-middle-class US tourists’ perceptions toward Native American culture after visiting museums and pueblo ceremonials in New Mexico. When specified as a Type II reflective first-order formative second-order construct, confirmatory analyses using a different sample supported the specified outer model and provided evidence of satisfactory fit indices on a two-level fit assessment. The reliability of ethnocentrism as a second-order composite was subsequently tested and confirmed.
Additionally, the study has reported the occurrence of a method effect within the scale’s factor structure, which is argued to be caused by the use of reverse-worded items. The findings, however, are not consistent with literature maintaining the assumption of unidimensionality of the GenE scale (e.g., Goldstein and Keller 2015; Pettijohn and Naples 2009). We identify two major reasons with regard to such discrepancies. The first reason relates to the scale’s length. We provided empirical justification by comparing the reliability coefficients of the 7-item multidimensional scale versus the initial 15-item and 22-item while using coefficient alpha on both data sets. A positive correlation was observed between the value of alpha and the number of items (see Table 8). This result supports previous findings suggesting that longer scales tend to inflate reliability regardless of whether they are homogeneous or not (Tavakol and Dennick 2011). We have observed a violation of the unidimensionality assumption when the 7-item multidimensional scale was submitted to reliability analysis using coefficient alpha with data set 1. This result concurs with previous findings which indicate that the presence of heterogeneous items on a scale could result in a major underestimation of reliability (Serbetar and Sedlar 2016; Tavakol and Dennick 2011). Thus, supporting the findings that alpha can serve as a confirmatory measure of a scale’s unidimensionality (Cortina 1993) and further highlighting the importance of reporting alpha at subscale levels when dealing with multidimensional constructs (R. J. Cohen and Swerdlik 2010). We nevertheless note that, when repeating the same process using data set 2, the value of alpha remained within an acceptable range. The inconsistency in results from both data sets highlights various accounts that multidimensional scales do not necessarily have lower alpha than unidimensional scales. These have subsequently called for a more rigorous view of alpha as it cannot simply be used as an index of internal consistency of a scale (Cortina 1993; Green and Thompson 2005). For the second reason, we note that the reliability results reported in this study originate from a South African context. This constitutes one of the few, if not the only report of the GenE scale’s reliability within an African setting. Thus, we base the second reason on fact that alpha is not a fixed property of a scale. This intends that reliability is a characteristic of the test scores, not of the test itself (Streiner 2003). The value of alpha would hence depend as much on the sample being tested as on the scale (Serbetar and Sedlar 2016). Consequently, we not only reiterate the influence that dissimilarity in cultural contexts may have on reliability results (Spector, Liu, and Sanchez 2015), but we also stress the need to assess consistency each time an instrument is used on a particular sample.
Implications of the Study
The study of ethnocentrism should be a topic of great importance in the study of tourist behavior. It is especially relevant in present times when intercultural relations are rapidly deteriorating over biases caused by political, economic, social, and cultural differences. This highlights the importance of viewing tourism as a cross-cultural consumption phenomenon, in which personality represents a determining factor of tourist motivation, perceptions, behavior, and decision making (Horner and Swarbrooke 2004). Also, it stresses the need to view tourist destinations from a multidimensional perspective. That is, not just as clusters of tourist facilities but also as culturally and racially diverse human habitats with the potential of generating social attractiveness or social aversion. This study identified and addressed a theoretical gap created by the overemphasized socioeconomic approach to ethnocentrism in consumer behavior literature since the mid-1980s. In that sense, this study contributes to the literature on tourist behavior and negative intergroup biases, by proposing a generalized approach to tourist ethnocentrism, through which personal prejudice and cultural biases can be hypothesized to affect human behavior toward tourist supply and experience elements. This contribution carries practical implications for both event organizers and destination management organizations (DMOs). In developing nations where tourism is often seen as an economic savior, hasty bids to host mega sports events necessitate consideration of the potential effects that cultural bias and personal prejudice may have on the expected outcome of the event. For instance, though the success of the 2010 FIFA World Cup was hailed as a triumph against Afro-pessimism, various initiatives to extend economic benefits to impoverished areas were short-lived (e.g., the government led township tourism project in the City of Tshwane). For DMOs, understanding biased attitudes that tourists may have toward local people and their cultures could help mitigate negative social and cultural impacts resulting from host–guest encounters, provide valuable insight on tourist demand across culturally and ethnically diverse regions, and thus shape future psychographic segmentation strategies.
In view of recent calls to further integrate elements of psychology in tourism research (Crouch 2013; Pearce and Packer 2013), the current study stands to make a contribution to the understanding of how sociopsychological factors influence behavior at various levels of the travel process. At the previsitation stage, the proposed construct can complement the current knowledge on destination image and the behavioral approach to decision making. In that sense, the construct may be applied to study undertourism by explaining and predicting travel patterns through the lens of the similarity-attraction theory (D. Byrne and Nelson 1965). The GATE also relates to the social identification theory through its in-group–out-group distinctions (Tafjel and Turner 1979). Hence at the visitation stage, the multidimensional nature of the GenE scale can be useful in explaining levels and types of interaction/participation between tourists–hosts and tourists–host culture. In the same lens, the GenE can also be integrated into the study of residents’ attitudes toward tourists and provide a timely contribution from a host’s perspective in the study of overtourism. Several studies have proven, under the contact hypothesis, that the interaction between culturally different groups may not necessarily lead to a good relationship (Allport 1979; Rasmi et al. 2014). Thus, at the postvisitation stage, the GenE can also serve as an additional means to investigate levels of satisfaction, future information search behavior, and the extent to which tourism can successfully contribute to peace and cultural understanding.
The GATE reflects elements of the P-O-X model of Heider’s (1946) Balance Theory. These are the perception of the self (P), perception of the other (O), and perception of the other’s culture (X). Given that the balance theory sets to explain how people develop relationships with other people and things in their environment, its application in tourism research through the GenE can contribute to the study of host–guest relationships and to the understanding of destination selection and rejection processes. For instance, tourists may feel a certain way toward a destination but not necessarily feel the same toward its locals. This implies that cultural distance and negative out-group biases such as tourist xenophobia (F. Kock, Josiassen, and Assaf 2019) can also be studied in relation to the GenE and its approach. Finally, studies have found that ethnocentrism can support high levels of cooperation (Hammond and Axelrod 2006). This implies that the GenE scale can be applied to the study of organizational behavior in tourism from either tourists, hosts, private sector, or government institutions’ perspectives. Hollinshead (1993) further points out that the tourism industry is itself grounded in ethnocentrism and that a large proportion of travel-trade planners and hospitality managers are themselves professional ethnocentrics, wittingly or unwittingly.
Beyond the primary contributions of this study, which allude to the GenE and its application to tourism research, we also note secondary contributions of empirical and methodological nature, extending beyond the field of Tourism. These essentially refer to the instruments and techniques imported from diverse fields to conduct this study. With particular importance to the field of intercultural communication, the current study has provided arguments against the long-standing unidimensionality assumption of the GenE scale. This does not only constitute the first documented account of the GenE scale’s multidimensional structure, but it also contributes to the burgeoning literature on the modeling and estimation of composite second-order constructs in PLS-SEM.
Study Limitations
A number of limitations of the current study need to be considered. The first limitation relates to the nature of the data. Data were collected in proximity to tertiary learning institutions, thus implying that the study sample mainly consisted of a student population. This can be observed through the age and level of education of most respondents. A general assumption with the use of student samples is the implied detachment from socioeconomic realities, often characterized by a lack of or limited financial resources and autonomy, low travel propensity, and low involvement in “real-life” decision making. These inherent conditions coupled with the use of convenience sampling may deem responses from such samples as unrealistic, thus severely impacting the generalizability of results. These limitations would have been critical if hypothesis tests were conducted in this study. We also note possible limitations to the generalizability of the results provided that age, level of education, and perhaps race have an effect on the response styles. In that sense, it would be of interest to see whether data obtained from different populations would result in a similar factor structure as in the current study.
The second limitation relates to the theory guiding the interpretation of the EFA results. EFA, as a statistical procedure, is aimed to assist the identification of factors. However, the interpretation of these factors should be guided by theory. Studies that have established the GenE scale as a unidimensional construct were conducted within the field of intercultural communication. In that field, the degree of distinction between out-group culture and out-group members may be less emphasized compared with the tourism field. Thus, based on the needs of this study, distinguishing between ethnocentric tendencies toward a destination’s culture and toward its local residents appears to be more consistent with tourism theory, and vital to the contribution of this study. For instance, the inseparability characteristic of tourism consumption entails cross-cultural and interpersonal experiences involving tourists (in-group members), local communities (out-group members), and the destination’s culture (out-group’s culture). These constitute bases from which ethnocentric tendencies are theorized to be expressed, within the scope of this study. Hence, the newly developed scale is specific to tourism research on ethnocentrism from the context of negative intergroup biases. Moreover, because of the current absence of reliability evidence from other cultural contexts, we remain cautious to claim that the newly developed instrument is universally applicable. Nevertheless, it should be noted that this instrument shares the same qualitative basis as the original GenE scale (Neuliep and McCroskey 1997), which in turn has been designed to measure ethnocentrism regardless of cultures. Hence, it could also be argued that the new instrument is not culture specific.
The final limitation refers to the application of the GenE scale in tourism research. As a construct that has originated away from the tourism field, the GenE scale has nonetheless been found to possess essential components for the study of tourism. However, ethnocentrism as a composite latent variable is by definition not fully formed by its causal indicators. This implies that the GenE scale, though proven reliable at first- and second-order levels, may still be supplemented by causes that have neither been discussed in prior literature nor revealed by exploratory research. Consequently, we encourage future research aimed at not only addressing these limitations but also extending the findings to different cultural contexts. These can include (1) assessing the reliability of the proposed seven-item GenE scale using different samples; (2) testing for discriminant validity between the TE scale and the seven-item GenE scale, and also between Tourist Xenophobia (TXO) and Personal Prejudice dimension; and (3) further adapting the scale to a tourism context by not only altering the item wordings but by also expanding the proposed measurement model in order to better understand tourist behavior.
Supplemental Material
JTR895128_-_supplemental_material – Supplemental material for A Generalized Approach to Tourist Ethnocentrism (GATE): Analysis of the GenE Scale for Application in Tourism Research
Supplemental material, JTR895128_-_supplemental_material for A Generalized Approach to Tourist Ethnocentrism (GATE): Analysis of the GenE Scale for Application in Tourism Research by Hermann Kimo Boukamba, Tatsuo Oi and Kaede Sano in Journal of Travel Research
Footnotes
Declaration of Conflicting Interests
The author(s) declared no potential conflicts of interest with respect to the research, authorship, and/or publication of this article.
Funding
The author(s) received no financial support for the research, authorship, and/or publication of this article.
Supplemental Material
Supplemental material for this article is available online.
Author Biographies
References
Supplementary Material
Please find the following supplemental material available below.
For Open Access articles published under a Creative Commons License, all supplemental material carries the same license as the article it is associated with.
For non-Open Access articles published, all supplemental material carries a non-exclusive license, and permission requests for re-use of supplemental material or any part of supplemental material shall be sent directly to the copyright owner as specified in the copyright notice associated with the article.