




Abstract
After having demonstrated the relationship between tourism and economic growth, tourism-led economic growth (TLGH), and economic-driven tourism growth (EDTG), the scientific literature was concerned with studying the relationship between tourism and economic development, limiting itself to analyzing a possible unidirectional relationship between tourism, economic growth, and economic development.
In this context, the aim of this article is to determine if the relationship between tourism and economic development is bidirectional given that, although tourism can be a tool for economic development, it is also true that a higher level of economic development influences tourism growth. Using a sample of 143 countries, and applying confirmatory factor analysis together with a structural equations model, the bidirectional relationship is confirmed.
Therefore, although tourism growth and economic development face different challenges, if public policies work in a coordinated manner, they may contribute significantly to improving economic development in countries that are configured as tourist destinations.
Introduction
From the economic point of view, tourism enjoys a growing interest, because it is considered as an activity with potential to boost economic growth as well as a tool to improve economic development in receiving countries (Cárdenas-García, Sánchez-Rivero, and Pulido-Fernández 2015).
Different countries have seen how tourism has become the main industry in terms of economic impact or generation of employment (Kim, Chen, and Jan 2006; Noriko and Mototsugu 2007; Tang and Tan 2018). In addition, this economic activity has allowed economic development to improve in many countries (Bojanic and Lo 2016; Li, Jin, and Shi 2018).
In this context, it is necessary to distinguish between tourism development, tourism growth, and economic development. Tourism development refers to the improvement of infrastructure, services, or conditions in a tourist destination that contribute to the increase of tourists. Tourism growth is understood to be the increase of goods and services in an economy, the increase in employment or the accumulation of capital as a result of tourism. The concept of economic development refers to the improvement in the level of well-being of the resident population (Pulido-Fernández and Sánchez-Rivero 2010).
Thus, there are numerous countries that during the last decades have decided to gamble on tourism as an instrument of economic growth and also as a tool that will increase economic development. This decision has been supported in many cases by international organizations and institutions, through financing of economic development projects linked to tourism (Carrillo-Hidalgo and Pulido-Fernández 2019; OECD 2010; UNCTAD 2011; UNWTO 2018).
However, a tourist destination needs to have certain characteristics (including accessibility, high levels of security, low pollution levels, and access to energy or Internet, among others) in order to increase tourism growth. These variables, in turn, determine the level of economic development of a territory (Cárdenas-García and Pulido-Fernández 2017; Chingarande and Saayman 2018).
Therefore, while it is true that tourism growth can be used as a tool for economic development, it is also true that a higher level of economic development in the destination can favor tourism growth. In this sense, the existence of a bidirectional relationship between both dimensions can be advocated.
However, this question has received little attention from the scientific literature, which has been busy broadly analyzing the unidirectional relationship between tourism and economic growth: (1) tourism-led economic growth (TLGH) and (2) economic-driven tourism growth (EDTG).
Therefore, the aim of this work is to analyze through an empirical study at the country level, using a broad sample of 143 countries, the bidirectional relationship between tourism growth and economic development, using quantitative information from these countries during the last 25 years (1993–2017).
The rest of the article is organized as follows: the next section reviews the literature on the subject under study as well as the development of hypotheses. Below this are the data used and the methodology applied in this work, then the results obtained are detailed and lastly the final conclusions of the article are given.
Literature Review
At the beginning of this century, the first work that analyzed the contribution of tourism to economic growth appeared: tourism-led economic growth (TLGH) (Balaguer and Cantavella-Jorda 2002). Since then, many works have been published that analyze the contribution of tourism to economic growth; works that have come to determine by a large majority that the expansion of tourism, in general, boosts economic growth in countries where that tourism takes place (Nunkoo et al. 2020). Fundamentally, the relationship between these variables occurs if these countries are in the process of development (Antonakakis et al. 2019; Shanshan-Lin, Yang, and Li 2019; Eyuboglu and Eyuboglu 2019).
However, there are other works, although fewer, grouped under the economic-driven tourism growth (EDTG) hypothesis that conclude, when analyzing the relationship between tourism and economic growth, that it is the expansion of tourism activity that is positively influenced by the evolution of the economic cycle (Antonakakis, Dragouni, and Filis 2015; Dragouni, Filis, and Antonakakis 2013; Payne and Mervar 2010; Tang 2011). So that those economies that have a higher level of investment, stability of price levels, or lower level of unemployment have greater guarantees that expansion of tourism will occur (Rivera 2017; Sokhanvar, Çiftçioğlu, and Javid 2018; Wu and Wu 2018).
In addition, a third stream of studies has determined that there is a bidirectional causality between the expansion of tourism and economic growth in countries where that tourism takes place (Apergis and Payne 2012; Ridderstaat, Croes, and Nijkamp 2013; Hussain-Shahzad et al. 2017; Kim, Chen, and Jan 2006). This is a bidirectional relationship of dependence that occurs with greater intensity in those countries with the highest level of economic development (Antonakakis et al. 2019; Bojanic and Lo 2016; Chingarande and Saayman 2018; Tang and Tan 2018).
However, in all of these three currents, as well as in those other works that determine that there is no relationship between the expansion of tourism and economic growth (Katircioglu 2009; Po and Huang 2008), the relationship between tourism growth and economic growth is analyzed exclusively. In fact, although many of these works misuse the concept of economic development, the variable that they are really analyzing, together with the expansion of tourism, is simply the growth of the economy.
However, as a measure of approximation to tourism growth, the variation in tourism GDP is not the only variable that is used (Brida et al. 2013; Brida, Cortes-Jimenez, and Pulinac 2016). Indeed, as Lütkepohl (1982) demonstrates, the inclusion in the model of other variables in addition to tourism GDP allows us to obtain more precise estimates, so that following this line, a large number of articles propose multivariate analyses in which economic indicators are used in addition to tourism GDP as a measure of tourism growth:
- Cortés-Jiménez and Pulina (2010) or Durbarry (2004), among others, use physical capital and human capital as additional indicators of tourism growth.
- Kadir and Jusoff (2010) or Narayan et al. (2010), among others, use international tourism exports as additional indicators of tourism growth.
- Akinboade and Braimoh (2010) or Jackman and Lorde (2010), among others, use domestic tourism expenditure as additional indicators of tourism growth.
At this point, it is necessary to remember that economic growth and economic development do not refer to the same concept. Economic growth is related to an increase in the size of the economy of a country or region, whereas economic development is a broader concept that involves meeting the needs and demands of the resident population and improving their standard of living (Ranis, Stewart, and Ramírez 2000). Therefore, both concepts are related, given that economic growth must be configured as an intermediate aim that will achieve the ultimate goal of economic development (Cárdenas-García, Sánchez-Rivero, and Pulido-Fernández 2015).
Thus, for those countries that have decided to commit to the expansion of tourism, the most important thing is not that this activity simply contributes to greater economic growth, but that this economic growth driven by tourism is translated, finally, into an improvement in the economic condition in the country where the tourism takes place (Croes 2012; Cárdenas-García and Pulido-Fernández 2017).
Under this perspective of analysis, although the scientific literature is more limited regarding the publication of articles that relate tourism and economic development variables, various works have approximated the possible effects that the expansion of tourism may produce at the level of economic development (Cárdenas-García, Sánchez-Rivero, and Pulido-Fernández 2015; Kim, Chen, and Jan 2006; Meyer and Meyer 2016; Sokhanvar, Çiftçioğlu, and Javid 2018).
It has become clear that the expansion of tourism influences the economic growth (TLGH) of most of the countries analyzed and, more importantly, that this economic growth has translated into an improvement in the living conditions of the resident population (Li, Jin, and Shi 2018). This relationship generally only occurs in more developed countries (Bojanic and Lo 2016), since most studies on tourism and economic development that have been carried out on developing countries show the difficulty of transforming growth into economic development (Cárdenas-García, Sánchez-Rivero, and Pulido-Fernández 2015). However, some less developed countries have taken advantage of tourism growth to improve economic development, for example, various island countries (Bojanic and Lo 2016; Fahimi et al. 2018; Gooroochurn and Blake 2005).
In addition, the contribution of tourism to economic development is not simply limited to improving large macroeconomic figures at the country level, but that this economic activity has also been demonstrated to diversify and revitalize local economies by, among other things, generating income, and creating jobs and business opportunities in both developed and developing territories (Meyer and Meyer 2016; Rogerson 2015).
It should be noted, however, in those cases in which the expansion of tourism is finally translated into an improvement in economic development, that this connection does not occur automatically but that it depends on the fact that practically all income obtained through tourism goes to public policies that support economic development (Croes 2012). Indeed, for tourism to contribute to reducing poverty, external factors such as infrastructure, labor, capital, technology, or the environment are key to the efficiency of tourism in improving development (Li, Jin, and Shi 2018).
On the other hand, in those cases in which the expansion of tourism is a consequence of the country’s economic growth (EDTG), the relationship between tourism and economic development is different. The economic cycle determines the expansion of tourism, but this activity does not improve the economic development of those regions, but rather it is economic development that determines the further expansion of tourism activity (Rivera 2017).
In addition to this possible unidirectional relationship between tourism, economic growth, and economic development, it is of undoubted interest if economic development influences, in turn, the expansion of tourism. Indeed, on the one hand, for a country to be configured as a tourist destination, it needs to have certain characteristics (a certain level of security, accessibility, and provision of energy), and on the other hand, these same characteristics determine, together with other factors, economic development at the country level (Chingarande and Saayman 2018).
Of the few existing works in the scientific literature that analyze this bidirectional relationship between tourism and economic development, the one undertaken by Fahimi et al. (2018), in which the relationship between tourism and economic capital is analyzed in 10 micro-island states, concludes that the development of economic capital is induced by tourism and the expansion of tourism is induced, in turn, by the level of economic capital. Although this work is partial because of the characteristics of the chosen sample and its meager composition, as well as because of the study of only one variable of all those that determine economic development, it does show an interest in an issue that had not yet been addressed by the scientific literature responsible for analyzing the relationship between tourism and the economy.
The present work, following this current of analysis of the bidirectional relationship between tourism growth and economic development, tries to overcome this limitation. It undertakes an empirical study with a large sample of countries and a broad time frame that determines the possible relationships that can occur between tourism growth and economic development. It further analyzes, in line with contributions by other authors (Croes 2012; Li, Jin, and Shi 2018), whether the influence of tourism growth on economic development, and vice versa, occurs automatically or whether it depends on the existence of other external factors.
After this review of the literature, the research questions established in this study are:
Does the expansion of tourism activity improve the level of economic development in the countries where tourism takes place?
Does the level of economic development in these countries, in turn, condition the expansion of tourism activity within their territory?
Are there any key factors that determine the bidirectional relationship between tourism and economic development?
Methodology
The present research, from the economic point of view, has a broader aim than the simple analysis of the relationship between tourism and economic growth. This article tries to determine if the relationship between tourism and economic development is bidirectional, as well as the factors that favor or hinder this relationship. After presenting the aim of the research, a series of previous considerations is given concerning the work carried out, the data used is detailed, and the statistical model that has been applied is specified.
Previous Considerations
The majority of existing works in the scientific literature that have analyzed the relationship between tourism and economic growth, both tourism-led economic growth (TLGH) and economic-driven tourism growth (EDTG), have been carried out by applying an analysis at the country level, since generally the expansion of the tourism activity has influenced, or has been influenced by the macroeconomic figures at the country level.
Therefore, it seems reasonable that the design of an empirical study that aims to establish the relationship between tourism and economic development, determining in addition if this relationship is bidirectional between both dimensions, uses this same approach at the country level, discarding other, more partial approaches that analyze impact studies for a destination or region in particular.
This article tries to determine if the relationship between tourism growth and economic development is bidirectional, as well as identify the factors that favor or hinder this relationship. Therefore, it is necessary to measure three specific dimensions that are composed, in turn, of multiple variables: tourism growth, economic development, and determinant factors.
Data Collection and Period Analyzed
First, for the measurement of tourism growth, existing information has been used from the Global Economic Contribution of Travel and Tourism database, which is prepared by the World Travel and Tourism Council (WTTC) and its research partner Oxford Economics. This database is used to measure the economic growth of tourism in more than 185 countries, quantifying its main economic impacts since 1988, which allows for the homogeneous comparison of said data at the country level (WTTC 2018). For measuring tourism growth, following Cárdenas-García, Sánchez-Rivero, and Pulido-Fernández (2015), a total of six variables from this source of information have been used (Table 1).
Variables of Tourism Growth.
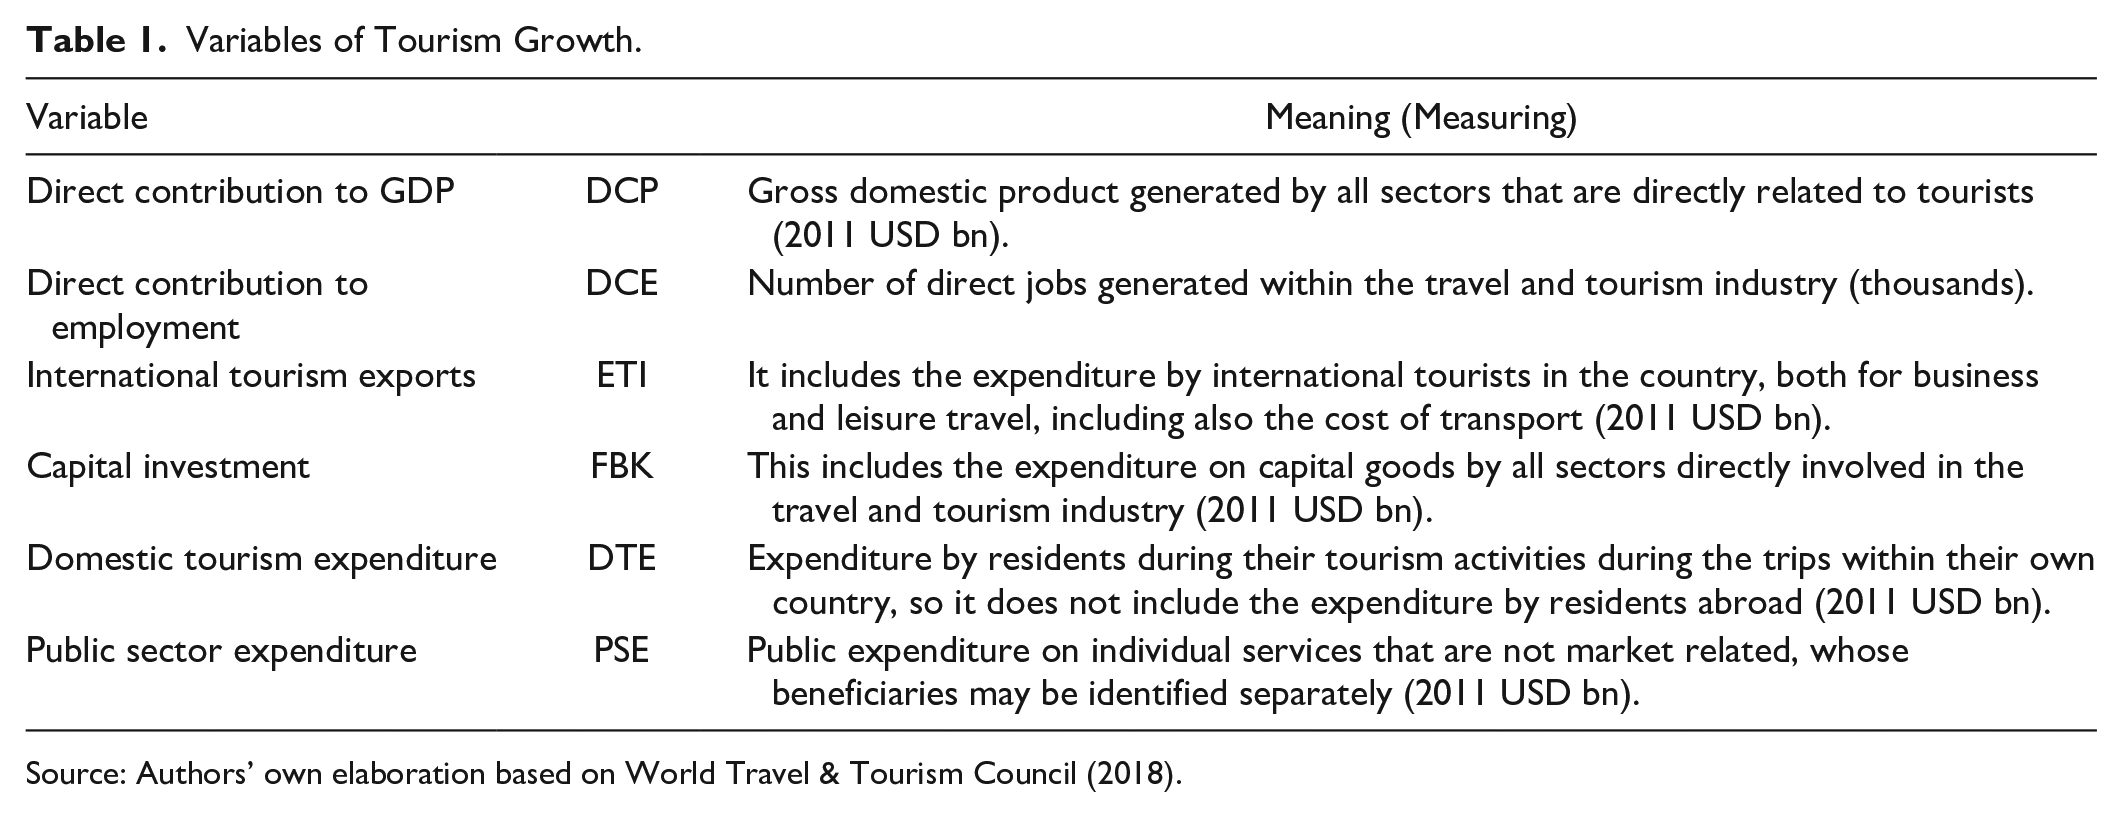
Source: Authors’ own elaboration based on World Travel & Tourism Council (2018).
Second, data from the Human Development Report prepared by the United Nations Development Program (UNDP) has been used for the quantification of economic development. This report was published for the first time in 1990, with the aim of measuring wider-ranging variables than those linked exclusively to the economic cycle, which implies evaluating variables related to the welfare and development of the population (UNDP 2018). In the same way as Cárdenas-García, Sánchez-Rivero, and Pulido-Fernández (2015), a total of nine variables from this source of information were used for the measurement of economic development (Table 2). As such, both the Human Development Index (HDI) and the individual variables used to construct said index are included, since the HDI has a strong correlation with these variables and therefore can be considered a proxy variable of economic development.
Variables of Economic Development.
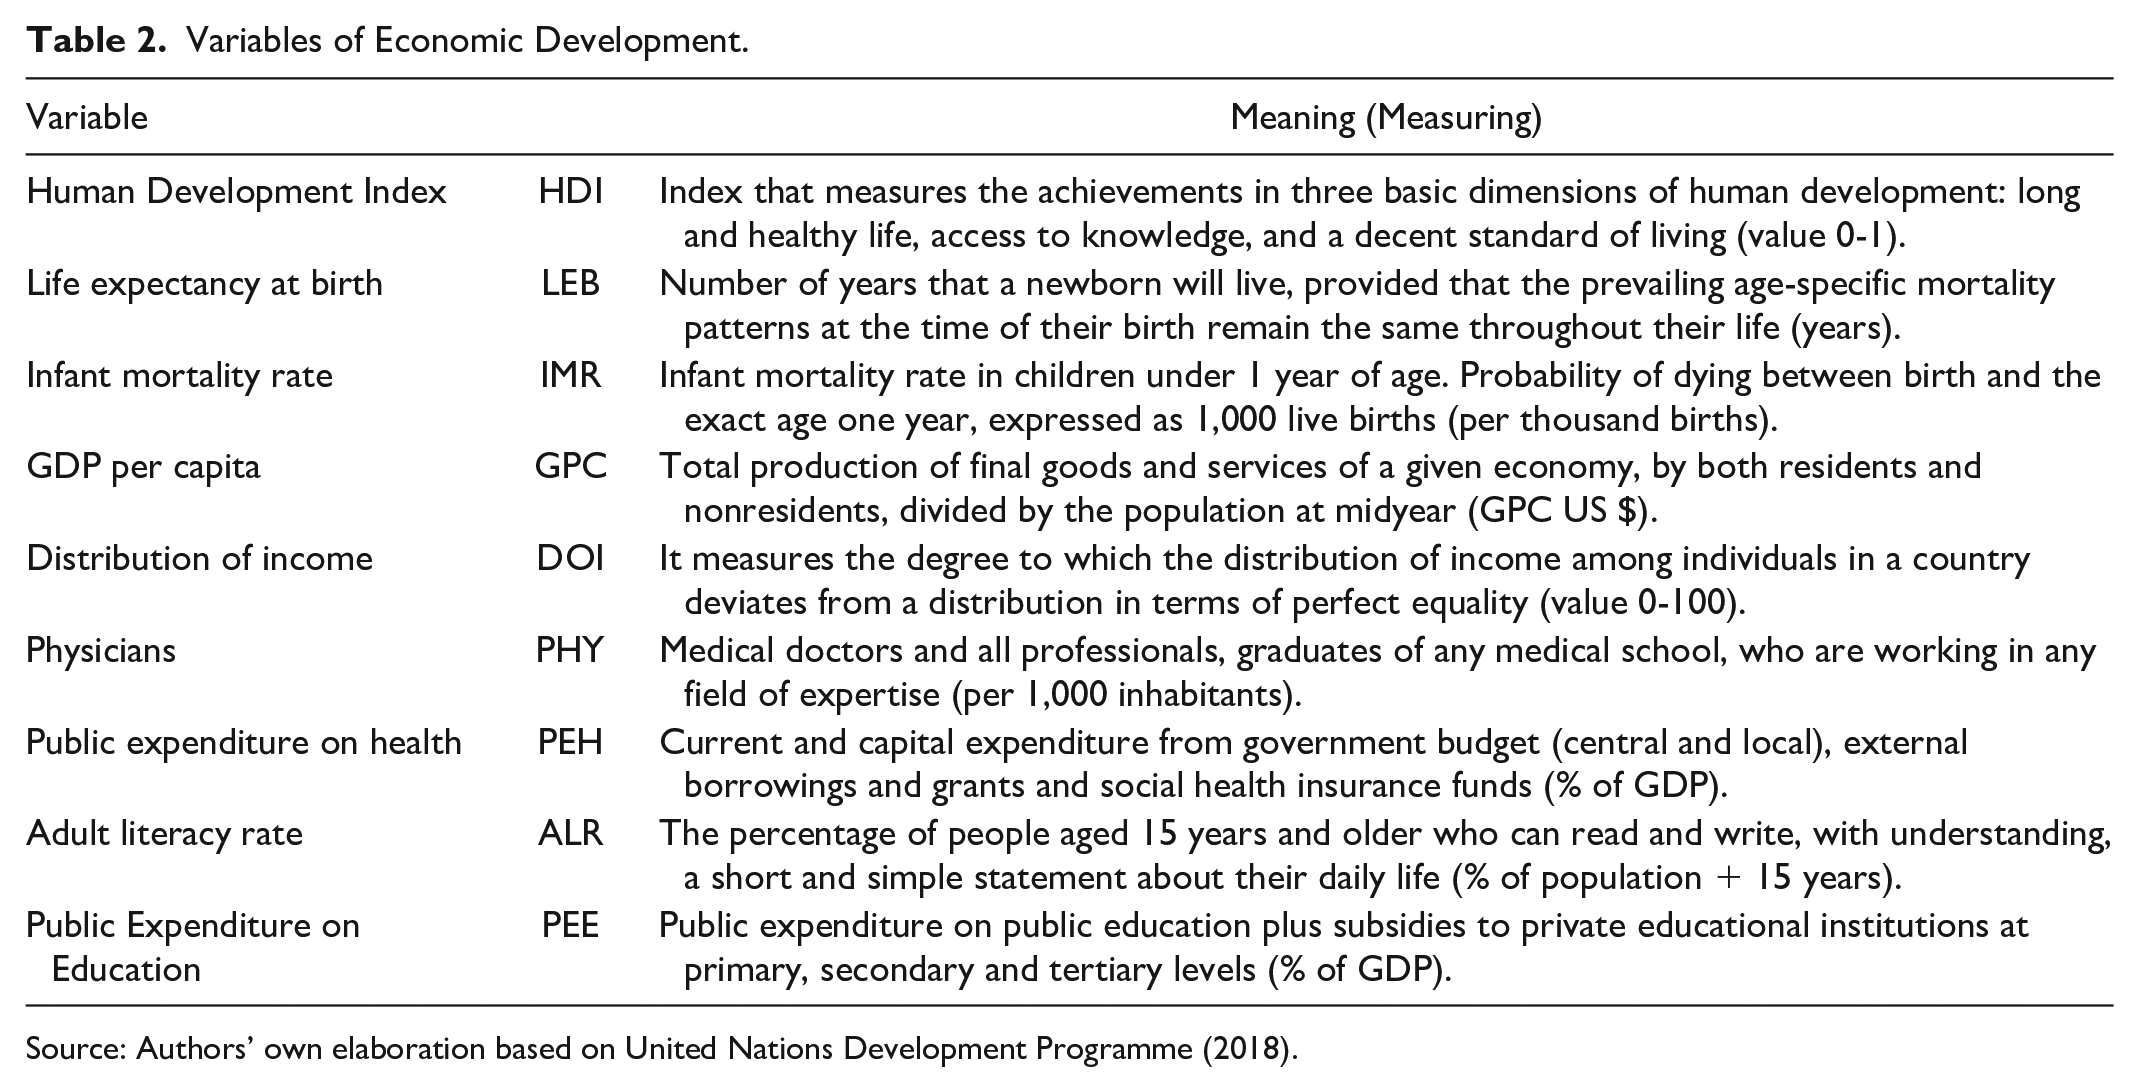
Source: Authors’ own elaboration based on United Nations Development Programme (2018).
Thirdly, regarding factors that can influence the bidirectional relationship between tourism and economic development, variables have been used that have been analyzed previously in other research studies (Cárdenas-García 2012; Cárdenas-García and Pulido-Fernández 2014; Cárdenas-García and Sánchez-Rivero 2015; Pulido-Fernández, Cárdenas-García, and Villanueva-Álvaro 2013; Sánchez-Rivero and Cárdenas-García 2014) and that have been shown to be able to influence the unidirectional relationship between tourism, economic growth, and economic development.
Thus, it is reasonable to use these same factors. That is to say, if these factors influence the unidirectional relationship between tourism growth and economic development, they may also have predictive capacity in a possible bidirectional relationship.
All these factors have in common that they come from the World Development Indicators database, provided by the World Bank, which offers information on factors that affect development: geographical characteristics and provision of infrastructure, characteristics of the population and access to the labor market, generation of foreign exchange and tax collection capacity, investment climate, and the environmental dimension of sustainability (World Bank 2018).
There are enough theoretical and logical arguments to support the consideration of the impact of these 62 factors, spurring on or holding back the relationship between tourism growth and economic development. The aim of this article is not to explore further the debate surrounding these theoretical and logical arguments, which have already been discussed in the literature reviewed during this research. However, a more detailed explanation can be found in each of these individual works (Table 3).
Determinant Factors.
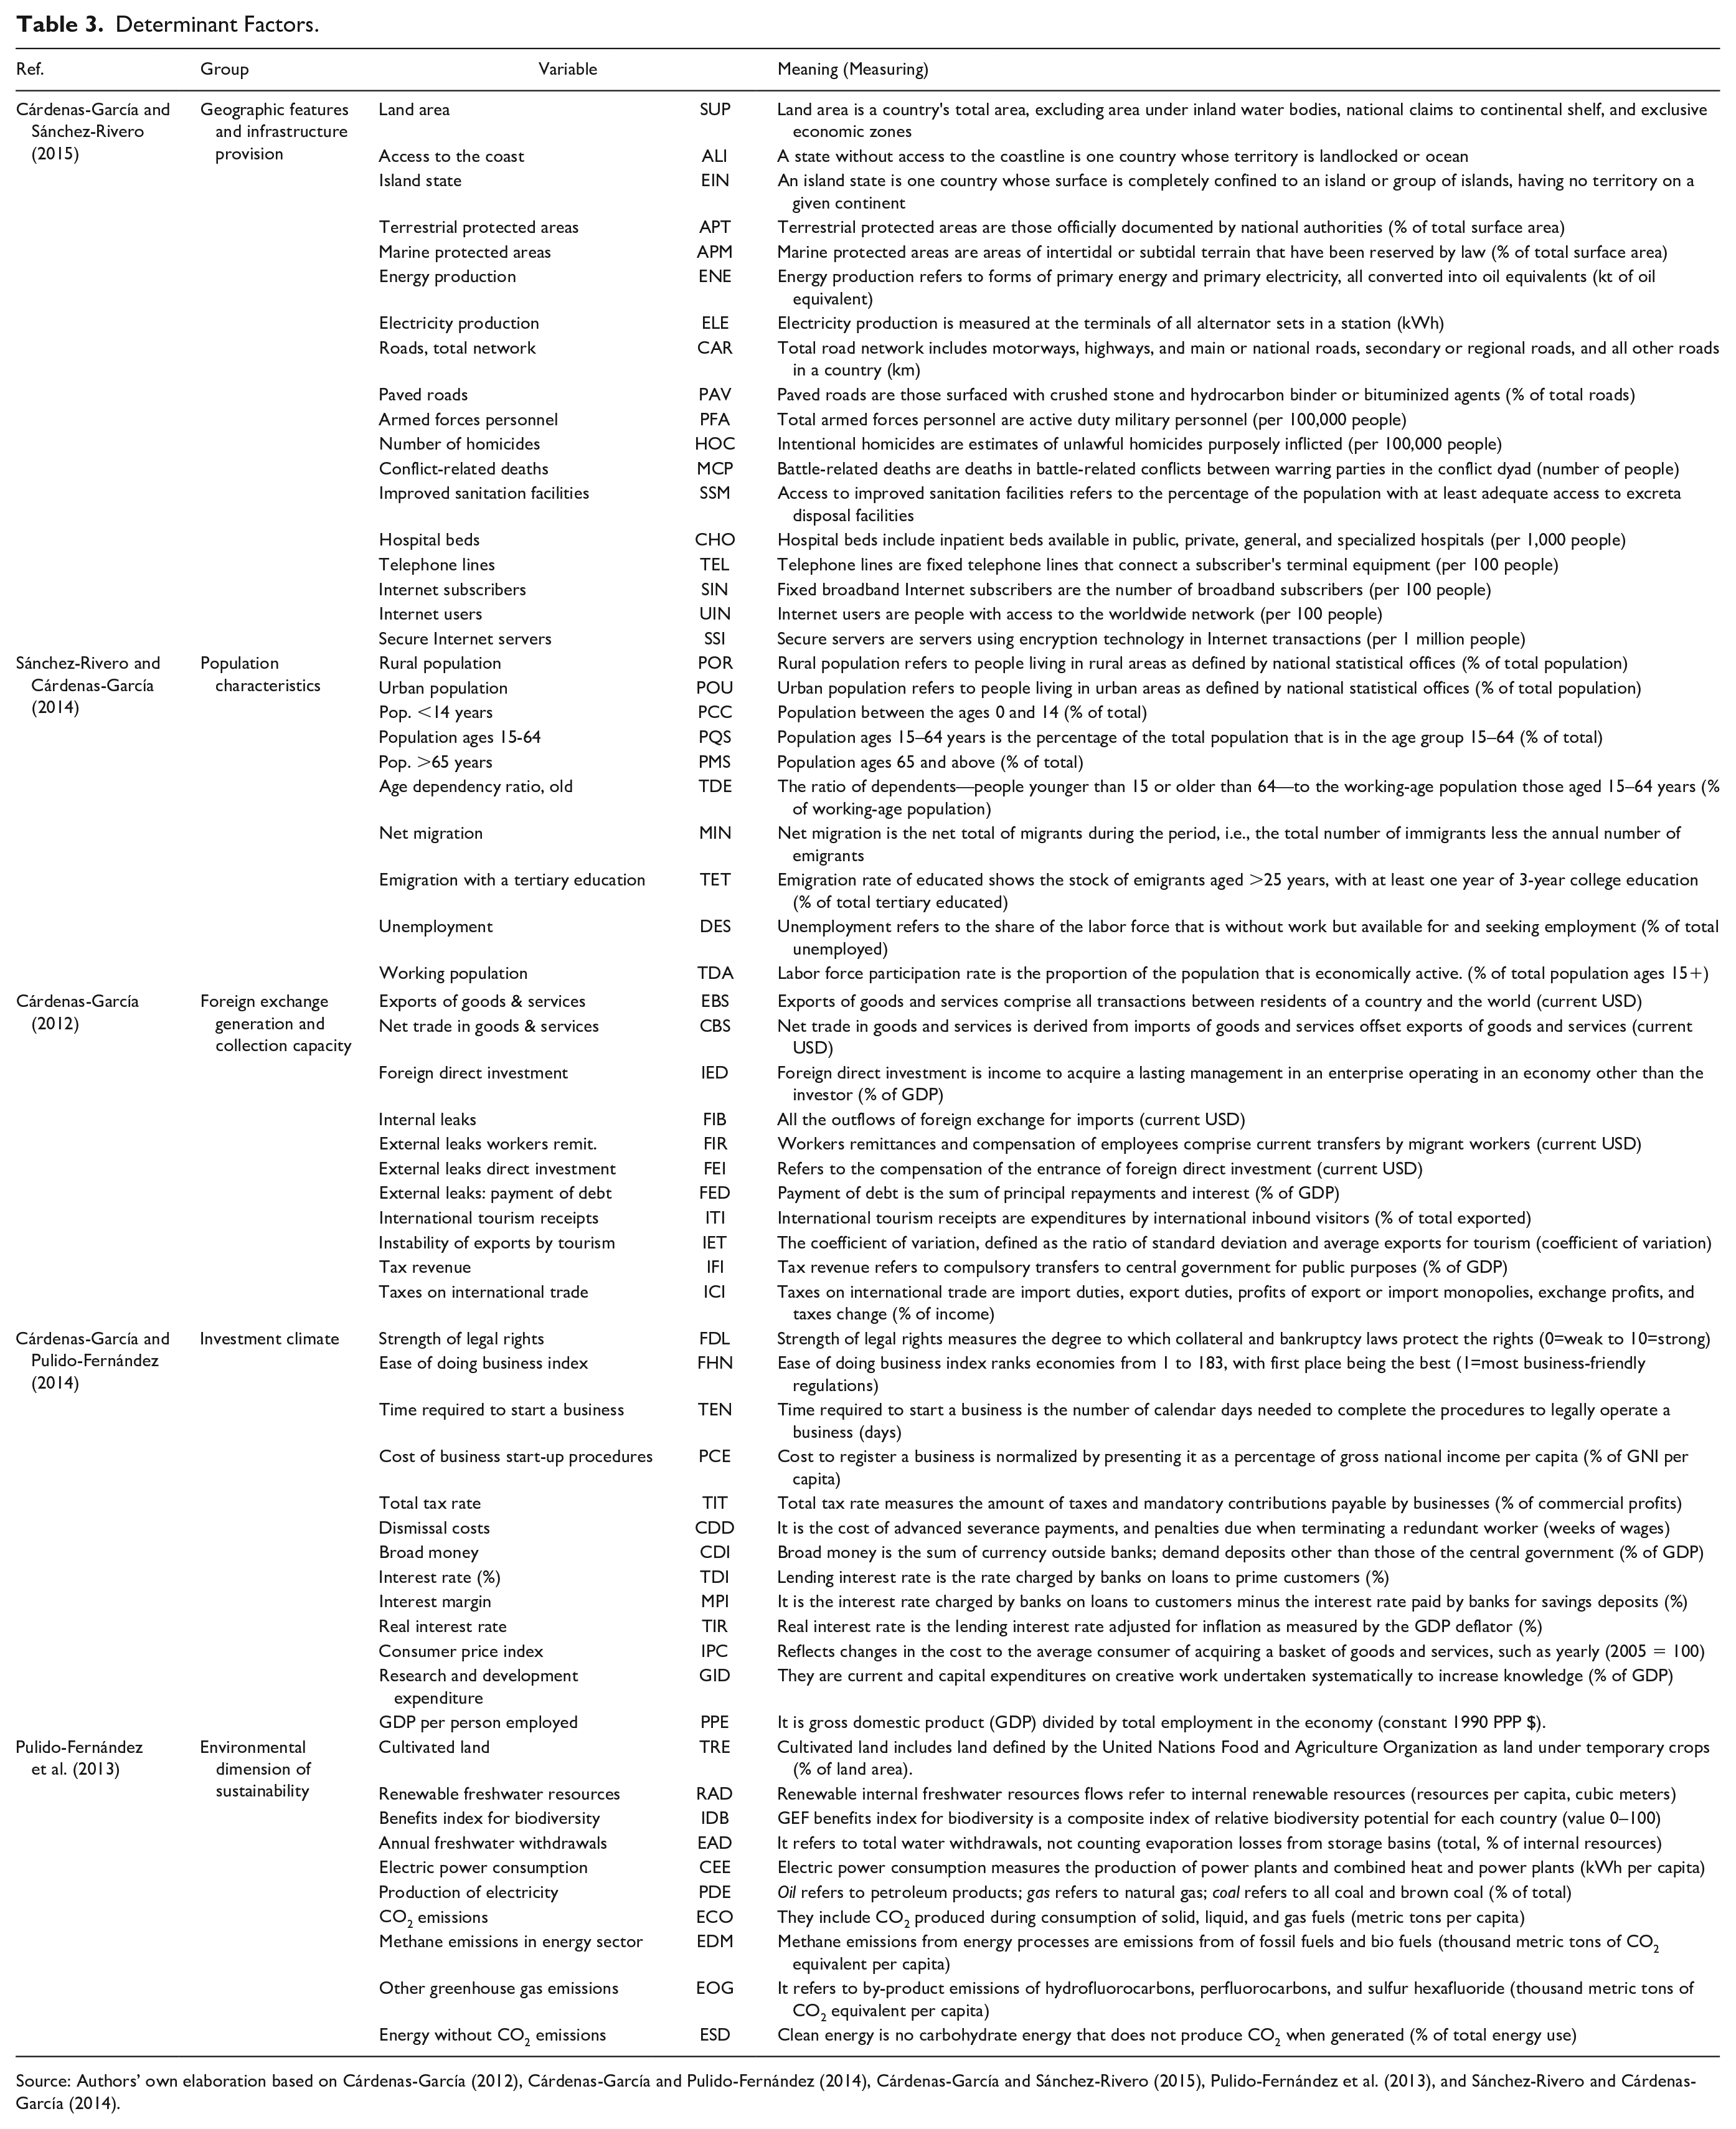
Source: Authors’ own elaboration based on Cárdenas-García (2012), Cárdenas-García and Pulido-Fernández (2014), Cárdenas-García and Sánchez-Rivero (2015), Pulido-Fernández et al. (2013), and Sánchez-Rivero and Cárdenas-García (2014).
It should be noted that any limitations that these three databases may have are minor in comparison with the information that can possibly be obtained from other alternative reports, which would not be homogeneous. In addition, if another data source were used, the number of countries with available data would be significantly lower.
Finally, with regard to the time frame analyzed, the aim is to carry out as wide a temporal analysis as possible, which allows the long-term causal relationships between tourism and economic development to be measured. Thus, according to the temporal restriction on the data, there was information available from the beginning of the nineties to the fiscal year 2017 from the three databases that were used.
Therefore, the only criterion for a country to be included in the sample analyzed is to have information available in the three databases used and during the entire period analyzed (1993–2017), resulting in a total of 143 countries that meet this criterion. Although there are currently a greater number of countries analyzed in the different databases used, their incorporation has been carried out gradually, so they were not available for the entire period analyzed. No specific pattern was found in the missing data of these countries (MCAR = missing completely at random).
Applied Methodology
In accordance with the aim of this article, which seeks to determine if the relationship between tourism and economic development is bidirectional, and taking into account that both dimensions are quantified, in turn, through different individual variables, a preliminary treatment of the data was first carried out.
Thus, the scores of the six standardized tourism growth indicators (Table 1) were obtained for each of the countries, in order to homogenize the values and normalize the analysis data.
Likewise, the nine economic development variables (Table 2) were treated with the aim of achieving homogenization and normalization of the data.
It should be emphasized that the variables have been standardized to normalize the data, instead of performing other types of transformations. In this regard, other types of transformations such as log transformations were considered. However, no better improvement in model fit was found when those other transformations were applied. In addition, no better transformation would make the interpretation of the coefficients and the results from the model easier. Thus, we have chosen the most appropriate transformation from an interpretation point of view that normalized the data and at the same time provided an appropriate goodness of fit of the statistical model and distribution assumptions that were made when modeling the data.
After this previous treatment, confirmatory factor analysis was initially applied (Brown 2015) to validate the inclusion and creation of both the tourism growth dimension and the economic development dimension, based on the aforementioned indicators. The reliability and internal consistency of both the tourism growth construct and the economic development construct were checked using the value of Cronbach’s alpha.
Second, predictive clustering models (specifically descriptive grouping models using linear regression as a technique applicable to said model; Espino 2017) were applied to the annual values of the tourism growth scores, with the purpose of classifying countries into groups because of similarities in their tourism expansion trends during the period analyzed. In the same way, this same statistical analysis was applied to the annual values of the economic development scores, with the purpose of classifying the countries into groups by similarities in their economic development trends during the time frame analyzed. The groups of countries formed were characterized, along with the association of tourism growth and economic development of the clusters obtained.
Third and final, mixed models (Kline 2010) with random effects by year and country were used to study the association of tourism growth according to economic development and vice versa. The aim was to subsequently build a multivariate model that analyzes the association of both tourism and economic development with the five groups of factors previously identified by the scientific literature (Table 3)—geographic features and infrastructure provision, population characteristics, foreign exchange generation and collection capacity, investment climate, and environmental dimension of sustainability, adjusted by the type of country analyzed.
From each of these blocks, the evolution over time of the 62 indicators (with their respective standardized values) was considered to be under study.
Specifically, mixed linear regression models were used (Little 2013) and applied to the response variable of the development score over the years, considering the random effect for the country identifier (intracountry adjustment—positioning adjustment) and the random effect due to the year (intrayear adjustment—adjustment of the slope that explains the development trend over time). Likewise, a hierarchical system was applied, because of the differences of countries according to the cluster, allowing the type of country to be taken into account according to the cluster to which it belongs (adjusting for the heterogeneity between clusters). The process for the selection of variables used in the multivariate modeling was a combination of the forward and backward stepwise selection procedure (manual by block), based on the results of the p-value statistical tests and the goodness-of-fit criteria. It should be indicated that during the entire process any possibly confusing variables were evaluated, and that models were studied in parallel, in case of loss of information or high correlation between indicators, to finally obtain the model that best fits the data and be able to conclude with the most relevant variables associated with the economic growth of the countries. Likewise, the factors significantly and directly associated with economic development were evaluated in the multivariate analysis.
Although there are different methods of statistical modeling, depending on the objective of the analysis and the characteristics of the variables to be analyzed, structural equation model (SEM) is an appropriate one to perform the analysis and address the objectives of the study: in the first part, there are multiple variables that theoretically define a dimension over the years, so the construction of the dimension and the load of each variable that impacts the latent dimension should be confirmed and, in the second part, a score is created for each dimension and mixed longitudinal regression models are applied to analyze the association of factors to each dimension (Blunch 2008; Iacobucci 2009; Schumacker and Lomax 2004).
In addition, since the appearance of SEM in 1999, this econometric model has been used increasingly in research on different aspects of tourism, as evidenced by Nunkoo, Ramkissoon, and Gursoy (2013), in which they describe the main advantages of using SEM with respect to other methodologies, including the case in which economic variables related to tourism are analyzed.
The specification of the model is based on a graphical representation, in which, by the use of different signs, the hypothetical statistical relationships between the observed variables and the latent variables are formulated. This diagram of causal relationships between observed variables and latent variables can also be expressed through a system of simultaneous equations, or can be summarized in a matrix expression.
Finally, we proceeded to analyze the set of variables and indicators proposed in the theoretical diagram (Figure 1).

Theoretical diagram of research.
The econometric models were implemented using the R software (Rosseel 2012). The mclust package in R was used to perform the country classification. SPSS software was used to describe the data and to perform multivariate statistical testing using bootstrap methods. Statistical tests were performed at a two-side 5% significance level.
Results and Discussion
Validation of the Indicators of Tourism Growth and Economic Development
First, in order to validate the construction of the indicators used to measure both the tourism growth and the economic development during the period 1993–2017, tests for reliability and internal consistency of both constructs were carried out and the results of the corresponding confirmatory models were obtained.
The value of Cronbach’s alpha in the evolution of the six tourism growth indicators was 0.942, varying between 0.936 and 0.950, depending on the year under consideration. These values indicate an excellent internal consistency between the indicators considered for forming the tourism growth scale. In turn, the adjusted structural confirmatory models adequately explain the size of the tourism growth scale, with measures of standardized root mean square residual (SRMR) goodness of fit less than 0.05 throughout the period analyzed, with the values varying, according to the year analyzed, between 0.012 and 0.042. Likewise, the comparative fit index (CFI) values varied between 0.90 and 0.98, being in all cases greater than 0.80, the limit from which a value is considered appropriate (Lara-Hormigo 2014). The root mean square error (RMSE) values vary between 0.11 and 0.20.
In Table 4, the values of the standardized parameters for each of the years analyzed are shown; from these, tourism growth scores were formed based on the six indicators specified.
Standardized Parameters for the Tourism Growth Dimension.
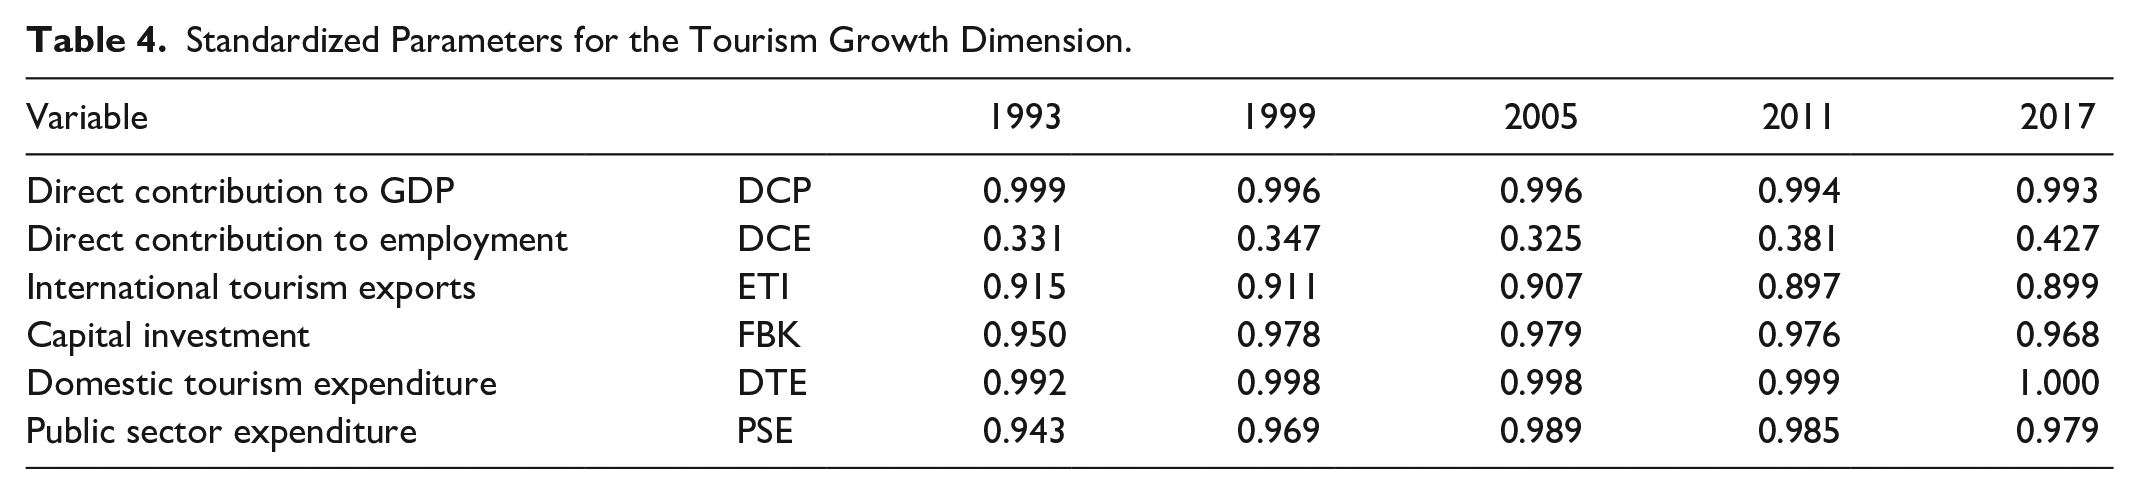
Although the econometric model has been applied to all longitudinal data for the 1993–2017 period to take into account intrayear variability, for presentation purposes a summary of the data is shown in a cross-sectional manner, with five cross-sections at intervals of six years.
After this process, it was concluded that practically all the indicators considered have a strong association with the growth of tourism throughout the period analyzed, with only the direct contribution to employment indicator obtaining a lower association with the tourism growth dimension, although its direct association increased during the time frame analyzed.
With regard to economic development, the value of Cronbach’s alpha during the evolution of its nine indicators was 0.609, varying between 0.565 and 0.614. Depending on the year under consideration, these values indicate a good internal consistency between the indicators considered for forming the economic development scale. In turn, the adjusted structural confirmatory models adequately explain the economic development scale, with measures of SRMR goodness of fit less than 0.08 throughout the period analyzed, with the values varying, according to the year analyzed, between 0.060 and 0.076. Likewise, the CFI values varied between 0.83 and 0.94; although values lower than 0.9 were found, these values are not excessively low, and were therefore considered appropriate (Salcines and Fernandez 2016; Tomás, Rodrigo, and Oliver 2005). The RMSE values vary between 0.08 and 0.18.
In Table 5, the standardized parameters obtained through the corresponding model are shown, which serve as the basis for the creation of the economic development scores based on the nine indicators specified. In this case, as with tourism growth, a summary of the data is shown in a cross-sectional manner, with five cross-sections at six-year intervals.
Standardized Parameters for the Economic Development Dimension.
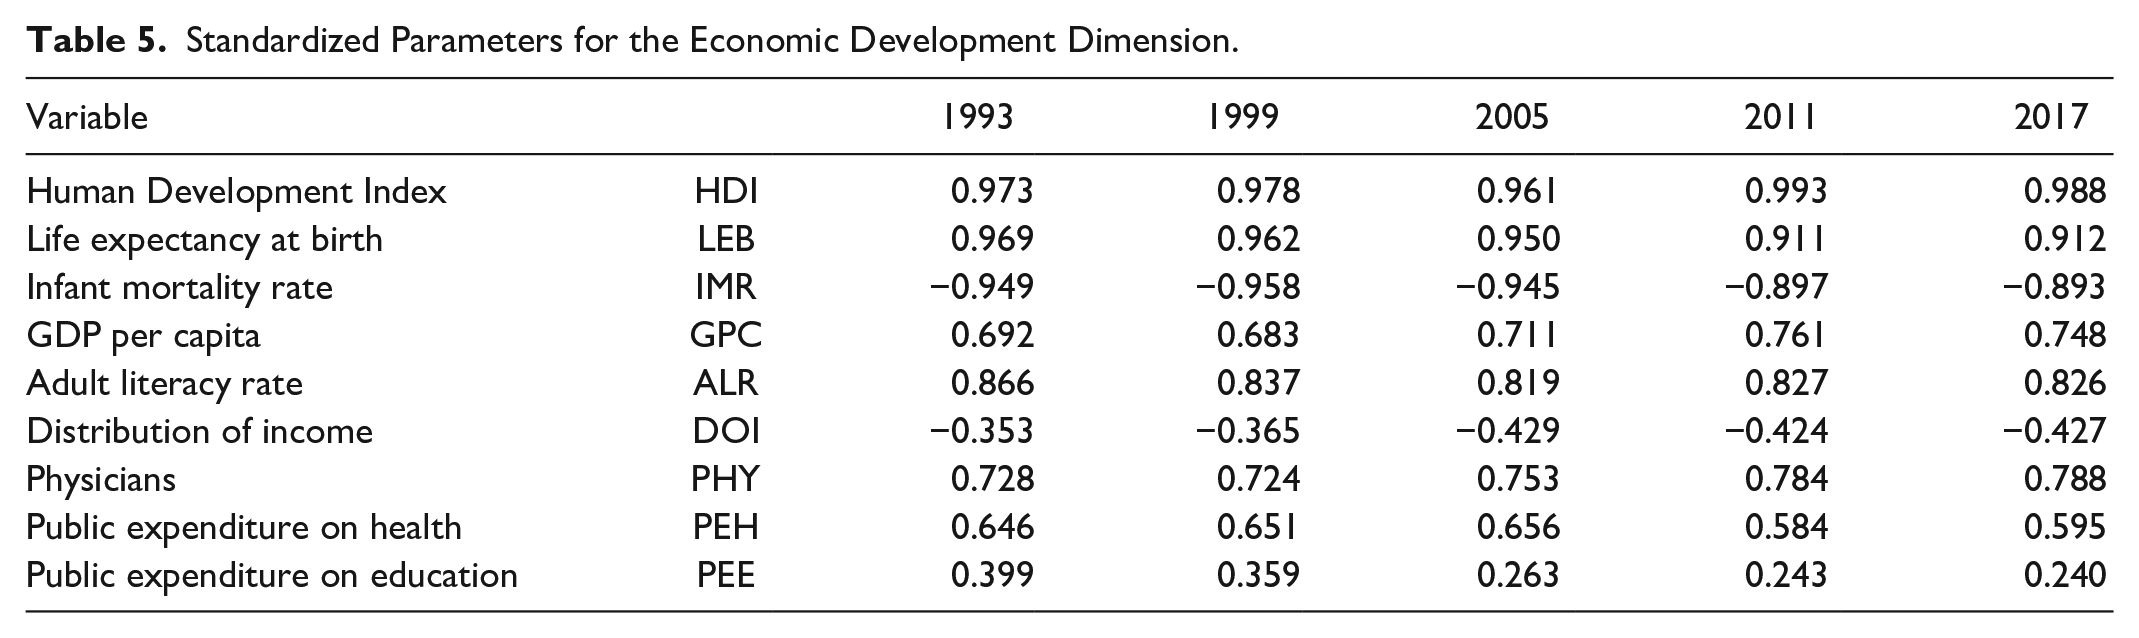
After this process, it was found that the indicators with a high association with economic development during the analyzed period were, directly, Human Development Index, life expectancy at birth, and adult literacy rate, and inversely, infant mortality rate (since this indicator has an inverse relationship with economic development; i.e., the higher this value, the less economic development and vice versa). Those indicators having an average association with economic development were, directly, GDP per capita and physicians and, inversely, distribution of income.
Finally, although in both the case of tourism growth and economic development, the RMSE values obtained are higher than 0.05 (ranging from 0.08 to 0.20), in cases of analysis of samples with low degrees of freedom and sample size less than 200 subjects, as in the present analysis, the formation of the economic growth and economic development constructs is considered valid (Kenny, Kaniskan, and McCoach 2015).
Classification of Countries According to Their Level of Tourism Growth and Economic Development
Next, we proceeded to characterize the 143 countries analyzed as well as to analyze the association of tourism growth with the level of economic development of the different clusters formed.
Cluster techniques are well-established and rigorous statistical methods to cluster subjects or objects that are based on mathematical distances between the variables. This is a more robust method from a mathematical point of view that allows simple categorizations based on cut-off point values of those variables from which we did not have any methodological justification and no rigorous procedure (Anderberg 2014).
The classification obtained through the predictive cluster models applied to tourism growth and economic development is shown in Table 6. There is a significant association of dependence between tourism growth and economic development, given that the distribution of countries according to their classification for tourism growth and economic development was not homogeneous. It does show that part of the tourism growth is linked to economic development and vice versa; however, there is also a part of tourism growth that is not explained by economic development and vice versa.
Distribution of Countries According to Tourism Growth and Economic Development.
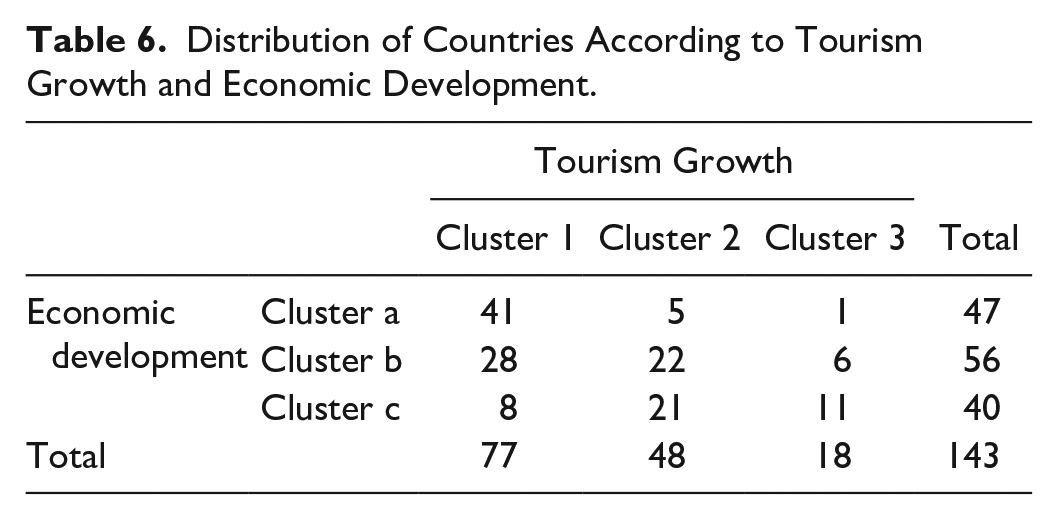
Therefore, the direct association between the classification of countries according to tourism growth and economic development was found to be significant, and there was also a dependence on the distribution of countries in the classification clusters (the associated statistical test, showing the dependency ratio between economic and tourism classification; chi-square (4) = 41.881, p < 0.001).
Then, the clusters were characterized, according to the average scores obtained for tourism growth and economic development. The standardized average scores for each year analyzed and each indicator used were obtained, both in the tourism growth dimension and in the economic development dimension. The average values show the degree of tourism growth and economic development of the combination of countries classified in each of the groups obtained.
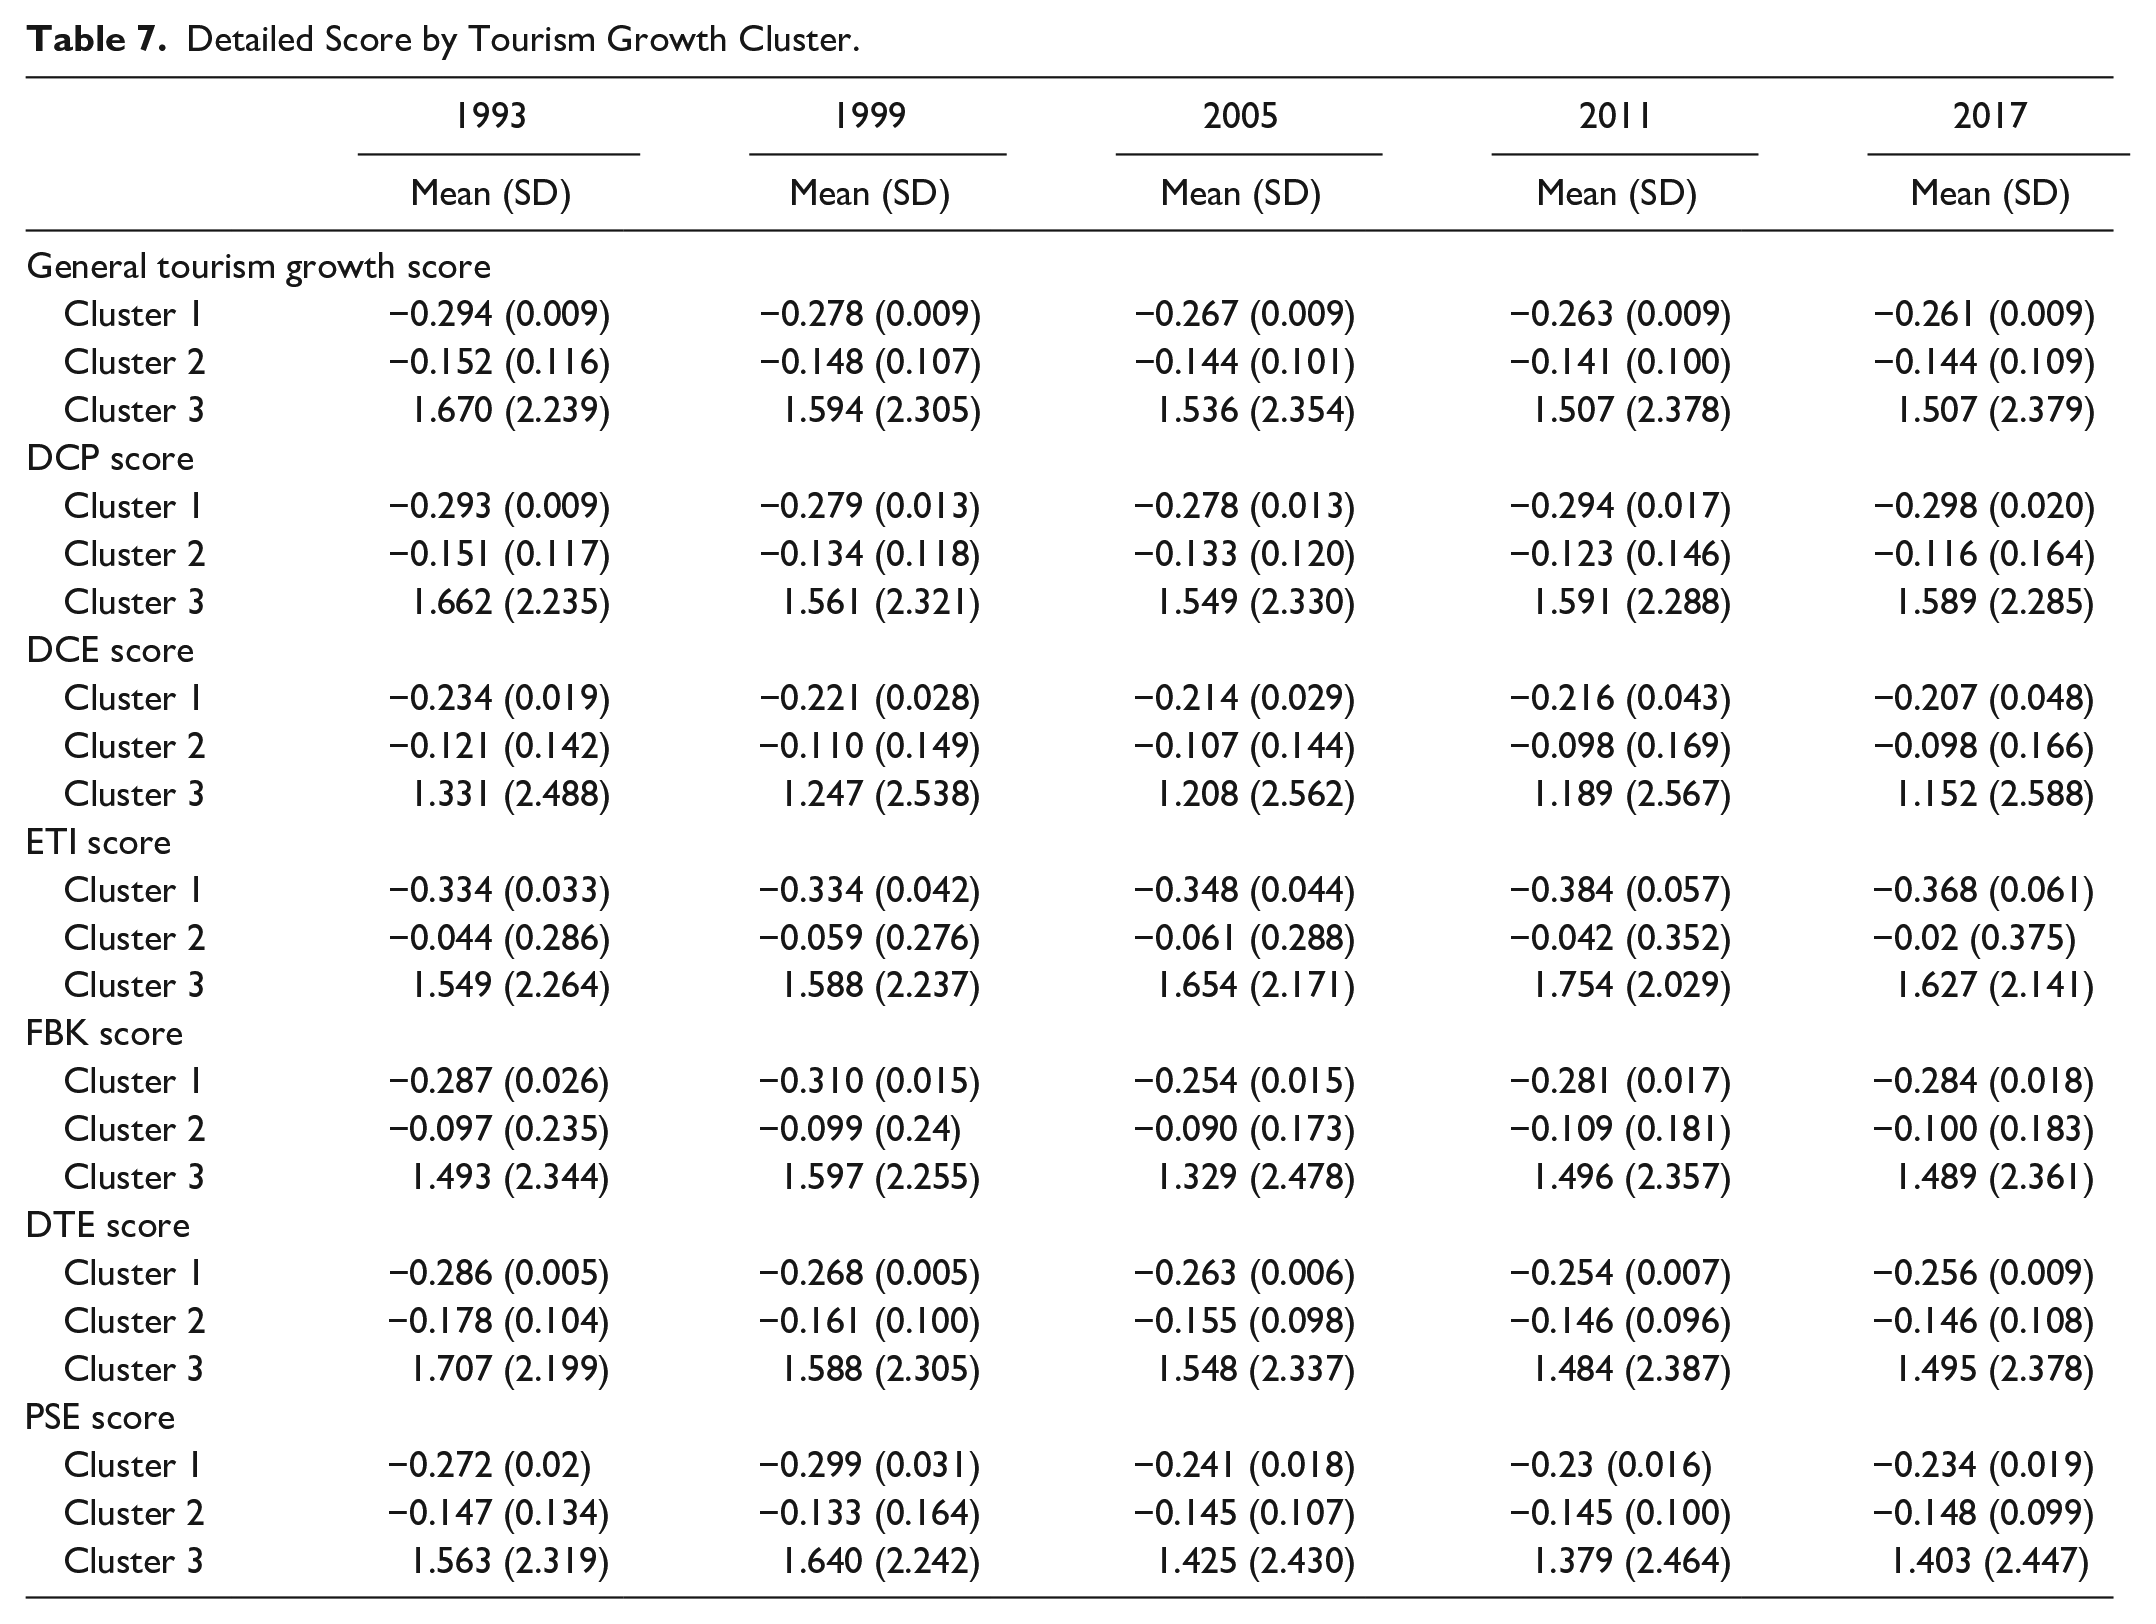
In the first place, with regard to tourism growth, the countries in cluster 1 are observed to be the ones with the lowest growth in tourism and whose evolution has been smaller. In addition, little variability in the indicators over the years indicates a greater similarity in the parameters of tourism activity among countries in the cluster. On the other hand, the countries that make up cluster 2 have superior tourism growth to the previous cluster but with negative values. They are countries, in the majority, that are still below the average tourism growth. The countries that make up cluster 3 have a higher than average tourism growth, although it can be seen that tourism growth in this cluster stagnates somewhat from 2005 onwards, while the countries in clusters 1 and 2 continue to grow during this period, although only slightly.
Finally, in order to analyze the specific differences of each cluster, the differences at the individual level of each of the six indicators that make up the tourism growth dimension need to be scrutinized, with these values being detailed in Table 7.
Detailed Score by Tourism Growth Cluster.
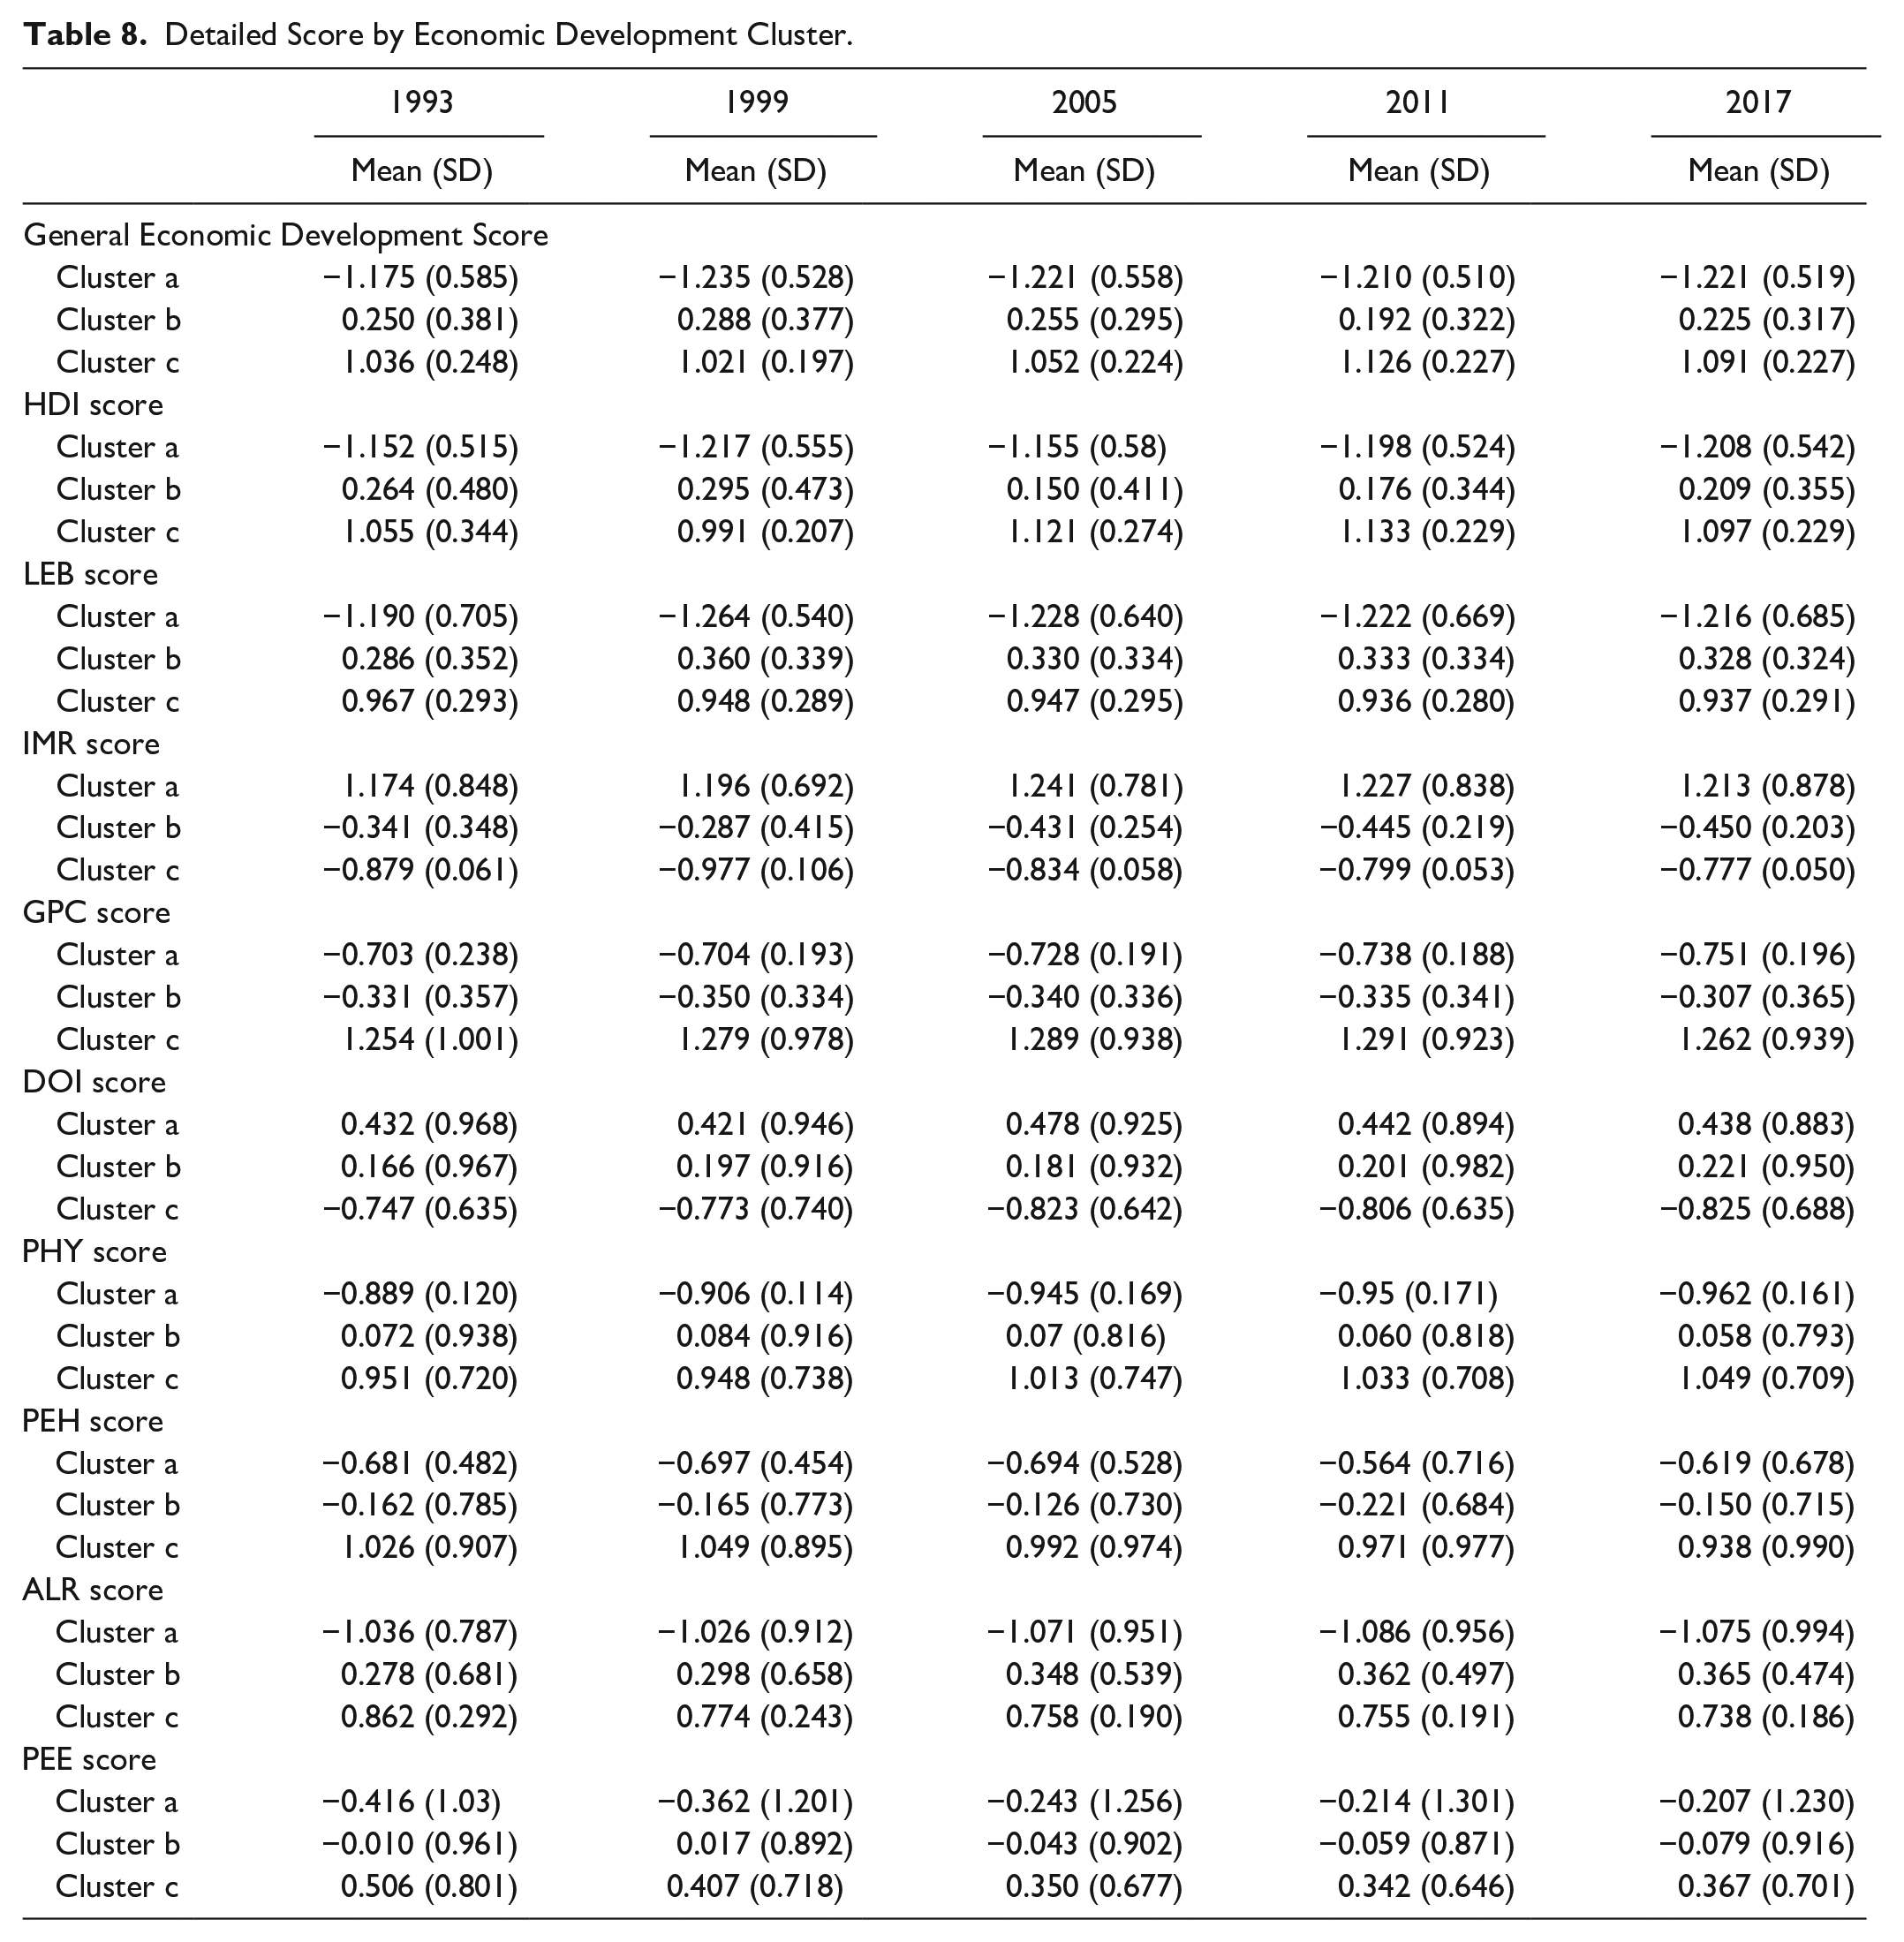
In second place, with regard to the economic development and the clusters formed according to the evolution of the values of the nine indicators used for its measurement, the results obtained are shown in Table 8. Countries in cluster a are characterized by having a lower level of economic development over the time frame analyzed, with low scores, mainly in Human Development Index, Life Expectancy at Birth and Adult Literacy Rate. On the other hand, the countries in Cluster b are defined by having average scores of Human Development Index and Life Expectancy at Birth, while the GDP per Capita values are excessively low. Finally, the countries in Cluster c are characterized by a high level of economic development, marked by very high values in all the indicators that are directly related to economic development (with the exception of Public Expenditure on Education) and, on the other hand, very reduced values in the indicators that have an inverse relationship with economic development (Infant Mortality Rate and Distribution of Income).
Detailed Score by Economic Development Cluster.
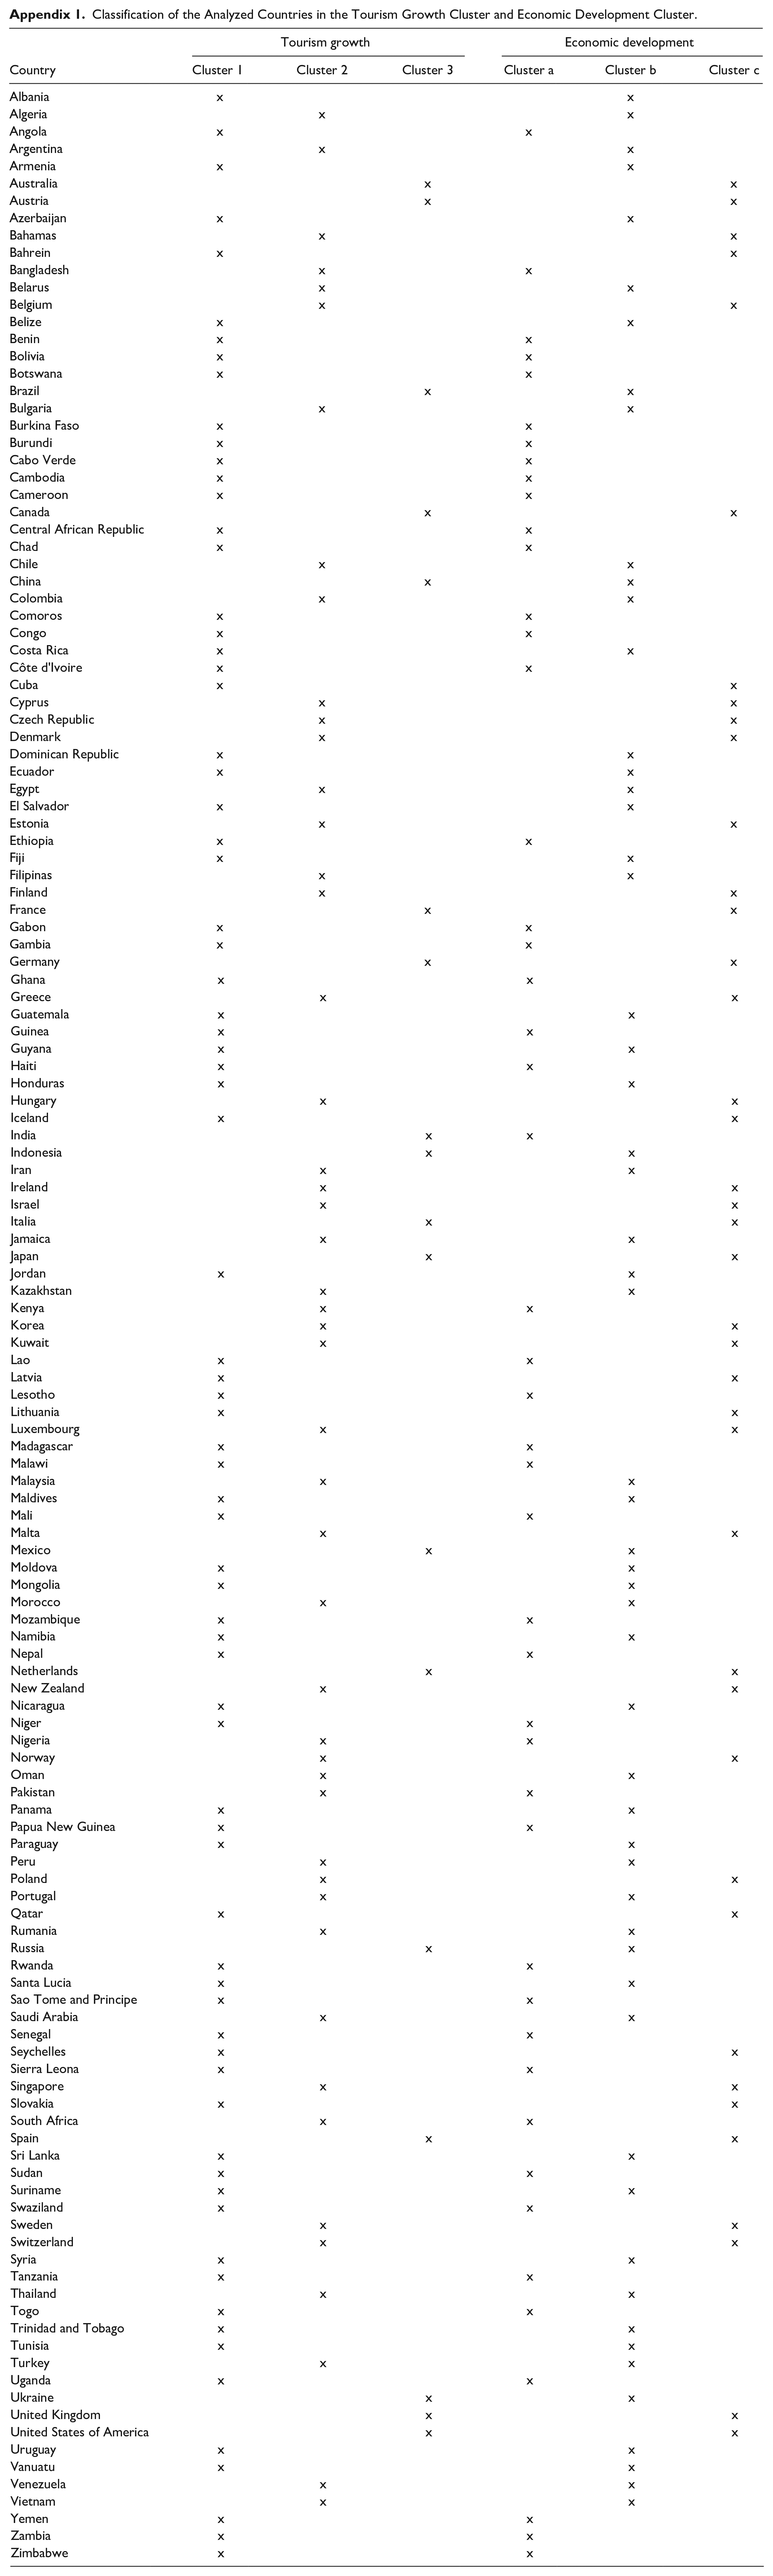
In Appendix 1, the countries that were analyzed are shown, as well as their corresponding tourism growth cluster and economic development cluster according to the data analysis.
Association Model between Tourism and Economic Development with Key Factors
Finally, in this section, a multivariate model was developed that analyzes the evolution of tourism growth according to the economic classification of the country along with the evolution of the economic development level, associated with the groups of key factors that, as identified in previous works, can influence said bidirectional relationship. These are (1) geographical characteristics and provision of infrastructure, (2) population characteristics, (3) generation of foreign currency and tax collection capacity, (4) investment climate, and (5) environmental dimension of sustainability.
The results have been obtained by means of multivariate linear regression models, applied to the response variable of the tourism growth score and the level of economic development score, during the time frame analyzed.
In this regard, it should be taken into account that several tests were carried out in order to verify the ideality of the model:
- First, to check the goodness of the fit, the X2 statistic was obtained: 598.730 (p value: 0.000), which allows us to check the appropriate fit of the model.
- Second, whether or not there are multicollinearity problems in the model based on VIF (variance inflation factor) was analyzed, obtaining in all cases VIF values below 7. According to Belsley (1982), there are only multicollinearity problems in the model from values greater than 10.
- Third, whether or not the regression model presents problems of heteroscedasticity was analyzed, through White’s contrast (Cross Terms). The absence of heteroscedasticity is confirmed through the statistic F, since the null hypothesis for the existence of heteroscedasticity has a value of p>0.05 (p=0.223).
- Finally, the possibility that the cross-section had dependency problems was analyzed through the Pesaran cross-section dependency test. Pesaran’s test of cross-sectional independence is 6.125 (p=0.000).
Figure 2 represents the results of the model, showing in addition the significant and relevant variables for tourism growth and economic development from the key factors that have been analyzed. These indicate the degree of association with both dimensions of each of the standardized indicators.

Multivariate model of association between tourism and economic development with the key factors analysed.
First, it can be seen that there is a significant association of the economic development cluster on the degree of tourism growth, so that the expansion of tourism activity differs according to the level of economic development of the country.
Similarly, when assessing the level of economic development of the countries analyzed, it is found that this dimension is influenced by the degree of tourism growth, differentiating said level of economic development according to the cluster of tourism growth to which the country belongs.
Therefore, a reciprocal association between tourism growth and economic development is observed throughout the analyzed time frame.
On the one hand, the lower the level of economic development of the country, the lower also is the growth of tourism (0.56 points less tourism growth in less developed countries [Cluster a] with respect to the more developed countries [Cluster c] and 0.37 points less tourism growth between countries with a medium level of development [Cluster b] and more developed countries [Cluster c]).
On the other hand, the lower the tourism growth a country has, the lower its level of economic development is also (1.05 points less economic development of countries with a lower level of tourism growth [Cluster 1] compared to countries with higher levels of tourism growth [Cluster 3] and 0.35 points less economic development of countries with a mid-level of tourism growth [Cluster 2] compared to countries with higher tourism growth [Cluster 3]).
Therefore, there is a bidirectional relationship between tourism and economic development, forming a circular flow between both dimensions, so that these results confirm the first of the hypotheses established in this research work. That is to say, that the expansion of the tourism activity improves the level of economic development in the countries where that tourism activity occurs but, at the same time, the level of economic development in those countries conditions the expansion of that tourist activity within their territory.
Second, the results of the applied multivariate model show that both tourism growth and the level of economic development are influenced by certain key factors in addition to their own bidirectional relationship. In effect, the parameters in Figure 2 show the degree of association of each of the standardized indicators with the two dimensions analyzed: tourism growth and economic development.
On the one hand, tourism growth is influenced by, in addition to the level of economic development, both the provision of infrastructure (land area, paved roads and conflict-related deaths) and the appropriate investment climate (interest rate, interest margin, consumer price index, research and development expenditure, and GDP per person employed). All these factors have a direct relationship with tourism growth, with the exception of conflict-related deaths (which measures the insecurity generated by conflicts in the country) and interest margin (which measures the interest rate of the financial market), which have an inverse relationship with this dimension.
On the other hand, the level of economic development is determined by, in addition to tourism growth, the geographical characteristics (terrestrial protected areas and improved sanitation facilities), the characteristics of the population (urban population, population > 65 years and age dependency ratio) and the investment climate (total tax rate and GDP per person employed). All these factors have a direct relationship with economic development, with the exception of Age Dependency Ratio (which measures the number of dependents, retirees, and schoolchildren, compared with those who are of working age).
Therefore, the bidirectional relationship between tourism and economic development does not occur automatically, but rather there are some key factors that determine this relationship. So the second hypothesis of this research work is also confirmed; that is to say, there are some key factors that determine the bidirectional relationship between tourism and economic development.
Conclusions
The relationship between tourism and economic growth has been widely studied by the scientific literature of the last two decades. In general, it has been shown that the expansion of tourism boosts economic growth in the countries where said tourism occurs. But there are also works that show that the opposite is true, that is to say, that economic growth contributes positively to the expansion of tourism activity.
In this article, we have taken the position of a third current of thought (on which, until now, literature has been scarce), which advocates that in reality there is a bidirectional causal relationship between the expansion of tourism and economic growth. But this research goes a step further, analyzing not the relationship between tourism and economic growth but between tourism and economic development.
The results obtained confirm the two hypotheses proposed.
Indeed, as the first hypothesis suggested, it has been possible to demonstrate that the growth of tourism improves the level of economic development in the countries where that tourism takes place and, in turn, the level of economic development of these countries determines the expansion of tourism activity in said territories.
This conclusion defends the role that some international organizations have developed during the last decades, such as the United Nations Conference on Trade and Development, the United Nations Economic Commission for Africa or the United Nations World Tourism Organization, when backing public policies that favor tourism growth, given that this growth as demonstrated by this hypothesis will become an effective tool for poverty alleviation in less developed countries.
As such, both these international institutions as well as the national governments of the various countries have to back the development of policies that favor the arrival of tourists to these territories (infrastructure, promotion, competitiveness, etc.), given that this increase in tourists will, in turn, result in an increase of different economic indicators related to tourism growth and, as has been shown with this first hypothesis, an increase in tourism growth will improve the living conditions of the resident population.
However, as the economic development of a country improves, that is, the socioeconomic conditions at the destination improve, so there will be an increase in tourism growth without the need for further investments (bidirectional relationship). Therefore, it is not true that the commitment to tourism as an economic development tool occurs only if there is public aid for tourism, given that, as economic development improves, this aid can disappear without causing tourism growth and therefore economic development to suffer.
Likewise, the second hypothesis has been corroborated: the bidirectional relationship that exists between tourism growth and economic development is conditioned by a set of factors that favor or limit this relationship.
With regard to the policy and managerial implications, note that the results obtained in this article can provide guidance in the decision making of policymakers and destination managers. Knowing that there is a bidirectional relationship between tourism growth and economic development is very important for making decisions, but what is really important is knowing what factors determine this relationship, since the different actors will be able to direct their decisions toward promoting these types of factors.
The identification of factors that condition the transformation of tourism growth into economic development is essential to achieve greater efficiency of the policies applied, mainly in those countries where this bidirectional relationship between tourism growth and economic development is weaker, in other words, in least developed countries. Therefore, before international organizations or national governments make significant investments—with the intention of attracting tourist flows—policy decisions must be simultaneously taken to improve infrastructure provision, increase the level of security, favor an adequate investment climate, and reduce the dependent population ratio.
Because of the public nature that most DMOs have, not only should these organizations make a commitment to the development of policies that favor the arrival of tourists to a territory in isolation but, as they also have a mission of efficiency in public management, the allocation of resources to tourism as an economic development tool must be accompanied by other types of policies that favor the bidirectional relationship between tourism growth and economic development, precisely influencing the factors that have been revealed in this article and that have been indicated in the previous paragraph.
However, in many cases, at the same time that policies are developed that are committed to tourism as a development tool, another series of policies that aim to generate foreign exchange, or increase tax collection capacity, or GDP per person employed or environmental sustainability should also be developed, given that all these variables influence the bidirectional relationship between tourism growth and economic development.
As has been shown in this article, it is not enough to exclusively promote policies aimed at the growth of tourism activity, but rather, for tourism to become an instrument of development; even prior to promoting tourism activity in a territory (especially in the least developed countries), policy makers and destination managers must apply policies aimed at ensuring that this territory is prepared for tourism to prosper. In fact, the failure of many of the actions of international development cooperation organizations, NGOs, etc. in terms of tourism in these types of countries, is precisely because they have not created favorable conditions for tourism to prosper, and instead dedicated themselves exclusively to promoting it.
In any case, these conclusions require a differentiated analysis by groups of countries that share homogeneous characteristics, in this case, level of tourism growth (high, medium, or low) and level of economic development (developed, developing, or less developed).
In this regard, the lower the level of economic development of the country, the lower the growth of tourism, and vice versa. So the position defended by much of the scientific literature is confirmed, to the extent that less developed countries have fewer opportunities to convert tourism growth into an improvement in economic development.
Therefore, as has happened during the last decades, the position of international organizations and institutions in focusing their tourism growth policies on less developed countries is correct, given that it is in this type of countries where the relationship between tourism growth and economic development is weaker.
Nevertheless, the research developed in this article came up against a series of limitations that are detailed below.
First, analysis took place of only those countries for which there was complete information for the 1993–2017 period of the three databases used. Therefore, although the sample is sufficiently representative, there are other countries for which there is information for a specific magnitude—tourism growth, economic development, or determining factors—that have had to be discarded because they do not have complete information in all databases.
Second, three clusters of countries were identified according to their level of tourism growth and three clusters of countries according to their level of economic development with the intention of verifying the behavior by groups of countries that shared homogeneous characteristics. However, if another criterion had been used to classify countries, the composition of both groups could have been different, as well as the results obtained.
As a future line of research, the volume of information available for the significant number of countries analyzed could be expanded, in order to incorporate new factors into the analysis. This would, in short, check how many more factors condition the bidirectional relationship between tourism growth and economic development and in what way. Specifically, it would be interesting to incorporate as a factor of analysis the volume of aid that countries have received in order to favor tourism growth, categorizing countries based on this variable so as to analyze the degree of efficiency of the policies being applied by those organizations that are granting this type of aid.
Footnotes
Appendix
Classification of the Analyzed Countries in the Tourism Growth Cluster and Economic Development Cluster.
| Tourism growth |
Economic development |
|||||
|---|---|---|---|---|---|---|
| Country | Cluster 1 | Cluster 2 | Cluster 3 | Cluster a | Cluster b | Cluster c |
| Albania | x | x | ||||
| Algeria | x | x | ||||
| Angola | x | x | ||||
| Argentina | x | x | ||||
| Armenia | x | x | ||||
| Australia | x | x | ||||
| Austria | x | x | ||||
| Azerbaijan | x | x | ||||
| Bahamas | x | x | ||||
| Bahrein | x | x | ||||
| Bangladesh | x | x | ||||
| Belarus | x | x | ||||
| Belgium | x | x | ||||
| Belize | x | x | ||||
| Benin | x | x | ||||
| Bolivia | x | x | ||||
| Botswana | x | x | ||||
| Brazil | x | x | ||||
| Bulgaria | x | x | ||||
| Burkina Faso | x | x | ||||
| Burundi | x | x | ||||
| Cabo Verde | x | x | ||||
| Cambodia | x | x | ||||
| Cameroon | x | x | ||||
| Canada | x | x | ||||
| Central African Republic | x | x | ||||
| Chad | x | x | ||||
| Chile | x | x | ||||
| China | x | x | ||||
| Colombia | x | x | ||||
| Comoros | x | x | ||||
| Congo | x | x | ||||
| Costa Rica | x | x | ||||
| Côte d’Ivoire | x | x | ||||
| Cuba | x | x | ||||
| Cyprus | x | x | ||||
| Czech Republic | x | x | ||||
| Denmark | x | x | ||||
| Dominican Republic | x | x | ||||
| Ecuador | x | x | ||||
| Egypt | x | x | ||||
| El Salvador | x | x | ||||
| Estonia | x | x | ||||
| Ethiopia | x | x | ||||
| Fiji | x | x | ||||
| Filipinas | x | x | ||||
| Finland | x | x | ||||
| France | x | x | ||||
| Gabon | x | x | ||||
| Gambia | x | x | ||||
| Germany | x | x | ||||
| Ghana | x | x | ||||
| Greece | x | x | ||||
| Guatemala | x | x | ||||
| Guinea | x | x | ||||
| Guyana | x | x | ||||
| Haiti | x | x | ||||
| Honduras | x | x | ||||
| Hungary | x | x | ||||
| Iceland | x | x | ||||
| India | x | x | ||||
| Indonesia | x | x | ||||
| Iran | x | x | ||||
| Ireland | x | x | ||||
| Israel | x | x | ||||
| Italia | x | x | ||||
| Jamaica | x | x | ||||
| Japan | x | x | ||||
| Jordan | x | x | ||||
| Kazakhstan | x | x | ||||
| Kenya | x | x | ||||
| Korea | x | x | ||||
| Kuwait | x | x | ||||
| Lao | x | x | ||||
| Latvia | x | x | ||||
| Lesotho | x | x | ||||
| Lithuania | x | x | ||||
| Luxembourg | x | x | ||||
| Madagascar | x | x | ||||
| Malawi | x | x | ||||
| Malaysia | x | x | ||||
| Maldives | x | x | ||||
| Mali | x | x | ||||
| Malta | x | x | ||||
| Mexico | x | x | ||||
| Moldova | x | x | ||||
| Mongolia | x | x | ||||
| Morocco | x | x | ||||
| Mozambique | x | x | ||||
| Namibia | x | x | ||||
| Nepal | x | x | ||||
| Netherlands | x | x | ||||
| New Zealand | x | x | ||||
| Nicaragua | x | x | ||||
| Niger | x | x | ||||
| Nigeria | x | x | ||||
| Norway | x | x | ||||
| Oman | x | x | ||||
| Pakistan | x | x | ||||
| Panama | x | x | ||||
| Papua New Guinea | x | x | ||||
| Paraguay | x | x | ||||
| Peru | x | x | ||||
| Poland | x | x | ||||
| Portugal | x | x | ||||
| Qatar | x | x | ||||
| Rumania | x | x | ||||
| Russia | x | x | ||||
| Rwanda | x | x | ||||
| Santa Lucia | x | x | ||||
| Sao Tome and Principe | x | x | ||||
| Saudi Arabia | x | x | ||||
| Senegal | x | x | ||||
| Seychelles | x | x | ||||
| Sierra Leona | x | x | ||||
| Singapore | x | x | ||||
| Slovakia | x | x | ||||
| South Africa | x | x | ||||
| Spain | x | x | ||||
| Sri Lanka | x | x | ||||
| Sudan | x | x | ||||
| Suriname | x | x | ||||
| Swaziland | x | x | ||||
| Sweden | x | x | ||||
| Switzerland | x | x | ||||
| Syria | x | x | ||||
| Tanzania | x | x | ||||
| Thailand | x | x | ||||
| Togo | x | x | ||||
| Trinidad and Tobago | x | x | ||||
| Tunisia | x | x | ||||
| Turkey | x | x | ||||
| Uganda | x | x | ||||
| Ukraine | x | x | ||||
| United Kingdom | x | x | ||||
| United States of America | x | x | ||||
| Uruguay | x | x | ||||
| Vanuatu | x | x | ||||
| Venezuela | x | x | ||||
| Vietnam | x | x | ||||
| Yemen | x | x | ||||
| Zambia | x | x | ||||
| Zimbabwe | x | x | ||||
