



Abstract
With economic growth and increasing diversification of economic activities away from primary sector, urbanisation has been constantly expanding all over the world. This process in India has been slow, and India today is one of the least urbanised countries of the world. Dependence on agriculture for work is still very high. A typical worker in India, by tradition and habit, is a reluctant migrant. He/she moves to the city only when city needs him/her. GDP growth in India has not contributed much to growth in job opportunities. India jumped from primary to tertiary sector bypassing the growth of manufacturing against the historical experience of developed countries and of China in recent years. This has to change. With reasonable assumption about economic growth with industrial development it would be reasonable to expect an urban population of nearly 50 per cent by 2031. Across the states, India has varied experience in urbanisation, ranging from 10 per cent to nearly 60 per cent and above. Levels of urbanisation and levels of economic development of states are highly correlated. More urbanised states also show better urban governance. Situation in small towns in less developed states in most cases is quite dehumanising. Urban planning has been almost non-existent. When asked to propose city development plans (CDPs) for assistance under the Jawaharlal Nehru National Urban Renewal Mission (JnNURM), most of bigger cities propose to move from secondary sector to tertiary sector without showing much concern for implications of such movement for the urban poor. Poverty is not comparable over time with a fixed measuring rod. The urban poor suffer from a large number of vulnerabilities: residential, occupational and social. Residential vulnerabilities are the most acute. Urban poor need to be identified on the basis of these vulnerabilities. If this is done, the magnitude of urban poverty may turn out to be much larger than what the official estimates indicate.
Keywords
Introduction
The process of urbanisation in India has been exceptionally slow and India is one of the least urbanised countries in the world. There could be many reasons for the slow rate of growth of urbanisation, but the question is whether the same slow pace of urbanisation in India can be projected into the future also? A reasonable bearing on this question is crucial for dealing with urban growth and urban poverty in a way that urbanisation becomes a supporting stimulant rather than a stumbling block to the level and quality of development that the nation aspires. Even with low level of urbanisation, India has not been able to manage, so far, healthy living conditions for urban poor and satisfactory provision of essential urban amenities and services to most of urban residents. Urban governance has been poor. The question is whether even this slow pace of urbanisation has been too much for the country to manage, and if so, what happens when urbanisation grows at a faster pace. We would like to emphasise that urbanisation in India is not a single, uniform, monolithic experience. There are states which have experienced high level of urbanisation and there are states with urbanisation levels which country as a whole experienced in early twentieth century. Also, it is generally seen that states with higher levels of urbanisation have been able to manage their urban units much better than states with primitive levels of urbanisation.
Slow Pace of Urbanisation
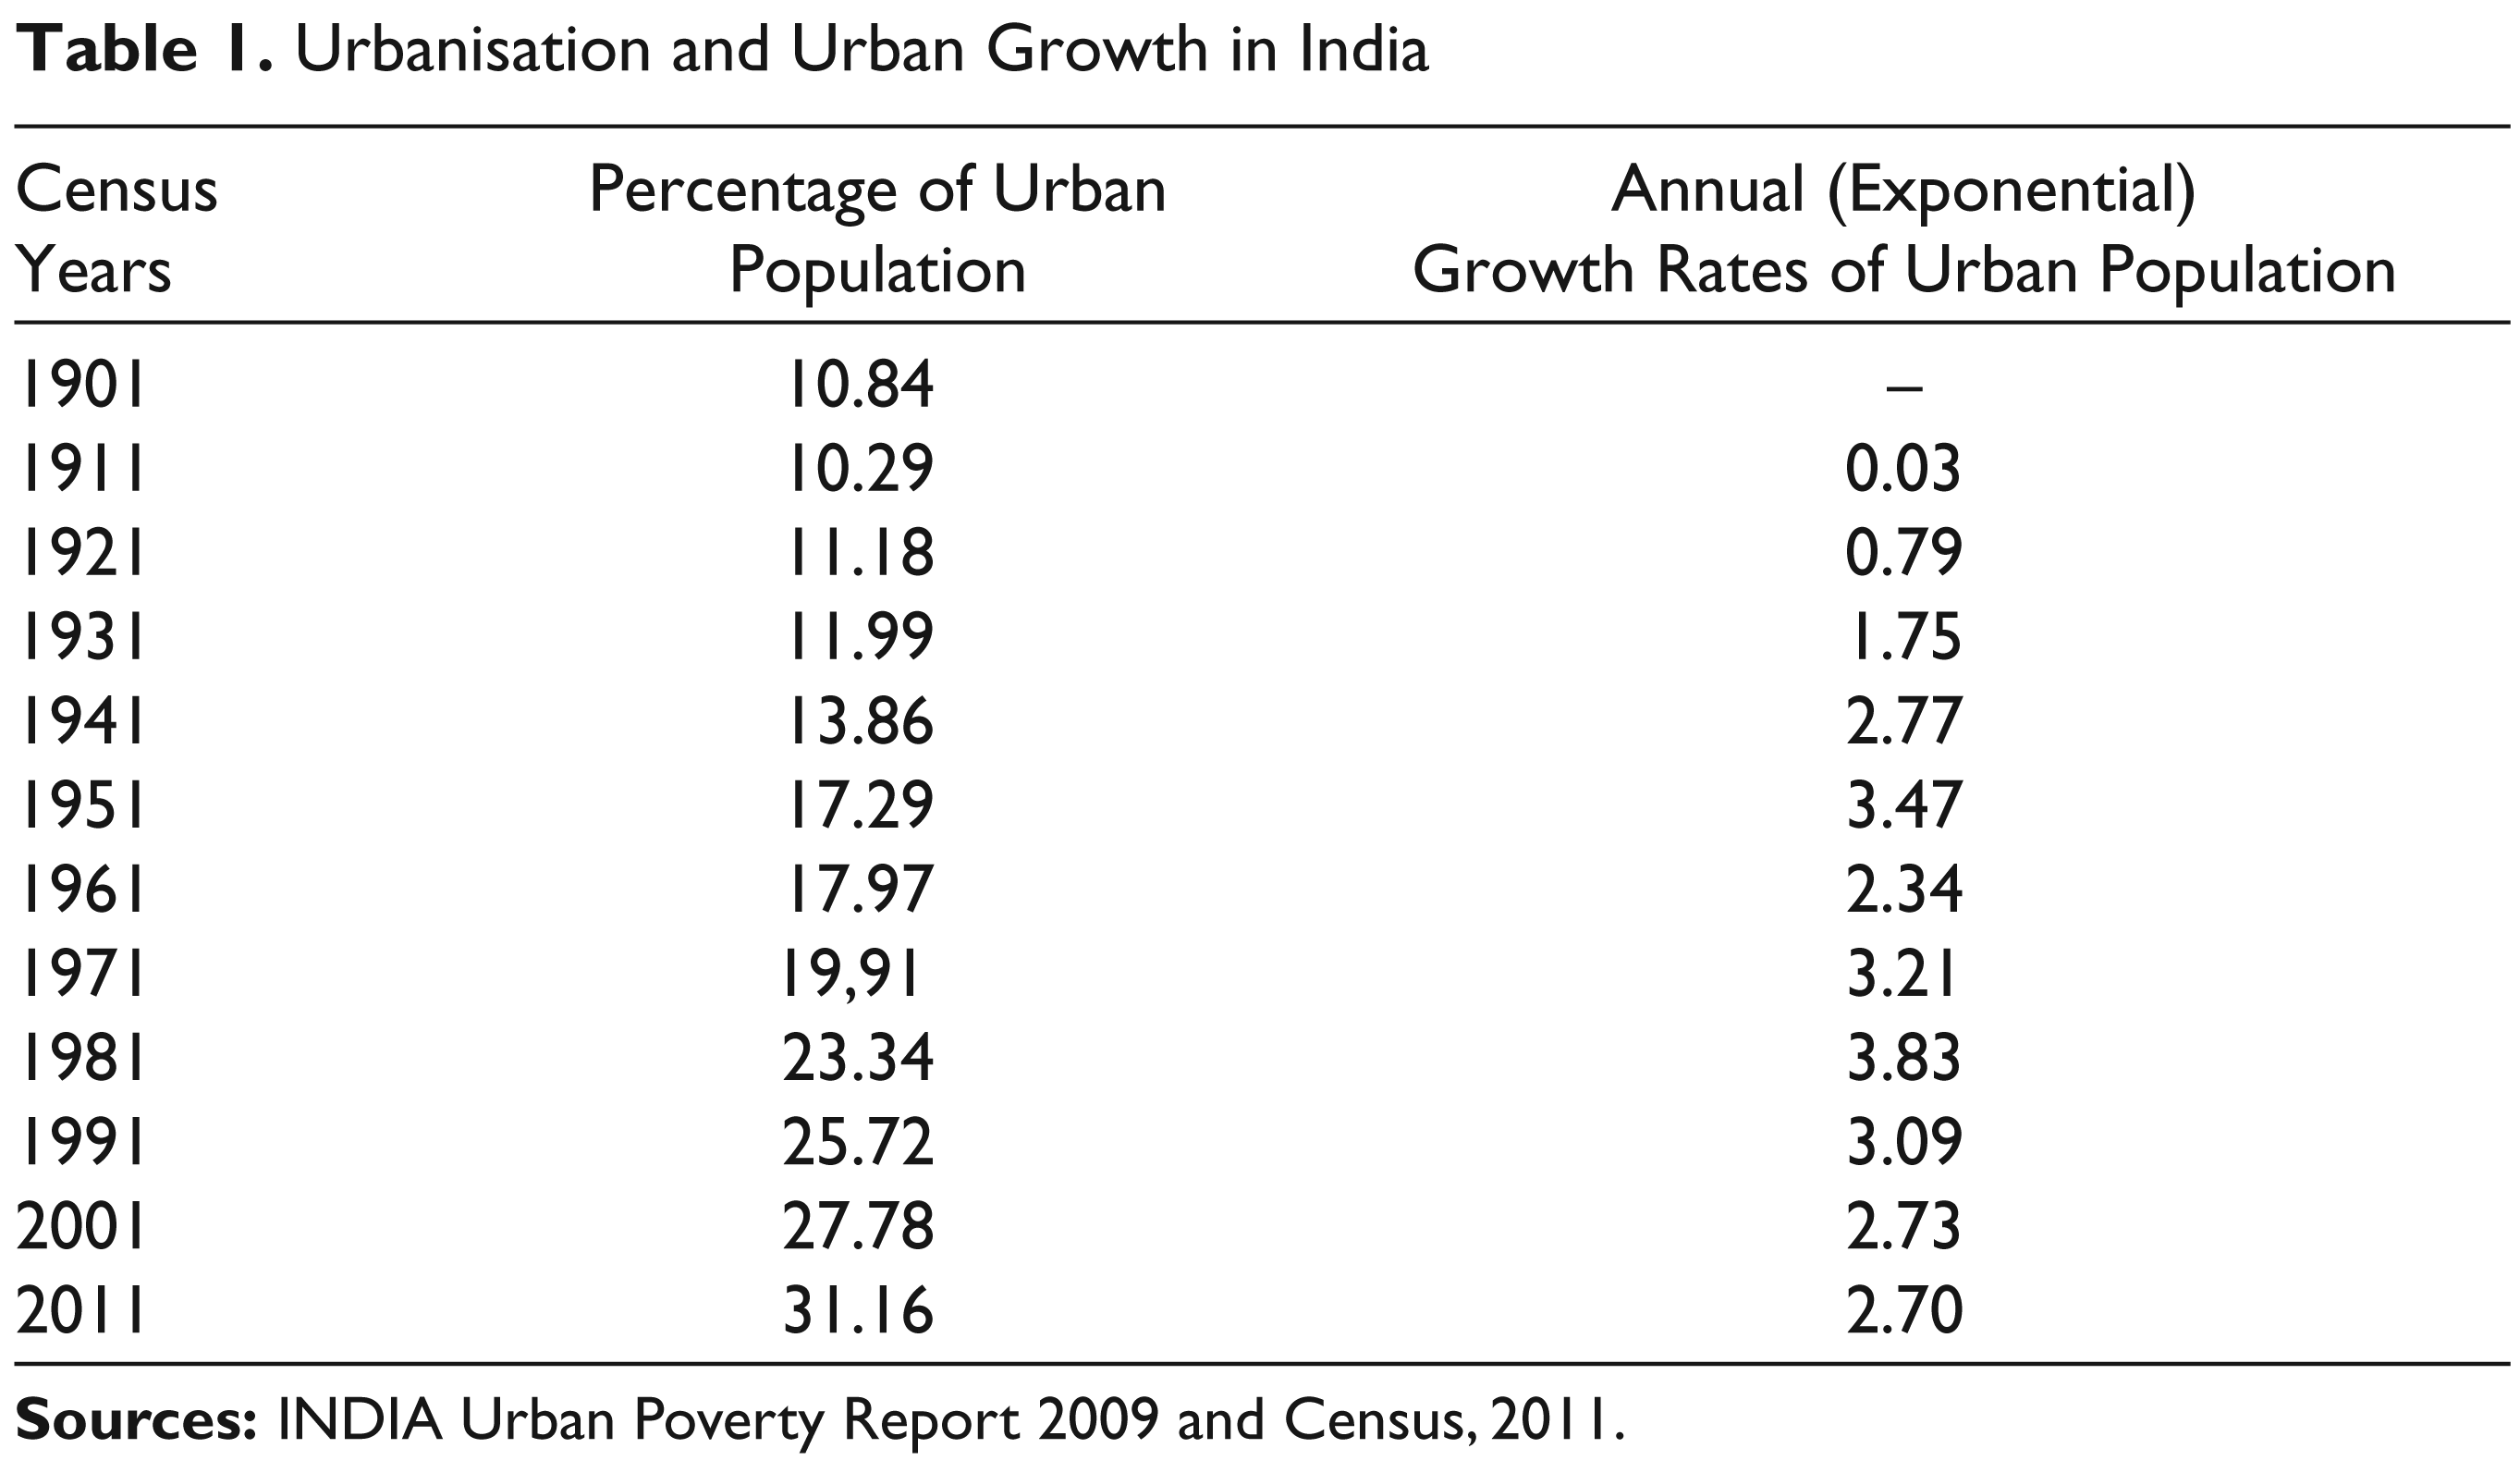
All human activities are spurred by close interaction and mutual support within a large community of people living in a habitat. Commerce and industry grow in clusters and agglomerations. Cities have been the centres of advancement of education and knowledge, language and arts, invention and innovations and broadly of culture and civilisation. With economic growth and increasing diversifications of economic activities away from agriculture and animal husbandry, urbanisation has been constantly expanding all over the world. As per Census 2011, urban population in India was 31.16 per cent and the growth rate of urban population over the two decades, 1991–2011 has been just around 2.7 per cent per annum, which is a little lower than the average rate of urban growth obtained during 1951–91 (Table 1). The level of global urbanisation was around 15 per cent at the beginning of the twentieth century when India was 11 per cent urbanised. The world today is about 60 per cent urbanised while urbanisation in India remains at around 31 per cent. In 1980, when India had an urban population of 23 per cent, China only had 20 per cent. Today China is reported to be 54 per cent urban. During the last three and half decades, since China has experienced unprecedentedly high rate of economic growth and since restrictions on rural–urban migration were somewhat relaxed, urbanisation in China has grown at a very fast pace. In developed countries, urbanisation ranges between 75 and 90 per cent, and rural population has shrunk in keeping with the dependence of work force on agriculture which in turn becomes more or less proportional to the contribution of agriculture to GDP. Contribution of agriculture to GDP in India has come down to about 14 per cent (2012–13) while agriculture is still burdened with nearly 50 per cent of the workforce. This accounts for extreme inequality between rural–urban incomes, and the underdevelopment of rural sector in all respects.
Urbanisation and Urban Growth in India
A typical worker in India, by tradition and by habit is a reluctant migrant. He just does not flock to the city looking for jobs. He only moves when he clearly finds job opportunity, that too through established connections. Most of the time, he moves alone leaving the family behind and keeps his connection with the community back home alive. He moves to the city when city needs work from him. An educated person is more likely to migrate from rural to urban areas but only after being reasonably sure about finding work. Poverty is not a key factor in migration (Kundu & Sarangi, 2005). Hence all the noise about rural poor flocking to the city and adding to poverty in urban areas is unfounded. Urban poverty is not a result of push factor (Hashim, 2009). In fact, it is this reluctance about insecure and purposeless migration which even today has contained more than two-thirds of the Indian population in rural areas, though most of them do not have full time productive work in hand.
India’s economic growth in the first three decades after Independence was very slow in spite of emphasis on industrialisation from Second Five Year Plan onwards. Later, when the growth picked up after liberalisation and even accelerated to higher levels, the structure of growth was such that it did not create jobs for the masses. Higher growth achievement of the last two decades or so has been based on growth of services sector, particularly of the type which creates fewer jobs, that too for well-educated and skilled population. India jumped from primary sector to tertiary sector by passing the growth of manufacturing against the historical experience of developed countries and of China in more recent times. The service sector accounts for 60 per cent of the GDP. The share of manufacturing which was 16.2 per cent in 2010–11 is projected to fall to about 15 per cent in 2012–13. This is despite the pronounced aim of the government to take it to 25 per cent. India’s share in world manufacturing is negligible. In the year 2009, the USA with a share of 18.7 per cent and China with a share of 18.1 per cent dominated the world manufacturing. Japan had a share of 10.1 per cent while India had a meagre share of 2.1 per cent in world manufacturing. Consequence is that GDP growth has not contributed to growth in job opportunities. More than 93 per cent of the work force remains employed in informal sectors with low incomes and no security. Lack of industrial/manufacturing job creation has contributed to slow growth of urbanisation. High level of fast growing industrialisation and industrial exports was the main basis of Chinese growth. The pattern of growth that we in India have experienced in the last two decades is unsustainable. Our growth pattern has to change with emphasis on industrialisation.
Industrialisation demands high level of infrastructure, energy, transport, ports and airports. Industrialisation creates clusters and agglomerations. It creates jobs to draw people away from agriculture and rural areas. This is precisely the process of urbanisation. Industrialisation, job creation and urbanisation are thus one and the same process. In the interest of sustaining economic growth, we have to induce and encourage this process. High level of urbanisation is not only unavoidable but necessary for growth and development. And therefore, it is important to realise at this stage that the rate of urbanisation in India has to break from the past trend and grow at unprecedented higher pace. With certain reasonable assumptions about rate of economic growth and job creation, it would be reasonable to assume an urban population of nearly 50 per cent by 2031. This perspective has to be kept in policy making if we want to avoid absolutely chaotic urbanisation.
The Pattern of Urban Growth
The pattern of urban spread that has emerged in the country, even though unplanned, is not too skewed. The distribution of cities of size one lakh and above in states and union territories is shown in Table 2. A number of meaningful observations can be made from this table. It is not that the experience of high level of urbanisation does not exist in the country. There are a number of states, quite few of them very large, where urbanisation is already in the neighbourhood of 50 per cent or even more, even if we exclude from consideration the city territories, like NCT of Delhi and Chandigarh. Puducherry, Goa and Mizoram have urbanisation level of more than 60 per cent. Big states like Tamil Nadu (48.45 per cent), Kerala (47.74 per cent) and Maharashtra (45.23 per cent) have urbanisation in the neighbourhood of 50 per cent. In general, South India is more urbanised and North and East India is much less urbanised. Level of development (indicated in Table 2 by per capita NSDP) is highly correlated with level of urbanisation. Distribution of cities by size classes appears to be quite balanced on the whole. All the mega cities (8 in total) are located in the more urbanised states. What is even more interesting is to note that Goa, Sikkim and Arunachal Pradesh do not have a single city of size one lakh and above, though Goa is the most urbanised state. Kerala, a relatively larger state which has urbanisation level of 47.74 per cent does not have a single city of size 10 lakh and above. The relatively more urbanised states with population share of 46.8 per cent have 252 towns in the size group 1–10 lakhs, while the relatively less urbanised states with population share of 53.2 per cent have only 198 towns in this size group. To say that a very high level of urbanisation will encourage only mega cities and will be at the cost of smaller cities is not borne out by data.
Distribution of Cities (size one lakh & above) in States/Territories 2011

2. The eight cities enumerated in this table in the category 40 lakh above are: Greater Mumbai (MC), Delhi (MCD), Kolkata (MC), Chennai (MC), Bangalore (MC), Greater Hyderabad (MC), Ahmedabad (MC) and Surat (MC).
Among the 5 cities in the next category (size 20 to 40 lakh) are: Pune (MC), Nagpur (MC), Jaipur (MC), Lucknow (MC) and Kanpur (MC).
In fact, Goa and Kerala, the two most urbanised states, present the best example of urbanisation where rural and urban areas are a continuum, and there is little difference in the two in terms of infrastructure and facilities. The more urbanised states of south are also known for better governance structure for the cities and better management of the problems than the less urbanised states in the North.
Town Size, Basic Amenities and Poverty
Analysing access to basic amenities and urban security in cities, Kundu (2009) finds that class I towns, particularly the metropolises, enjoy a distinctly higher level of basic amenities (access to drinking water, electricity and toilet facilities).
A study of six small and medium towns across the country brings out some stark facts about the basic amenities in those towns (IHD, 2012). The six towns studied are given in Table 3.
Selected Small and Medium Towns and their Population
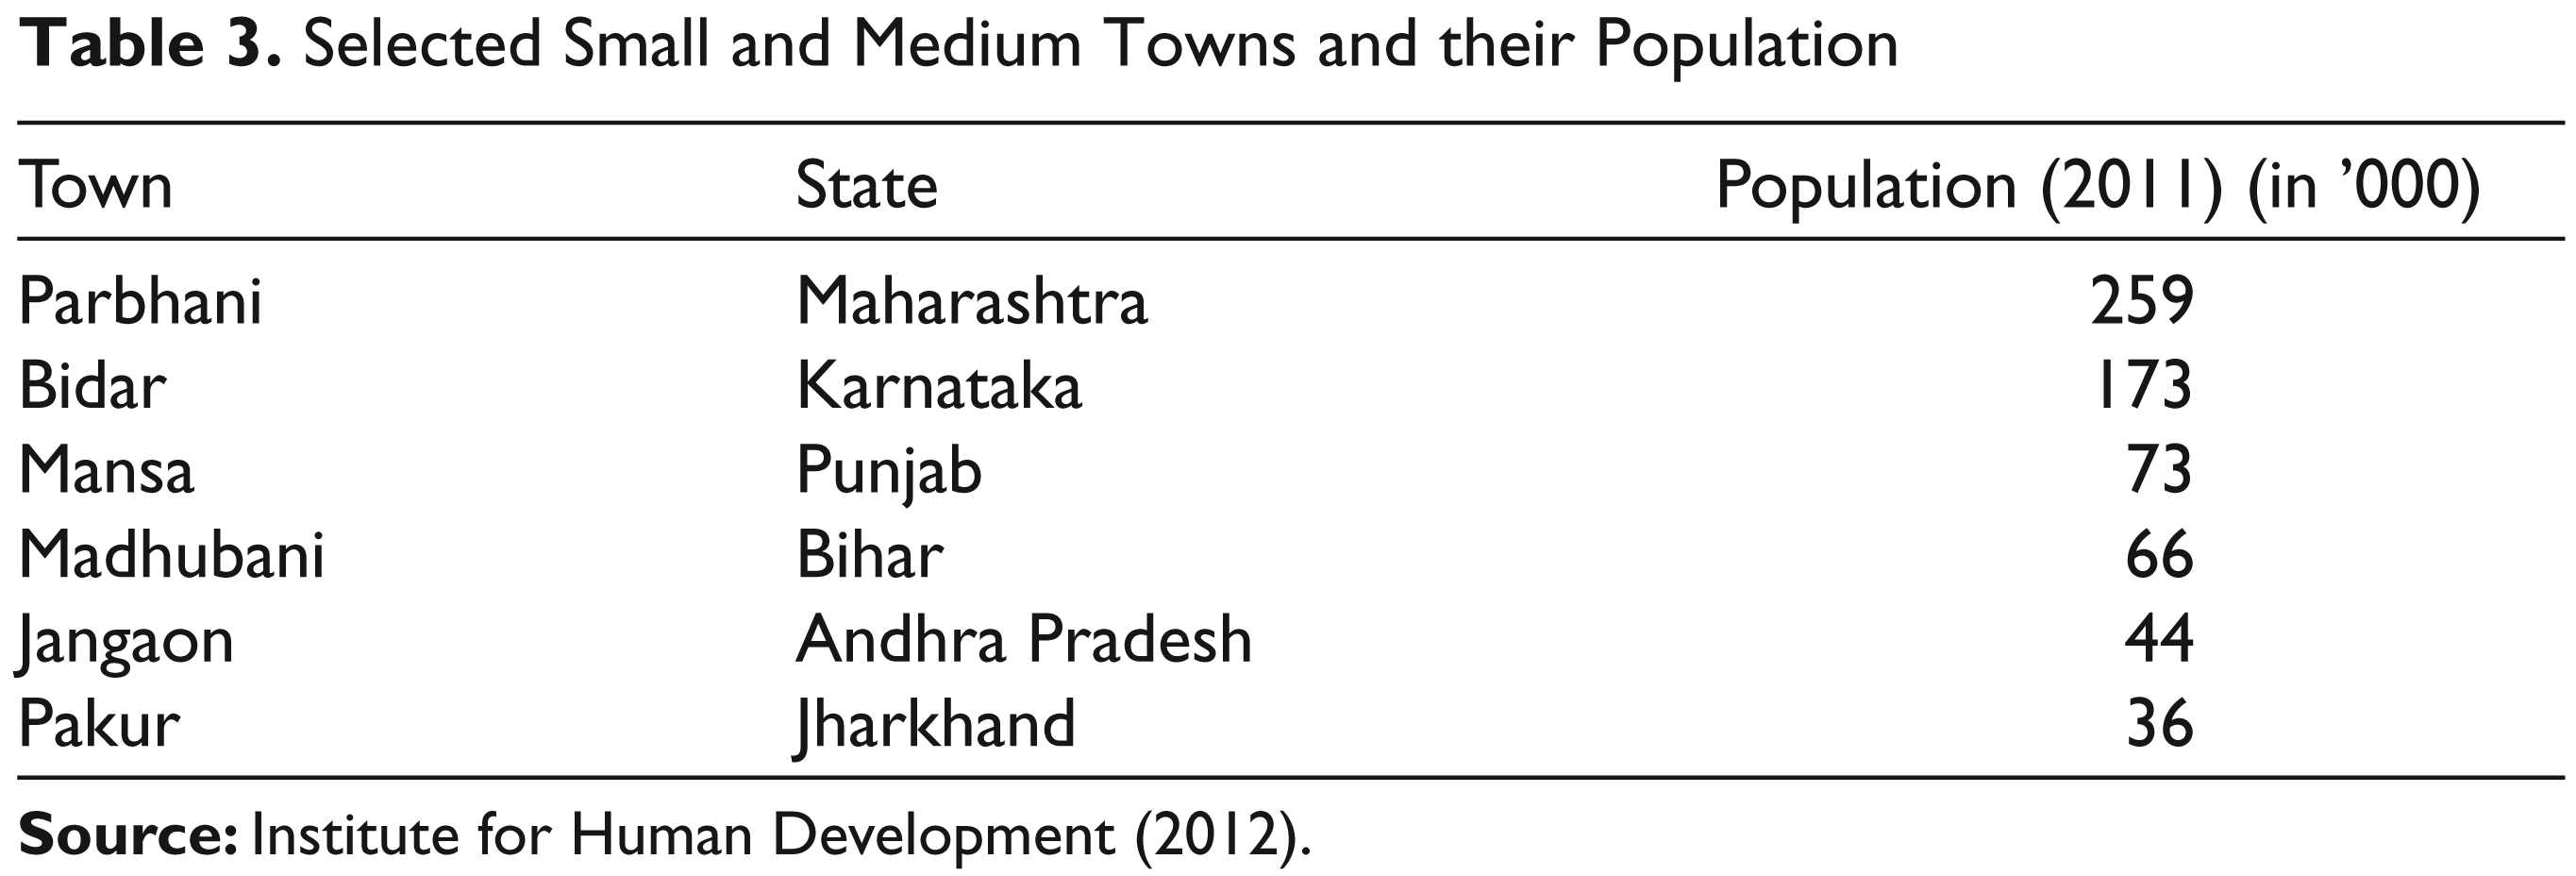
Sources of drinking water in these six towns together were: public hand pump (27.9 per cent), public stand post (16.3 per cent), private hand pump (17.4 per cent), well (7.1 per cent), piped water supply (9.6 per cent), purchase of water (10.1 per cent) and others (21.6 per cent). Parbhani had 19.1 per cent of piped water supply and Bidar had 9.9 per cent. All other towns had less.
Open defecation was widely prevalent (among 57.2 per cent of households). This was true of bigger towns even more: Parbhani 81.3 per cent, Bidar 53.8 per cent, Madhubani 60.6 per cent, Pakur 71 per cent.
Drainage in these towns was mostly informal (Kuchcha), mostly uncovered and did not have proper outfall.
Sewerage connections served only centrally located settlements and had not been extended to peripheral areas. Even in central areas, many poor settlements had been left out.
As regards housing, thatch, grass, tarpaulin and asbestos as roofing material dominated the houses of three lower quintiles of households.
It has also been observed that large cities exhibit distinctly higher, demographic growth, better infrastructural facilities, higher levels of education and lower poverty ratios. Quality of employment, productivity and returns to education are likely to be better in larger cities than in smaller towns (Hashim, 2009). On the point of incidence of poverty by size class of towns, Table 4 reproduced from Kundu and Sarangi (2005) will be of much interest.
Small towns were almost at par with rural areas in respect of incidence of poverty.
Percentage of Poor in Different Size Classes of Cities/Towns

The situation in less developed states in this respect is even worse. ‘About a fifth of the population in these towns lives in totally dehumanised conditions, as they have to do without safe drinking water, electricity and toilet facilities’ (Kundu, 2009). Local bodies, particularly those of smaller towns, face more severe resource crunch in less developed states. At the same time small and medium towns in these states have experienced a rapid growth in population. It, thus, appears that the quality of urban development depends more on the quality and nature of governance (the basic cause for disparities in development) rather than on the level of urbanisation.
Planning for Urbanisation
Urbanisation in India has not followed any pre-planned frame of development or a pre-planned pattern of urbanisation. Planning for urbanisation, in that sense, would have meant outlining a perspective on urban growth as a whole, visualising a desirable spread of urban units over various states, planning infrastructure accordingly and ‘seeding’ the growth of urban units and nudging the location of industries (particularly manufacturing industries) according to the visualised pattern. Physical planning of urban units, particularly keeping in mind the needs for workers and the needs of the relatively poorer sections of population in these urban units, would be an important part of planning of urban units (or urban planning). Yet another relatively more neglected part of urban planning has been the planning and putting in place effective urban governance machinery with adequate provision of resources to be able to take care of expanding needs in the future. In this respect as well, the relatively more urbanised and more developed states have performed better.
The attitude towards urbanisation was somewhat ambivalent in the earlier stages of planning. The First Five Year Plan almost entirely focused on agriculture and rural community development (FFYP, 1951). The Second Plan took note of the urban problems only in the context of ‘housing’. It said:
large towns have attracted to themselves new industries and services and the problem of providing housing and other amenities have become increasingly acute. Rise in the land values, speculative buying of lands in the proximity of growing towns, high rentals and the development of slum areas are features common to most large towns …. For the urban development to proceed on desirable lines, competent municipal administration with adequate powers, resources and administrative and technical staff are essential. (SFYP, 1956: 297)
Thus, urbanisation appears to be only a problem, and the problems mentioned earlier have, since, become even more acute, though there have been a number of schemes and programmes to address them under subsequent Five Year Plans. The problem of urban governance was sought to be tackled through a landmark legislative measure, that is, the 74th amendment of the Constitution effective from April, 1993, which provides a common framework for the structure and mandate of Urban Local Bodies for effective democratic decentralisation.
It was the Tenth Five Year Plan which, while noting the problems, took a more positive view of urbanisation, as can be seen from the following quotation:
6.1.12 Attitudes to urban growth within the country tend to swing between two extremes. Cities are seen either as an unavoidable evil or in a more positive way as “engines of growth”. The former view is held by those who focus on the growth of slums and squatter colonies, the congestion on the roads and environmental degradation. The others, in contrast, focus on the bustling formal and informal sectors in urban areas and their contribution to the economy, the diversification of occupations away from traditional land-based ones to newer forms of production and services, and the lower levels of poverty as compared to rural areas. (TFYP, 2002: 613)
There has been no urban planning in the broader sense of the term. Except for Kalyani in West Bengal (in the early fifties), Chandigarh in the north and Gandhinagar in Gujarat, no green field planned city has come up in the country not counting the metropolises—induced satellite towns with infrastructural support from state governments and which have become integral part of the big urban agglomeration. Kalyani, which was supposed to share the load of Calcutta spill over, refused to grow into a full-fledged dynamic city for lack of supporting activities and industries. Chandigarh grew into a large beautiful city, but failed to visualise the future needs of service providing workers and their residential needs. The result is that it is now dotted with and surrounded by sprawling slums. Gandhinagar has done relatively better but is now almost a part of the fast growing mega city, Ahmedabad. The so-called urban planning in India has been only a lagged response to problems arising in unplanned urban units, that is, slums, shortage of drinking water, absence of drainage and sewerage, inadequate or non-existent public transport system, and in more recent years, increasing road congestion and air and water pollution. The Jawaharlal Nehru National Urban Renewal Mission (JnNURM) was one such response. However, the small and medium size towns do not get much attention even with reference to these problems.
A number of schemes and programmes for urban poverty alleviation, improvement of urban environment and slums, improvement of urban basic services, urban housing, etc., were launched under various Five Year Plans (Sneha Palitkar, 2009). The JnNURM is the single largest initiative in urban sector. It was launched by Government of India in 2005 with a total outlay of 100,000 crores, and was aimed at strengthening infrastructure and the overall quality of life in the 63 cities listed in the Mission document. The Mission has two sub-Missions: Urban Infrastructure and Governance (UIG) and Basic Services for the Urban Poor (BSUP). The states were required to submit CDPs and later, Detailed Project Reports (DPRs) justifying their request for funding under JnNURM. 15 of the CDPs submitted were analysed by Harini Narayanan and Shipra Bhatia of NIUA (2007). This analysis brings out some interesting points which throw light on the way the state governments look at the urban problems particularly with reference to the urban poor. For example, most of the CDPs identify as an achievement or express the desire for a movement of employment creation opportunities from the primary and secondary sector (particularly manufacturing), to tertiary sector with particular ambition for IT sector development. CDPs show little concern for the implications of such development for the poor and have hardly any plan for job creation for the poor. Cities look for ‘clean’ and ‘modern sector’ development. Growth of informalisation of jobs is acknowledged but there is hardly any plan to remedy the situation. However, cities like Chennai, Coimbatore, Pune and Ludhiana do appear to value their manufacturing growth and would like to push it with better infrastructural support. The Ahmedabad CDP does try to address the issue of unemployment resulting from the decline of textile industry, and it clearly acknowledges ‘the poor contribute to the globalising economy of Ahmedabad as much as the non-poor … without receiving due economic or other civic facilities or services at par with the non-poor’. It includes plans for credit provision for livelihood and shelter building activities for the poor. ‘Many cities discuss the spaces where the poorer sections of the workforce operate only in the context of shifting them out to the periphery of the city’, concludes the policy paper (Narayanan & Bhatia, 2007).
Urbanisation and Poverty
Urban development and its relationship with poverty is an important focus of discussion in this article. We have already drawn attention to the relationship between city size and poverty. Larger cities have generally lower incidence of poverty mainly because of their capacity to generate more of work opportunities for the poor. From the available data one can also discern clear relationship between the extent of urbanisation and the incidence of poverty at the level of states. However, our understanding of the plight of the urban poor will remain totally inadequate unless we also reflect upon the question: who is an urban poor. In this context, a brief discussion of the official methodology of defining poor and an alternative way of identifying urban poor will be quite in place. This is what we do in what follows.
The relationship between the level of urbanisation and the extent of poverty was examined in a paper (Hashim, 2009) with the help of available data for the years 1993–94 and 2004–05, using official poverty estimates released by the Planning Commission. The states were grouped in four categories according to the extent of poverty: Very Low (VL), Low (L), High (H), Very High (VH). The states were also grouped similarly in four categories according to their level of urbanisation. The information was then tabulated into a matrix as shown in Table 5. The matrix shows that higher degree of urbanisation is associated with lower levels of poverty.
Urbanisation and Poverty

As per official estimates issued by Planning Commission (2012), incidence of urban poverty (the Head Count Ratio) in India was 25.7 per cent in 2004–05 and 20.9 per cent in 2009–10. The estimates are based on the methodology recommended by the Tendulkar Committee, according to which the poverty line for the year 2009–10 was ₹860 per capita per month or an expenditure of ₹28.60 per person per day. Doubts have been widely expressed on the efficacy of such a low poverty line, much lower than US$1 ppd, and that too for meeting the cost of living in urban India. It may be noted here that the official estimates of poverty released by the Planning Commission, though have undergone redressing at various intervals, are still rooted in the poverty level consumption basket of 1974–74 which was the basis of the work of the Task Force chaired by Dr Y.K. Alagh in 1979. Redressing of the Alagh poverty line was done mainly in respect of the question as to which basket to be used—whether all-India basket or state-specific basket, and which price indices to be used for indexing the poverty line (Lakdawala Committee), and more recently, whether urban basket or rural basket is more appropriate (Tendulkar Commite). After all these revisions and adjustments of ‘poverty line’ at the base of which was a basket of consumption in 1973–74, one is not sure what basket of consumption it represents today, and whether the basket meets even at the bare minimum level the requirement of a reasonably decent living today. Conditions and patterns of life in urban areas over these last 40 years have changed much more drastically. The revised poverty lines also fall short of the original calorie norms in which they were anchored.
The Copenhagen Declaration (1995) says:
Absolute poverty is a condition characterised by severe deprivation of basic human needs, including food, safe drinking water, sanitation facilities, health, shelter, education and information. It depends not only on income but also on access to social services.
Historically, the poverty lines were drawn around food requirements alone, and that too reduced to the minimum calories needed. Whatever other things the household consumed along with the minimum calorie consumption, was taken as satisfying its total needs of living (Dandekar & Rath, 1971). An implication of the Engel’s law of budget shares is that people rank their necessities for the purposes of allocating expenditure within the constraints of their income. Food expenditure gets the first rank and the highest share in the budget. The point at which just the minimum necessary food requirements (in terms of calories) are met, expenditure on other necessities, like clothing, housing, health and education, etc., must necessarily be at sub-minimum level. Calorie-centric poverty line is deficient in this respect.
The concept and notion of poverty is relative to economic and social conditions and evolution of society’s collective thinking as to what is decent and what is not. Hence, poverty is not comparable over time with a fixed measuring rod.
Another problem with official estimates is that these are only aggregate estimates which tell us the proportion of poor population in a state or in the country. They cannot help to identify the ‘poor household’. Given the need for reaching out to the poor household, efforts started first at state levels, to identify the poor households through a census in rural areas. Initially there were lot of difficulties with the concepts and methods. Ultimately a sort of a consensus has evolved to identify poor households on the basis of a number of ‘vulnerabilities’ which are visible and also easily verifiable in a large scale census operation.
The Planning Commission constituted an Expert Group (under the Chairmanship of the present author) in May 2010 to recommend an appropriate methodology for identification of urban poor.
Taking note of the decision of the Government of India to undertake Socio-Economic and Caste Census (SECC), it was decided to include in SECC questions helpful to identification of urban poor. The questionnaire was prepared by the Expert Group in association with the Ministry of HUPA. The SECC captures the residential status, the physical conditions of the dwelling, the number of rooms occupied, provision of civic amenities, occupational status, employment conditions, health and education, age and social vulnerabilities.
The urban poor suffers from a large number of vulnerabilities which could broadly be grouped under three categories: residential, occupational and social vulnerabilities. The residential vulnerabilities are the most acute for the urban poor. It includes houselessness or a house with roof and wall made of plastic or polythene, grass, thatch, bamboo, mud, unburnt bricks, etc., Lack of water connection or water availability, sewer, drain, electricity, etc., add to these vulnerabilities. The quality of surrounding environment in which the house is located is also important. Among occupational vulnerabilities are begging, rag picking, uncertain employment, irregular source of livelihood, casual work, irregular wage payments, etc. Social vulnerabilities include child headed household, households with all or some members with disability or chronic illness, etc.
The group has recommended a three stage identification process: (a) automatic exclusion, (b) automatic inclusion and (c) scoring index. The methodology has been worked out in details, keeping in view the data which would be available from SEC. However, the data from the census are not yet available, and hence the exact estimate of poverty based on this methodology could not be made. But whatever little data were available on which the proposed methodology could be tested, based on that it appears that the magnitude of urban poverty is much larger than what the official estimates indicate.
Summing Up
Cities have been the centres of advancement of knowledge, industry, culture and civilisation. Urbanisation has been constantly expanding all over the world. The world today is 60 per cent urbanised, while urbanisation in India remains at 31 per cent only. This is mainly because of slow industrial growth and slow rate of overall economic development in India. Since the country is looking forward to higher rates of economic growth and job creation, higher pace of urbanisation is unavoidable.
The pattern of urban growth, which has emerged in the country, is fairly balanced. Also a fairly large part of the country (south and west) has experienced high levels of urbanisation. Within the country, higher level of urbanisation is strongly associated with higher level of economic development. More urbanised states are also better governed states. Amenities and infrastructure in larger towns are better. Conditions in smaller towns is too dehumanising in this respect.
There has been no planning for urbanisation in India, though city plans exist. Urban poor hardly finds a place in city plans. Cities look for ‘clean’ and ‘modern sector’ development. Growth of informalisation of jobs is acknowledged but there is hardly any plan to remedy the situation.
There is relationship between city size and poverty. Smaller towns have larger incidence of poverty almost at par with the incidence of poverty in rural areas. Level of urbanisation and extent of poverty are negatively correlated and state level also. In this context it needs to be noted that the method of estimating poverty (the official method) is quite faulty at present, and there is no method of identifying an urban poor household. A methodology has been proposed which is based on residential, occupational and social vulnerabilities of the urban poor, and which can be applied to data from SECC. SECC data are not yet available. But testing the data on some available data, it is surmised that the extent of urban poverty is much larger than the official estimates.