
Abstract
In order to investigate the advantage of mixed-mode (MM) surveys, selection effects between the modes should be evaluated. Selection effects refer to differences in respondent compositions on the target variables between the modes. However, estimation of selection effects is not an easy task because they may be completely confounded with measurement effects between the modes (differences in measurement error). Publications concerning the estimation of these mode effects are scarce. This article presents and compares three methods that allow measurement effects and selection effects to be evaluated separately. The first method starts from existing publications that avoid the confounding problem by introducing a set of mode-insensitive variables into the analysis model. However, this article will show that this method involves unrealistic assumptions in most practical research. The second and the third methods make use of an MM sample extended by comparable single-mode data. The assumptions, advantages, and disadvantages of all three methods are discussed. Each method will further be illustrated using a set of six variables relating to opinions about surveys among the Flemish population. The results show large differences between the methods.
Introduction
Mixed-mode (MM) surveys are surveys in which data from different respondents are collected by different data collection modes (e.g. Computer-Assisted Personal Interviewing [CAPI], Computer-Assisted Telephone Interviewing [CATI], Mail Self-Administered Questionnaires [MSAQ′s], or Web Self-Administered Questionnaires [WSAQ′s]). Such survey designs are increasingly used to collect data from large populations (Börkan 2010; de Leeuw 2005; Hayashi 2007; Roberts 2007) because they might be advantageous over single-mode surveys for two reasons (Biemer 2001; de Leeuw 2005; Dillman, Phelps, et al. 2009; Voogt and Saris 2005). First, MM surveys may reduce nonresponse error because certain sample members with particular mode preferences might be willing or be able to respond to the MM survey, while they might not be willing or not be able to respond to a single-mode survey. In this case, the MM survey offers greater (external) validity than the single-mode survey. Second, MM surveys may lower the total survey cost or increase statistical power because some respondents respond by a cheap mode. In this case, the MM survey increases the (external) reliability of the data compared with the single-mode survey.
Both reasons show that, in order to determine whether MM surveys are advantageous over single-mode surveys, differences in selection error between the modes should be evaluated. Selection error occurs when the sample is not fully representative of the population on the target variables. The difference in selection error between the modes is called the selection effect. Selection effects thus refer to differences on the target variables between the respondents allocated to the different modes of the MM design. If selection effects are absent, an alternative single-mode design exists providing data with equal representativeness at lower costs compared with the MM design.
However, evaluating selection effects in MM data is difficult because they may be completely confounded by another type of mode effects, that is, measurement effects (de Leeuw 2005; Dillman, Smyth, and Christian 2009; Voogt and Saris 2005; Weisberg 2005). Measurement effects are differences in measurement error accompanying different survey modes (Voogt and Saris 2005; Weisberg 2005). Put differently, measurement effects occur when the answers of the same respondents differ across modes. As a consequence, differences between the respondents of the different mode groups may be either due to differences in respondent characteristics (i.e., a selection effect) or due to different measurement of responses (i.e., a measurement effect). Ideally, no measurement effects should occur because they may counteract the advantageous effect of selection effects and preclude comparability with other survey data.
The existing literature pays relatively little attention to disentangling selection effects from measurement effects. This article aims to fill this gap by presenting and illustrating three different possible procedures to evaluate both mode effects separately. The third section describes these three methods and examines their underlying assumptions, advantages, and disadvantages. One of these methods solely relies on an MM data set, whereas the other two make use of an additional single-mode comparative sample. In the fourth section, we will compare the mode effects estimates of all three methods on 6 items relating to opinions about surveys. However, we start this article with an overview of some workable formal definitions of mode effects.
Defining Mode Effects
The existing literature on MM surveys does not provide any formal definitions of mode effects. This section will fill this gap by providing some possible formalizations. For simplicity, we restrict the number of survey modes to two, referred to as mode
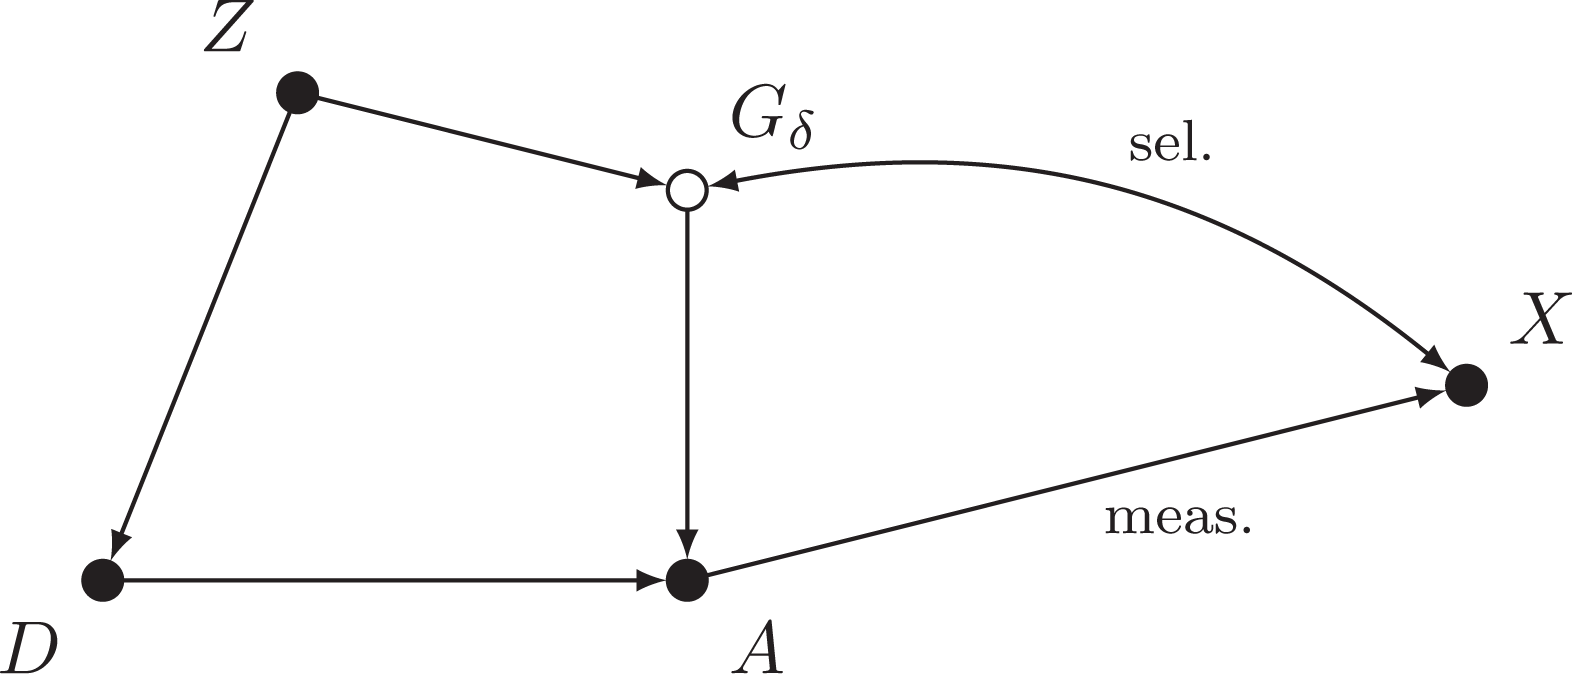
The problem of MM surveys relates to the statistical literature on causal inference (Morgan and Winship 2009; Pearl 2009; Weisberg 2010) and can be represented by graphs (Pearl 2009). Figure 1a summarizes the process underlying survey data within the ideal situation where the responses of all respondents are observed in both modes.

Process underlying data in a mixed-mode context. (a) When all modes are observed for all respondents. (b) In a mixed-mode data set.
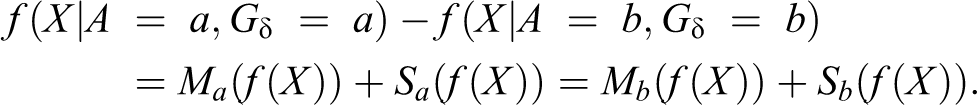
The marginal measurement effect on a function

However, within MM data, the researcher might only be interested in a measurement effect conditional on the mode group

and

Depending on the interest of the researcher, one of these three formulas can be chosen to evaluate the measurement effect.
Likewise, the selection effect can be defined in three ways. The marginal selection effect can be defined as the difference between both mode groups:

However, it makes more sense to condition the selection effect on the mode of administration

and

Once again, the analyst can choose any of these three definitions according to his needs.
Ordinary MM data, however, do not allow estimation of selection effects and measurement effects when only variables
In this equation, the conditional measurement and selection effects however are unknown because they require estimating
Three Methods to Evaluate Selection Effects and Measurement Effects
This section discusses three methods to disentangle selection effects from measurement effects. The first method, MM Calibration, starts from the existing MM literature which usually tries to control for mode-insensitive variables in order to neutralize selection effects. However, we will argue that the assumptions of this method are probably unrealistic in most practical situations. The second method, Extended MM Comparison, avoids the assumptions of the first method by comparing MM data with comparable single-mode data. The third method, Extended MM Calibration, in turn, tries to estimate the mode effects by predicting the mode group of the respondents in the single-mode data set if they had been sample members of the MM data set.
Method 1: MM Calibration
Existing research into mode effects reported in the literature generally tries to avoid confounding of mode effects in ordinary MM data sets by rendering both mode groups comparable on a set of variables
The introduction of

Analysis model for mixed-mode data controlled for mode-insensitive variables
First, there is no arrow between
Second,
In most practical situations, these assumptions are probably problematic because it is very difficult to find a set of mode-insensitive variables which explain the relation between
Method 2: Extended MM Comparison
A main problem of MM Calibration is the perfect relation between
Analysis model for mixed-mode data combined with comparative single-mode data.
However, the use of an instrumental variable also starts from two assumptions which are reflected by the lack of arrows in the graph (Vannieuwenhuyze et al. 2010). First, there is no direct relation between
Second, there is no direct relation between
The measurement equivalence assumption and representativity assumption have the advantage that they allow estimating the conditional selection effect
Method 3: Extended MM Calibration
Unfortunately, the Extended MM Comparison method cannot cope with MM designs involving more than two modes if only one single-mode comparative sample is available. In that case, the method only allows us to compare the mode of the comparative sample with the combination of the other modes (see Vannieuwenhuyze et al. 2010). It is impossible to disentangle mode effects between the comparative mode and one single noncomparative mode on one hand or between the noncomparative modes on the other hand, even though they may exist.
The third method, which also makes use of the comparative sample, can cope with more than two modes in the MM sample. This method starts from the observation that the values of
Like the Extended MM Comparison method, Extended MM Calibration relies on the measurement equivalence assumption and the representativity assumption, using the comparative data to draw conclusions about mode effects in the MM data. This method also requires the ignorable treatment assignment assumption and the mode-insensitivity assumption of the
An Illustration Using a Survey on Surveys
Data
Mixed-Mode and Comparative Dataset
The illustrating data stem from a survey about respondents’ opinions about surveys, organized in 2004 in Flanders, Belgium, by the Survey Methodology Research Group of the Centre for Sociological Research, KU Leuven. In this survey, a sequential MM design was used consisting of a mail questionnaire as the main mode and a face-to-face (FTF) interview as the follow-up mode (Storms and Loosveldt 2005).
The sample consisted of 960 Flemish persons aged between 18 and 80 sampled from the national register. The mail questionnaire was presented as a survey about opinion polls in Flanders and asked respondents for their opinions on surveys. Because the use of cash incentives was not allowed, a €5 gift voucher was used as an incentive for returning the questionnaire. The survey started on October 18, 2004; a first reminder was sent by mail two weeks later, and a second reminder—accompanied by a new questionnaire—was sent four weeks after the first reminder. The mail survey phase lasted two months. In a second phase, nonrespondents to the mail survey were recontacted by an interviewer for a FTF interview. Nonetheless, this FTF follow-up was unknown to the sample members during the initial mail phase.
Besides the MM data set, the survey design also included a small comparative sample of respondents who were only invited to participate in a FTF interview. This sample consisted of 240 persons, and the survey questionnaire and data collection strategy were equal to the second phase of the MM group, except that the respondents did not receive the mail questionnaire first.
Because the aim of our article is to compare different techniques to separate selection effects from measurement effects rather than to make judgments about the population, the analyses will only include those respondents who responded to all the variables listed below. Partial responses are thus considered as nonresponse. If we only consider full responses, the initial mail phase of the MM design reached a response rate of 47.2 percent, which the FTF follow-up increased to 66.6 percent, a relatively high response rate for a general population survey. The comparative sample had an even higher response rate, namely 69.5 percent. An overview of all response rates can be found in Table 1.
Response Frequencies and Response Rates.
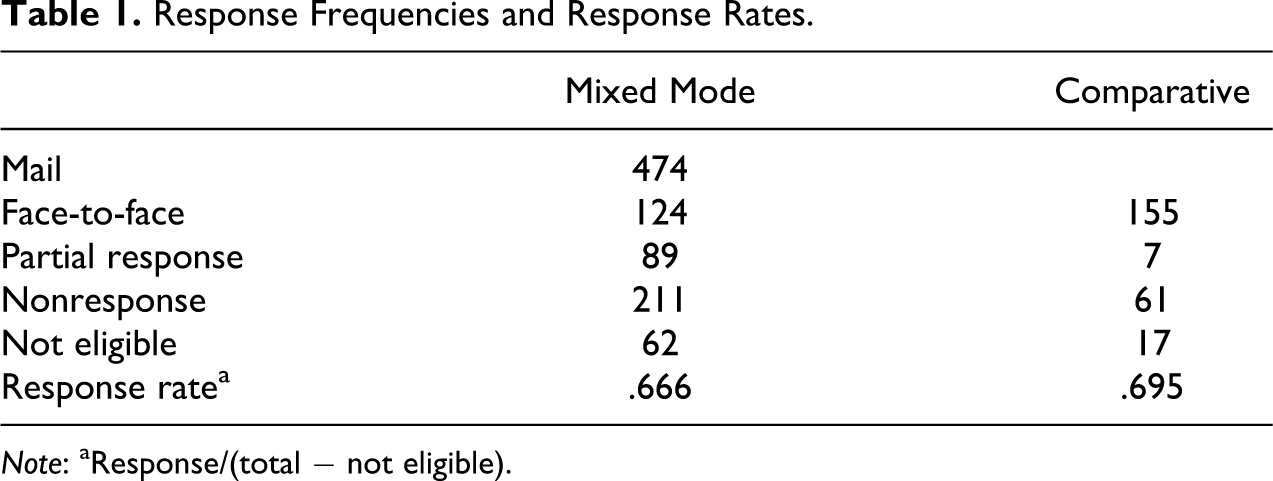
Note: aResponse/(total − not eligible).
Variables
We analyzed mode effects on the means of six target variables, each measuring a certain dimension of a short scale representing the respondents’ opinions about surveys (Loosveldt and Storms 2008). This scale includes four dimensions, namely survey enjoyment, survey value, survey cost, and survey privacy. An overview of these dimensions and the corresponding items can be found in Table 2. For all 6 items, respondents could indicate agreement on a 5-point Likert-type scale ranging from completely disagree to completely agree. In the mail questionnaire, these answer categories were listed horizontally in a table but a “don’t know”/“no opinion” option was not provided. In the FTF interviews, the response categories were read out by the interviewer and presented vertically on a showcard, again excluding “don’t know” and “no opinion” options. For the analyses, all items were rescaled such that high values indicate positive opinions and low values indicate negative opinions about surveys.
Opinions About Surveys Items and Their Means in the Three Sample Groups.
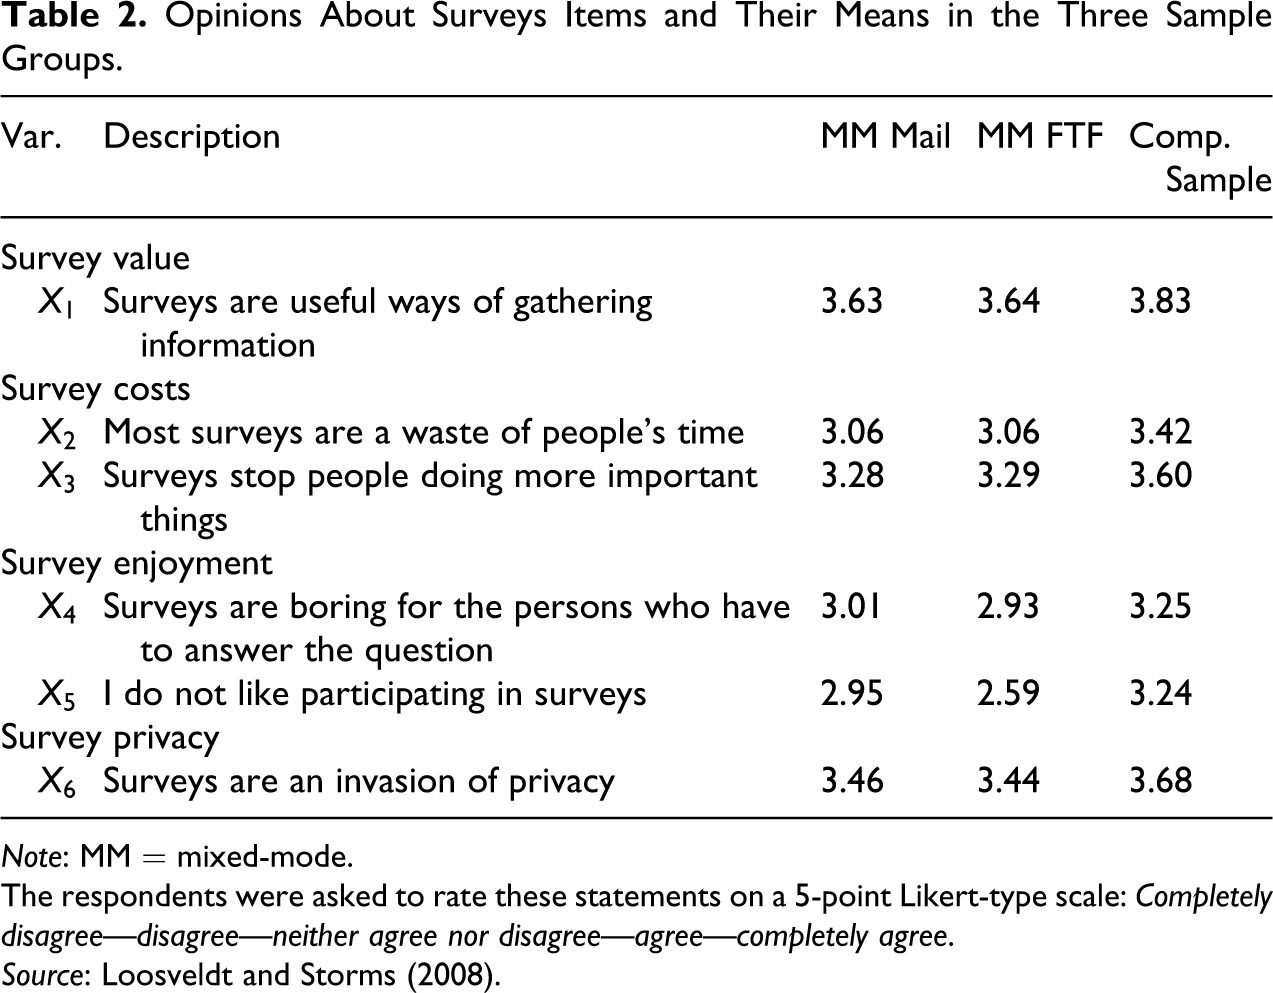
Note: MM = mixed-mode.
The respondents were asked to rate these statements on a 5-point Likert-type scale: Completely disagree—disagree—neither agree nor disagree—agree—completely agree.
Source: Loosveldt and Storms (2008).
The particular topic of the survey and the opinion questions might cause selection effects and measurement effects on the means because “employing an instrument to measure its own performance is immediately contradictory” (Goyder 1986:28). First, there might be selection effects, as nonrespondents to the mail questionnaire in the MM sample are likely to be more negative about surveys (Loosveldt and Storms 2008). The mail group data confirmed this expectation: the later a mail questionnaire was returned, the lower the mean opinion score on all six opinion variables (table not included).
Second, we also expect measurement effects as respondents interviewed FTF will probably tend to report more positive opinions about surveys (Dillman, Phelps, et al. 2009; Loosveldt and Storms 2008). The mere presence of the interviewer may lead respondents to give socially desirable answers. Consequently, the positive answers obtained in the FTF follow-up may not reflect the respondents’ real opinions. In contrast to the mail survey, FTF interviews introduce a serious risk of measurement error, which results in a measurement effect (Dillman, Smyth et al. 2009; Voogt and Saris 2005). Again, the data suggest the presence of measurement effects: as Table 2 shows, the mean opinion score in the comparative group is larger than the mean scores in both MM groups for all six variables. If measurement effects were absent, we would expect the mean of the comparative group to fall between the means of the MM groups.
The set of mode-insensitive variables
Discussion of the Assumptions
Mode-Insensitivity of the
Variables
Measurement effects are unlikely to occur between an FTF interview and a mail questionnaire on variables such as gender, age, the number of household members, or ownership of an e-mail address. However, this is less obvious for variables such as educational level and job status. Faced with an interviewer, respondents might tend to overstate their educational attainment and to report themselves as employed because they find these questions embarrassing (Lee and Renzetti 1990; Tourangeau and Yan 2007). Nevertheless, we include these variables because the evidence of mode-sensitivity is weak and because these variables are often included in previous studies.
Ignorable Treatment Assignment Assumption
The ignorable treatment assignment assumption is hard to check. Some insights can however be given by a logit regression of
Measurement Equivalence Assumption
The validity of the measurement equivalence assumption cannot be checked because this would require comparing FTF responses between the MM data and the comparative data for identical respondents. Such a comparison is impossible because all respondents belong to only one of both data sets. Hence, this assumption should be taken as being true. The design could provide an argument against this assumption because respondents in the FTF follow-up phase might be annoyed to be recontacted. A possible consequence might be that these respondents are more prone to satisficing or become more negative about surveys.
Representativity Assumption
The representativity assumption cannot be checked directly because
Nevertheless, some arguments can be put forward in favor of this assumption (Vannieuwenhuyze et al. 2010). First, there is a theoretical argument. The main objective of the MM design was to collect data from as many sample units as possible at the lowest possible price while maximizing representativeness, and, for that reason, the sequential mail-CAPI design was chosen. Indeed, a mail survey is considered a cost effective and simple mean of obtaining data from a large sample, while the more expensive FTF survey is used to increase the response rate and the representativity of the initial mail phase, as FTF interviews generally yield lower nonresponse (de Leeuw 2008; Roy and Berger 2005). So, we can assume on theoretical grounds that the MM data are more reliable but equally valid compared with the comparative data, and this is equivalent to the representativity assumption.
Second, if both data sets contain a similar set of population members, both samples should have similar response rates. This is confirmed by the data, as the difference between the response rates is only 2.9 percent points, which is not significant (SE
Finally, both data sets can also be compared on their composition of the mode-insensitive variables
Results and Discussion of the Illustration
In this section, we report the estimated mode effects on the means for all three methods. This illustration is restricted to mode effects
Comparison of the Methods
The results of the mode effects estimates can be found in Table 3. Bearing in mind that the range of all opinion items goes from one to five, the estimates of the MM Calibration method (method 1) are not large at all and, as a consequence, neither the selection effects nor the measurement effects appear to be statistically significant except for the measurement effect on
Mode Effect Estimates on the Means of the Three Methods.
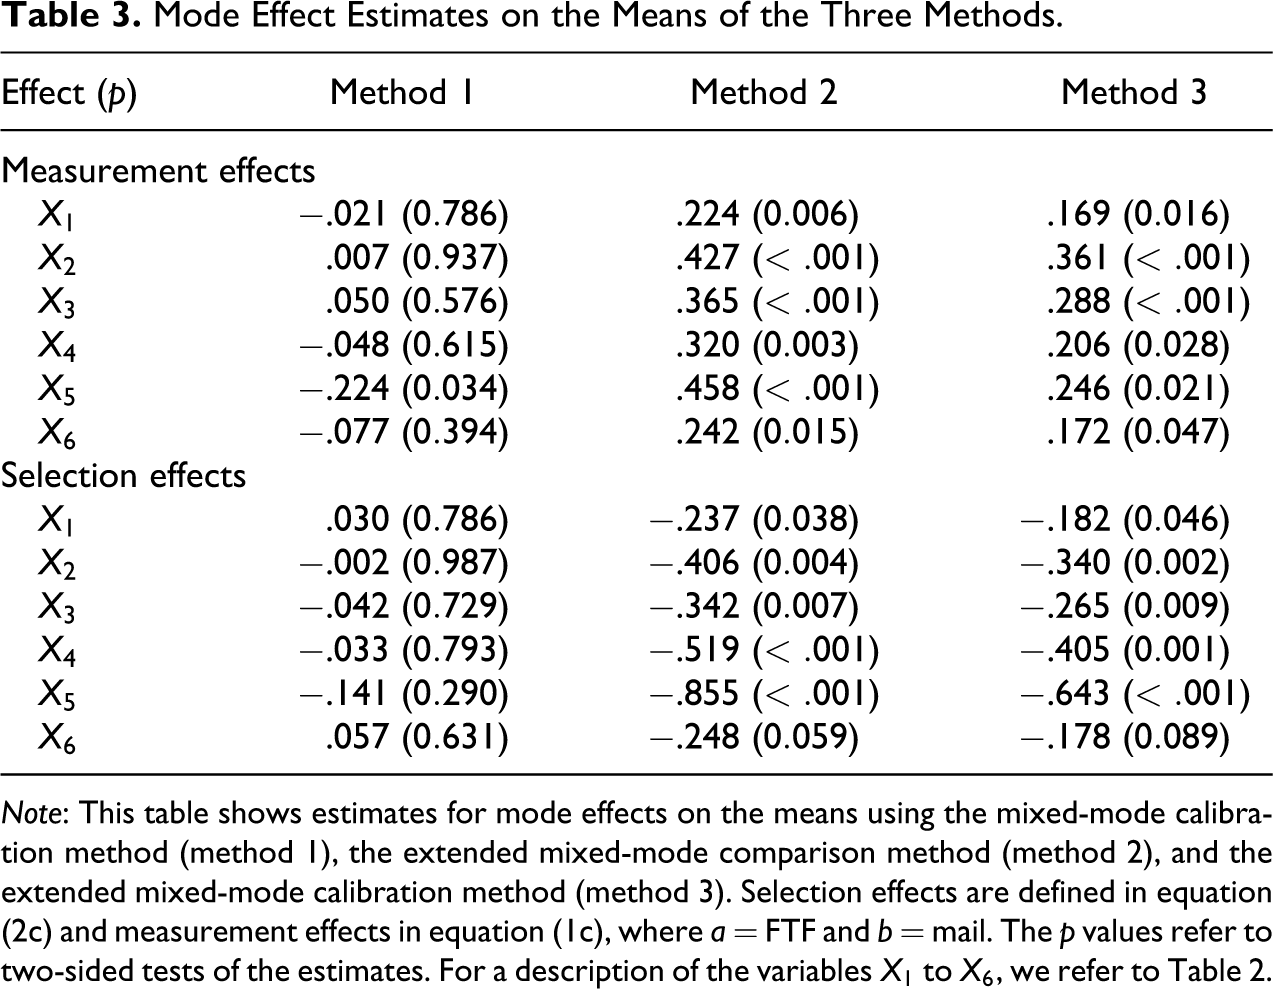
Note: This table shows estimates for mode effects on the means using the mixed-mode calibration method (method 1), the extended mixed-mode comparison method (method 2), and the extended mixed-mode calibration method (method 3). Selection effects are defined in equation (2c) and measurement effects in equation (1c), where
In contrast to the MM Calibration method, the Extended MM Comparison method (method 2) yields much larger mode effects, which are in line with our expectations. As a consequence, one-sided tests can be used showing that all mode effects are significant at a 95 percent confidence level. The positive measurement effects mean that a FTF interview generally measures a more positive attitude compared to a mail questionnaire. Concerning the selection effects, the negative estimates indicate that the respondents responding to the mail questionnaire are more positive toward a survey than the respondents who were reached in the FTF follow-up phase. Remember, however, that the inferences rest on normal approximations and this might be a problem because the sample sizes are rather small.
Finally, the mode effect estimates of the Extended MM Calibration method (method 3) are considerably larger than those yielded by the MM Calibration method (method 1), but smaller than the estimates obtained in the Extended MM Comparison method (method 2). The latter observation probably arises from the fact that, unlike the Comparison method, the Extended MM Calibration method requires the ignorable treatment assignment assumption. Violations of this assumption may result in underestimations of the mode effects. However, as in the Extended MM Comparison method, all measurement effects are positive and all selection effects are negative. These estimates are thus in line with expectations. Further, all estimates are significant on a one-sided 95 percent confidence level. This method therefore leads to the same conclusions about the existence of selection and the measurement effects as the Extended MM Comparison method.
Interpretation of the Results
Let us now interpret and discuss the mode effects estimates and draw conclusions. Mode effects estimates can be easily interpreted by just applying their definitions in equations (1c) and (2c). The measurement effect on item
Further, the items about survey enjoyment (
The presence of selection effects in the Extended MM methods points to an advantage of using a sequential mail-FTF design over a single-mode mail or FTF design. If the assumptions of the Extended MM Comparison method hold, the MM design should provide more reliable data with respect to the composition of respondents compared to single-mode FTF data within the same cost constraints. Likewise, the MM data should have a more valid respondent composition than data obtained in a single-mode mail design. In order to determine the exact benefit of the MM design compared with single-mode designs, the relative costs of the modes should be taken into account. This exercise, however, is beyond the scope of this article.
A better composition of respondents in the MM sample, however, does not necessarily mean that the overall data quality of the MM design is better as well. This is only the case if measurement effects are minor. In our example, we found significant measurement effects which might undermine the advantage of the MM design. Nonetheless, the counteracting effect of these measurement effects is difficult to determine because this would require the unobserved “true” opinions of the respondents. An alternative starting point might be to take the mail questionnaire data as a benchmark, because this mode is argued to introduce the smallest measurement error. However, as such analyses require additional assumptions about generalizations of the mode effects estimates, we leave these to future studies.
To conclude this illustration, we want to remark that the estimated mode effects cannot simply be generalized to any MM design combining a mail survey and an FTF interview. Indeed, the definitions of the mode effects
General Discussion
The aim of this article was to compare and illustrate three methods that can be used to disentangle measurement effects and selection effects in MM data. The MM Calibration method, which is usually reported in the existing literature, starts from a MM sample and matches the different mode groups on a set of mode-insensitive variables. The Extended MM Comparison method and the Extended MM Calibration method start from MM data extended by a comparable single-mode sample. All three methods have their advantages and disadvantages, which will be discussed in this section. An overview of their characteristics can be found in Table 4.
Comparison of the Three Methods to Evaluate Mode Effects.
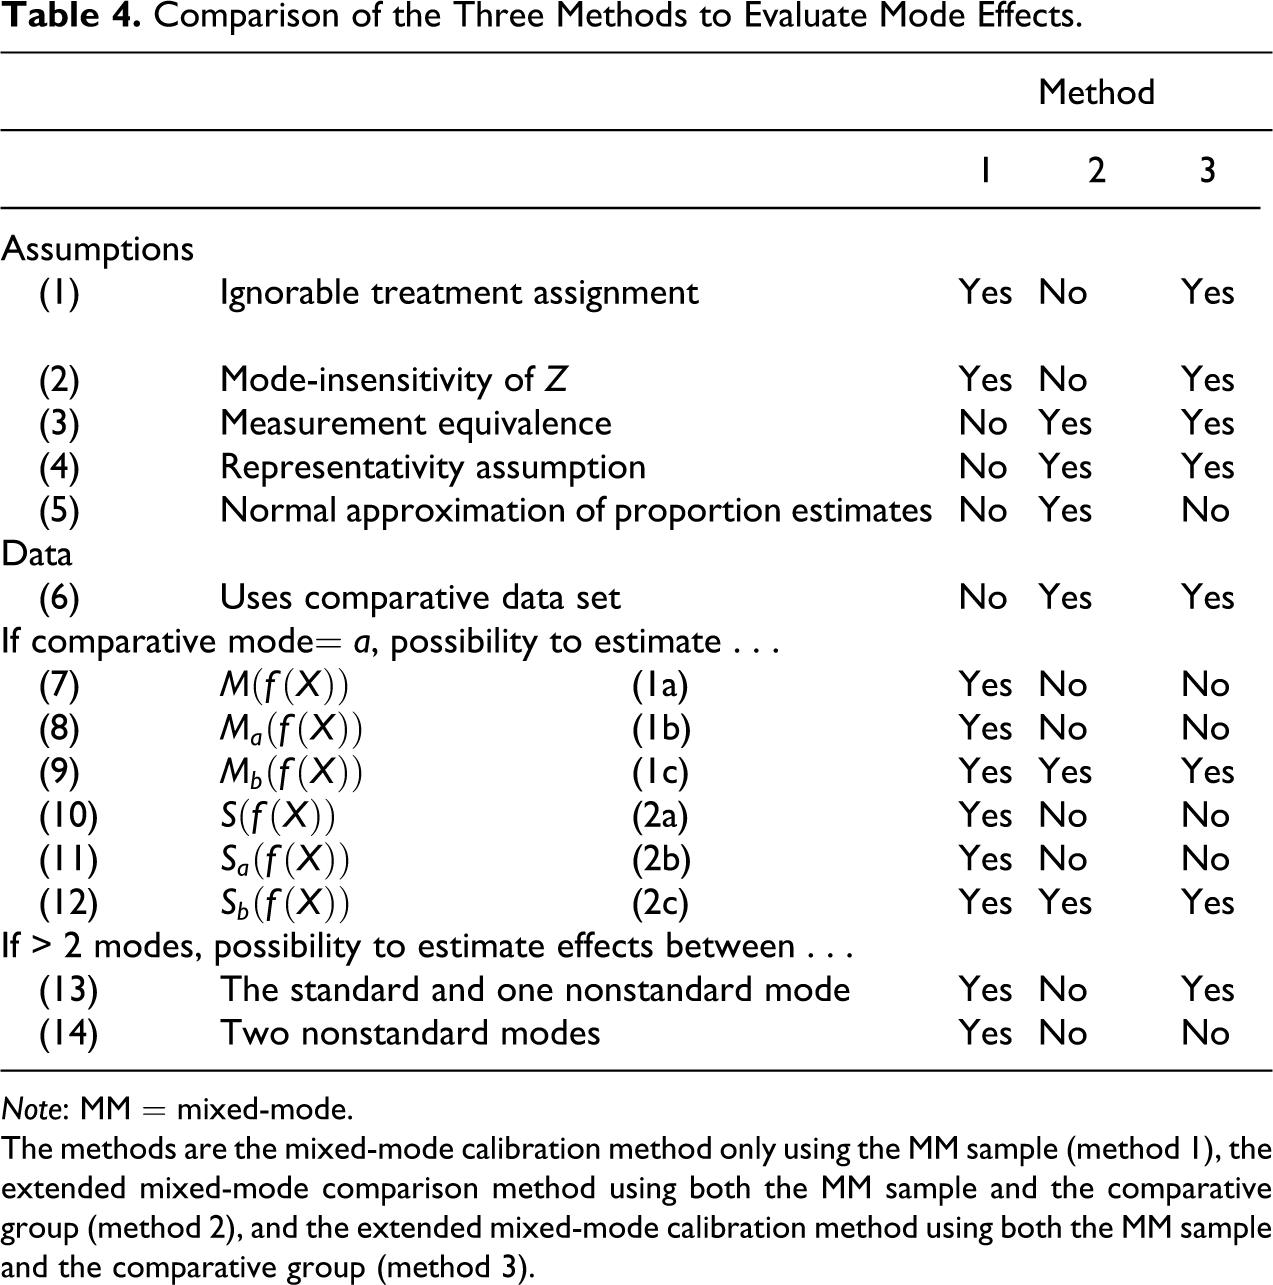
Note: MM = mixed-mode.
The methods are the mixed-mode calibration method only using the MM sample (method 1), the extended mixed-mode comparison method using both the MM sample and the comparative group (method 2), and the extended mixed-mode calibration method using both the MM sample and the comparative group (method 3).
Because of its simplicity, the MM Calibration method is very flexible as it only requires a MM data set and it allows mode effects to be evaluated between all modes. The Extended MM methods require additional comparable single-mode data meeting specific requirements and do not allow evaluating mode effects between all modes. The Extended MM Calibration method only allows mode effects to be separately measured between the comparative mode and each other mode, while the Extended MM Comparison only allows mode effects to be measured between the comparative mode and a combination of the other modes. Further, in the Extended MM methods, it is not possible to calculate the mode effects as defined in equations (1a), (1b), (2a), and (2b) because all these definitions require an estimate of
However, even though MM Calibration is a very flexible solution to disentangle mode effects, it may come with some serious problems because it starts from unrealistic assumptions. Indeed, in practice it is very difficult to find a set of mode-insensitive variables that can explain the selection effect in a satisfactory way, although this is required by the ignorable treatment assignment assumption. The survey on surveys example of this article reveals the impact of the MM Calibration method on the mode effects estimates. Almost none of the mode effects estimates on a set of six variables about opinions about surveys were significant using this method, even though we can reasonably assume the survey topic to be extremely susceptible to mode effects. Moreover, the Extended MM Comparison and Extended MM Calibration methods did yield significant selection and measurement effects on almost all variables. This suggests that MM Calibration is insufficient to detect measurement effects and selection effects in MM data. The Extended MM Comparison and the Extended MM Calibration methods seem to be valuable alternatives provided that a comparative single-mode sample is available. We should remark, however, that the survey on surveys data probably forms an atypical example of regular MM survey data. The validity of the assumptions must always be evaluated thoroughly when using other MM data. Further research should be done on the stringency of the assumptions and the applicability of the methods under different circumstances using, for example, a simulation study and sensitivity analysis.
Footnotes
Acknowledgments
The authors like to thank Geert Molenberghs for his helpful suggestions. This article was awarded the 2011 European Survey Research Association (ESRA) award for best paper by an early career researcher.
Declaration of Conflicting Interests
The author(s) declared no potential conflicts of interest with respect to the research, authorship, and/or publication of this article.
Funding
The author(s) disclosed receipt of the following financial support for the research, authorship, and/or publication of this article: The authors received financial support from the Flemish Research Council (FWO) for the data collection.