
Abstract
This study applies ordinal confirmatory factor analysis for multiple groups to assess equivalence of scale, random errors and systematic (nonrandom) errors of attitudinal questions surveyed on rating scales under different survey modes (Face-to-Face [F2F], Telephone, Paper, and Web). Empirical findings from a large-scale experiment are presented. Consistent with theoretical expectations, interviewer- and self-administered surveys measured all assessed questions on systematically different scales, with different systematic bias, and with differing extents of random error. These measurement effects were absent when comparing Paper with Web or F2F with Telephone. It is concluded that modes impact primarily systematic measurement effects affecting multiple items equally. Interviewer- and self-administered modes should only be combined with great care in mixed-mode surveys that focus on attitudinal constructs. Combining Paper and Web or Telephone and F2F are the viable options. Thereby choosing the self-administered modes appears more efficient, because these modes exhibited higher indicator reliabilities (smaller random error) than the interviewer modes.
Keywords
Introduction
Analysts of data generated by different modes of data collection, like Face-to-Face (F2F), Telephone, Paper and Pencil, or online (Web), need to be sure that answers to the same questions asked under different modes are equivalent. This concern has gained increased prominence in the context of cross-sectional or longitudinal mixed-mode surveys, in which two or more survey modes are combined concurrently or sequentially to maximize response rates and to optimize on costs (de Leeuw 2005; Dillman, Smyth, and Christian 2009; Dillman, Phelps, et al. 2009). There are in fact strong theoretical arguments that social and cognitive factors impact the answering processes to very different extents (Tourangeau, Rips, and Rasinski 2000; Bowling 2005; de Leeuw 2008; Dillman, Smyth, et al. 2009:311-29). A sizable body of empirical studies has assessed measurement effects of survey modes, also referred to as mode effects, from mainly two perspectives. The “sampling statistics approach” seeks to assess measurement effects by testing differences in marginal means and, more rarely, variances of separate questions (e.g., Schonlau et al. 2004; Link and Mokdad 2005). The “answering behavior approach” considers differences in indicators of answering behavior, such as acquiescent, extreme, nondifferentiated, socially desirable or “don’t know” (DK) answering (de Leeuw 1992; Holbrook, Green, and Krosnick 2003; Fricker et al. 2005; Christian, Dillman, and Smyth 2008; Greene, Speizer, and Wiitala 2008; Chang and Krosnick 2009).
In this article, we follow a third approach to studying measurement effects of modes on attitudinal questions that defines equivalence as independence of answers to a question from a survey mode conditional on latent true scores (Mellenbergh 1989; Meredith 1993; Millsap 2011). This definition implies that two persons with the same true state on the concept of interest give a particular answer with the same probability when asked under different modes. A model-based approach using ordinal multiple-group confirmatory factor analysis (MCFA) is applied to describe how modes impact this probability differentially, referred to as measurement effects (Jöreskog 1971; Bollen 1989; Skrondal and Rabe-Hesketh 2004; Alwin 2007; Kankaraš, Vermunt, and Moors 2011; Millsap 2011).
A limited number of prior studies have used continuous MCFA approaches to study mode equivalence (de Leeuw, Mellenbergh, and Hox 1996; Buchanan, Johnson, and Goldberg 2005; Cole, Bedeian, and Feild 2006; Deutskens, de Ruyter, and Wetzels 2006; de Beuckelaer and Lievens 2009). One potential problem of this literature is that the ordinal measurement level of the attitudinal questions generally is not taken into account. Continuous MCFA models then are error prone in the detection of measurement effects because ordinal data violate distributional assumptions (Alwin 2007; Kankaraš et al. 2011; Millsap 2011:26-37). More sensible alternative model choices are latent trait models using appropriate link functions (e.g., probit as in ordinal MCFA) or categorical latent traits (Meade and Lautenschlager 2004; Kankaraš et al. 2011; Kim and Yoon 2011). Ordinal MCFA, applied in the present study, can be considered a generalization of polytomous item response theory (IRT) models allowing estimation of error variance, which is not possible in IRT (cf. Statistical Methodology and Assumptions section; Muthén 1984; Muthén and Asparouhov 2002; Millsap and You-Tein 2004; Kamata and Bauer 2008; Muthén and Muthén 2010; Millsap 2011:122-24).
Another limitation of prior work is neglecting to take selection effects of modes into account. Practical implementations of mode experiments have shown that sample compositions often are not homogeneous, across conditions, even if randomization is used (e.g., Dillman, Phelps et al. 2009). This causes a counterfactual situation (Morgan and Winship 2007), in which it is unknown, whether an observed measurement effect is caused by the mode or the selection process (Jäckle, Roberts, and Lynn 2010; Vannieuwenhuyze and Loosveldt 2013). We apply a propensity score adjustment method in the estimation of the ordinal MCFA model to control for the selection problem.
MCFA allows estimating three types of measurement effects. First, modes may cause differences in the scale of a given item that is sensitive to mode by altering the relationship of the true score and the observed answer, that is, in expectation the same respondent would not give the same answer when asked under different modes (Vandenberg and Lance 2000; Millsap 2011:5-7). Second, modes may change the extent of random measurement error of an item sensitive to mode implying differential reliability (precision) and thus attenuated relationship estimates, though the answer probabilities are unbiased (e.g., Fuller 1987; Biemer and Stokes 1991). Third, a previously rather neglected advantage of MCFA is estimation of relative differences in the extent of systematic error across sets of questions, also called nonrandom errors, correlated errors, and method variance (Blalock 1970; Andrews 1984; Gerbing and Anderson 1984; Saris and Andrews 1991; Green and Citrin 1994; Davis 1997; Alwin 2007:41-42). These are person- and method-level sources of systematic bias and systematic variance affecting all indicators equivalently.
The MCFA approach thus allows additional insights over the sampling statistics and the answering behavior approaches. Marginal analyses of means and variances can neither distinguish item-specific scale bias from systematic bias nor can item-specific random error be differentiated from true score variance and nonrandom error variance. The answering behavior approach, furthermore, has described many types of behaviors, but cannot estimate their statistical effects. Answering behaviors are likely causes of systematic error, however. For example, nondifferentiation (Krosnick 1991) or acquiescence (Billiet and McClendon 2000) are causes of systematic bias and variance not accounted for by the true score. MCFA thus establishes a model-based link between the answering behavior and the sampling statistics approaches.
In practice, it is very relevant to know whether measurement effects are item-specific or systematic phenomena. Presence of different extents of systematic error signifies different relationships of true score and observed answers of all items and hence systematically incomparable modes. Such a difference would indicate, for example, that wording and topic of a question are less important in influencing measurement effects. However, if measurement effects only concerned single items, these could be taken into account in design, for example, by changing wording, or in analysis, for example, by allowing for partial nonequivalence or by indicator omission from analyses that require pooling of data across modes.
Our data stem from a large-scale mode experiment based on a probability sample from the general population of the Netherlands implying high external validity (gross n = 8,800). Earlier MCFA studies mainly considered special interest groups. 1 Furthermore, the data allow a comparison of the four major survey modes (F2F, Telephone, Paper, and Web). In prior literature, pairwise comparisons of Web and Paper modes prevailed.
We proceed by our expectations about measurement effects in the second section, followed by a description of our experimental data in the third section. The fourth section introduces the technical background of the methodology. The fifth section presents results on three scales. We discuss and conclude by the sixth section.
Expectations About Measurement Effects of Modes
Historically, a prominent cause of measurement effects of modes was rooted in different traditions of questionnaire design. To eliminate this alternative explanation, researchers should apply “unified designs” of questions across modes suggesting, for example, equal wording of questions and labeling of answer scales (Dillman, Smyth et al. 2009:321-29). Any remaining effects of factors that cannot be equalized are usually attributed to mode (cf. Groves et al. 2010:160-62), of which there are two major ones.
First, the social situation during the answer process naturally differs caused by the presence of an interviewer, in Telephone or F2F modes, or its absence, in self-administered Paper and Pencil or Web modes (Tourangeau, Rips, and Rasinski 2000:289-312; Bowling 2005; de Leeuw 2008; Dillman, Smyth et al. 2009:311-14). A well-known consequence of this is socially desirable answering in interviewer-administered surveys. But interviewers can also provide motivation in the answer process and throughout the interview, can probe answers, clarify, and reassure that respondents focus on the interview. These aspects can enhance attention and depth of cognitive processing. Interviewers, however, are in control of the pace of the interview and the order of questions (Holbrook et al. 2003; Bowling 2005). This may not give respondents sufficient time to consider answers thoroughly. Especially from telephone surveys it is known that respondents may feel pressured to answer questions, because pauses are perceived as undesirable (de Leeuw 2008). Conversely, self-administered surveys allow a self-chosen pace and order in an anonymous situation, but lack interactive advantages of motivation and clarification.
The second major difference lies in primarily aural or primarily visual communication of questions and answers (Tourangeau 2000:289-312; de Leeuw 2008; Dillman, Smyth et al. 2009:314-20). In aural-based modes, question and answer categories need to be fully memorized, whereas in visual modes respondents can reread question elements multiple times. These tasks pose very different cognitive demands and burden (Bowling 2005; Fricker et al. 2005; Greene et al. 2008; Heerwegh and Loosveldt 2008). This difference in cognitive stimulus is likely to impact the full answer process.
On the surface, interviewer modes, like Face-to-Face (“F2F” in the following) or Telephone, have very similar measurement properties, because interviewers are present, and they both rely on aural information transmission (supposing no visual elements are used in F2F, as in our study). Self-administered modes, like Web and Paper and Pencil (“Paper” in the following), are similar due to self-administration and reliance on visual information transmission. Consequently, the measurement processes of interviewer- and self-administered modes differ strongly. It can therefore be generally expected to find small or no measurement effects when comparing Telephone with F2F (Hypothesis 1a) and Web with Paper modes (Hypothesis 1b), respectively. Moreover, measurement effects should primarily be present between the two interviewer- and self-administered modes (Hypothesis 2). We posit these hypotheses for questions’ scales as well as random measurement errors.
In empirical studies using MCFA modeling Hypothesis 1a has been supported in the comparisons of Web- and Paper-based surveys, which found these modes to be fully equivalent (Buchanan et al. 2005; Cole et al. 2006; Deutskens et al. 2006; de Beuckelaer and Lievens 2009). Yet, since the populations of these studies were rather specific (employees in national or international businesses), external validity is not fully assured. De Leeuw and colleagues (1996) additionally assessed equivalence with respect to interviewer modes based on a national random digit dialing survey with Telephone, F2F, and Paper modes. They find nonequivalence across all modes, in particular between Paper and the two interviewer modes (consistent with Hypothesis 2), but also the Telephone and F2F modes were not fully equivalent. The study by de Leeuw et al. thus points to a potential challenge to Hypothesis 1b. For an indication about random error differences across modes, we refer to a meta-analysis of multi-trait-multi-method (MTMM) literature by Saris and Gallhofer (2007). The authors report that reliability of measurement differs between interviewer- and self-administered surveys, which is consistent with Hypothesis 2. In particular, reliability was lower in interviewer-administered surveys (cf. Braunsberger, Wybenga, and Gates 2007 for similar results from a web–telephone comparison).
Measurement properties of modes, for example, differential demands of the social situation, motivation, and cognition, are known to impact the occurrence of answering behaviors as well (e.g., Holbrook et al. 2003; Heerwegh and Loosveldt 2008). Studies describing answering behaviors found differences primarily between interviewer- and self-administered modes, which conforms to Hypotheses 1 and 2. Four consistent findings are particularly worth noting. First, if the construct of interest is sensitive, social desirable answering probably affects all indicators of a scale more strongly in the interviewer modes. Second, aural modes have been reported to yield more extreme or more extreme positive responses independent of question content (de Leeuw 1992; Christian et al. 2008; de Leeuw 2008; Dillman, Smyth et al. 2009:316-20; Dillman, Phelps et al. 2009). Third, acquiescent answering behavior was found more often in Telephone than in Web surveys (Holbrook et al. 2003; Greene et al. 2008; however, cf. Heerwegh and Loosveldt 2011). Fourth, nondifferentiation and “straight lining” answering behaviors were found to differ between interviewer modes and Web surveys (Holbrook et al. 2003; Fricker et al. 2005; Heerwegh and Loosveldt 2008; Greene et al. 2008; Chang and Krosnick 2009). These empirical results suggest that the extent of systematic error might also be structured as posed by Hypotheses 1 and 2, that is, primarily be present between interviewer- and self-administered modes (Hypothesis 3) as sources of a difference in the extent of systematic bias (Hypothesis 3a) and variance (Hypothesis 3b).
On the empirical side, systematic variance differences between modes were found in the meta-analysis of Saris and Gallhofer (2007). Interviewer-administered surveys appear to create higher systematic variance than self-administered surveys giving empirical support to Hypothesis 3b. Heerwegh and Loosveldt (2011) report on a systematic bias between a Telephone and a Paper survey, which is interpreted as social desirability effect, consistent with Hypothesis 3a.
Data: The Dutch Crime Victimization Survey (CVS) Mode Experiment
Data are available from a mode experiment in the Netherlands conducted from April to June 2011 by Statistics Netherland. The topic and large parts of the questionnaire were adopted from the national CVS, an existing cross-sectional survey conducted on a yearly basis by Statistics Netherland. The experiment was administered independently from the regular CVS at a different time and with a different sample. A simple random sample of 8,800 persons was drawn from the national address register and each person was randomly assigned to one of the four modes; 8,524 persons were eligible: 2,081 in F2F; 2,062 in Telephone; 2,182 in Paper; and 2,199 in Web. All persons received mailed prenotifications and multiple reminders, where self-administered modes additionally contained either a link to a web survey or a paper questionnaire with a return envelope. In the interviewer modes, contact was attempted by telephone or in person; 4,048 respondents participated. American Association for Public Opinion Research Response Rates 1 were F2F 64.3 percent (1,338), Telephone 2 67.4 percent (993), Paper 49.8 percent (1,086), and Web 28.7 percent (631).
Statistical analyses were conducted on three unidimensional scales. Questions, item wording, and answer categories are shown in Table 1. Two scales were based on indicators that are regularly included in the CVS (neighborhood traffic pressure [NTP], and police visibility [PV], both four indicators). These were explored and cross-validated on a different data set, the Web version of the regular CVS from 2010. The third scale (duty to obey the police [DTO], three indicators) was validated in the pretest of the fifth round of the European Social Survey (in F2F). It is normally not included in the CVS.
Overview on Indicators and Scales With “Don’t know” (+Indicator Refusal) Rates (in Percentage).

Note. Scale labels: aquestion: how often does the following happen in your neighborhood? Answer categories: happens almost never or never (1); happens sometimes (2); and happens frequently and (3), Don’t know. b Completely disagree (1), disagree (2), neutral (3), agree (4), and completely agree (5), Don’t know. c Fully not my duty (1), (2), (3), (4); and fully my duty (5).
Ordinal rating scales contained either three (NTP) or five answer categories (PV, DTO). In the interviewer modes, answer categories including “DK” options were read out once at the outset of a set of questions and repeated upon request. No show cards were used in the F2F mode. In both self-administered modes, indicators were presented in grids with labeled scales. A well-known problem in unified mode designs is the presentation of “DK” categories (Dillman, Smyth, et al. 2009:327). If offered visually with each question, DK categories are more prominent in Web or Paper questionnaires than in Telephone or F2F. This can affect the “visual” scale midpoint (Tourangeau, Couper, and Conrad 2004). Also typically, this leads to more frequent use of DK categories in self-administered modes (de Leeuw, Hox, and Scherpenzeel 2011). But omitting DK fully might provoke false or random answers in Web and Paper. Differential presence of DK answers thus is an alternative explanation to the measurement effects we seek to identify. To control for the impact of DK, the treatment of DK categories was varied across the three scales. In the standard CVS, DK categories are explicitly offered in the two self-administered modes. PV and NTP thus had explicit DK in Web and Paper (Table 1). NTP was selected because it was known from earlier rounds of CVS that DK could be expected at low rates in all modes, despite the visual presence of a DK option in Web and Paper. In the PV scale, higher DK response in Web and Paper was expected, which is the more common case when offering explicit DK. As a contrast, no DK option was offered for the third scale in Web and Paper (DTO), which is normally not done in the CVS. In Paper, only omission could thus lead to item nonresponse, which consequently was low. The online routine required all indicators to be answered. Therefore, DK was fully absent in Web on this scale.
Statistical Methodology and Assumptions
The Ordinal MCFA Model
Ordinal MCFA assumes that the observed random vector of ordinal response variables Y has a latent response variable vector Y* linked to it. Assume as conditional distribution of Y*:

linked to the observed ordered categorical indicators Y by means of indicator-specific threshold parameters vm . Suppose there are c = 1,…, C categories on each Y, then C − 1 threshold parameters are defined. The bivariate normal density is estimated by polychoric correlations that form the basis for further mean and covariance structure analysis:
The conditional expectations and variances of the latent response variables are then linked to a congeneric factor model (Lord and Novick 1968; Jöreskog 1971):


with T an R × 1 vector of common factor scores for latent variables r = 1,…, R, Y* a J × 1 vector of J latent response variables (indicators),


κ is the vector of population means and Φ population variance of T. Note that, since we seek to measure the same true score distribution in all modes, population means and variances do not depend on mode.
Thresholds, intercepts, and loadings set the scale of each question Y in a given mode. Random errors are explicitly included in the model and can be tested for equivalence. 3 In the absence of measurement effects on scale or random error, the parameters are equivalent, which is testable on empirical data. Random error variance is essential for the estimation of indicator reliability (e.g., Alwin 2007), which is expressed as:
with
Thresholds and intercepts are not simultaneously identifiable, which is why estimation has to focus on one of the two (Millsap 2011:128-31). We focus on thresholds in the following by constraining intercepts to zero. Models are estimated with weighted least squares mean and variance adjusted (WLSMV; on further estimation details, see Muthén 1984; Muthén, du Toit, and Spisic 1997; Asparouhov 2005; Millsap 2011:131-36). For detailed identification restrictions, see Millsap and Yun-Tein (2004), Millsap (2011:138), and the Data Analysis and Results section. Measurement equivalence of scale and random error can be assessed by constraining parameters equal across modes, as detailed in the Data Analysis and Results section.
Systematic Errors in the Ordinal MCFA Model
In contrast to random error, systematic errors are common sources of variance and bias of a particular method of measurement, like a mode, affecting measurements in equivalent ways. One way to include systematic errors in measurement models is by an additive, mode-dependent random variable S. Following approaches by Saris and Andrews (1991) and Scherpenzeel and Saris (1997), we assume that these are observed as a compound with T, say for person i:

Define mode-specific systematic bias and variance as


Equivalently, we may introduce a mode-specific systematic intercept with

This reflects that systematic errors can be interpreted as constant shifts of intercepts, weighted by factor loadings. Since in our model intercepts are zero-constrained for identification, see above, a presence of

Another interpretation for the term
In single-group situations systematic errors are not identified but estimated as true score compound


The mean and variance difference of the estimated compound factor gives an indication for relative differences in systematic errors, because true score distributions should be balanced by means of randomization. This logic forms the basis of a test of equivalence of systematic errors in the presence of loadings equivalence. Noteworthy, we will consider relative difference in systematic error, which is relevant to conclude about equivalence. We cannot conclude about absence of systematic bias or variance using this approach.
The term S is used to approximate 4 the systematic effects of answering behaviors on means and variances of sets of response variables (Billiet and McClendon 2000; Welkenhuysen-Gybels, Billiet, and Cambré 2003; Billiet and Davidov 2008; Morren, Gelissen, and Vermunt 2011; Heerwegh and Loosveldt 2011). For example, if persons, depending on mode, vary in their propensity to agree to sets of indicators (acquiescence), S has variance and nonzero means in the direction of agreeing, introducing systematic bias and variance. A similar argument can be made for social desirable response behavior. If persons in the population vary in their tendency to provide desirable answers across all indicators in a given model, this introduces systematic variance and a bias in the direction of desirable responses. Moreover, if persons provide extreme answers on all indicators, loadings are scaled upward by a constant, because any true score leads to higher (or lower) responses. As shown above, the presence of S with a variance is equivalent to a shift in loadings. Also, behaviors like nondifferentiation and straight lining have been discussed to cause “correlated errors” of indicators (Gerbing and Anderson 1984; Green and Citrin 1994). As mentioned above, correlated errors in MCFA models are statistically equivalent to the presence of a systematic error term. From this illustration, it is apparent that the mode-dependent term S denotes a “net effect” of the many reasons for systematic error differences across modes but avoids specifying a particular type of behavior as an error source.
S has also been referred to as invalidity effect of the method, invalidating unbiased measurement of the concept of interest (Saris and Andrews 1991; Scherpenzeel and Saris 1997; Mellenbergh 1999). We conceptualize S as compound with T in this tradition. Then the effect of S is mediated by factor loadings (cf. equations 8–10). An alternative conceptualization is to assume a direct effect of S on Y modeling S as a second factor with unit constrained loadings (e.g., Billiet and McClendon 2000; Bollen and Paxton, 2008; Welkenhuysen-Gybels et al. 2003). We will return to this alternative option in the discussion section.
Selection Effects in Mode Experiments
The above considerations were made for a fully randomized experiment. However, full randomization of persons to modes is seldom possible, especially if samples from the general population are concerned, because modes involve differential sampling frame coverage and evoke differential self-selection (e.g., Groves et al. 2010:162-68). Selection effects are an alternative explanation for measurement effects (Jäckle et al. 2010; Vannieuwenhuyze and Loosveldt 2013), comparable to counterfactual situations in quasiexperiments (Morgan and Winship 2007). Two counterfactual situations are possible. First, a selection variable X (i.e., a variable, which causes selection into mode conditions) might be also related to the true score of interest. Second, there might be measurement nonequivalence across classes of X. For these reasons, it is necessary to adjust for selection, for example, by conditioning on X. One way to do so is weighting adjustment by the inverse of propensity scores (Rosenbaum and Rubin 1983; Rosenbaum 1987; Kaplan 1999; Morgan and Winship 2007; Guo and Fraser 2010). For more than two modes, it is advisable to weight to a reference population.
5
Define a propensity score model as:
Data Analysis and Results
Testing Procedure
The testing procedure for mode differences on scales, random errors and systematic errors followed a series of steps, graphically illustrated in Appendix A (“The online [appendices/data supplements/etc.] are available at http://smr.sagepub.com/supplemental”). First, so-called configural equivalence models were fit (model 1), which specify only the factor structure with free parameters under minimal identification constraints
6
—hereafter “MIC” (Millsap and Yun-Tein 2004; Millsap 2011:138). If configural equivalence held, all loadings and thresholds were constrained simultaneously to test scale equivalence across all indicators (
An improvement in fit of model 2a against the constrained scale equivalence model would suggest that nonequivalence of loadings causes (part of) the misfit. If loading equivalence holds, but scale equivalence not, nonequivalence is perhaps located on thresholds. This was then tested by freeing thresholds while holding loadings fixed (model 2b). As MIC, always one threshold per indicator needed to be constrained equal, plus a second threshold for the anchor indicator, where again we chose the MIC which maximized fit.
If nonequivalence was found on the loadings or the thresholds, it was assessed, if the expected structure of measurement effects according to the Hypotheses 1a/1b and 2 held. If there was nonequivalence on thresholds, then this implied testing (model 2b-1):
against the model which kept all thresholds free (model 2b). If model fit did not deteriorate, the structure predicted by Hypotheses 1a/1b and 2 held. Finally, it was assessed which indicators caused the measurement effect by inspecting parameter estimates of thresholds (or loadings).
Next, random errors were constrained across modes (
To test systematic bias and variance equivalence, we used equations (13 and 14) suggesting that due to randomization compound factor means and variances are only equal across modes, if systematic errors are equal (equations 13 and 14). If means
Model Fit Evaluation, Oort Adjustment, and Cross-Validation
WLSMV estimation was conducted by the software Mplus 6.1. “DK” answers or refusals are treated as missing completely at random in WLSMV estimation. Change in fit was assessed by adjusted χ2 difference tests (using the ‘difftest’ option in Mplus; cf. Asparouhov and Muthén 2006) and the global fit index Root Mean Square Error Of Approximation (RMSEA). A significant χ2 test denotes a significant change in fit. Fit indices like RMSEA are still under testing for ordinal confirmatory factor analysis (CFA) models (Millsap 2011:136), but in continuous CFA, RMSEA < .05 is considered a good fit. Furthermore, a simulation by Chen (2007) showed for continuous MCFA that a change larger than .01 in RMSEA indicates meaningful change in fit. We took RMSEA as secondary guideline but primarily relied on the exact χ2 test.
Two additional measures were taken to assure robustness of our results. Testing a less-constrained model against a constrained baseline model with bad fit has been shown to cause inflated type 1 error detection rates of nonequivalence (Kim and Yoon 2011). Such testing, however, is necessarily done, for example, in tests of loading or threshold nonequivalence when scale equivalence is rejected. The authors showed that the so-called Oort (1998) correction normalizes false positive rates in categorical MCFA with WLSMV. Oort’s correction is applied to all affected χ2 tests. 7
Additionally, all models were cross-validated using half of the sample for testing and the second half of the sample for retesting. Reported model fit statistics are based on the full sample, but results of difference tests are reported only if cross-validation suggested equal conclusions in both half splits.
Weighting Adjustment
Eight sociodemographic variables were available from the national registers: gender, age (six categories: 15–24, 25–34, 35–44, 45–54, 55–64, and 65 or higher), income (seven categories: no income, up to €30 k, 30–45 k, 45–60 k, 60–100 k, 100 k, and above, missing), civil status (four categories: married or partnership, single, divorced or widowed, and missing), nationality (three categories: Dutch, Western foreigner, and non-Western foreigner), household size (three categories: one person, two, and three or more), urbanity (four categories: strong, moderate, little, and none), and living in one of the three biggest national cities (four categories: Amsterdam, Rotterdam, Utrecht, and other). Response propensities were estimated from a probit model including all categorical predictors and their interactions with three mode condition indicators. The reference set were all eligible units including units without telephone access (also in the Telephone condition). The maximum normalized weight was 1.846, which is not extreme.
NTP and PV Scales
Table 2 provides test sequences for the NTP and PV scales. Consider first results for the NTP scale. Very low RMSEA and insignificant model χ2 indicated very good fit of the configural equivalence model (model 1). The fit of the full scale equivalence model strongly deteriorated, however, suggesting that scale parameters were nonequivalent (model 2). Freeing loadings across conditions did not result in a significant increase in fit (model 2a) indicating that the major source of misfit was located on the thresholds. Consequently, we freed all thresholds, while holding loadings equal (model 2b). Compared to the scale equivalence model, a highly significant χ2 test and negative RMSEA difference indicated a strongly improved fit. Now we tested Hypotheses 1 and 2 simultaneously by imposing “
Equivalence Test Sequences for the NTP and PV Scales.
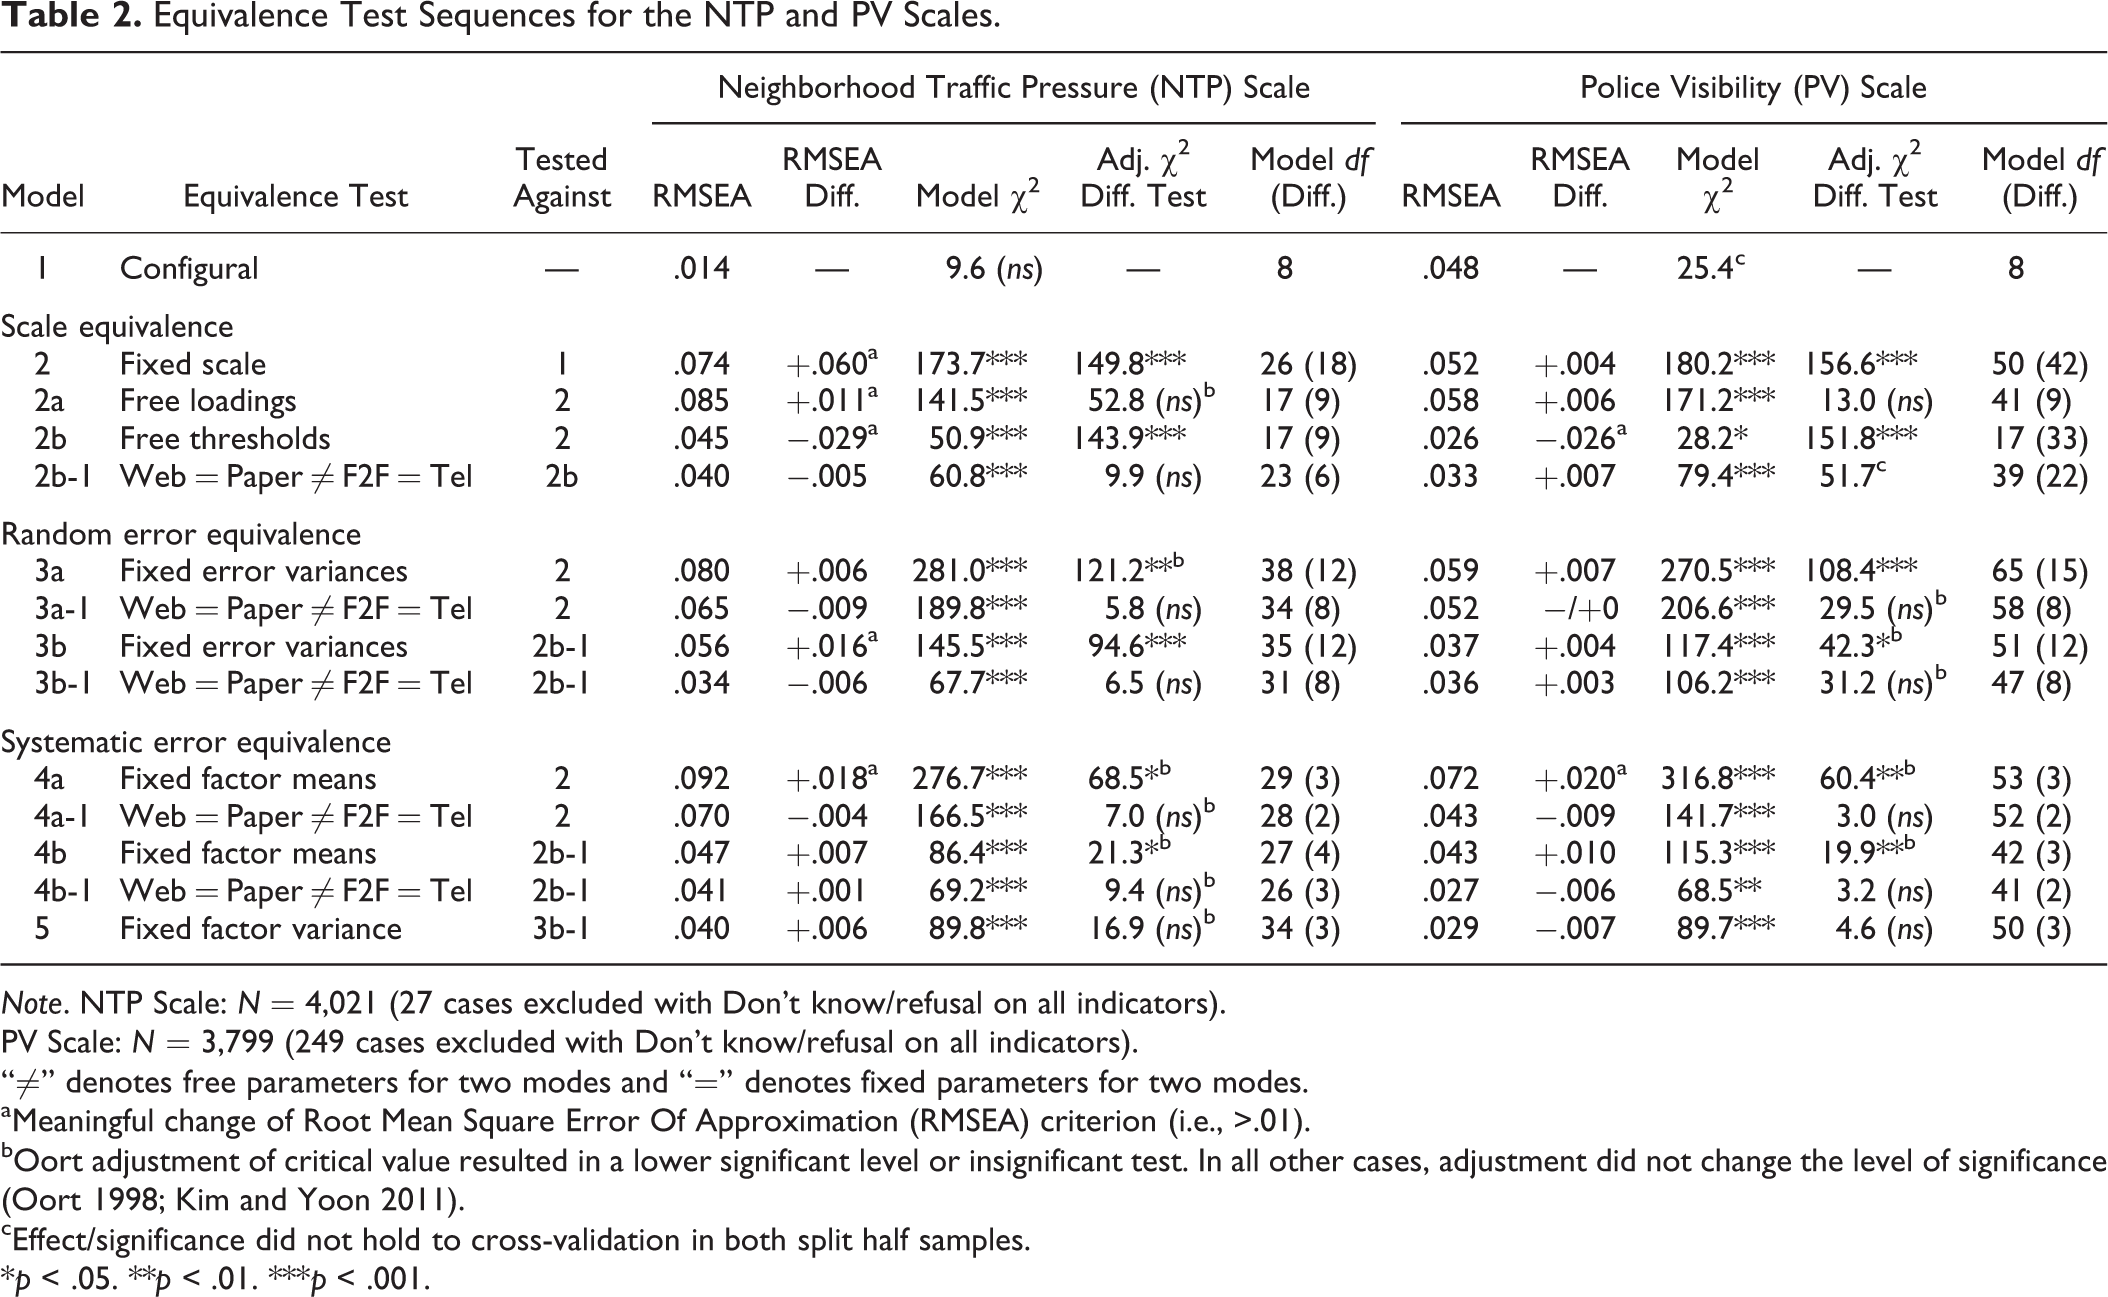
Note. NTP Scale: N = 4,021 (27 cases excluded with Don’t know/refusal on all indicators).
PV Scale: N = 3,799 (249 cases excluded with Don’t know/refusal on all indicators).
“≠” denotes free parameters for two modes and “=” denotes fixed parameters for two modes.
aMeaningful change of Root Mean Square Error Of Approximation (RMSEA) criterion (i.e., >.01). bOort adjustment of critical value resulted in a lower significant level or insignificant test. In all other cases, adjustment did not change the level of significance (Oort 1998; Kim and Yoon 2011). cEffect/significance did not hold to cross-validation in both split half samples.
*p < .05. **p < .01. ***p < .001.
Next, measurement effects on random error were considered suggesting fixing all error variance matrices across modes. Besides the scale equivalence model 2, which had bad fit, error equivalence was also assessed in the threshold nonequivalence model 2b-1, which had improved fit (yielding models 3a and 3b). Results were robust with regard to the type of base model. Both suggested decrease in fit and thus unequal error variances. Subsequently, we imposed the structure implied by Hypotheses 1 and 2 simultaneously, leaving separate error matrices only for the self- and interviewer-administered conditions (models 3a-1 and 3b-1). Now model fit did not deteriorate at all, supporting Hypotheses 1 and 2 also for error variances (model parsimony even lead to lower RMSEA).
The findings so far suggest measurement effects on scale and random errors between interviewer- and self-administered modes. It was therefore relevant to assess which indicators were affected by measurement effects. Consider the parameter estimates of free thresholds and random errors in model 3b-1 shown in Table 3. Surprisingly, threshold estimates for Web/Paper are consistently lower than F2F/Telephone for all indicators (except the thresholds separating categories “never” and “sometimes,” which are fixed as MIC). Furthermore, consider relative sizes of the item-specific error variances. Here we find again a difference on all indicators, where Web/Paper showed consistently less random error (F2F/Telephone fixed at one as MIC).
Threshold and Error Variance Estimates for the Neighborhood Traffic Pressure Scale (From model 3b-1) With Bootstrapped Standard Errors (10,000 Draws).

Finally, we tested the equivalence of systematic bias and variance. Constraining factor means across modes in the scale equivalence model strongly deteriorated fit providing evidence for different extents of systematic bias (model 4). Subsequently, we tested, in line with Hypothesis 3a, change of fit when only constraining Web to Paper and F2F to Telephone, respectively (model 4-1). Doing so did not cause deterioration of fit, suggesting that systematic bias was equal for these modes, but differed between interviewer- and self-administered modes (support of Hypothesis 3a). As we found threshold nonequivalence, we additionally tested the equivalence of factor means in models with free thresholds (yielding models 4b and 4b-1) leading to the same result.
To assess the equivalence of systematic error variance, factor variances were constrained equal based on model 3b-1, which is a parsimonious model with the best fit in terms of RMSEA (model 5). Model fit slightly deteriorated compared to 3b-1 (RMSEA + .006) and the χ2 difference test was insignificant, although it was still close to significance (Oort adjusted critical value: 17.2). In the cross-validation, one half-split sample was very far from significance, however. This is too little evidence to conclude on the presence of differential systematic variance, rejecting Hypothesis 3b. We also assessed factor variance equivalence in the scale equivalence model 2, leading to the same conclusion (not shown).
Subsequently, we assessed whether it was possible to reproduce the results of the NTP scale on the PV scale. This was possible, without exception, despite the fact that this scale used a different number of answer categories (five instead of three), had a later position in the questionnaire and that there were more “DK” answers in the Web and the Paper conditions. Scale equivalence across all modes was rejected (model 2), while again loading equivalence was not the source of nonequivalence (model 2a). Freeing all thresholds improved model fit strongly (model 2b), where again differences were located between interviewer- and self-administered modes only (model 2b-1). Again threshold differences were present on all indicators. The upper part of Figure 1 displays four ordinal thresholds for each indicator (based on model 2b-1). For the exact wording of the four indicators, we refer again to Table 1. In particular, the second threshold separating “disagree” from “neutral” was always lower in Web/Paper. Also random error was consistently smaller in Web/Paper on all except the third indicator, where it was equal (not shown).
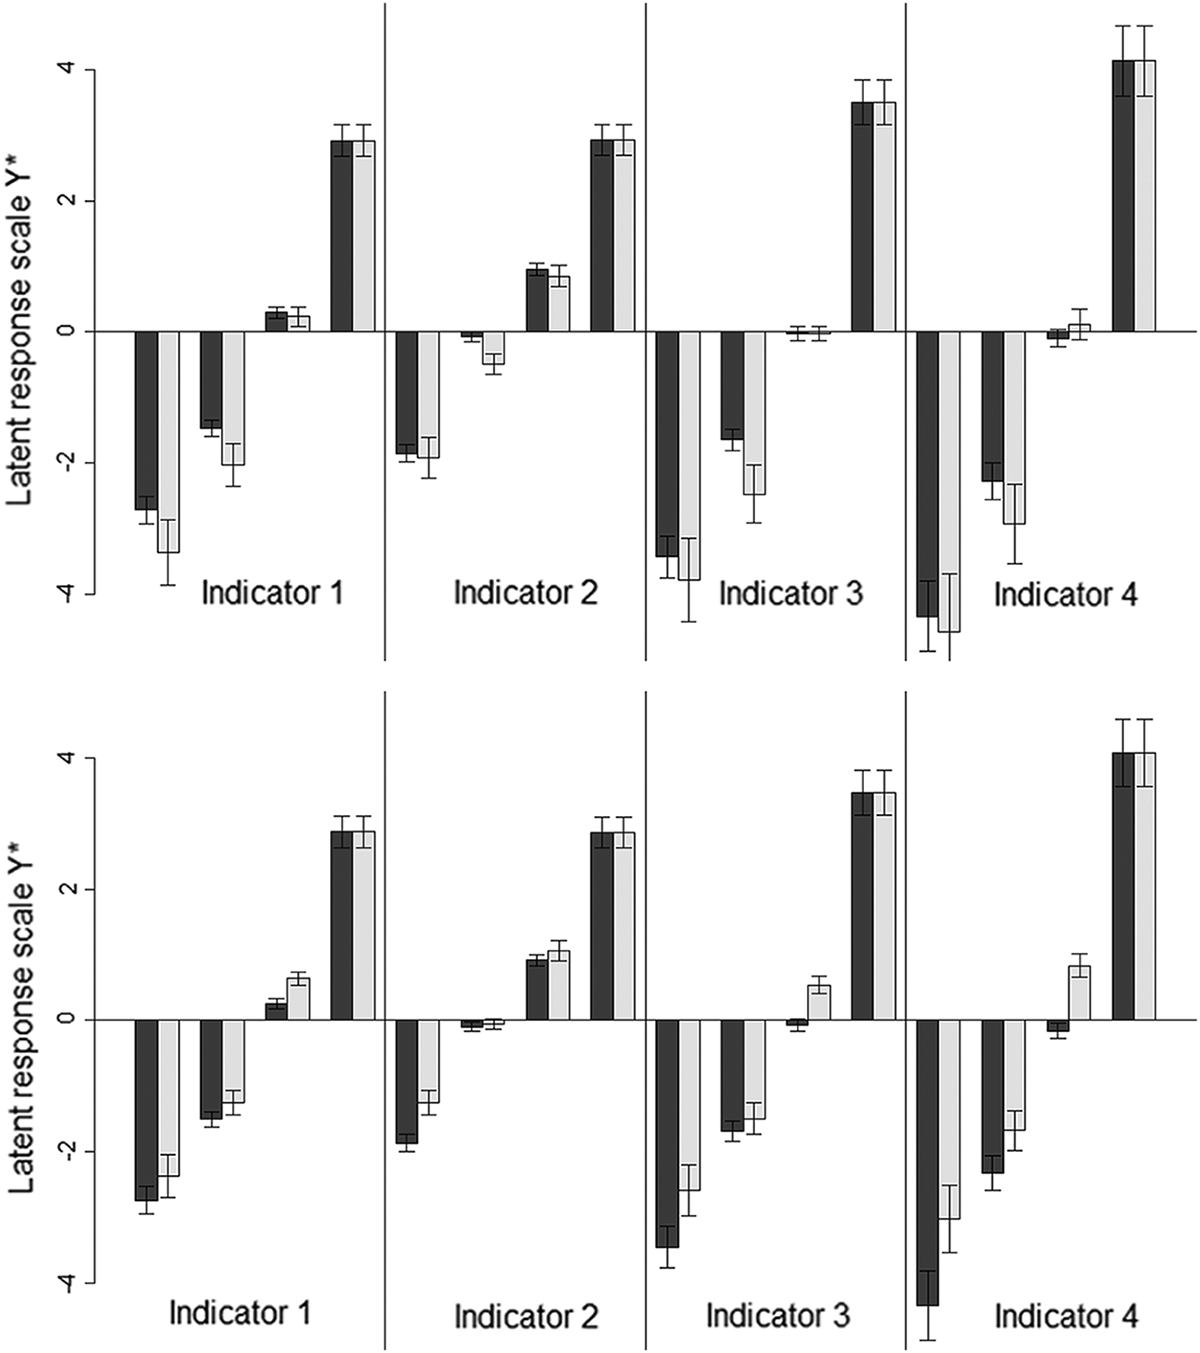
Threshold estimates with bootstrapped 95 percent confidence interval (10,000 draws) for the PV scale (upper part, based on model 3b-1) and with additionally zero-constrained factor means (lower part) illustrating mediated impact of systematic bias (black: F2F/Telephone; grey: Web/Paper).
There was again a difference in systematic bias but not in systematic variance (models 4 and 5). We illustrate the impact of the difference in systematic bias on threshold estimates in the lower part of Figure 1. These are estimates based on model 2b-1 with additionally constrained factor means, so that systematic bias is mediated to the thresholds. One can notice an upward shift of all thresholds (cf. equations 9 and 11; compare to upper part of Figure 1). While there was only nonequivalence on one of the thresholds before, systematic bias now causes systematic nonequivalence on all thresholds (except those constrained as MIC). Note that the strength of the impact of systematic bias somewhat varied across indicators. This was due to the fact that systematic bias was mediated by loadings, reflecting its impact depended on the strength of association between indicator and latent trait.
DTO Scale
The DTO scale differed from the prior two in that no explicit DK categories were offered in Paper and Web. The testing procedure still reproduced nearly all findings from NTP and PV (Table 4; note that the configural equivalence model is just identified and therefore not shown). There was still a difference in systematic bias. Also error variances were consistently smaller for all indicators in Web/Paper, likewise the NTP and PV questions. However, two differences emerged. First, we found no measurement effects on the scales of any of the indicators (no threshold differences) as suggested by very low RMSEA of model 2, rejecting Hypothesis 2. Second, we found a significant difference in factor variance of the Web condition, while all other variances were equal (model 5-2). This was remarkable, considering differential systematic variance was not found for the NTP and PV scales. In the discussion, we speculate that this is related to the omission of DK in Web.
Equivalence Test Sequence for the Duty to Obey the Police Scale.

Note. N = 3,972 (76 cases excluded with Don’t know/refusal on all indicators).
“≠” denotes free parameters for two modes and “=” denotes fixed parameters for two modes.
aMeaningful change of Root Mean Square Error Of Approximation (RMSEA) criterion (i.e., >.01). bOort adjustment of critical value resulted in a lower significant level. In all other cases, adjustment did not change the level of significance (Oort 1998; Kim and Yoon 2011). cEffect/significance did not hold to cross-validation in both split half samples.
* p < .05. *** p < .001.
Comparison of Factor Means and Indicator Reliability Across Scales
Two key findings across all scales are different extents of systematic bias and lower random error variances in the self-administered modes. Table 5 compares standardized factor mean estimates and reliability estimates across scales. The lower error variance in the self-administered modes manifests in higher indicator reliabilities of most of the questions in Paper/Web than in F2F/Tel. For the DTO scale, it can be seen that higher compound factor variance results in inflated reliabilities (cf. equation 7).
Mode Differences in Indicator Reliabilities (From Models 5, NTP and PV, and 5-2, DTO) and Standardized Factor Means (From Models 4a-1 and 4b-1).
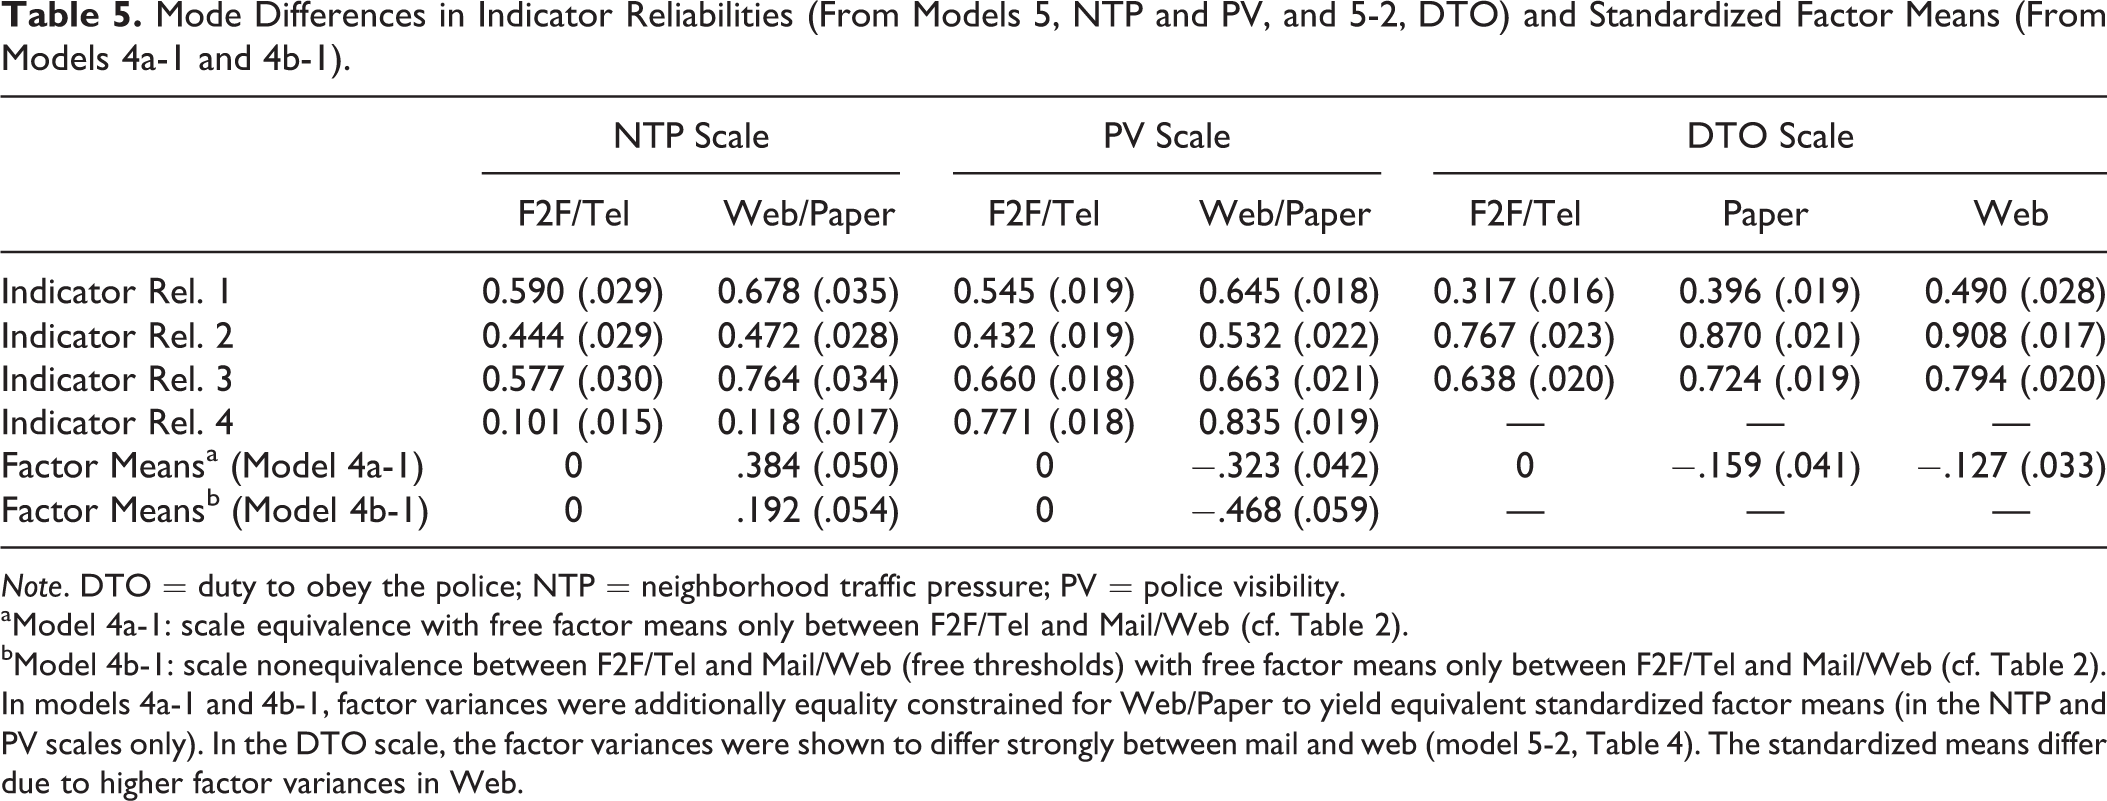
Note. DTO = duty to obey the police; NTP = neighborhood traffic pressure; PV = police visibility. aModel 4a-1: scale equivalence with free factor means only between F2F/Tel and Mail/Web (cf. Table 2). bModel 4b-1: scale nonequivalence between F2F/Tel and Mail/Web (free thresholds) with free factor means only between F2F/Tel and Mail/Web (cf. Table 2).
In models 4a-1 and 4b-1, factor variances were additionally equality constrained for Web/Paper to yield equivalent standardized factor means (in the NTP and PV scales only). In the DTO scale, the factor variances were shown to differ strongly between mail and web (model 5-2, Table 4). The standardized means differ due to higher factor variances in Web.
Standardized factor means are shown from models 4a-1 and 4b-1 (NTP and PV only). Means of the interviewer modes were constrained to zero for identification. Negative means of the self-administered modes in the NTP scale indicated the systematic bias difference to the interviewer modes. The negative sign suggests that across all categories, it was relatively easier in Web/Paper to answer that a traffic problem persisted more frequently in the neighborhood. For PV and DTO, a positive mean was found for Web/Paper indicating that it was more difficult to agree to questions about proper PV in the neighborhood and support of police actions (cf. Figure 1). The strength of systematic mean differences varied across scales depending on whether model 4a-1 or 4b-1 is taken as a benchmark. However, the mean difference was smallest for the DTO scale.
Discussion
Survey researchers designing mixed-mode surveys need to know which modes can safely be combined in later analysis. In the present study, ordinal MCFA models were applied to assess measurement effects of modes on the equivalence of scale, random errors, and systematic errors of attitudinal rating scale questions. Consistent with our expectations, we found a divide between interviewer- and self-administered modes and nearly complete parity, when comparing F2F with Telephone and Web with Paper. The chief differences between interviewer- and self-administered modes were represented by threshold biases, systematic biases, and the extent of random error.
It must again be noted that our study was conducted in the context of a large national survey commissioned by Statistics Netherlands. The consistency of our findings across three scales measuring different traits, using different numbers of answer categories and labels, probability sampling from a general population, as well as the statistical power of our analyses, allow some stronger conclusions about measurement effects of modes. We will discuss the implications for survey methodology and statistical modeling of measurement effects separately.
Considerations About Survey Methodology
The first key finding of the present study is that measurement effects were not indicator-specific phenomena of questions “sensitive” to mode but systematically affected all indicators. Foremost, this is caused by unequal extents of systematic bias (Hypothesis 3a confirmed), which by definition affects all thresholds of indicators causing systematic scale nonequivalence. For the NTP and PV scales, we could also show that there are individual fluctuations per indicator on thresholds that might be due to question content (Hypotheses 1 and 2 confirmed). On the PV scale, only the second threshold of each indicator was affected. This suggests that the indicator-specific threshold bias might rather reflect a systematic threshold-specific bias that cannot be absorbed by the factor means. In this case, the indicator-specific effects would not relate to content but are a second symptom of a systematic category bias.
These results suggest in practice that the same respondent answers to the same questions differently, when asked in an interviewer- or a self-administered mode. The effect was identified across different question topics, formats, and position in the questionnaire. It therefore appears unlikely that these design elements can be altered to mitigate the difference in systematic bias (factor means). Rather the effects are probably caused by mode-specific factors that are impossible to balance by questionnaire design (cf. Expectations About Measurement Effects of Modes section). In survey designs that need to combine more than one survey mode in data collection and analysis, our findings suggest that caution is required when combining data from interviewer- and self-administered modes, especially if considerable amounts of attitudinal rating scale questions are to be included. Furthermore, consistent with theoretical expectations, we did not identify any difference in systematic errors nor the item-specific scale parameters between F2F and telephone on one hand and Paper and Web on the other (with exception for Web on the DTO scale, addressed below). Therefore, the viable mode combinations in mixed-mode surveys appear to be either the interviewer- or the self-administered modes. If surveys focus on factual questions, however, implications of the current study generally do not apply, because our study focused on attitudinal questions only. Further research therefore needs to examine measurement effects on factual questions.
The cause of the identified difference in systematic biases between interviewer- and self-administered modes might have been stronger social desirable responding in the interviewer modes, if one interprets less frequent reporting of traffic problems, better evaluation of PV, and stronger duty to obey police actions all as desirable answers. 8 Reporting neighborhood traffic problems appears to us a topic with least or no social sensitivity, however. Thus, it is surprising to identify a difference in systematic bias of equal strength as for evaluations of PV (Table 5), which arguably has higher sensitivity. We therefore argue that further unknown sources of systematic bias might be present that generalize the problem to nonsensitive rating scale questions. Assessing systematic bias across further scales with a priori low sensitivity is an important aspect for further research. Thereby it is an advantage of the present statistical method that the conclusions drawn above apply regardless of our knowledge of the true cause of difference in systematic biases.
The second key finding of the present study was lower extent of random error and consequently higher reliability of most indicators in the self-administered modes (Hypotheses 1 and 2 confirmed for random error). This finding matches earlier empirical literature on reliability (cf. Expectations About Measurement Effects of Modes section). Noteworthy, the higher reliability is not caused by loading nonequivalence or higher systematic error variance. Only in the Web condition of the DTO scale did the increased factor variance further increase reliability estimates. The less pressured situation during self-administration, own pace, time for thought, and the possibility to reread questions multiple times appear to reduce random impact on measurements. Researchers studying relationships between attitudinal questions can expect less attenuated estimates from Web/Paper questionnaires. Also, self-administered modes can prove more efficient in the estimation of descriptive statistics.
A further result of this study is that, contrary to systematic bias, no differences in systematic variance were found for the NTP and PV scales, and the F2F, Telephone, and Paper modes of the DTO scale (Hypothesis 3b rejected). If prior findings on systematic answer behavior differences, like acquiescence, extremeness, and nondifferentiation, consistently hold across rating scale question, these do not have the expected effect on systematic variance. Possibly, they balance each other in unknown ways or by other factors. Another explanation is the applied propensity score weighting adjustment. Some prior studies did not use this type of adjustment when studying answering behaviors. Also many of the MTMM studies summarized in Saris and Gallhofer (2007) perhaps did not apply nonresponse adjustment. In our unweighted analyses (not shown), there were more pronounced variance differences between interviewer- and self-administered modes, which, however, fully disappeared after weighting and after taking the further robustness measures. Systematic variance difference might hence be a selection effect. In general, this is good news, since presence of differential systematic variance would have signified, another source of systematic scale nonequivalence.
Results on the third scale, DTO, differed from the previous two, but this scale also entailed a major difference in design: Web/Paper did not present explicit “DK” categories. First, we found increased systematic variance in the Web but not in the Paper condition. This might be related to the fact that all questions now had to be answered in Web due to “forced-choice” administration, while in Paper questions could still be skipped. Respondents might have shown straight lining or nondifferentiation behaviors instead of answering DK in Web inflating systematic error variance. An alternative explanation for this finding is, however, the scale’s position, which was close to the end of the questionnaire, where Web respondents might have shown stronger effects of response burden. Increased systematic variance of Web now caused nonequivalence of scale of all indicators between Web and Paper, which is certainly problematic in face of their strict equivalence in the two other scales.
Second, we did not identify an indicator-specific threshold bias on the DTO scale (scale equivalence). Furthermore, the systematic bias difference on the DTO scale was smaller than on the other scales, though not absent. Even though there are alternative explanations for both findings (e.g., topic, category labeling, and position in questionnaire), omission of DK might thus reduce the systematic bias problem to some extent. Conceptually, this finding can be related to the “visual scale midpoint,” which is biased by DK (Tourangeau et al. 2004). This gives a hint that a part of the systematic bias difference might be caused by the visual presentation of scales and presentation of DK.
In practice, omission of DK might therefore be helpful in reducing the systematic bias problem, while it apparently cannot fully solve it. “Forced-choice” administration in Web probably was counterproductive, but the problem could be solved by allowing respondents to skip questions in Web questionnaires without DK option. Assessing the impact of DK on equivalence of systematic bias and variance vis-à-vis alternative explanations that might yield better unified mode designs is an important path for further research.
Considerations About Statistical Methodology
One decisive advantage of MCFA models over marginal analyses of single questions is the possibility to make inferences about the relative sizes of systematic bias and variance. In the “compound parameterization” applied in this study, we assumed, consistent with approaches formulated, for example, by Saris and Andrews (1991), Scherpenzeel and Saris (1997), and Alwin (2007:42), that methods, such as modes, invalidate the true score that is estimated, T*, from the actual true concept of interest, T. An alternative parameterization for systematic errors would be to specify S as a random effect of unobserved heterogeneity affecting the indicators:
Regardless of particular parameterization, S can crucially affect the equivalence of questions before indicator-specific loading or threshold nonequivalence even need to be considered. Arguably, in face of our findings, it might be less relevant to consider indicator-specific nonequivalence, if there is a difference in the extent of systematic bias (or variance) to begin with. If a test of systematic bias or variance in the scale equivalence model indicates nonequivalence, the analysis could already stop and conclude about scale nonequivalence of all indicators in a given set of questions. Methods that explicitly model systematic bias or systematic variance, such as MTMM (Saris and Gallhofer 2007), might thus be viable alternative approaches to studying mode equivalence.
We used ordinal MCFA in our analyses. Alternative categorical measurement models are offered by IRT. It is noteworthy that IRT models would assume error variance equality (see Footnote 3). As we clearly found error variance differences, we prefer the more flexible MCFA model.
Despite the fact that propensity score weighting on sociodemographic variables was used to adjust for selection bias in all analyses, there still remains a risk that some bias could not be removed successfully, because important confounders might not have been observed. When attempting causal inference using adjustment on background characteristics, experimental mode comparisons always encounter this potential threat to validity. Unfortunately, the assumption that bias is fully removed by the propensity score adjustment typically cannot be tested. An indication in favor of the validity of our results represents, however, the clear consistency of effects conforming to theoretical expectations across scales with three different topics. This reassures that the observed effects are indeed mainly caused by measurement differences between modes.
Whereas adjustment on propensity scores is an established technique to balance selection bias (e.g., Morgan and Winship 2007), it was recently suggested to use instrumental variables in the estimation of measurement effects on the means of survey variables (Vannieuwenhuyze, Loosveldt, and Molenberghs 2010; Vannieuwenhuyze and Loosveldt 2013). The instrumental variable method offers great potential in coping with confounding more effectively than statistical approaches that use only background characteristics while possibly omitting important unobserved confounding variables. The technique requires, however, a data collection design that is quite different from the one applied in the present study (in particular, a single mode comparison sample administered in parallel to a sequential mixed-mode sample). Furthermore, the technique, which originally has been suggested to estimate measurement effects on population means, would first need to be extended for use in more complex variance–covariance models, such as CFA. This is an important path for further research.
The propensity weights were treated as fixed in the analysis, which might underestimate variance, if weights lack precision. Since the maximum normalized weight was small, we believe this threat not to be large. Resampling techniques could offer a way to control for the variance of weights. However, to date, there is no standard procedure available to combine results of nested hypotheses tests across many sample draws.
Finally, in all analyses, the Oort correction and cross-validations were applied. In some cases, these robustness measures changed conclusions compared to the unadjusted statistics. These nonrobust findings might turn out to have substance, for example, if this study was replicated with larger samples, but the effects would most likely still be small, because the current sample is already quite large. In any case, we advise to apply robustness measures in similar analyses to caution against over-fitting and inflated false positive detection rates.
Footnotes
Acknowledgment
The authors would like to thank Meike Morren and three anonymous reviewers for their most valuable comments on earlier versions of this article.
Authors’ Note
The questionnaire lab and the fieldwork department at Statistics Netherlands provided indispensible support in the execution of data collection.
Declaration of Conflicting Interests
The author(s) declared no potential conflicts of interest with respect to the research, authorship, and/or publication of this article.
Funding
The author(s) disclosed receipt of the following financial support for the research, authorship, and/or publication of this article: This research was supported by Statistics Netherlands under the project “Mode Effects in Social Surveys” (in Dutch: Mode Effecten in Persoon Statistieken or MEPS). The PhD of Thomas Klausch at Utrecht University is funded by Statistics Netherlands.