



Abstract
Development and refinement of self-report measures generally involves selecting a subset of indicators from a larger set. Despite the importance of this task, methods applied to accomplish this are often idiosyncratic and ad hoc, or based on incomplete statistical criteria. We describe a structural equation modeling (SEM)-based technique, based on the standardized residual variance–covariance matrix, which subsumes multiple traditional psychometric criteria: item homogeneity, reliability, convergent, and discriminant validity. SEMs with a fixed structure, but with substituted candidate items, can be used to evaluate the relative performance of those items. Using simulated data sets, we demonstrate a simple progressive elimination algorithm, which demonstrably optimizes item choice across multiple psychometric criteria. This method is then applied to the task of short-form development of the multidimensional “4Es” (Excitement, Esteem, Escape, Excess) scale, which are understood as indicators of psychological vulnerability to gambling problems. It is concluded that the proposed SEM-based algorithm provides an automatic and efficient approach to the item-reduction stage of scale development and should be similarly useful for the development of short forms of preexisting scales. Broader use of such an algorithm would promote more transparent, consistent, and replicable scale development.
A common task in psychological research is to select a smaller set of items from a pool of candidate self-report items. Item selection occurs in the development of new scales, which usually involves selecting the best performing items from a large candidate pool after sampling. It also arises during the development of short-form versions of existing scales, where only the best performing items need to be retained. The same conceptual and psychometric considerations are generally emphasized for both procedures (Smith, McCarthy, and Anderson 2000; Stanton et al. 2002); however, item selection for scale development and scale reduction is hindered by two factors. Firstly, it is typically a manual and somewhat laborious process (Yarkoni 2010). As a consequence, researchers will tend to explore the space of possible item subset combinations in a limited and unsystematic manner. Secondly, item selection is often based on limited statistical criteria, such as maximizing item total correlations and internal consistency (Goldberg et al. 2006; Lang and Stein 2005). Evaluation of other psychometric criteria, such as discriminant and criterion validity, is often done only after the preferred item subset is finalized.
Ideally, the process for selecting items on empirical grounds should be well specified and standardized, it should take into account all relevant psychometric criteria, and it should identify the globally optimal solution among all item combination possibilities. These are challenging objectives because (a) the space of possible item combinations is often very large and (b) it is not clear how multiple psychometric objectives can be assessed via a single criterion score. Given that structural equation modeling (SEM) provides simultaneous evaluation of reliability and validity (Landis, Beal, and Tesluk 2000), we posit that it represents a good framework for deciding which candidate items should be retained in the final scale. Subsequent to reviewing literature on the role of SEM in scale development and SEM-based algorithms, we shall describe the rationale of a proposed method of an SEM-based item selection method through progressive elimination, based on optimizing a model with residuals that reflect deviations across multiple psychometric criteria.
SEM and Scale Development
Across a variety of disciplines, SEM and confirmatory factor analysis (CFA) have long played an important role in scale development and evaluation. SEM-based criteria can be used to assess classical psychometric ideas, including criterion validity (MacCallum and Austin 2000), discriminant validity (Henseler, Ringle, and Sarstedt 2014), reliability (Miller 1995), and dimensionality (McGartland Rubio, Berg-Weger, and Tebb 2001), in addition to proposed structural relationships between related constructs. Noar (2003) provides a useful overview of the process of scale development through the lens of SEM, describing several stages: defining latent constructs and a theoretical framework, determining the scale purpose and length, developing an initial item pool, locating a relevant sample, selecting items based on statistical criteria and construct validity, and finally evaluating the properties of the final scale. The demonstration of SEM in scale development provided by Noar (2003) is typical of the literature in emphasizing the role of SEM in the final stage (scale evaluation) but neglecting the potential use of SEM for the second to last step (item selection). For example, in the example provided by Noar (2003), item selection was done using a classical approach, that is, manually and on the basis of a number of criteria: mean score, skewness, kurtosis, factor loadings, and item content. Eliminating items manually, while also attempting to simultaneously optimize these multiple criteria, is necessarily an ad hoc process. Graduate texts in psychometrics, such as Furr (2011), also tend to present SEM exclusively as a means to assess a scale once the candidate items have been determined and describe no role for SEM in the item selection process itself.
Automated Algorithms in SEM and Item Selection
Although the use of automated algorithms for specifying SEMs is not widespread, some researchers have applied machine learning or data mining methods for the task of exploring a large space of possible models. Marcoulides, Ing, and Hoyle (2012) provide an overview of the application of several algorithmic optimization methods for SEM. These include simulated annealing and genetic algorithms (GAs) as well as related procedures such as ruin and recreate, Tabu search, and ant colony optimization (Marcoulides and Drezner 2003). While algorithms vary, they share the common feature of using nongradient-based methods to search a discrete space of possible models, with the aim of minimizing a given criterion, such as the noncentrality parameter. No studies could be located which used automated SEM algorithms for scale development or item selection. However, Yarkoni (2010) presents a promising GA-based search approach to short-form development, based on optimizing the ability of the short form to capture variability of the full-length scale. Lastly, Mokken (1971) analysis, an item response theoretic (IRT)-based approach to item evaluation, incorporates an automated bottom-up stepwise item selection procedure, which has since been augmented by a GA-based search methods (Straat, van der Ark, and Sijtsma 2013).
Applying SEM for Item Selection
SEM provides a flexible and unified methodology for a researcher to specify the expected relationships between observed measurements, including both measurement of constructs and structural relationships between constructs. Diagnostic information from a fitted model provides complete information regarding discrepancies between the model and the data. Although this information is usually used to decide among alternative models (using fixed data), how it can be used to decide among alternative indicators or items (using a fixed model) will be described. Finally, the convergence between SEM and IRT (Bentler 2008; Cai 2008; Glockner-Rist and Hoijtink 2003; Lu, Thomas, and Zumbo 2005) arguably not only removes any impediment to using SEM to evaluate binary or polytomous self-report items but also offers better estimates of psychometric constructs than classical methods (e.g., α; see Yang and Green 2011). We will consider whether scale items might be selected purely based on terms derived SEM misfit, in place of one or more specific measures of reliability or validity. To explore this, data from a concrete case study will be used to relate different psychometric criteria to the residual variance–covariance matrix.
To illustrate this application, the “4Es” questionnaire will be shortened and generalized. The 4Es questionnaire was originally designed to assess psychological trait risk for development of problem gambling (Rockloff and Dyer 2006, 2007) and consists of four related components of psychological risk: a desire to escape—capturing a desire to avoid or escape life problems and responsibilities, lack of self-esteem—feelings of worthlessness, shame, and self-loathing, excess—primarily a lack of caution and deliberation, and the need for excitement—a tendency toward boredom and restlessness. The original 40-item Likert-type scale (10 items per subscale, 5 points per item) was generated from an initial 240-item pool and was developed in an extensive documented process, resulting in a scale with good construct validity, internal consistency, and criterion validity for predicting gambling problems (Rockloff and Dyer 2006, 2007). Although not an investigative focus of the original studies, the scale was also useful in predicting other forms of addiction: particularly substance use, alcohol, and nicotine. Figure 1 summarizes the SEM corresponding to the theoretical model for this scale. For ease of presentation, only the first 3 items of each subscale are shown, and correlated error terms between the addiction criterions are omitted. This relatively simple application nevertheless provides a useful means to summarize how SEM misfit corresponds with several classical psychometric properties. In the following discussion, it is asserted that (a) parameters shown in Figure 1 are freely estimated using a sample data set; (b) methods appropriate to ordinal data are applied: for example, polychoric correlations or robust weighted least squares estimation (Flora and Curran 2004; Lei 2007; Muthén, Du Toit, and Spisic 1997; Schumacker and Beyerlein 2000), and (c) candidate scale items have been screened for possessing adequate construct validity.

Measurement and structural model of the 4Es scale with criterion behavioral measures.
SEM Residuals, Homogeneity, and Discriminant Validity
We shall first describe how SEM misfit attributable to an item, in terms of residuals between the observed and fitted covariance matrix, is an indication of poor item fit functioning. Reasons for poor item fit have been well explored and include similar item wording, logical dependencies between items, overlapping content, and unspecified hierarchical or multidimensional structure (Heene et al. 2012). Regardless of the cause, residual covariances tend to fall into several categories. First, residuals between indicators of the same scale, shown by the link “A” in Figure 1, are an indication of factor heterogeneity or unwarranted logical, conceptual, or methodological overlap between items. Ideally, covariance between items would be completely explained by their shared contribution to the latent construct, errors would be independent, and this residual term would be zero. Second, residuals of the type indicated by “B” indicate unexpected relationships between items from separate constructs, which correspond to a violation of discriminant validity. Ideally, items should measure only the construct to which they are attached, and covariance between items in different subscales would be fully explained by intermediate structural model links—in the present example, their shared contribution to psychological risk. Third, residuals of type “C” indicate another form of discriminant validity violation: in terms of unexpected relationships between scale items with the criterion or other measures. To illustrate a situation in which this might occur using our case study, a hypothetical excess item, “I never think about the morning-after when partying with friends,” might display positive residual covariance with the criterion alcohol due to implicit connotations of alcohol consumption contained in the item. This is one example of how standardized SEM covariance residuals would appropriately penalize a positive correlation in the data that less sophisticated methods would be incorrectly treated as contributing positively to criterion validity. Each of the residual terms discussed above corresponds to discrepancies between model reproduced

SEM Error Terms, Reliability, and Criterion Validity
The points made above illustrate how the SEM diagnostics capture divergence between the observed and expected (i.e., model specified) relationships with other measures, capturing factor heterogeneity and discriminant validity in a broad sense. However, like factor analysis, an SEM fit is based on the common variance of observed variables: Unique item variance is treated in a separate model term and do not contribute to the residual correlation matrix. This corresponds to a basic distinction between error-based and model-based fit criteria. If item performance based on the expected covariance were the only criteria of interest, then we might select items based on optimizing the SRMR or similar fit measure. However, we likely also wish to take into account the correlation of items with the latent factor (classical reliability), and the degree to which their inclusion leads to the estimation of a latent factor that explain greater variation in the criterion measures. With a fitted SEM, one way to do this is to also take into account the unique error variance terms of scale items δ and the criterion measures ε. The argument for this follows from the definitions: δ are a negative indicator of the proportion of variance shared between an item and the latent variable, and ε are a negative indicator of the variance explained in the criterion measures. We note that for any given item, the SRMR, ε, and δ all depend on the mix of other items in the scale. For example, the magnitude of the unique item variance depends on variance it shares with other items in the scale. This leads to a combinatorial problems and local minima for any attempt to optimize these quantities. For such multivariate applications, this is inevitable: Stepwise multiple regression or stepwise item removal based on “alpha if item removed” also faces this issue. In considering both the residual correlation matrix and the unique diagonal matrix, both classical and common factor approaches play a role. The present article makes no attempt to engage in the long-standing theoretical debate between classical and common factor approaches to evaluating scales. Rather, it aims to provide a practical approach for a pragmatic scale developer who wishes to select items that both possess covariance that conform to model-implied expectations and contribute to classical reliability of measured constructs and predictability of external measures.
Toward SEM-based Item Evaluation
In order to take into account each component of reliability and validity accessible from a fitted SEM, we would tend to prefer items that: are homogenous and possess good discriminant validity, corresponding to a covariance structure that conforms to the model: that is, minimize SRMR; are reliable, corresponding to greater shared variance with the latent construct: that is, minimize δ; contribute to criterion-related validity or a fitted model that explains relatively more variance in the criterion: that is, minimize ε.
Each of these diagnostics is accessible from a fitted SEM that includes the item considered for deletion. While the manner of combining these three criteria into a single loss function is bound to be somewhat arbitrary, we suggest that a scale-invariant aggregation—described below—is suitable for most applications. We can imagine a set of fitted models with fixed structure and fixed number of indicators N − 1 from a set of N indicators. Importantly, the only difference between models in this set is the choice of item that is dropped. Assuming δ and ε are standardized to unit total variance, the model with the best diagnostics corresponds to a dropped indicator with the worst performance. This represents a special case in which violating normal SEM practice—involving fixed data and alternative models—is meaningful, since we implement a comparison of fixed models, where one column of data differs in each pairwise comparison.
To conclude with some cautionary comments, the proposed method is designed specifically for item-set reduction. It is not proposed to substitute for normal practices in development of the initial item pool, including checking items for construct validity. A poor initial item pool will almost certainly lead to a poor solution. Next, a stepwise approach to item-set reduction does not explore the complete space of possible item combinations and is not guaranteed to find the optimal item subset. Finally, it does not substitute for the standard practice of detailed testing and reporting regarding objective performance of the reduced scale. Given the model flexibility inherent in choosing the best N from M > N indicators, it should be assumed that diagnostics will be inflated, and validation of the final items should be done using a separate test data set before publication of the new scale.
Method
We describe a backward-stepwise algorithm for indicator set reduction and an SEM-based loss function for selecting which item to remove at each step.
Loss Function for Evaluating Item Subsets
Where data comprising the mth indicator are selected from a candidate pool of items, we suggest an SEM-based loss function for evaluating substitutions of indicator variables when comparing models of fixed typology. As per standard SEM methodology, it requires a theoretical model that incorporates a measurement component, and (optionally) structural, indicators of external convergent or discriminant validity. We desire a loss function that simultaneously measures both errors in the covariance structure and the variance structure: that is, unexplained variance in the indicators and criterion measures. A reasonable—though admittedly arbitrary—loss function is given by the product of three terms:

assuming δ and ε are standardized such that items possess unity variance. If q = r = 1, this treats all three aspects of item performance as equally important, such that a proportional improvement in each term contributes equally to the loss function. Researchers may vary the power terms to suit the priorities of a given scale development application. In situations where criterion variables are not available, the ε term may be removed. In special situations where the SEM is not identified, the SRMR will zero, and the term should be removed to permit comparison on the other two criteria.
Algorithm for Item-set Reduction
We define the goal of the analysis to reduce the number of items in each subscale from the number in the original pool of M items to N min. Given that the model architecture and candidate indicator data are fixed, the loss is a function only of the choice of indicator variables:

where k is an integer index to the pool of candidate items, with 3 ≤ N
min < N < M, and no replicated items ki
≠ kj
for all i ≠ j. Given a reasonably sized item pool, an exhaustive search of item combinations is impractical. We propose a backward-stepwise algorithm that progressively eliminates items based on preserving the loss function. At the first step,

This means removing the item that minimizes the loss function from the current pool of items. Importantly, all pairwise model comparisons are between models with an identical architecture, using standardized error variance estimates, and possess an identical number of normalized indicators. The only pairwise differentiating feature is in the choice of ki —the candidate item to be removed. For applications involving simultaneous reduction of multiple subscales, such as the present one, we suggest a round-robin approach such that each subscale is reduced in size at the same rate. The algorithm should be stopped at a minimum of 3 items, 1 to satisfy fundamental SEM requirements for latent variable estimation. However, model fit criteria can be monitored during the item-set reduction process, allowing them to guide the researcher as to how many items to retain.
Results
The results are organized in three sections: Miniature simulations, which serve to illustrate the close connection between the information used in our cost function and classical psychometric measures using small simulated data sets. A test of the robustness of the algorithm and loss function on realistic simulated data. A demonstration of the method on real data for the task of scale reduction of the 4Es measure of psychological vulnerability to addiction.
Miniature Simulations
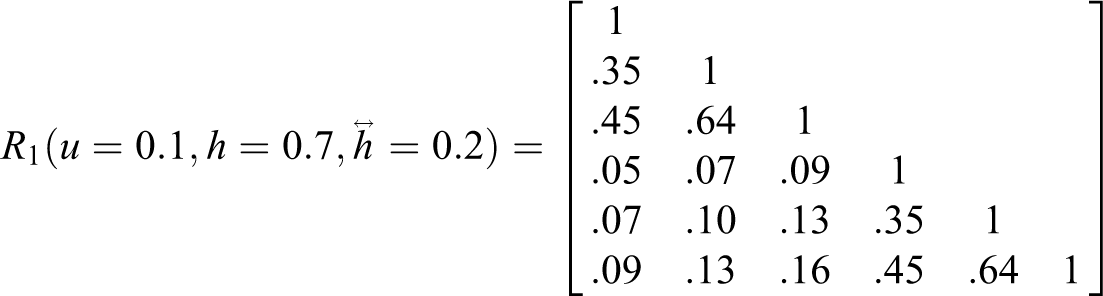
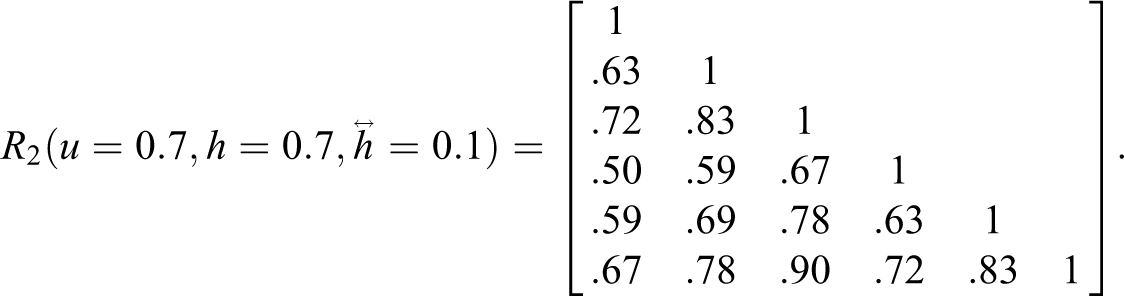
We tested the sensitivity of the SRMR-based metric in capturing three classical measures of model misspecification: factor heterogeneity, discriminant validity, and factor reliability. The simulation results presented were based on a single framework for generating small artificial correlation matrices to demonstrate the relationship between SEM fit measures and classical psychometric constructs. Correlation matrices for six hypothetical indicators were simulated, varying the factor structure on a continuum between a unidimensional (mixing parameter u = 1) and two-factorial (u = 0) structure, with half of the items loadings on each factor. For u = 1, correlations between items 1–3 and 4–6 were similar to those within each 3-item subset. For u = 0, correlations across each split-half were zero. For each simulation reported below, we independently varied item heterogeneity: that is, variation in factor loadings, with the following options for differences between loadings:
Factor Heterogeneity
The first simulation analysis addressed SRMR for the purpose of capturing factor heterogeneity; that is, a nonsingleton factor structure among a set of items purportedly representing a single construct. The mean item factor loading h was held constant at 0.7, while u and

SEM residual metrics SRMR and mean indicator error variance compared to classical psychometric indicators: factor heterogeneity (a), discriminant validity (b), and factor reliability (c).
Discriminant Validity
We used the same simulation scheme to demonstrate the relationship between SRMR and discriminant validity. The model in this case specified items 1–3 and items 4–6 loading on separate factors, with zero-correlation between factors; thus corresponding to a measurement model of unrelated constructs. In this scheme, u is a direct measure of discriminant validity, with u = 0 corresponding to ideal and u = 1 corresponding to very poor discriminant validity. Figure 2 (b) shows a near linear relationship of SRMR with diverging item-construct correlations. This result corresponds to residuals of type “B” and “C” from Figure 1.
Factor Reliability
In the final simulation analysis, we again fit a unifactorial model. However, factor heterogeneity was fixed at u = 0.7, while mean item factor loadings h was allowed to vary between 0.3 and 0.6. In an SEM framework, reliability is indicated by indicator error variance, while among classical techniques, α is still commonly used. Figure 2 (c) compares the mean indicator error variance with α, again showing a near linear relationship between the classical and model-based measure.
Algorithm and Loss Function Efficiency
The goal of the algorithm is to detect and select better quality scale items from a larger set. In order to test the overall efficiency of the algorithm, and the loss function on which it operates, we simulated data using items of varying item quality. For convenience of exposition, we generated data using the same scenario as for the real data and model described in Figure 1: four subscales (Labeled A, B, C, D) with 10 items each and four measures (V1, V2, V3, and V4) of external validity (N = 2,107). Items 1–3 were ideal, in the sense of possessing loadings of unity on the latent constructs, while items 4–7 possessed varying degrees of misfit—varying in terms of reliability, factor heterogeneity, split loadings, and unexpected correlations (both positive and negative) with the validity measures. The population data generation model and the misfit characteristics of each item are most succinctly summarized using the commented model specification code using the R-package lavaan (Rosseel 2012), provided in Online Appendix 1. Two hundred sample polychoric correlation matrices and algorithm outputs were generated, with the final item selections (3/10 per subscale) recorded. The number of times each item was selected by the algorithm is shown in Figure 3. We also recorded the final value of the sample loss function L at algorithm termination (L′) as well as the sample loss function, given the population ideal solution (L*); that is, selection of items 1–3 for each subscale. One hundred ninety-seven times of 200, L′ was less than L*. From this, we may conclude that variation in item selection, at least for this simulated scenario, was overwhelmingly due to sampling variability, rather than algorithmic variability.
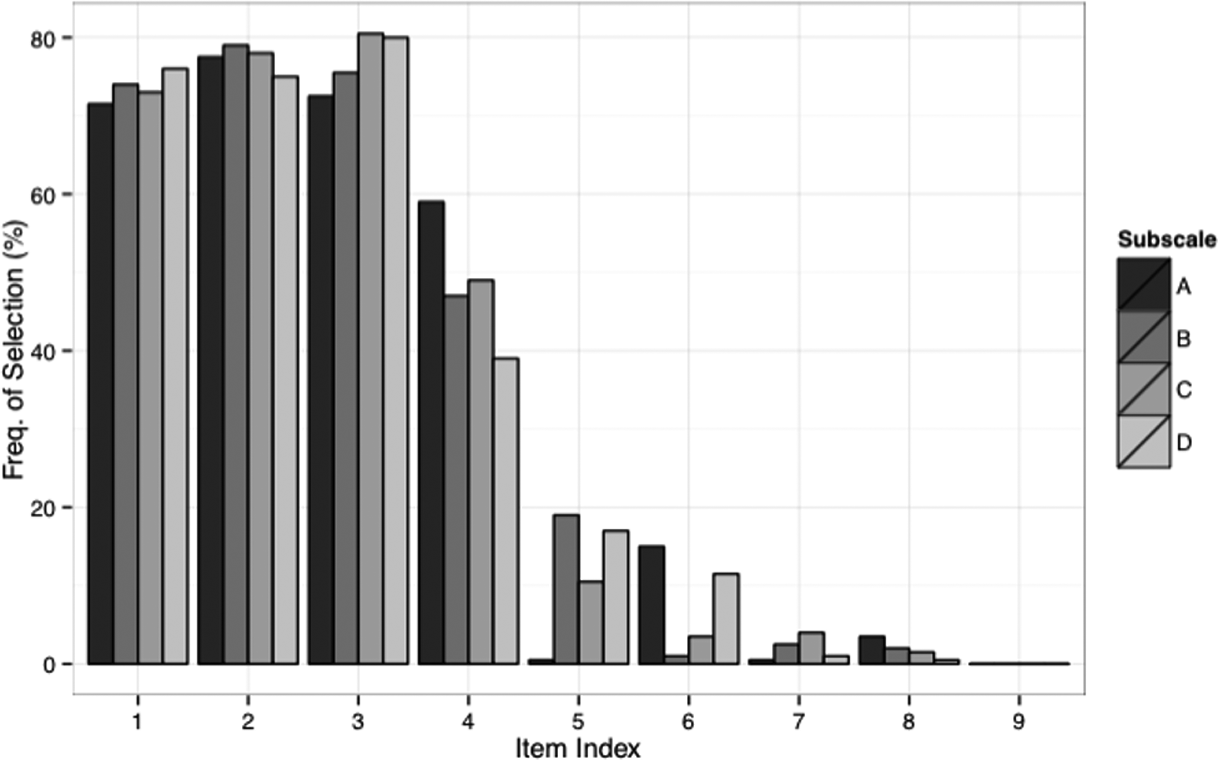
Frequency of item selection by the stepwise backward algorithm on 200 simulated data sets. Refer Online Appendix 1: quality of simulated indicator decreases with item index.
Application: 4Es Data Set
The conceptual background to the 4Es scale has already been described. Uptake of the full 40-item scale has been limited due to its length, and a candidate short form was desired that could serve as a brief screen for psychological risk for addiction, which nevertheless still tapped each of the four constructs in the original scale. The data set of 2,107 respondents originally used to develop and validate the full-length instrument was analyzed; full methodological details of data collection can be found in Rockloff and Dyer (2006). The original instrument was intended for use in diagnosing risk for gambling problems, assessed using the Canadian Problem Gambling Index of Severity (Ferris and Wynne 2001) and validation by the authors focused on gambling as the primary measure of criterion validity. However, data were also gathered regarding three other forms of addictions: nicotine (Heatherton et al. 1991), illicit drugs (Gossop et al. 1995), and alcohol (Saunders et al. 1993). Each of the four outcome measures is well validated and accepted in the addiction literature. An evaluation of the 4Es as a measure of general psychological risk for addiction, as opposed to gambling-related risk, had not been done prior to the present study. Therefore, the goals of the analysis were twofold: To assess the original instrument in terms of the structural model as an indicator of general psychological risk for addiction. To assess whether the algorithm would yield a reduced set of indicators with psychometric properties similar to the original scale.
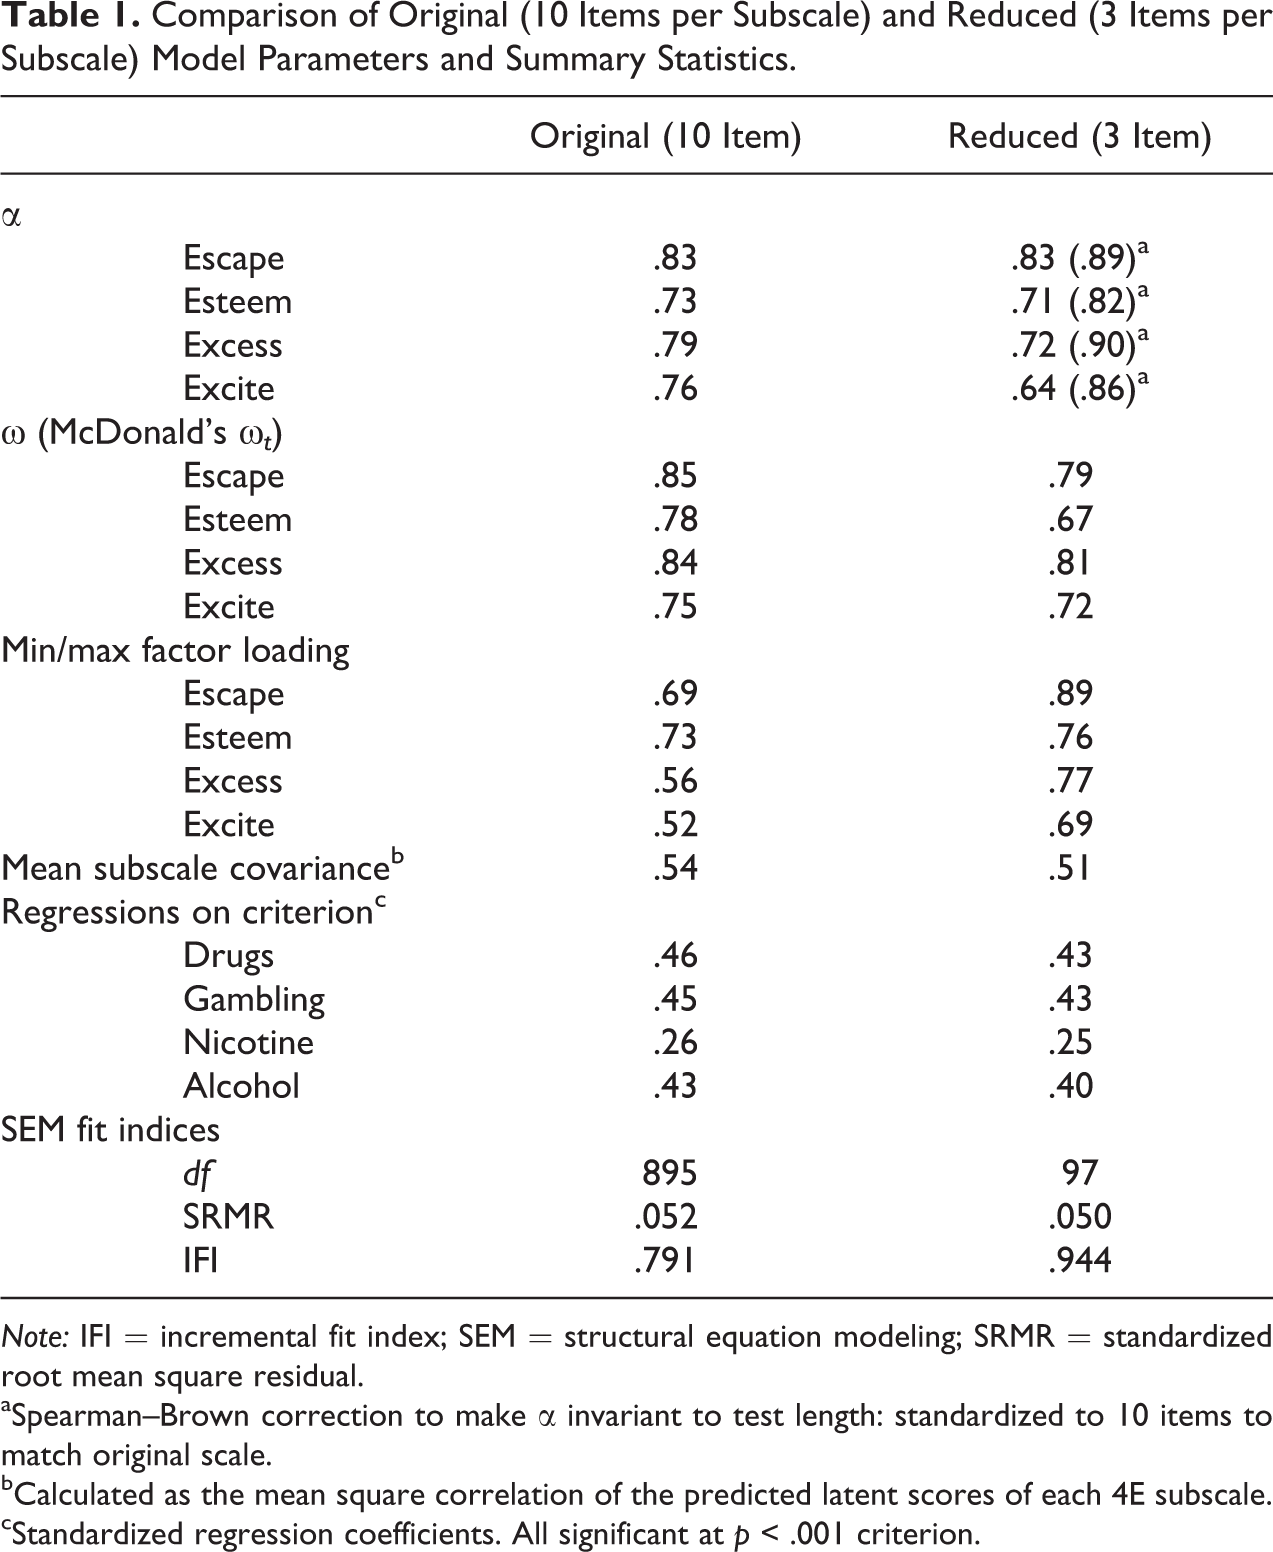
The algorithm was applied to the original 40-item (10 per subscale) instrument using the SEM specification shown in Figure 1 and stopped when 3 items per subscale remained. Table 1 compares psychometric criteria for evaluating the performance of the instrument. As α is sensitive to the number of items in the scale, Spearman–Brown (Schmitt 1996) corrected versions are given; this standardizes the reliability estimates so as to infer α given a fixed number (10 in the present case) of items. Thus, the first section of Table 1 indicates that the item-level reliabilities of the reduced scale were generally higher than the original scale. However, the scale-level reliabilities are still somewhat poor. This suggests we may be well advised to consider increasing the length of the target subscales to 4 or 5 items. Table 1 also shows the ratio of the smallest to the largest factor loading: A τ-equivalent set of items would possess a ratio close to one. The reduced scale yielded latent factor score estimates that were slightly less correlated with one another than the original scale, which better conforms to the SEM specification of separate constructs, and the goal of assessing four distinct psychological constructs. Regressions on the criterion measures suggest that the original scale was a valid indicator of risk for addiction generally, predicting drug and alcohol dependence equally well as gambling problems, and nicotine somewhat less so. The reduced scale possessed slightly smaller, but very similar, correlations to each of the addiction screens. Finally, the reduced scale yielded slightly improved overall SEM fit measures—again these should be interpreted with caution, keeping in mind the marked reduction in degrees of freedom caused by dropping items.
Comparison of Original (10 Items per Subscale) and Reduced (3 Items per Subscale) Model Parameters and Summary Statistics.
Note: IFI = incremental fit index; SEM = structural equation modeling; SRMR = standardized root mean square residual.
aSpearman–Brown correction to make α invariant to test length: standardized to 10 items to match original scale.
bCalculated as the mean square correlation of the predicted latent scores of each 4E subscale.
cStandardized regression coefficients. All significant at p < .001 criterion.
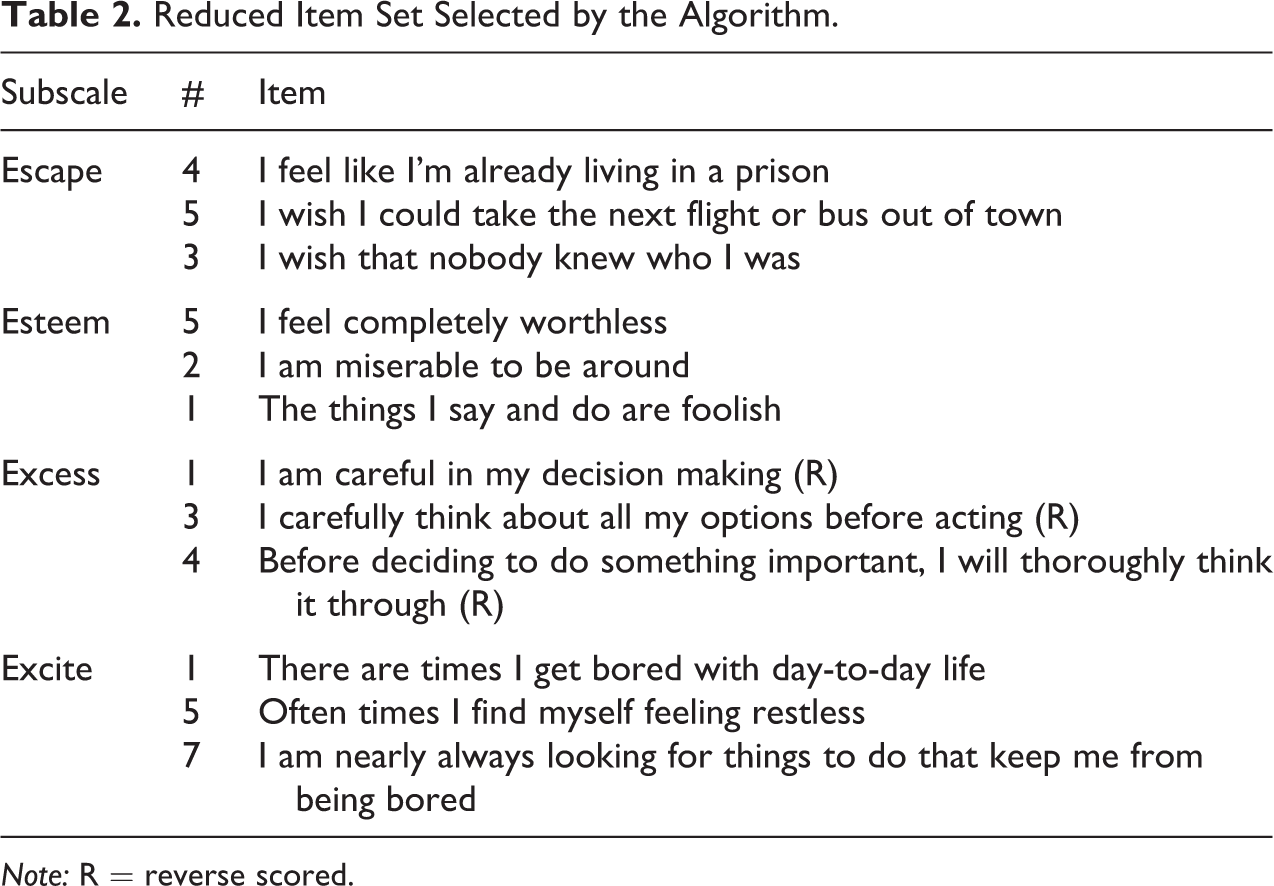
Table 2 shows the final 12-item set selected by the algorithm. The items selected had good construct validity with respect to the underlying constructs. The items selected correspond to purely psychological concepts and have no construct overlap with the behavioral addiction measures.
Reduced Item Set Selected by the Algorithm.
Note: R = reverse scored.
Discussion
Our motivation for developing the current approach stemmed from dissatisfaction with currently available methodologies. Some previous attempts have been to apply CFA/SEM in an exploratory nature fashion to accomplish item selection. However, as pointed out by Thompson (1997) and Raubenheimer (2004), in practice, researchers often neglect model-wide aspects of item performance, focusing instead on loadings of individual items on factors.
Presently, item selection is usually performed using a variety of manual and subjective techniques. On one hand, clearly inappropriate practices, such as selecting Likert-type items based on optimizing α reliability alone, remain common in many disciplines. The deficiencies in the current practice of item selection can be traced to (a) a lack of a framework to simultaneously consider multiple psychometric criteria and (b) the use of manual procedures, rather than the use of a systematic search algorithm. As a result, better alternatives are complex to implement, involve significant manual intervention and expert judgment, and consider each type of psychometric criteria separately in a sequential process. For example, in a highly influential article, Gerbing and Anderson (1988) suggested that multidimensional scales be developed in a multistep process: defining preliminary scales through item total correlations and/or exploratory factor analysis (EFA), examining the unidimensionality of these scales through CFA, and assessing the reliability of these scales through internal consistency analyses.
Wille (1996) also suggested a sequential approach that begins with internal consistency analyses and is followed by convergent and discriminant validity analyses. In discussing a modified version of Wille’s (1996) approach, Raubenheimer (2004) emphasizes that item selection is ultimately done “subjectively.” The current article presents the case for explicit definition of the item selection rule (loss function) and repeated application of the rule (stepwise backward selection) to obtain a reduced scale. We do recognize that one potential danger in increasing the convenience of item selection is to encourage an unconsidered “black box” approach by researchers. Cautions for use should mirror that of other exploratory methods (stepwise regression, EFA), in which the algorithm-determined solution is subjected to a number of checks and tests for acceptability.
In contrast to the alternatives, the proposed method represents an objective and automatic methodology, yielding not only a significantly more convenient tool for researchers but also allowing much easier documentation and replication of methods. We take advantage of the unifying character of SEM, which entails that an “extended” residual covariance matrix (including also the error terms for endogenous measurements) subsumes a variety of psychometric criteria hitherto considered separately and sequentially. This proposed composite loss function allows for the simultaneous consideration of several classes of psychometric criteria, providing for a “one-step” method for item selection.
Limitations and Future Work
We have consciously avoided several issues in proposing the current method. The first limitation is the use of stepwise item-set reduction algorithm. This algorithm is “greedy,” in the sense of optimizing the cost function at each step, but not being guaranteed to converge to a global minima. Other legitimate choices of algorithm are possible. One alternative we tested involves drawing a very large number of random subsets of items (of fixed size) from the initial set. This implements a random uniform probe of the space of possible combinations. Also tested was a simple stochastic steepest descent algorithm. Other options include GAs or simulated annealing. Future work might profitably explore alternative optimization methods. While we do not report a systematic test of alternative algorithms, our intuition is the stepwise item-elimination approach, which incorporates information from the initial full item set for as long as possible, is more likely to find an item subset that well covers the domain of the original construct.
A more fundamental concern is that the item removal algorithm described progressively discards potentially useful information from eliminated items. The risk is that, as the retained item set grows smaller, the latent factor may become misspecified. An alternative perspective is to assume the latent variable derived from the full set represents the ground truth, and the objective becomes approximating this using a smaller item set. This may be a better option when the researcher is confident that the full item set well describes the construct of interest, and other sources of validity are not available.
As has been emphasized, the proposed loss function is somewhat arbitrary in that it does not provide guidance on the relative weighting of the three components of psychometric performance. It relies on the assumption that it is practical and meaningful to simultaneously optimize model fit, predictive utility, and error variance (one-step modeling). Some might argue that it is more meaningful to first optimize measurement error and then optimize other criteria. However, an equally valid view is that this unreasonably prioritizes reliability over other aspects of item functioning. The benefit of the suggested loss function is primarily in integrating various psychometric criteria into a single measure, thus permitting an omnibus measure of item performance, itself a prerequisite for simultaneous algorithmic optimization. Nevertheless, we recommend further work by theoretical statisticians to develop alternative loss functions with a stronger analytical basis.
We have deliberately avoided the question of whether to treat ordinal Likert-type data in SEM via an IRT-related graded response model (GRM; Samejima 1997) or via a polytomous correlation matrix (Lei 2007). For ordinal data, IRT has the additional feature of directing attention toward item intercepts as well as item discrimination/factor loadings. Polychoric correlations have been employed in the present article for computational stability and efficiency. Although they are theoretically an indirect indication of the correlations between the underlying hypothesized continuous variables, empirical evidence suggests they perform at least as well as theoretically appropriate multidimensional item response models (Knol and Berger 1991). One convenient approach for ordinal (Likert-type) or binary data would be to use polychoric correlations for the optimizing process, reserving an IRT/GRM-based SEM (Glockner-Rist and Hoijtink 2003) for evaluating the final model.
The algorithm is based on psychometric criteria alone and does not take into account content validity of the items. It presupposes that the original pool of items has been selected with care to represent the desired construct. As with any exercise in scale reduction, care must be taken to ensure that construct underrepresentation has not been introduced in the shortened scale. Therefore, the content of the reduced scale should be inspected carefully with this in mind. However, the loss function proposed here would certainly be less susceptible to this problem than other methods (e.g., relying on reliability alone). First, item subconstruct clusters would be characterized by excessive positive residual covariance, which is detected by SEM residuals and penalized by the loss function. Second, diminished construct representation should reduce predictive validity and therefore also be penalized accordingly. Nevertheless, consideration of item content remains a meaningful aspect of item evaluation for which there is no substitute for manual intervention.
Finally, an important characteristic of the algorithm detailed here is that the item-factor loadings are freely estimated. This might create issues of model misspecification when the item set is small (e.g., 3–5 items), and a certain item(s) might unduly influence the estimation of the latent factor. An alternative implementation of the method could involve constraining item-factor loadings to unity: entailing a τ-equivalent model constraint and item evaluation more in line with classical test theory. This more highly constrained model specification would restrict the relative influence of individual items on the latent factor and probably perform better when the item set is small. Future work needs to consider which approach is most effective for the practical purpose of item selection.
The limitations mentioned above are mostly specific to the current implementation. There would appear to be many opportunities to test potentially better alternatives; most notably in the choice of loss function, factor item link functions (e.g., IRT based), and in whether or not to employ a τ-equivalent item-factor model. The goal of this article has been to suggest the concept of a stepwise item selection algorithm, using an explicit prior measurement and structural model for evaluating item functioning. We have attempted to demonstrate that such an algorithm is practically feasible.
In terms of future work, we do not propose the described methodology is yet ready for general use. Rather, our goal is to open a dialogue on the potential for SEM to provide a framework for more explicit and integrated item evaluation. More theoretical and simulation work is required before any such method could be recommended for general use. If this is completed with positive results, the opportunity exists for the creation of add-on toolboxes to standard SEM software. These would deliver robust and user-friendly automated item selection and scale reduction procedures for general users, requiring only the ability to correctly specify a measurement and structural model within the standard SEM framework. The increased facility to more easily reduce scales should be combined with objective diagnostics that prevent misuse, and recognition that the psychometric qualities of any reduced scale should be treated with caution, until proven otherwise.
Supplemental Material
Supplemental Material, Appendix_1_661580 - An SEM Algorithm for Scale Reduction Incorporating Evaluation of Multiple Psychometric Criteria
Supplemental Material, Appendix_1_661580 for An SEM Algorithm for Scale Reduction Incorporating Evaluation of Multiple Psychometric Criteria by Eldad Davidov, Matthew Browne, Matthew Rockloff, and Vijay Rawat in Sociological Methods & Research
Footnotes
Declaration of Conflicting Interests
The author(s) declared no potential conflicts of interest with respect to the research, authorship, and/or publication of this article.
Funding
The author(s) received no financial support for the research, authorship, and/or publication of this article.
Supplemental Material
Supplemental material for this article is available online.
Note
References
Supplementary Material
Please find the following supplemental material available below.
For Open Access articles published under a Creative Commons License, all supplemental material carries the same license as the article it is associated with.
For non-Open Access articles published, all supplemental material carries a non-exclusive license, and permission requests for re-use of supplemental material or any part of supplemental material shall be sent directly to the copyright owner as specified in the copyright notice associated with the article.
