



Abstract
How household-level data from censuses and surveys are analyzed to study household structure is an issue that has received little attention. The present study proposes a new methodological approach to address this gap. Specifically, we introduce the idea of the household configuration as a mathematical representation of observations from the household roster that uses the tools of sequence analysis to study relationships between household members. This “household configuration approach” is statistically efficient, captures the heterogeneity of family forms in a population, and is computationally simple. An application to Canadian census data for Indigenous and non-Indigenous peoples shows that our approach can yield interesting insights into household structure, otherwise not readily obtained.
The household 1 is almost universally used as the unit of enumeration in censuses and surveys around the world. Following international recommendations, information at the household level is recorded through a standard questionnaire. This is referred to as the household roster because it is an ordered list of all household members used to identify the persons to be counted in a population census (United Nations 2010:98) or to draw the sample of individuals to be interviewed in a survey (United Nations 2005:27-82). International guidelines specify that the household roster also needs to collect information about household composition, that is, about the relationship between each household member and a reference person, generally the household head (United Nations 2010:125). Because of this feature, the household roster is not only an essential instrument of data collection for censuses and surveys, but it is a fundamental analytical tool to examine household structure in a population.
It is well recognized that information collected via the household roster presents two measurement problems. The first relates to the concept of household and the second to the classification of relationships between household members (Hofferth and Casper Lynne 2007). On the one hand, the “cultural construction” of the concept of household (Randall et al. 2011) has received increasing attention in developing countries. Accumulating evidence from diverse disciplines in the social sciences indeed points to the fact that, in many countries, the social units where people live do not necessarily coincide with the households of either survey statisticians or users of household-level data (Cloke 2007; Randall and Coast 2015; Randall et al. 2011; Rao 1992; van de Walle 2006). On the other hand, the classification of relationships between household members has attracted attention in developed countries since the late 1970s. At that time, sociologists and demographers became aware that available categories of household structure were increasingly inappropriate to capture the diversification of family forms emerging from population aging, decreasing marriage rates, and rising age at marriage, cohabitation, divorce, and remarriage rates (Hofferth and Casper Lynne 2007). This awareness prompted statistical agencies to revise the type of relationships that could be recorded on the household roster. For instance, the 1981 Canadian census began measuring common-law unions as separate from marriages, and stepfamily relationships were introduced in the 2011 census. In the United States, the 2007 Current Population Survey introduced direct questions to identify cohabiting couples and to link children to their biological, step-, and adoptive parents. The diversification of available types of relationships on the household roster, however, introduced additional sources of error. For example, Manning and Smock (2005) have shown that the language used to describe family arrangements such as cohabitation affects whether respondents identify themselves as cohabiting or single on the household questionnaire. It has also been shown that, the more complex the family form, the greater the ambiguity in reporting about family relationships (Brown and Manning 2009; Stewart 2005). This latter problem is compounded by the fact that the household roster records relationships only from the standpoint of the household informant, which makes it impossible in complex families to determine the direct relationships between household members.
While research on measurement over the past two decades has raised questions about the way households and relationships between household members are operationalized as a concept in censuses and surveys, an issue that has received little or no attention is how household-level data are analyzed to study household structure. To date, no standard methodology exists, so that the manipulation of data on individual relationships collected through the household roster (the “raw” data on household composition) is notoriously difficult. Rather, in official reports and academic research, the current approach is to rely on predefined categories of household structure of interest that are generated by statistical agencies during the data processing phase of censuses and surveys. Since the late 1960s, these categories have been centered on the nuclear family, which has long been the most prevalent type of living arrangements in developed countries (Lesthaeghe 1995, 2010) and is increasingly so in developing countries as well (Bignami-Van Assche, Adjiwanou, and Boulet 2018; Locoh 1988; van de Walle 2006).
The current “top-down” approach to analyzing household structure centered on the nuclear family is valid as long as the categories of interest are appropriate to represent the social organization of the population under study. Since demographic factors and ethnocultural diversity increasingly contribute to household complexity in most societies, we need to rethink not only how household-level data are collected but also how it can be better analyzed to account for this changing reality. This is important to improve our knowledge of social organization and to appropriately tailor family policies.
In this article, we address these concerns by proposing an innovative methodological approach to analyze household structure from census and survey data that has three main features. First, it is statistically efficient as it exploits all information collected through the household roster without imposing categories a priori. Second, our “bottom-up” approach accounts for the heterogeneity of households’ living arrangements in a population. The third feature of our proposed approach is that it is computationally simple, and it can be easily applied to different sources of data from censuses and surveys around the world.
We begin by describing the standard approach to study household structure in more detail. We then demonstrate the potential and value of our approach for identifying differences in household structure between Canada’s two main population subgroups, Indigenous and non-Indigenous peoples.
The Standard Approach to Study Household Structure
In its most basic form, the household roster is a table that is filled out at the beginning of every census and survey interview. On the first line, the roster records the name and basic characteristics (e.g., age, education) of the household reference person (generally the head of the household). The following lines include the name and characteristics of the other household members, as well as their relationship to the reference person. 2 The type of relationship that can be recorded varies over time and space. For example, the latest Canadian and U.S. censuses include, respectively, 81 and 19 options; and the most recent Demographic and Health Surveys allow for 11 choices. 3
As detailed as the information recorded on the household roster might be, data on household relationships are manipulated during the processing stage of censuses and surveys to provide a summary measure of household structure for each enumerated individual. Consistent with the dominance of the nuclear family structure around the world, since the 1960s, international guidelines have recommended that the key aspect of this procedure should be identifying the “family nucleus” of which the private household is composed. This family nucleus is defined as a married/cohabiting couple or single parent and their never-married children living in the same household (United Nations 2010:128). Following these standards, Statistics Canada and most European census reports classify household structures according to the concept of the census family, which is equivalent to the United Nations’ family nucleus (Statistics Canada 2011b; United Nations Economic Commission for Europe 2015). Census family households have at least two members related by birth, marriage, or adoption whereas noncensus family households can be a person living alone or only with nonrelatives such as boarders or roommates. Similarly, published figures by the U.S. Census Bureau (2015) and the Australian Bureau of Statistics (2009) distinguish family households and nonfamily households.
The standard approach to study household structure from a priori classifications centered on the family nucleus does not necessarily capture the heterogeneity of social organization. This is because, although the family nucleus can have many subcategories of interest (United Nations 2010:128-130), “it does not provide information on all types of households, such as brothers or sisters living together without their offspring or parents, a childless aunt living with a niece, or a grandparent living with a grandchild” (United Nations 2010:127). This approach has been recognized to be especially inadequate in the African context (Locoh 1988), where the progressive standardization of census household classifications is claimed to have impoverished the study of the family (Tichit and Robette 2009:11).
Researchers interested in the full set of household relationships recorded in the household roster lack a standardized methodology to analyze these data, however. This task is difficult since household information is usually processed and digitally stored at the individual level and not all questions refer to the household as a statistical unit but rather to subordinate unit (persons) that appear in variable numbers within each household (United Nations 2005:218). To extract indicators at the household level from the raw data on household composition at the individual level is therefore cumbersome at the analytical stage. For instance, the statistical code used by Statistics Canada to derive categories of household structure from census data has 500 lines (personal communication). The program developed by Tichit and Robette (2009) to identify multiple family nuclei with merged household- and individual-level survey data in Africa is equally long and complex.
In sum, the standard approach for studying household structure is a top-down approach deriving from the concept of the family nucleus that, ultimately, limits our understanding of household structure. Yet, to date, no standard methodology exists to improve on this approach. To address this gap, we introduce the idea of the household configuration as a mathematical representation of observations from the household roster. We then propose an innovative “bottom-up” approach whereby all household configurations are first identified and then grouped according to their relative frequency in the population rather than being defined a priori as in the standard approach.
A New Approach: “Sequencing” Household Structures
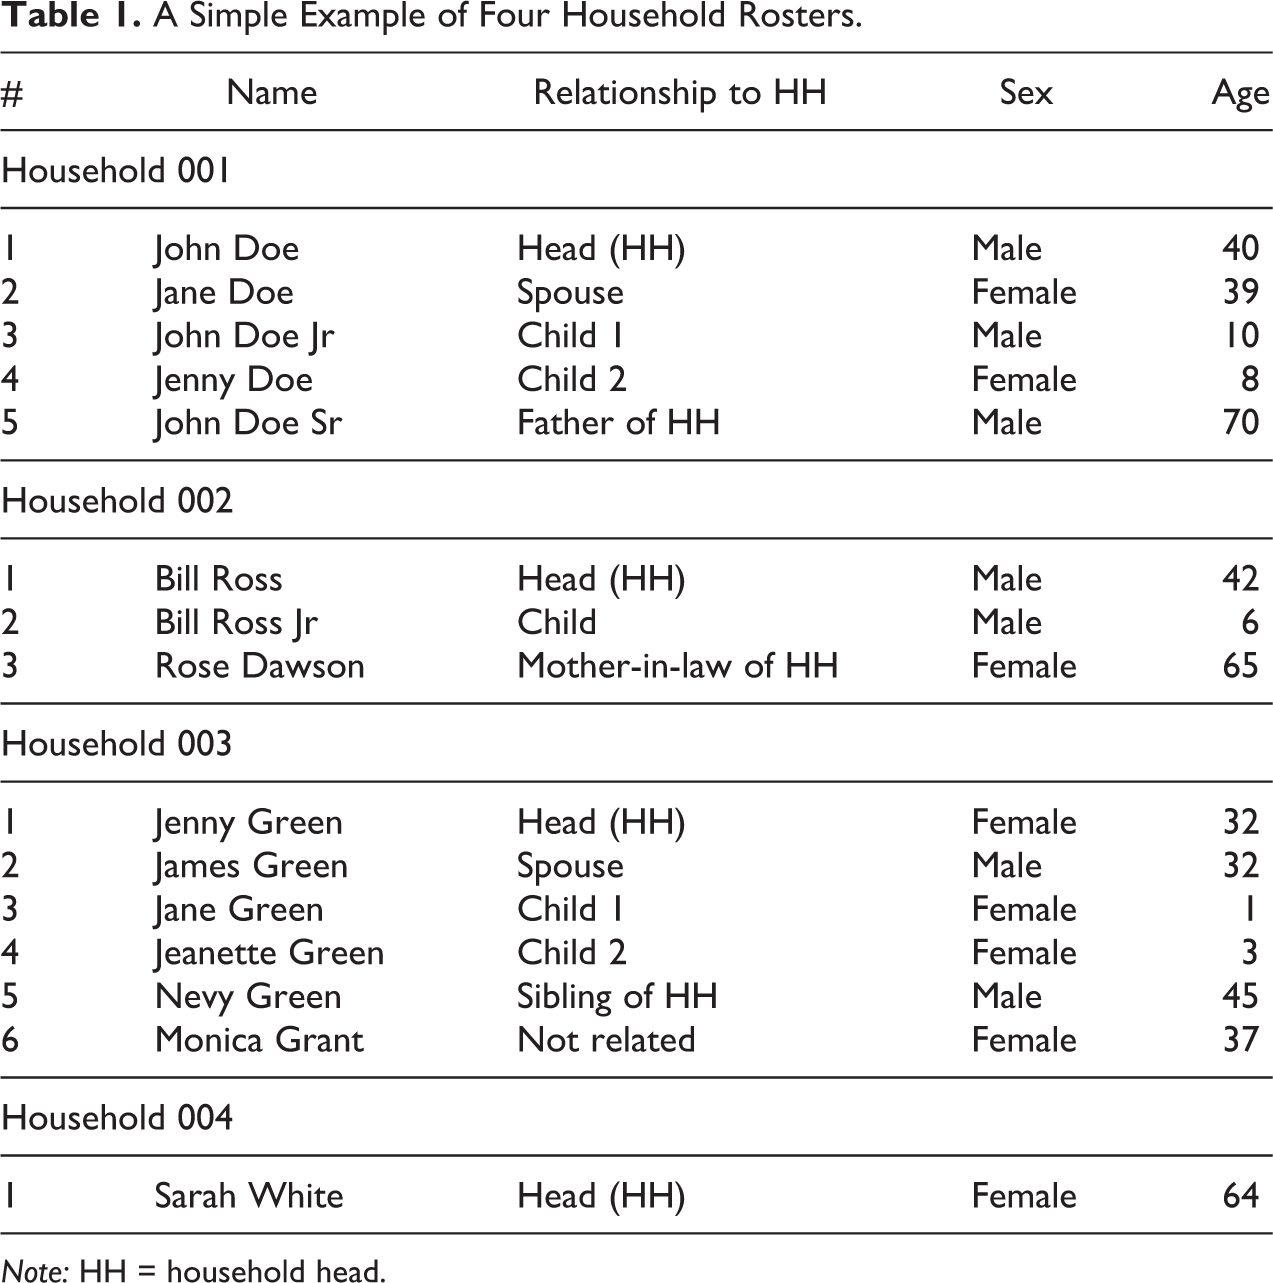
In order to illustrate our approach, we refer to an example of four hypothetical households enumerated in a population census. Table 1 presents information about their composition as recorded in the household roster. Following international standards, household members are listed in a specific order (United Nations 2010:127). The reference person and his or her spouse are found, respectively, on line 1 and 2 of the roster. They are followed by the children of the reference person, then by other relatives such as parents or siblings, and finally any other unrelated individual living in the household at the time of enumeration (de facto approach) or usually residing in the household albeit not present at the time of enumeration (de jure approach).
A Simple Example of Four Household Rosters.
Note: HH = household head.
Information about the relationships between the members of the four households above is stored in an individual-level microdata file (United Nations 2005:218), which has as many observations per household as household members listed in the roster (Table 2). As illustrated in the previous section, the standard approach to analyze this kind of data would be to differentiate households by whether they contain a family nucleus. In our case, the first three households fall into this category, and the last one is a noncensus family household. The second step of the standard approach would be to further classify census family households according to a certain number of subcategories of interest. For instance, let us assume these are nuclear families and lone-parent families. In our example, we would then identify two of the former and one of the latter. This classification would, however, mask the fact that in all three instances, there are other individuals living in the household who are related to the household head or their spouse, and thus these household structures would better be qualified as extended families. Even in this case, the “extended family category” would obscure the fact that in one case, there is an unrelated individual living in the household. Variables corresponding to the census family status and structure would be added to the data set and used to determine the distribution of individuals in different household types.
Microdata File for Four Households.

Note: White shade represents original roster variable and gray shade represents derived variable. H_ID = household ID; I_ID = individual ID; HH = household head.
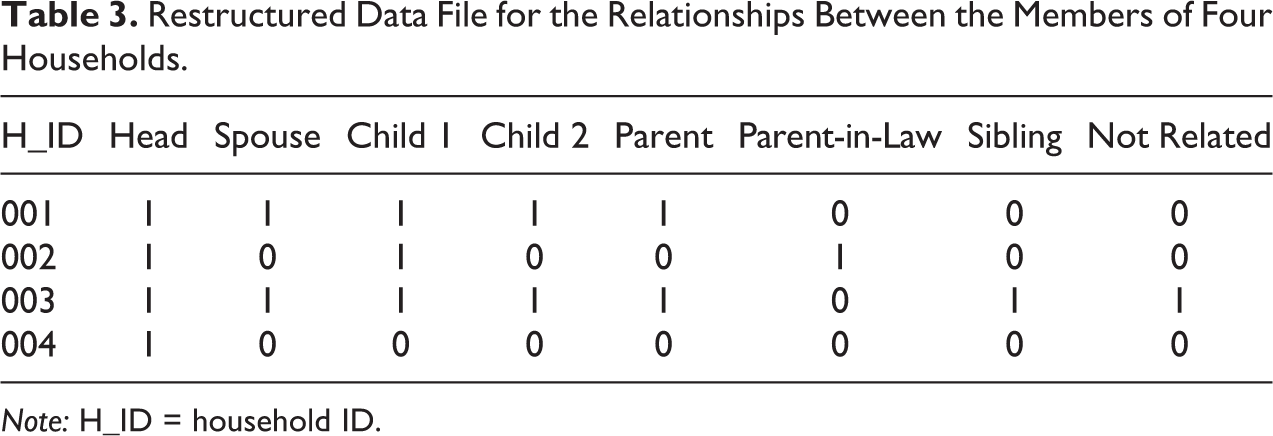
To exploit all information collected via the household roster, the starting point of our approach is to restructure the data set in Table 2 at the household level, that is, with one observation per household (Table 3). The result is a simple rectangular file with one row for each household and columns for each of the fields on the household roster. In such a structure (also known as a “flat” file), all variables refer to the household as a statistical unit, and each member occupies a fix position in reference to the household head.
Restructured Data File for the Relationships Between the Members of Four Households.
Note: H_ID = household ID.
After restructuring the data file at the household level, each observation in Table 3 can then be represented as an ordered list of elements (0 or 1): 11111000 for the first household, 10100100 for the second household, 11111011 for the third household, and 100000000 for the fourth household. Mathematically, these are four sequences with a fixed length that we will refer to as household configurations because they represent the position of each household member relative to the head of household as recorded in the household roster. The elements of a household configuration are relationships between the household head and the other members, which we will denote with ri . There is a finite universe of k possible relationships: R = {r 1…rk }, which depends on the categories allowed by the household roster and where r 1 will always represent the head of the household. Then, the household configuration is a vector of household positions (hp i), drawn from the universe R:

with h < k, so that hp i ∈ R for i = 1…h. The number of positions h is fixed as it corresponds to the size (number of lines) of the household roster.
The mathematical representation of observations from the household roster allows to apply the tools of sequence analysis to study the order in which elements (relationships) appear within a household configuration, as done in DNA sequencing (Sankoff and Kruskal 1983; Waterman 1995). 4 Standard statistical packages such as Stata’s SQ module (Brzinsky-Fay, Kohler, and Luniak 2006) and TraMineR’s package (Gabadinho et al. 2009) can be used to study the occurrence of particular sets of relationships that combine to form specific household configurations.
After assessing their relative frequency, we can combine household configurations that share similar characteristics into specific types of household structures in the same way that similar DNA sequences are grouped into gene families. This bottom-up approach leads to a taxonomy of household structures, as opposed to the predefined typologies used in existing research and public policies.
An Application to Canadian Data
In Canada, as in other developed countries, available categories of household structure in sociological and demographic research emanate from the concept of the nuclear family and thus focus on the distinction between married couples with children, single parents and more recently, stepfamilies (Statistics Canada 2011a, 2012a, 2012b, 2016). Existing studies have mainly adopted the same concepts and categories for Indigenous peoples, in particular to identify household structures that are associated with children’s well-being (Bougie 2010; Hull 2001; Quinless 2013; Turner 2016). Since the Western idea of the nuclear family does not correspond to Indigenous cultures and social organization systems (Castellano 2002; Dawson 2006; Peers and Brown 1999), a question that remains unanswered is to what extent existing categories of household structure are able to represent the heterogeneity of Indigenous living arrangements.
We address this issue by applying our approach to Canadian census data, and we demonstrate how it is better able to capture differences in household structure between Indigenous and non-Indigenous Canadians than standard categories do. Specifically, we use data from the 2011 National Household Survey (NHS), which replaced the long-form questionnaire in that census year (Statistics Canada 2011a, 2011b). 5 In each household, an informant (or “person 1” because it appears on the first line of the roster) provides basic information about the household members and their characteristics, including whether they identify with an Indigenous identity. 6 Overall, 1.4 million people reported an Indigenous identity in the 2011 NHS, corresponding to 4.6 percent of all Canadian households.
The NHS household informants also specify the relationship between themselves and all other household members by choosing among 81 available relationships (see Online Appendix Table 1, which can be found at http://smr.sagepub.com/supplemental/). This information is organized by Statistics Canada in five main categories of household structure of interest that are used in official reports and by the existing literature: nuclear, single-parent, step-family, multigenerational, and skipped-generation (Bougie 2010; Hull 2001; Quinless 2013; Statistics Canada 2011a, 2012a, 2012b, 2016; Turner 2016). For Indigenous peoples, however, available categories of family structure at the household level are more limited than for the Canadian population as a whole (Bignami-Van Assche and Simard 2020). 7 As it can be seen in Table 4, the NHS household file allows distinguishing only couples with children, lone parents, and couples without children. 8 Households that do not contain any family nucleus such as one-person households are included in the residual category of noncensus families. None of these categories differentiate households by whether additional members, whether related or unrelated to the household head, are present.
Percentage of Households with Different Structures by Indigenous Status, 2011.

Source: Our calculations from the 2011 National Household Survey public-use data file. All figures have been weighted.
To move beyond the categorization in Table 4, we applied our methodology to the confidential NHS “master” file, which contains the original information on all relationship types collected via the household roster (the “raw” data from the NHS roster). By doing so, we were able to identify 210 household configurations for non-Indigenous Canadians and 205 for Indigenous peoples. Only less than 1 percent of these configurations are “unique,” that is, shared by less than 10 households or specific to one household.
By plotting frequency distributions of the household configurations we identified, we found that the majority of Indigenous and non-Indigenous households (83 and 93 percent, respectively) belong to one of the five structures (Table 5). 9 The prevalence of other types of configurations is thus 17 percent for Indigenous households and 7 percent for non-Indigenous households. The higher percentage in the former case points to the greater degree of heterogeneity of household configurations that our approach can identify and distinguish between the two population subgroups.
Percentage of Households With Different Configurations by Indigenous Status and Statistical Frequency, 2011.

Source: 2011 National Household Survey master data file. All counts have been weighted and rounded, and all percentages have been calculated on the basis of weighted and rounded counts.
Note: The total number of Indigenous and non-Indigenous households is slightly higher than in Table 4, because the latter draws from the public-use version of the National Household Survey data file.
Despite this heterogeneity, our results indicate that the nuclear household (parents and their children living without any other related or not-related individual) is the most common living arrangement not only among non-Indigenous Canadians but also among Indigenous peoples. This similarity seems inconsistent with existing knowledge about Indigenous social organization, which highlights how Indigenous families are large, extended entities (Castellano 2002; Dawson 2006; Peers and Brown 1999). Our approach enabled us to demonstrate that this is because nuclear households do not have the same configuration in the two cases and that nuclear households in extended or multigenerational arrangements are indeed more frequent among Indigenous than non-Indigenous peoples.
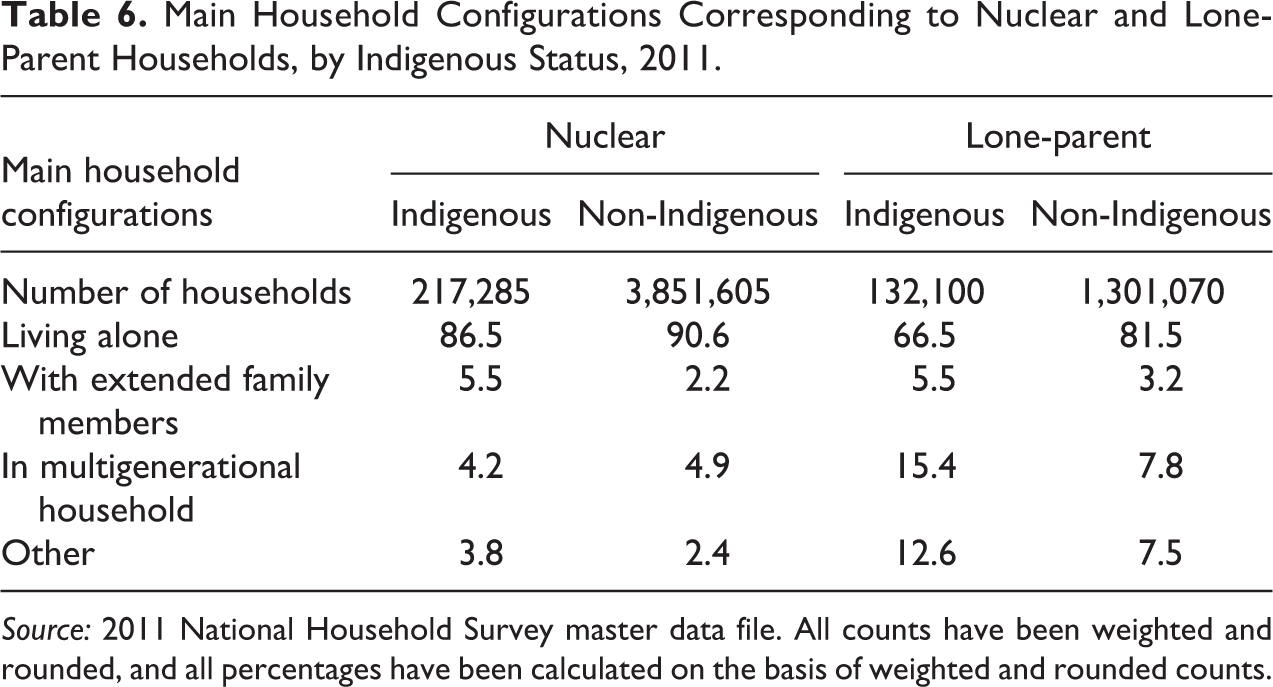
To illustrate this point, in the first row of Table 6 (left panel), we present the number of households that are classified as nuclear according to the standard category of Statistics Canada. In the four other lines, we decompose this figure and we identify the main corresponding configurations. For both groups, couples with children living in a household without anyone else present represent the majority of all nuclear structures (86.5 and 90.6 percent for Indigenous and non-Indigenous peoples, respectively). For Indigenous peoples, however, this proportion is slightly lower due to the higher proportion of households where the couple lives with extended family members (brothers or sisters, uncles or aunts), with grandparents present or a combination of the two (which contributes to the residual category). As shown in the right panel of Table 6, compared to non-Indigenous households, Indigenous lone-parent households are more heterogeneous than nuclear households as well. Only 66.5 percent of lone-parent Indigenous households do not include any other member, in contrast to 81.5 percent of non-Indigenous households. This is because more than 20 percent of Indigenous households with a lone parent also include either extended family members or grandparents, whereas this is the case for only 10 percent of non-Indigenous households.
Main Household Configurations Corresponding to Nuclear and Lone-Parent Households, by Indigenous Status, 2011.
Source: 2011 National Household Survey master data file. All counts have been weighted and rounded, and all percentages have been calculated on the basis of weighted and rounded counts.
Discussion and Conclusions
Since the mid-1980s, scholars in psychology, anthropology, demography, communications, political science, and, especially, sociology, have been using the tools of sequence analysis to analyze life-course processes (Abbott 1995; Aisenbrey and Fasang 2010; Billari 2001). In this article, we propose an innovative application of sequence analysis techniques to study social structure rather than the evolution of social processes over time. Specifically, we introduce the idea of the household configuration as a mathematical representation of observations from the household roster of censuses and surveys that allows for the application of the tools of sequence analysis to study relationships between household members and thus, ultimately, household structure.
An application of our approach to Canadian data for Indigenous and non-Indigenous peoples demonstrates an improved understanding of household structure in these two populations in three main ways. First, it permits the quantification of the differential heterogeneity in living arrangements between the two groups, which cannot be captured by standard approaches relying on predefined categories. For instance, close to a fifth of Indigenous households have complex structures beyond the juxtaposition of nuclear, lone-parent, and multigenerational families whereas the corresponding figure for non-Indigenous households is close to a tenth. Second, contrary to our expectations, extended families are not among the most prevalent household structures among Indigenous peoples. Indeed, in current work, we show that the nuclearization of Indigenous households had already occurred by the early 1990s (Bignami-Van Assche, Boulet, and Simard 2019), which raises important questions about the historical evolution of living arrangements in this population. Third, we can disentangle what type of living arrangements form the most prevalent household structures in the two cases. Notably, results for nuclear and lone-parent families indicate that their configuration is different for Indigenous and non-Indigenous peoples, with extended and multigenerational arrangements being more prevalent among Indigenous peoples than among the latter.
Our household configuration approach is efficient as it exploits all available information from a census or survey’s household roster without imposing any category a priori. Yet it is computationally simple and it can be easily applied to different sources of data from censuses and surveys around the world. Lastly, our approach creates the possibility to focus on any household structure of interest (even unique household structures) rather than being limited to available predefined categories. Since it enables the description of households’ living arrangements beyond the family/nonfamily dichotomy, our approach can have valuable applications to account for new forms of living arrangements such as couples living together or same-sex couples.
Supplemental Material
Supplemental Material, sj-pdf-1-smr-10.1177_0049124120986192 - A New Methodological Approach to Study Household Structure From Census and Survey Data
Supplemental Material, sj-pdf-1-smr-10.1177_0049124120986192 for A New Methodological Approach to Study Household Structure From Census and Survey Data by Simona Bignami-Van Assche, Virginie Boulet and Charles-Olivier Simard in Sociological Methods & Research
Footnotes
Authors’ Note
The analysis presented in this article was conducted at the Quebec Interuniversity Centre for Social Statistics (QICSS), which is part of the Canadian Research Data Centre Network (CRDCN). The services and activities provided by the QICSS are made possible by the financial or in-kind support of the Social Sciences and Humanities Research Council, the Canadian Institutes of Health Research, the Canada Foundation for Innovation, Statistics Canada, the Fonds de recherche du Québec—Société et culture, the Fonds de recherche du Québec—Santé, and the Quebec universities. The views expressed in this article are those of the authors and not necessarily those of the CRDCN or its partners.
Acknowledgments
The authors gratefully acknowledge support for this research from the Social Sciences and Humanities Research Council, Insight Development Grant 430-2018-0796. The authors also thank participants of the 2017 CIQSS Workshop on Available Data and Indicators about Indigenous Peoples, the 2018 Annual Meeting of the Association de démographes du Québec, the 2019 Annual Meeting of the Population Association of America, and two anonymous reviewers for their feedback on earlier versions of this article.
Declaration of Conflicting Interests
The author(s) declared no potential conflicts of interest with respect to the research, authorship, and/or publication of this article.
Funding
The author(s) disclosed receipt of the following financial support for the research, authorship, and/or publication of this article: This work was supported by Social Sciences and Humanities Research Council of Canada (Insight Development Grant no. 430-2018-0796).

Supplemental Material
Supplemental material for this article is available online.
Notes
References
Supplementary Material
Please find the following supplemental material available below.
For Open Access articles published under a Creative Commons License, all supplemental material carries the same license as the article it is associated with.
For non-Open Access articles published, all supplemental material carries a non-exclusive license, and permission requests for re-use of supplemental material or any part of supplemental material shall be sent directly to the copyright owner as specified in the copyright notice associated with the article.
