
Abstract
Despite the personal and organisational benefits and pitfalls associated with Impression Management, and considering the diverse nature of its population, South Africa is yet to develop, validate or adapt its own measure of impression management. The aim of this study was to validate the Bolino and Turnley Impression Management Scale for use in South Africa. A quantitative, cross-sectional survey design was employed using a sample of students from a South African university in Gauteng (N = 296). The exploratory factor analysis results show support for the five-factor model of the Impression Management Scale. The validation of the measure indicates sound psychometric properties and is therefore a valid predictor of impression management behaviour. The instrument may therefore be used in the South African university context to measure impression management behaviour. Recommendations include a validation of the same scale in an organisational setting.
Keywords
Impression management (IM) enjoys attention in the psychometric assessment space where individuals provide responses to psychometric measures that are seen as acceptable by general society. However, an alternative form of IM has garnered interest within the social psychology arena (see Barsness, Diekman, & Seidel, 2005). IM relates to the manner in which individuals either consciously or subconsciously engage in a variety of behaviours intended to alter the way in which they are perceived by others for their personal benefit (Bolino & Turnley, 2003b). As a social phenomenon, IM behaviour in its comprehensive form has not been adequately researched in South African psychology. Multiple frameworks classifying IM behaviour have been established (see Gardner & Martinko, 1988; Jones & Pittman, 1982; Wayne & Ferris, 1990), each focusing on different ways in which an individual engages in behaviour to alter another’s perception of them. The Jones and Pittman (1982) taxonomy is most relevant to the current research as it is the basis of the Bolino and Turnley (1999) IM Scale employed in this research. Studies aiming to further empirical understanding and salience of IM and its related constructs using the IM Scale have been conducted in Asia (see C. Chen, Yang, & Lin, 2010; Kim & Lee, 2012), the United States (see Barsness et al., 2005; Bolino & Turnley, 2003a) and Europe (see Bolino, Varela, Bande, & Turnley, 2006; Brennan, Guillamon-Saorin, & Pierce, 2009), thereby proving the international applicability of the IM Scale. Despite the international knowledge gained through the use of the IM Scale surrounding numerous benefits and pitfalls associated with IM, South Africa has yet to develop or validate its own measure, providing motivation for this study.
The diverse nature of the South African population presents a challenge as it has been empirically found that cultural differences may influence responses to items on certain psychometric measures, thus decreasing the instrument’s validity and reliability for measured groups (Meiring, Van de Vijver, & Rothmann, 2006). Taking into account the considerable diversity found within the South African population in terms of race, gender, level of education and ethnicity (Zulu & Parumasur, 2009), it is necessary that a psychometric measure be proven valid and reliable before the measure is distributed among the heterogeneous South African population.
Jones and Pittman Taxonomy
A popular taxonomy in IM research and one that is relevant to the current study is that of Jones and Pittman (1982). The results of Bolino and Turnley’s (1999) scale development relied primarily on the following five strategies as identified by Jones and Pittman (1982) which portray a variety of methods in which individuals engage in IM: Ingratiation, Supplication, Self-promotion, Exemplification and Intimidation.
The strategy of Ingratiation, the most pervasive of the five self-presentation strategies (Jones & Pittman, 1982), is used by an actor when they assume the characteristics and traits which are seen as likeable by their target (Uitdewilligen, 2005). Jones and Pittman (1982) suggested that those who participate in Ingratiation tend to move between characteristics appreciated by their targets so that they may achieve the attribution of likeability. As a result, extensive use of flattery and complimenting the target is used in the process of Ingratiation (Uitdewilligen, 2005), agreeing with the target’s ideas and opinions, and either knowingly or unknowingly appealing to the target’s human nature in that the target will greatly approve and support those who behave similarly to themselves (Vonk, 2002). According to Schokker (2007), Ingratiation has drawn the most academic attention and has been the most researched of the IM tactics. Y. Chen, Lin, Tung, and Ko (2008) found that when behaving towards a supervisor who has control over rewards, an individual with a high level of Ingratiation motives may adjust their behaviour to align with organisational standards.
When an actor makes it known to their target that they are able to make the target’s working environment difficult if they do not bend to the actor’s will, the actor is said to be engaging in the IM tactic of Intimidation (Bolino & Turnley, 2003b; Jones & Pittman, 1982). Jones and Pittman (1982) suggested that if the actor is pushed too far, the actor might respond in an aggressive manner towards those who disagree with them. Intimidation is used both when the actor attempts to convince the target that they are dangerous and when the intimidator has secured sufficient amounts of power to be a real threat to targets. Furthermore, according to Cole and Rozell (2011), the amount of power used during Intimidation exists on a continuum which ranges from moderate to extreme.
Bolino and Turnley (2003b) proposed that those who engage in Intimidation strategies might be perceived by their supervisors as powerful, knowledgeable and more capable. Those who succeed in intimidating others, in rare cases, might obtain higher performance ratings out of fear on the part of those who are providing them (Jones & Pittman, 1982). However, the same actors who engage in Intimidation might also be seen as a liability and a threat to group work and cohesiveness and might then receive lower performance ratings (Bolino & Turnley, 2003b).
The IM tactic whereby an individual builds their image and projects their most attractive characteristics to be perceived as competent within their working environment is known as Self-promotion (Jones & Pittman, 1982; Rudman, 1998; Schokker, 2007). As explained by Schokker (2007), the self-promoter wishes to use verbal or non-verbal communication whereby they intend to describe themselves as competent. According to Cole and Rozell (2011), the intended outcome of Self-promotion is to obtain popularity or likeability from targets, often through the use of charisma. Rudman (1998) maintains that this tactic is particularly useful when the self-promoter is not known to the target and when the self-promoter is in competition for resources with others. Jones and Pittman (1982) noted that a gifted social climber and self-promoter is likely to subtly use the display of expensive clothes, cars or even property to secure their place in the ‘upper-class’ of an organisation. However, this tactic is more acceptable and deemed normal when used by men as opposed to women (Miller, Cooke, Tsang, & Morgan 1992)
The fourth type of IM tactic, Exemplification, refers to the act of giving the impression of an ideal employee who is committed to their job beyond the call of duty while creating a feeling of guilt among those around them (Jones & Pittman, 1982). When compared to Ingratiation and Self-promotion, Exemplification has been studied to a far lesser extent (Turnley & Bolino, 2001). While self-promoters and exemplifiers both aim to gain respect and admiration, the type of attributions they seek are slightly yet significantly different in that while the self-promoter wishes to be competent, knowledgeable and admired, the exemplifier aims to radiate integrity and irreproachable moral fibre (Jones & Pittman, 1982). Those who engage in Exemplification tend to portray actions of self-sacrifice in order to gain the appreciation and possible following of those who observe them (Jones & Pittman, 1982). Exemplifiers seek to influence others through their selfless integrity in order to influence strong sources of power such as supervisors, employers and executives (Jones & Pittman, 1982). Behaviours reflecting extreme dedication and related to Exemplification include coming to work early and leaving late, working for many consecutive hours without taking a break, using the office phone after office hours to make contact with a supervisor to provide an update on the status of an assignment, even though these employees often take extended lunch hours and plan social activities during the working day (cf. Bolino & Turnley, 1999; Jones & Pittman, 1982).
The IM strategy whereby an individual draws attention to the weaker areas of their persona in order to gain help from others is known as Supplication (Cole & Rozell, 2011; Jones & Pittman, 1982) and is often used by individuals who lack the resources or are inept at using the resources implied by the preceding IM tactics (Jones & Pittman, 1982). Lai, Lam, and Liu (2010) propose that Supplication is played out in the organisational context by the actor having the ultimate goal of surpassing a chore or piece of work. By advertising one’s weaknesses, Jones and Pittman (1982) suggested that a norm of obligation or social responsibility is elicited from the target who has better access to and can make better immediate use of resources. Actors who engage in Supplication are often perceived as ill-equipped and lazy (Bolino & Turnley, 2003a), resulting in a negative effect on their performance reviews.
The Bolino and Turnley IM Scale
In an attempt by Bolino and Turnley (1999) to measure IM based on the taxonomy developed by Jones and Pittman (1982), five studies were conducted. Study 1 was conducted in order to establish which items contained high enough content validity to be included in the measure. An initial 44-item questionnaire that measured IM behaviours as per the taxonomy of Jones and Pittman (1982) was developed from a multitude of previous literature on IM behaviours; some of the questions were rewritten to enhance the face validity of the questionnaire. After establishing which items measured the latent construct, 26 items were retained from the original pool.
Study 2 assessed the validity of the shortened pool of items generated by Study 1. The revised questionnaire contained a 5-point Likert scale and was further reduced to 21 items. Study 3 entailed revising the wording of some items and creating more items for the categories of IM which did not have sufficient items. In Study 4, the final version of the scale was administered to a group of professionals to confirm that the identified factors measured the underlying construct. The scale’s validity and reliability were also assessed. Finally, in Study 5, the convergent and discriminant validities of the 22-item, 5-point Likert scale measure were assessed. According to Bolino and Turnley (1999), the advantages of their scale include that it was developed through the use of IM theory, the scale represents the full scope of IM behaviours used by employees in organisations and, finally, the model was developed and revised using diverse samples, thereby enhancing its applicability.
Self-monitoring
The manner in which individuals observe and control their overt and expressive behaviour, through an increased sensitivity to situational cues, in order to achieve a specific outcome, is known as Self-monitoring (SM) (see Ickes, Reidhead, & Patterson, 1986; Snyder, 1974).
According to Snyder (1974), the goals of SM may include the communication of a random emotional state which might not be aligned to an actual emotional experience; to hide, through adaptation, an inappropriate emotional state and appear indifferent; or to conceal an emotional state which is not appropriate to the context. Although SM is best portrayed using a continuum, typical high self-monitors are those who, through their heightened sensitivity to social cues, are able to purposefully alter their behaviour in an effort to make them appear as they so desire, while typical low self-monitors would portray less of a need to project what they feel is an untrue representation of themselves, although this is not to say that they have a low sensitivity to social and contextual cues (cf. Mehra, Kilduff, & Brass, 2001).
In a study conducted by Mehra et al. (2001), which examined how different personality types benefitted from social networks in organisations, it was found that within friendship and workflow networks, high self-monitors outperformed low self-monitors, and those who were closer to the centre of a social network outperformed those who were not, suggesting that high self-monitors interacted with more people in an effort to do their work. Both the study conducted by Mehra et al.(2001) as well as the present study make use of Snyder and Gangestad’s (1986) 18-item SM Scale which measures the extent to which one concerns oneself with social appropriateness and the manner in which one presents oneself (Snyder, 1974). The revised SM Scale was shown to comprise two factors, namely, Public Performance (strongly related to acting and extraversion; John, Cheek, & Klohnen, 1996) and Other-directedness (the tendency of an individual to mask their feelings and participate in behaviour that is seen as socially pleasing; Larkin, 1991).
The present study aimed to investigate the validity and reliability of the IM Scale in the South African university context. The convergent and discriminant validities of the IM Scale are dominant features of this study. It is the aim of convergent and discriminant validity examinations to demonstrate and prove that the Bolino and Turnley (1999) IM Scale correlates with the Snyder and Gangestad (1986) SM Scale due to their similarities, but that these correlations are not high enough to suggest redundancy. An individual can be said to take part in the SM when they exhibit the capabilities to observe and control their overt and expressive behaviour through an increased sensitivity to situational cues in order to achieve a specific outcome (Snyder, 1974). This definition is directly related to IM in that certain perception-altering behaviours are engaged in to achieve some form of end goal.
Method
Participants
Convenience sampling was used in order to gather large amounts of information quickly and easily. Data (which are available via the corresponding author) were collected from a sample of 296 undergraduate (76.35%) and post-graduate (23.65%) students across the Faculties of Management and Health Sciences at a South African university. The students self-identified as having at least a good command of English. Women comprised 62.16% of the sample. The majority of the sample participants (55.74%) were aged between 21 and 30 years. The average age of the participants was 21.60 years (mean = 21.60 years; standard deviation [SD] = 3.324 years; median = 21.00 years), followed by participants whose ages ranged from 18 to 20 years (40.88%). The ethnic distribution of the sample was 62.16% Black/African, 25.68% White, 6.08% Coloured and 5.40% Indian.
Instruments
The IM Scale
The extent to which an individual engages in the IM tactics of Ingratiation, Intimidation, Supplication, Exemplification and Self-promotion (Jones & Pittman, 1982) was measured by Bolino and Turnley’s (1999) 22-item IM Scale. An example of an item measuring Self-promotion is ‘Talk proudly about your experience or education’, while a typical measure of Ingratiation includes ‘Do personal favours for your colleagues to show them that you are friendly’. An example of an item which alludes to Exemplification includes ‘Arrive at work early to appear dedicated’, while Intimidation is gauged by items such as ‘Let others know that you can make things difficult for them if they push you too far’. Finally, an example of an item portraying IM tactic of Supplication is ‘Pretend not to understand something to gain someone’s help’. The scale takes the form of a 5-point Likert scale ranging from 1 (strongly disagree) to 5 (strongly agree) in which participants are requested to rate the item on how it describes them best. Bolino and Turnley (1999) found their instrument to be reliable with the following Cronbach’s alpha coefficients for Self-promotion (α = .74), Ingratiation (α = .75), Exemplification (α = .70), Intimidation (α = .81) and finally Supplication (α = .88).
The SM Scale
Snyder (1974) developed a 25-item scale to describe and further determine the extent to which individuals concern themselves with the social appropriateness of the manner in which they present themselves. The scale was later revised and resulted in an 18-item scale which measures the construct of SM to a greater degree (Snyder & Gangestad, 1986). The revised 18-item scale was shown by John et al. (1996) to comprise two factors, namely, Public Performing (12 items) and Other-directedness (6 items). An example item measuring the construct of Public Performing is ‘I have considered being an entertainer’, and an item which gauges the extent of Other-directedness is ‘I may deceive people by being friendly when I really dislike them’. The scale takes the form of a Guttman-style response format of True–False. The Cronbach’s alpha coefficient for the 18-item SM Scale was found to be .81 (Turnley & Bolino, 2001). The Cronbach’s alpha coefficient for the 18-item SM Scale was found to be .81 (Bolino & Turnley, 2003a).
Procedure
Students were told what IM is and that the aim of the study was to validate a North American scale for the South African context. All questionnaires were paper-based, and at least one researcher was present to administer the survey and answer any logistical questions that the participants may have had. All questionnaires were completed during class time. No incentives were offered. Because the study dealt with student participants, a paper-based format was the most convenient format of data collection as students could complete the questionnaire in one seating. The construct of the scale measuring SM draws strong parallels to IM. The two constructs have often been studied together in past literature (cf. Bolino & Turnley, 2003a; Gardner & Martinko, 1988; Kacmar, Harris, & Nagy, 2007), and thus, the SM scale presented a strong case for the measure of convergent validity.
Ethical considerations
Ethical approval for the research was given by the University of Johannesburg. All participants gave voluntary, informed consent to take part in the study and were aware of their right to withdraw from the study at any point. Confidentiality and anonymity were applied in dealing with participant data.
Data analysis
Statistical analyses were carried out using the R Studio program, utilising specifically the ‘Lavaan’ and ‘Psych’ packages (R Core Team, 2013). Descriptive statistics were obtained for all items comprising the IM and SM Scales, and data were analysed in terms of means, SDs, skewness and kurtosis. Exploratory factor analysis (EFA) enables researchers to discover the number and nature of variables which cannot be overtly observed and explain the variation and co-variation in a set of measured variables (Preacher & MacCallum, 2003). The following measures and criteria were employed for the current study: eigenvalues > 1, parallel analysis and scree test, the Root Mean Square Residual (RMSR), the Root Mean Square Error of Approximation (RMSEA), the Tucker–Lewis Index (TLI) and inspecting the residual matrix. Hu and Bentler (1999) suggest that standardised root mean square residual (SRMR) values of <.08 indicate an acceptable fit, and values of <.05 indicate an excellent fit. Within the current study, a cut-off point of .08 was applied. The following RMSEA cut-off values are recommended: values less than .05 indicate a close fit; RMSEA values below .08 suggest a reasonable fit, and values greater than .10 are indicative of a poorly fitting model (Browne & Cudeck, 1993). TLI values should be .90 or greater to be accepted (Harrington, 2009). We made use of Cronbach’s (1951) coefficient alpha as a measure of reliability. α = .70 was adopted as a cut-off point within the current study. Convergent validity of the IM compared to the SM was determined with Pearson’s Product–Moment Correlation.
Results
EFA
Data were extracted using the unweighted least squares regression (Minres) estimator. Minres is an estimator that is preferred over Maximum Likelihood, since it tends to make assumptions about the data (De Bruin, 2006). Orthogonal data rotation was used via the varimax method. Orthogonal rotation was chosen as it assumes uncorrelated factors and yields easily interpretable results (Costello & Osborne, 2005). This type of rotation is also aligned to the aim of the analysis by simply reducing the data into more manageable proportions (Ho, 2006). Overall, the data revealed that the five-factor model should be retained. The five-factor model was revised due to a problematic item (Item 13) which was removed from a second set of analysis done on the IM scale. The model fit statistics of the initial five-factor model as well as the revised five-factor model are summarised in Table 1.
Fit statistics for the initial and revised five-factor model of the IM Scale.
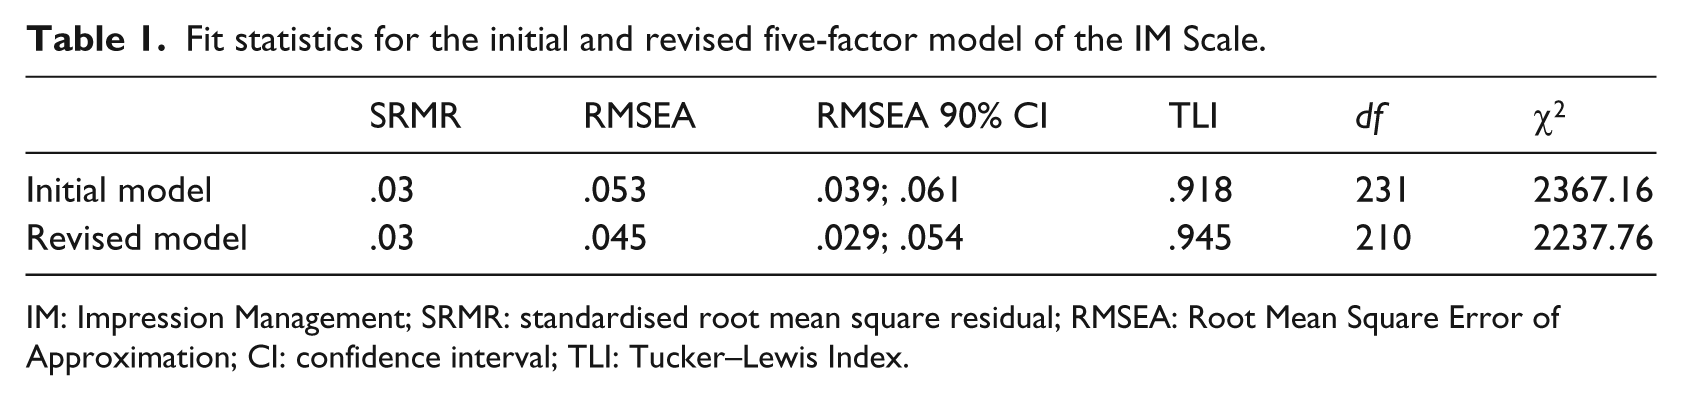
IM: Impression Management; SRMR: standardised root mean square residual; RMSEA: Root Mean Square Error of Approximation; CI: confidence interval; TLI: Tucker–Lewis Index.
In the first analysis, the fit of the five-factor model was excellent (see analysis section above) (Hu & Bentler, 1995) and explained 48% of the total variance (SRMR = .03; RMSEA = .053; TLI = .914). The only potentially problematic item was IM_13, ‘Be intimidating with classmates when it will help get your job done’ and was deleted on the basis that it carried a loading below the cut-off, suggesting that it might not be associated with any latent dimension. The revised model fit statistics improved, and the model explained 49% of the total variance (SRMR = .03; RMSEA = .045; TLI = .944).
Regarding the factor loading, a rotated factor solution (utilising varimax) of the revised IM scale was determined and reveals a clear five-factor model with factor loading ranging between .46 and .87 for the revised IM scale. Items showed satisfactory common variance ranging from .22 to .82.
Reliability
The standardised alpha coefficient for the revised IM Scale was deemed satisfactory (α = .84), while reliability scores for the items ranged between α = .83 and α = .85. Supplication showed a reliability coefficient of .83, intimidation showed a reliability coefficient of .84, self-promotion showed a reliability coefficient of .84, ingratiation was .84 and exemplification showed a reliability coefficient of .84.
Construct validity
The correlation matrix illustrated in Table 2 shows the extent of the relationship between the five-factor IM Scale and the two-factor SM Scale.
Correlations of the IM and SM subscales.
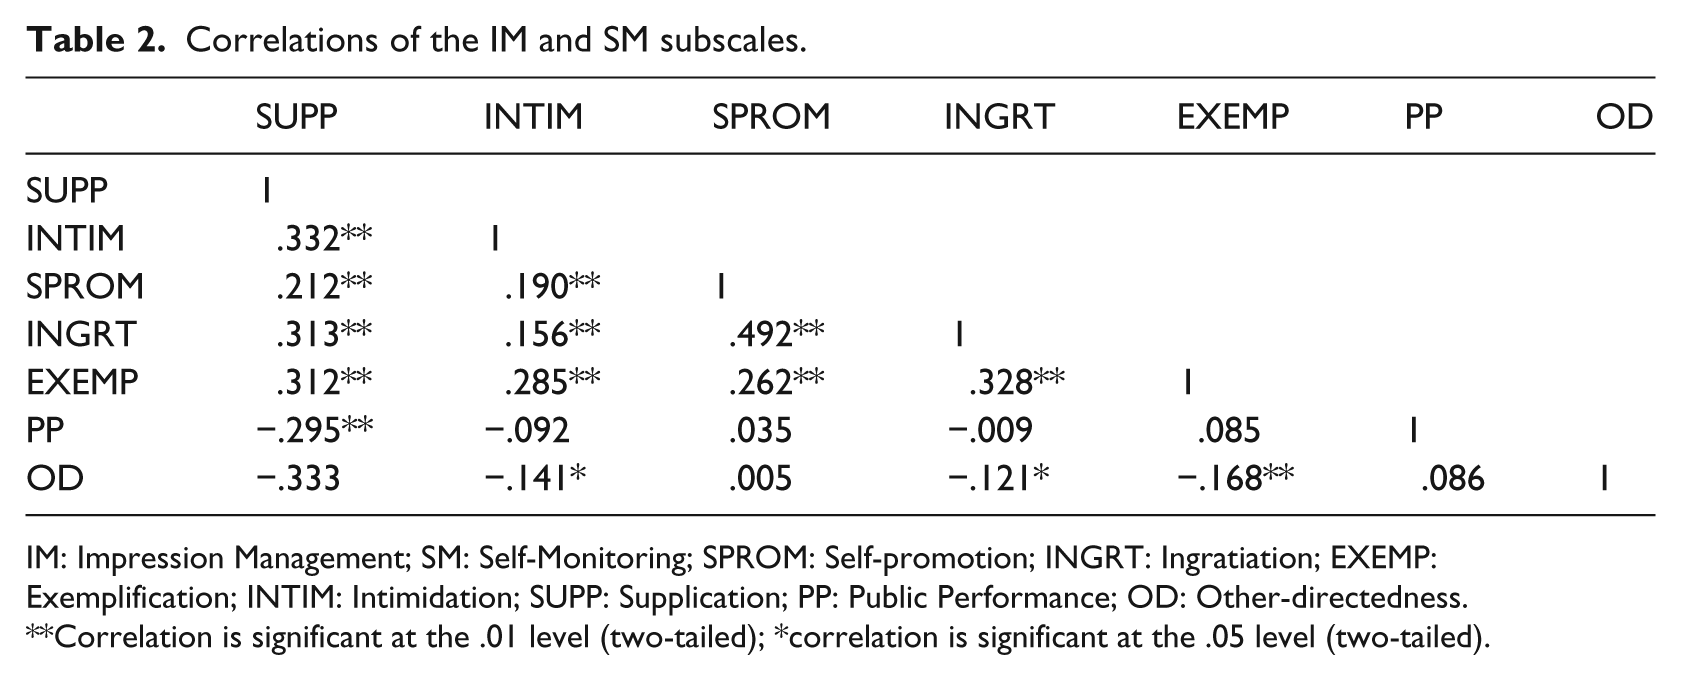
IM: Impression Management; SM: Self-Monitoring; SPROM: Self-promotion; INGRT: Ingratiation; EXEMP: Exemplification; INTIM: Intimidation; SUPP: Supplication; PP: Public Performance; OD: Other-directedness.
Correlation is significant at the .01 level (two-tailed); *correlation is significant at the .05 level (two-tailed).
In order to determine effect sizes of each correlational relationship, cut-off values for small effect (r > .1), medium effect (r > .3) and large effect (r > .5) were used (Cohen, 1992). Supplication showed a statistically significant negative relationship with Public Performance (r = −.295; small effect; p < .001). Intimidation shared a significant negative relationship with Other-directedness (r = −.141; small effect; p < .05). Ingratiation shared a significant negative relationship with Other-directedness (r = −.121; small effect; p < .05). Finally, Exemplification had a significant negative relationship with Other-directedness (r = −.168; small effect; p < .001).
Discussion
The primary aim of this study was to review the main dimensions of the IM taxonomy presented by Jones and Pittman (1982), and thus to assess the validity and applicability of the IM Scale within the South African context.
The original factor design founded on Jones and Pittman’s (1982) taxonomy proved that IM maintains a five-factor model (Bolino & Turnley, 1999) within a sample of people in the South African context. Contextualised, this result showed that the items of the IM Scale sufficiently loaded on their respective factors of Ingratiation, Supplication, Intimidation, Self-promotion and Exemplification. This finding in the South African context is aligned to that of the original factor design found by Bolino and Turnley (1999), as well as a replication study which confirmed the five-factor structure (Kacmar et al., 2007).
In addition to the results explained in the preceding paragraph, a single item, IM_13 ‘Be intimidating with classmates when it will help get your job done’, was found to have insufficient variance accounted for by this item with regards to the factor (Ho, 2006). This is not in line with research by Bolino and Turnley (1999), and might indicate contextual differences in the understanding of this particular item.
The low factor loading may be indicative of a complication regarding the wording of the item when one finds oneself in a context. In the above-mentioned item, the word ‘your’ may be suggestive of both a plural and a singular context whereby one would then intimidate others while working individually and/or in a group. In this vein, it might then be suggested that the wording of this item be altered slightly to ‘Be intimidating with classmates when it will help get your own job done’.
Alternatively, because there is very little that may be used to distinguish effectively between students at a level of tertiary education, it is also possible that the research participants did not engage in Intimidation behaviours. Aside from the first stage of the IM Scale’s development, the vast majority of research using the scale has taken place within organisations with distinct hierarchies (see Bolino & Turnley, 2003b; Kacmar et al., 2007), resulting in statistical clarity with regards to Intimidation. This explanation therefore serves as the more plausible of the two.
In order to purify the results obtained to better meet the first objective of the current study, and on the basis of IM_13 carrying a low factor score and an undesirable measure of variance, it was removed from the scale. The revised scale was then re-analysed using the same statistical techniques.
The items pertaining to Ingratiation, Supplication, Intimidation, Self-promotion and Exemplification loaded satisfactorily on their respective factors as specified by Bolino and Turnley (1999) in their scale development. Importantly, the revised IM Scale aligns closely to Bolino and Turnley’s (1999) conceptualisation of IM, implying that the revised scale retains relevance to the South African context. The first objective of the current study has therefore been met in determining the best factor structure in reviewing the main dimensions of the IM taxonomy presented by Jones and Pittman (1982).
By focusing on the operationalisation and measurement of IM within the South African context, validation of the IM Scale is imminent. By validating the Scale in such a context, the measure may be distributed to the wider population in an effort to gauge a deeper understanding of the IM behaviour of people within South Africa. Furthermore, validating the scale ensures the sound psychometric constitution of the scale (Meiring et al., 2006) when distributed to a unique South African context.
The revised SM Scale developed by Snyder and Gangestad (1986) was used in combination with the IM Scale to test for convergent validity, due to the congruities found in the past research conducted on the constructs of SM and IM. The five dimensions of the IM Scale – Ingratiation, Supplication, Self-promotion, Exemplification and Intimidation – did not show sufficient statistically significant results with the two dimensions of the SM Scale – Other-directedness and Public Performance – to prove convergent validity. However, the correlations among the five dimensions of the IM Scale are all statistically significant and range from small to medium effect sizes. This suggests that the IM Scale is valid for use in the South African context.
The IM Scale which showed the strongest model fit was found to comprise 21 items as opposed to the initial 22-item IM Scale as developed by Bolino and Turnley (1999). However, the five-factor model of the initial IM Scale within a North American context classified as Ingratiation, Supplication, Self-promotion, Intimidation and Exemplification was replicated as such within the South African context.
Although the results of the current study suggest that the IM Scale is both valid and reliable within the South African context, the study was not without any limitations. Although the sample tolerably reflected the demographics of the South African population, the sample consisted of undergraduate and post-graduate university students in an effort to mirror the scale development study of Bolino and Turnley (1999). Furthermore, any inferences drawn by the study are limited to the area of data collection, this being the Gauteng region as well as the fact that a convenience sample was used restricting us from generalising to the larger sample of students.
This study is also limited by its cross-sectional nature. This research design does not allow for inferences to be drawn after making comparisons across certain groups over time.
Conclusion
In assessing the relationships among the five dimensions of the IM Scale, the measure was therefore found to be both valid and reliable for use in the South African university context. Compared to the original IM Scale, Item 13 was excluded from the revised IM Scale due to it not being representative of IM for the South African university sample. Regarding reliability of the revised IM Scale, the measure consistently measured IM. The validity of the revised IM Scale was proved in that the items, excluding Item 13, effectively measured IM.
Regarding the convergent validity between the revised IM Scale and the SM Scale, the revised IM Scale showed to be a distinct and comprehensive measure of IM. The validation of the revised IM Scale most suitable to the South African university context did not show sufficient convergent validity with the SM Scale. This suggests that the two scales are not similar enough to bear a distinct relationship. The current research not only contributes to the limited body of knowledge in the South African university context but also confirms that the IM Scale is utilisable in the same context.
Much of the IM research occurs within the organisational context, and so the current study provides insight into IM behaviours only in terms of university students. To gain a wider understanding on IM behaviour in other settings such as the workplace, it is recommended that replication studies comprising of a South African sample of suitable participants in relation to the work context be conducted. Methodologically, the IM Scale was assessed for validity across a single, mixed South African sample. Owing to the complexity and the wide array of cultures comprising the South African population, a cross-cultural validation study would provide additional and significantly deeper insight into the IM Scale. By making use of different, culturally distinct samples, bias and equivalence presented to the greater South African population by the IM Scale may be measured. The IM Scale shows discriminant validity when compared to the SM scale; however, other scales could be considered in future research in order to better verify the distinctiveness of the IM scale.
Footnotes
Funding
The author(s) received no financial support for the research, authorship and/or publication of this article.