
Abstract
The monitoring of learning over time is critical for determining progression within and across cohorts of learners. This research investigated the use of the Rasch Measurement Model to determine the functioning of anchor items as well as an application of the model to convert the results to the same metric. A group of 321 Grade 8 learners and the same in the following school year wrote English Additional Language Comprehension Tests aimed at monitoring learning progression over years. The two tests were linked with 15 anchor items. This study examined the results of the anchor items from Years 1 and 2, applying non-parametric statistical tests as well as the Rasch Partial Credit Model to identify items which did not contribute to monitoring learning progression; these items were removed or refined based on the results and reviews by subject specialists. Learner results from Grades 8 and 9 were placed in the same frame of reference by applying the Rasch Partial Credit Model in order to establish a more accurate representation of the magnitude of learning progression. The first finding illustrated that applying non-parametric statistics and Rasch Measurement Theory identifies potentially problematic anchor items, and that when items are improved or removed, the overall results tend to be more stable and precise. Second, it was found that when applying Rasch item and threshold calibrations to assessment results, a more accurate indication of learning progression is obtained which can be used to communicate results to stakeholders and more importantly, inform teaching and learning.
Keywords
The accurate monitoring of learning progression is a key issue in psychological and educational assessment design. Designing anchor items, finding methods to analyse such items for tracking learning progression, and reporting these findings in useful ways is crucial if monitoring systems are to serve their purpose and have a positive influence on educational settings (Wilson, 2009).
Monitoring change in learner understanding over time is a complex task and fraught with difficulties. This might well be the reason for a shift in thinking regarding interventions to focus on the issue of teacher training and measuring change in teacher understanding of the content topic over time (Cunningham & Bradley, 2010). One of the major challenges of monitoring learner progression is controlling for extraneous variables, especially where the cognitive development of learners is concerned. This article examines ways in which to determine the usefulness of anchor items as well as the application of the Rasch Measurement Model (Rasch Measurement Theory [RMT]) to more accurately report on learning progression.
Monitoring progress is significant for a variety of reasons, which include affording parents and citizens accountability and information on the quality of an educational system. Measuring change over time is challenging, with some studies finding less predictive validity for interim measurements throughout the year (Petscher, Cummings, Biancarosa, & Fien, 2013) while others show the value of interim monitoring for predicting future performance (Safer & Fleischman, 2005; Scherman, 2007). Identifying ways to monitor performance is of utmost importance, and finding ways in which to do so accurately even more so (Bercher, 2012; Scherman, 2007). Proponents of external assessments, as well as critics of such systems, have, for decades, argued about the value of monitoring (Popham, 1987). This raises a key question about the value attached to the monitoring system, as learners, teachers, schools, or external agents may perceive its significance in various ways (Williams & Ryan, 2000). The impact of the assessments will, however, be determined by the nature of the feedback and the manner in which the results are used to inform the schooling system (Lyon, Gettman, Roberts, & Shaw, 2015; Stecker & Fuchs, 2000; Van Acker, 2002). A balanced and fair perspective is needed of the role that monitoring assessments play in the schooling system and the value attached to them.
For this study, an association of independent high schools, with an external funder, requested the development of a monitoring system to determine the level of teaching and learning across a group of schools. The testing system was intended to serve as an accountability system but had an added advantage in that it was specifically designed to give feedback on performance to schools, teachers, and learners. The English Additional Language, Mathematics and Natural Science assessment instruments were designed, piloted, and refined, to be administered at the end of each year to all learners in Grades 8–11. Upon further discussion, it was determined that tracking learner progression should be an additional aim of the monitoring system. Anchor items were designed for the three subjects to link the grades (8–11) and monitor learning progression. The schools recruit from low resourced communities and low functioning schools, focusing on learners who have the potential to perform better if placed in a resource-rich environment. The medium of instruction at the schools is English but as learners are not English Home Language speakers, English as an additional language is offered for learners to acquire and develop the English language skills necessary for learning. This context has made it crucial to track learner progression, to ascertain whether the schools have made a difference beyond that of expected development, and the level of development that could have been expected if learners had remained in their previous educational environments.
During the progression of the study, the researchers became critically aware of the challenges of monitoring learning progression, especially in the case of language development as a medium for learning in second language speakers. The design of the tests presented both measurement and conceptual challenges. One of these challenges was tracking learning progression in a subject such as English Additional Language, when the processes of language development are so integrated, complex, and varied. Another difficulty was measuring learners in the same frame from year to year, so that measurement is done consistently despite the fact that learners have changed within that year (developed into new versions of themselves). Learners constantly develop and change, and therefore one cannot assume that using the same items would result in measuring the same persons in the same way. This study examined and compared anchor items in the Grade 8 and Grade 9 English language comprehension assessments, both the total scores of the anchor items and the scores of the individual anchor items. Parametric and non-parametric statistical tests, as well as the Rasch Partial Credit Model, were applied to address the following research questions: (1) To what extent does each anchor item contribute to tracking/monitoring progression? (2) How can the Rasch Measurement Model be used to more accurately monitor learning progression and report results?
Method
Participants
Schools in the association are found in rural Limpopo, near Durban in Kwa-Zulu Natal, two schools near Cape Town and three schools in Gauteng located in or near informal settlements. All seven schools were included in the study which meant that all learners participated; therefore, the full population was assessed. As the schools follow a unique implementation of the curriculum, and is structured differently in terms of smaller class size, providing Saturday and holiday classes resulting in a more intensive focus on academic achievement, the learners are considered to be a specific population with unique characteristics.
A total of 321 learners wrote the English Additional Language comprehension test at the end of Grade 8 in November 2012, and then wrote a different English Additional Language comprehension test at the end of Grade 9 in November 2013; however, both tests had an anchor passage with 15 shared items based on that passage. In November 2012, the learner mean age was 14.1, and in November 2013 the mean age was 15.1, resulting in an age range of 5.78 and a standard deviation (SD) of .653. A total of 96% of the sample ranged between the ages of 13 and 15 years for Grade 8 and between 14 and 16 years for Grade 9, a range that is within the grade appropriate range. More girls (78%) than boys (22%) constituted the sample which included a girls-only school as well as other co-educational schools. However, these tended to have more girls (65% on average) than boys as schools reported that it was easier to recruit girls than boys. As previously mentioned, learners were English additional language speakers but received instruction through the medium of English language.
Instruments
The assessment instruments were two English Additional Language Comprehension tests, one designed for Grade 8 and the other for Grade 9 learners. Both instruments had 15 common items based on the same anchor passage. The tests were designed by subject specialists, piloted, refined, and continuously updated so that they were aligned with the South African national curriculum (Curriculum Assessment Policy Statements [CAPS]). The two language tests showed high reliability, with the Grade 8 test having a person reliability index of .83, and an item reliability at .98 (Real root mean square error [RMSE]). The Grade 9 test had a person reliability index of .81 and an item reliability of .98 (Real RMSE). (Additional information on Rasch reliability indices is provided in the ‘data analysis’ section.)
Procedure
The data collection took place in November of each year, and all learners in Grades 8–11 in the seven schools wrote the English Additional Language, Mathematics, and Natural Science assessments over 2 days. The assessments were administered by the monitoring agent and administration procedures were standardised. Learners were instructed to answer the assessments to the best of their ability, and were assured that feedback on their performance would be given and that the results would inform classroom practice. The tests were scored by specialist teachers and then moderated, after which all data were captured on item level and analysed. The results were reported to the teachers, principals, and the funding agent, all of which was facilitated through interactive workshops.
Ethical considerations
Ethical clearance was obtained from the Faculty of Education at the University of Pretoria. The names of the learners, their parents, school personnel, and names of the schools were strictly confidential. All steps were taken to ensure the conduct of an ethical research project, which included obtaining informed assent from learners older than 16, full disclosure of how results would be used, and consultation with stakeholders. Learners younger than 16 years old obtained signed consent from their parents, whereas learners 16 years or older submitted both a signed parental consent form as well as an assent form. The results were fed back into the school system via interactive workshops with teachers to enhance both teaching and learning and thus benefit all stakeholders.
Learner motivation can be challenging when administering external monitoring assessments. To encourage learners to participate fully, learners were given content-level feedback with detailed descriptions of the skills and knowledge gained in curriculum areas as well as new areas on which to focus. These reports were also sent to teachers and parents. The possibility of including assessment results as a small percentage of the final school mark was considered, but schools felt that this may disadvantage learners as these assessments do not require prior study. However, learner results for English Additional Language correlated highly with their school marks (r = .756, p < .01), providing concurrent validity that learners were performing at expected levels and were motivated to complete the assessments as fully as possible. When learners were queried on their motivation to complete the assessment, 10% responded not very, 48% moderately, and 42% responded being highly motivated.
Data analysis
Rasch person and item reliabilities were used to assess the functioning of the instruments. Reliabilities are calculated slightly differently in RMT than in Classical Test Theory (CTT). CTT would calculate reliability on an overall standard error of the mean, whereas Rasch theory calculates the standard error for each item or person. CTT uses Cronbach’s alpha as an indication of reliability as it is hypothesised that all items should correlate highly in one construct (Gliem & Gliem, 2003). RMT deviates from this model because in RMT, there is an assumption that items differ from one another because they should measure different difficulties (points) along the continuum (Clauser & Linacre, 1999; Linacre, 1997). RMT refers to reliability values as separation indices and Linacre (2011) sets a minimum value of 2 as an acceptable value for the person index, and for the item index, a minimum value of 1.5 is required to measure individuals. Therefore, the reliability index is an indication of overall error of measurement in the data, which is the reason Rasch theory uses the measures’ standard errors to calculate the indexes for persons and items. Person reliability is equivalent to the traditional Cronbach’s alpha, with reliabilities above .80 indicating 2–3 groups of ability being identified in the sample. Item reliability has no traditional equivalent, but indicates whether a sample is big enough to locate persons on the latent trait (Boone, Staver, & Yale, 2014): Measurement of change presents a nasty challenge. We expect persons (patients, learners, experimental subjects) to change from Time 1 to Time 2. But the functioning of test items and rating scales may also change, even when identical data collection protocols are used. (Wright, 1996, p. 478)
According to Linacre (2011), a rule of thumb is that a minimum of 10 common items is needed to prevent distortion of the measurement by problematic items. After problematic items are removed, 10 items should remain. To examine the functioning of the 15 anchor items, items were examined using several methods. First, the raw total percentages for the anchor items from Year 1 (Grade 8) were compared with Year 2 (Grade 9) using paired samples t-tests to obtain a global view of whether all items, as a total score, indicated change from Grade 8 to Grade 9. Next, the mean raw scores per item were examined and Wilcoxon’s Matched Pairs Signed-Rank Test was applied to assess whether these raw scores indicated statistically significant change. Effect sizes were calculated to determine the magnitude of the differences found when applying t-tests and the Wilcoxon (Field, 2009). Effect sizes were calculated using Pearson’s Correlation coefficient, r, as a standardised measure of effect size (Tabachnick & Fidell, 2007). After conducting statistical tests on the raw scores, the Rasch Partial Credit Model was applied independently to each year, then to stacked data and finally, calibrations were applied to the Grade 9 anchor items. The Partial Credit Model was utilised as some items were dichotomous and others were polytomous. The processes are described in more detail below. The total sample size was 321, with the schools being considered a population.
Results
The raw total score percentages for Grades 8 and 9 were compared using the paired samples t-test to ascertain whether the results from the items indicated change from Years 1 to 2. Grade 9 learners achieved discernibly higher mean score percentages (M = 46.631, SD = 16.558) than in Grade 8 (M = 35.826, SD = 14.245).
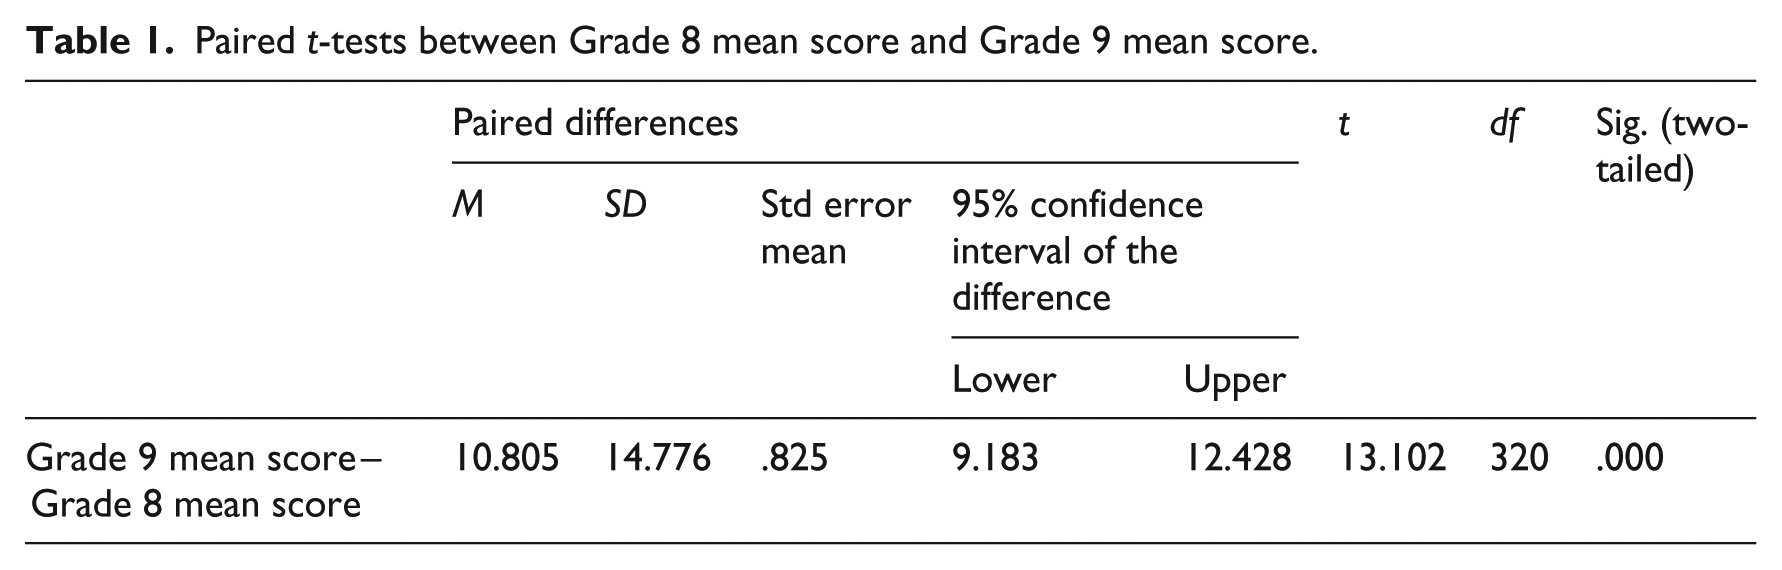
Pearson’s correlation coefficient was used as an effect size and Cohen’s criteria for interpreting effect sizes applied (Cohen, 1988; Field, 2009). The results were significant, t(320) = 13.102 (p < .0001) as can be seen in Table 1. A large effect size, r = .591, was found for the differences between the Grade 8 and 9 results.
Paired t-tests between Grade 8 mean score and Grade 9 mean score.
To investigate the usefulness of each item, the raw scores were examined. The items were dichotomous with the exception of Item 8 (maximum score 3), and Items 11 and 15 (maximum score 2). The dichotomous items were multiple-choice, whereas the other items were constructed-response. In Winsteps, the guessing parameter can be estimated. Note that this is still the one parameter model being applied, and the parameters for guessing are estimated but do not form part of the calculation for the measures, either persons or items. With the Rasch Measurement Model, guessing and carelessness would be classified as misfit, which is why it is not parameterised when the data are fit to the model. When examining the output for an estimation of the guessing parameter, Linacre’s guideline for a lower asymptote of .10 or greater, was used. However, none of the problematic items had asymptotes greater than .10, and therefore, guessing does not appear to be a reason for the possible problematic nature of the items.
Most items followed the expected pattern: learners performed better in Grade 9 than in Grade 8 and this fits the expectation of the measurement model, with progression indicated by the anchor items. However, Items 5, 11, and 15 produced means which were very close in both Grades 8 and 9. Items 5, 11, and 14 show a reversal of the expected pattern, with learners performing better in Grade 8 on these items than in Grade 9. However, further investigation showed that for Items 5 and 11 this reversal was not statistically significant (see Table 3). In the case of Item 14, subject specialists examined the item and concluded that the wording might have been confusing, and as a result, the item was rephrased. Some of the items, such as Item 5, were too simple and easy to answer. Instruments do need a balance of easier and more difficult items. Easier items are needed to confirm that skills and knowledge are in place and to give examinees confidence. However, the test designers would prefer not to keep easier items for anchoring purposes. The anchor items should show progression, and therefore be more difficult. In the Instrument, a balance of easier and more difficult items was achieved. Table 2 shows the means for each individual item for Grades 8 and 9 as well as the mean difference between the years.
Item means based on raw scores and mean difference.
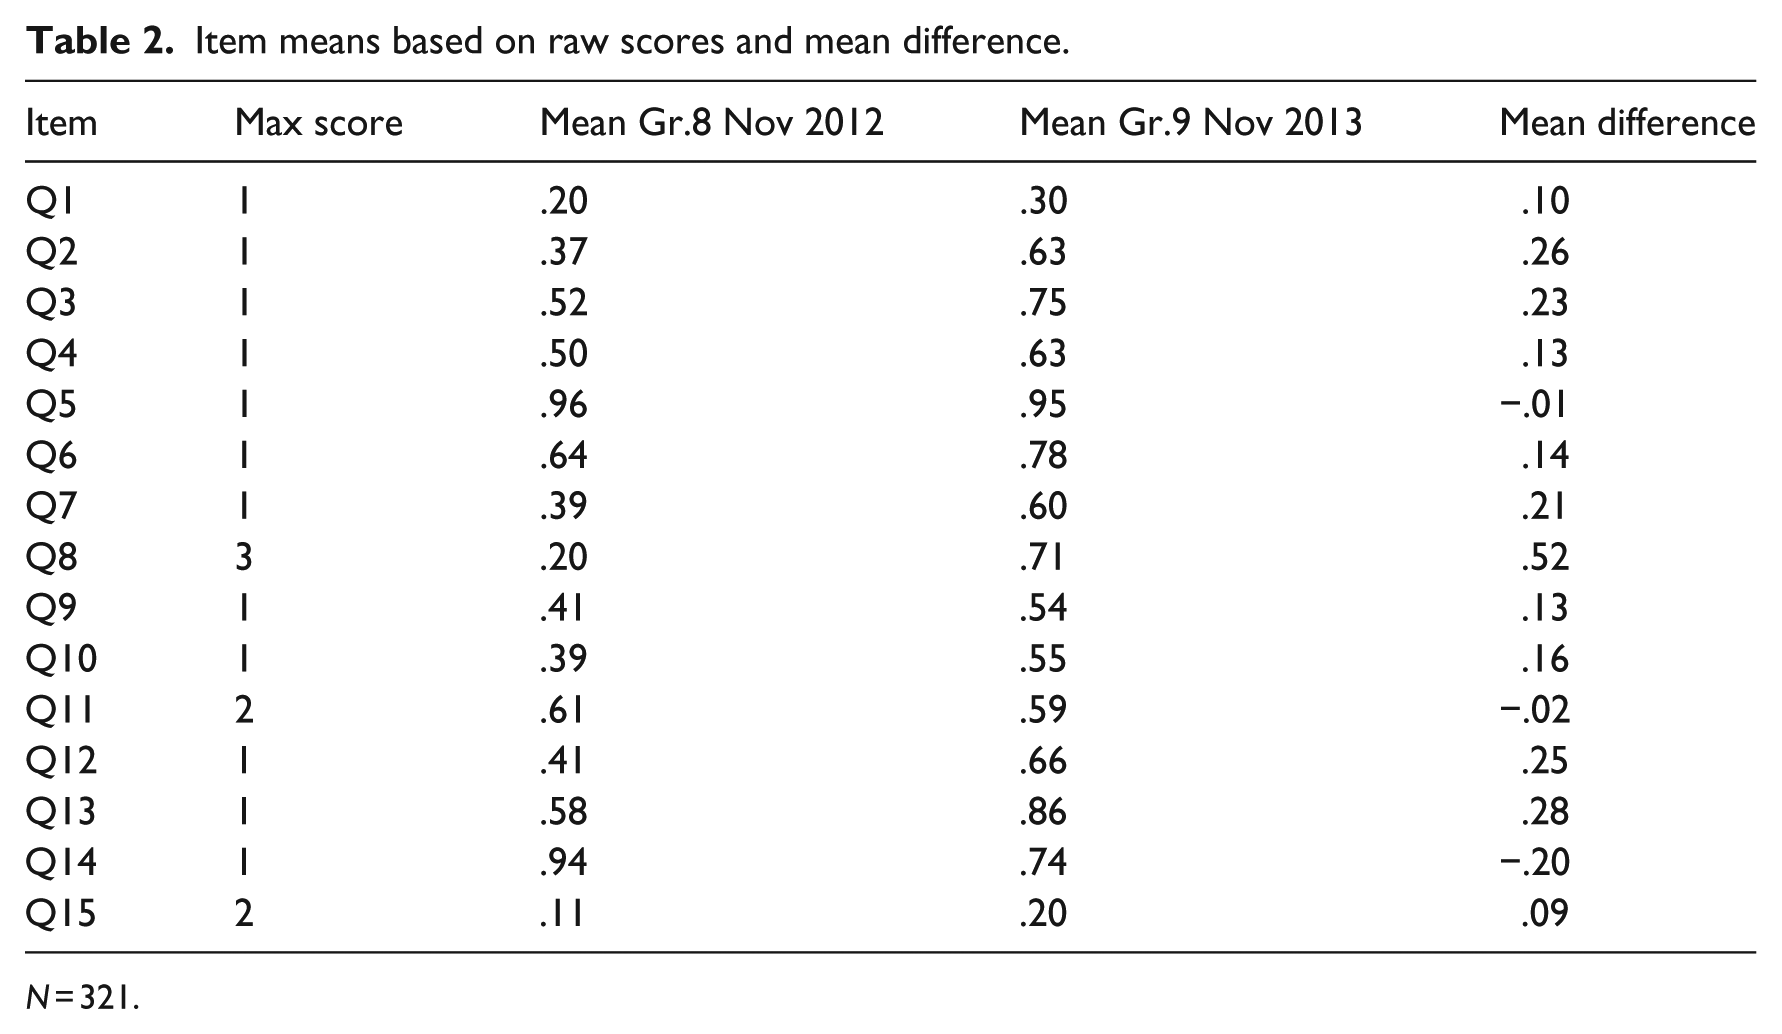
N = 321.
Wilcoxon Signed-Rank Test for comparison of anchor items from Years 1 to 2.
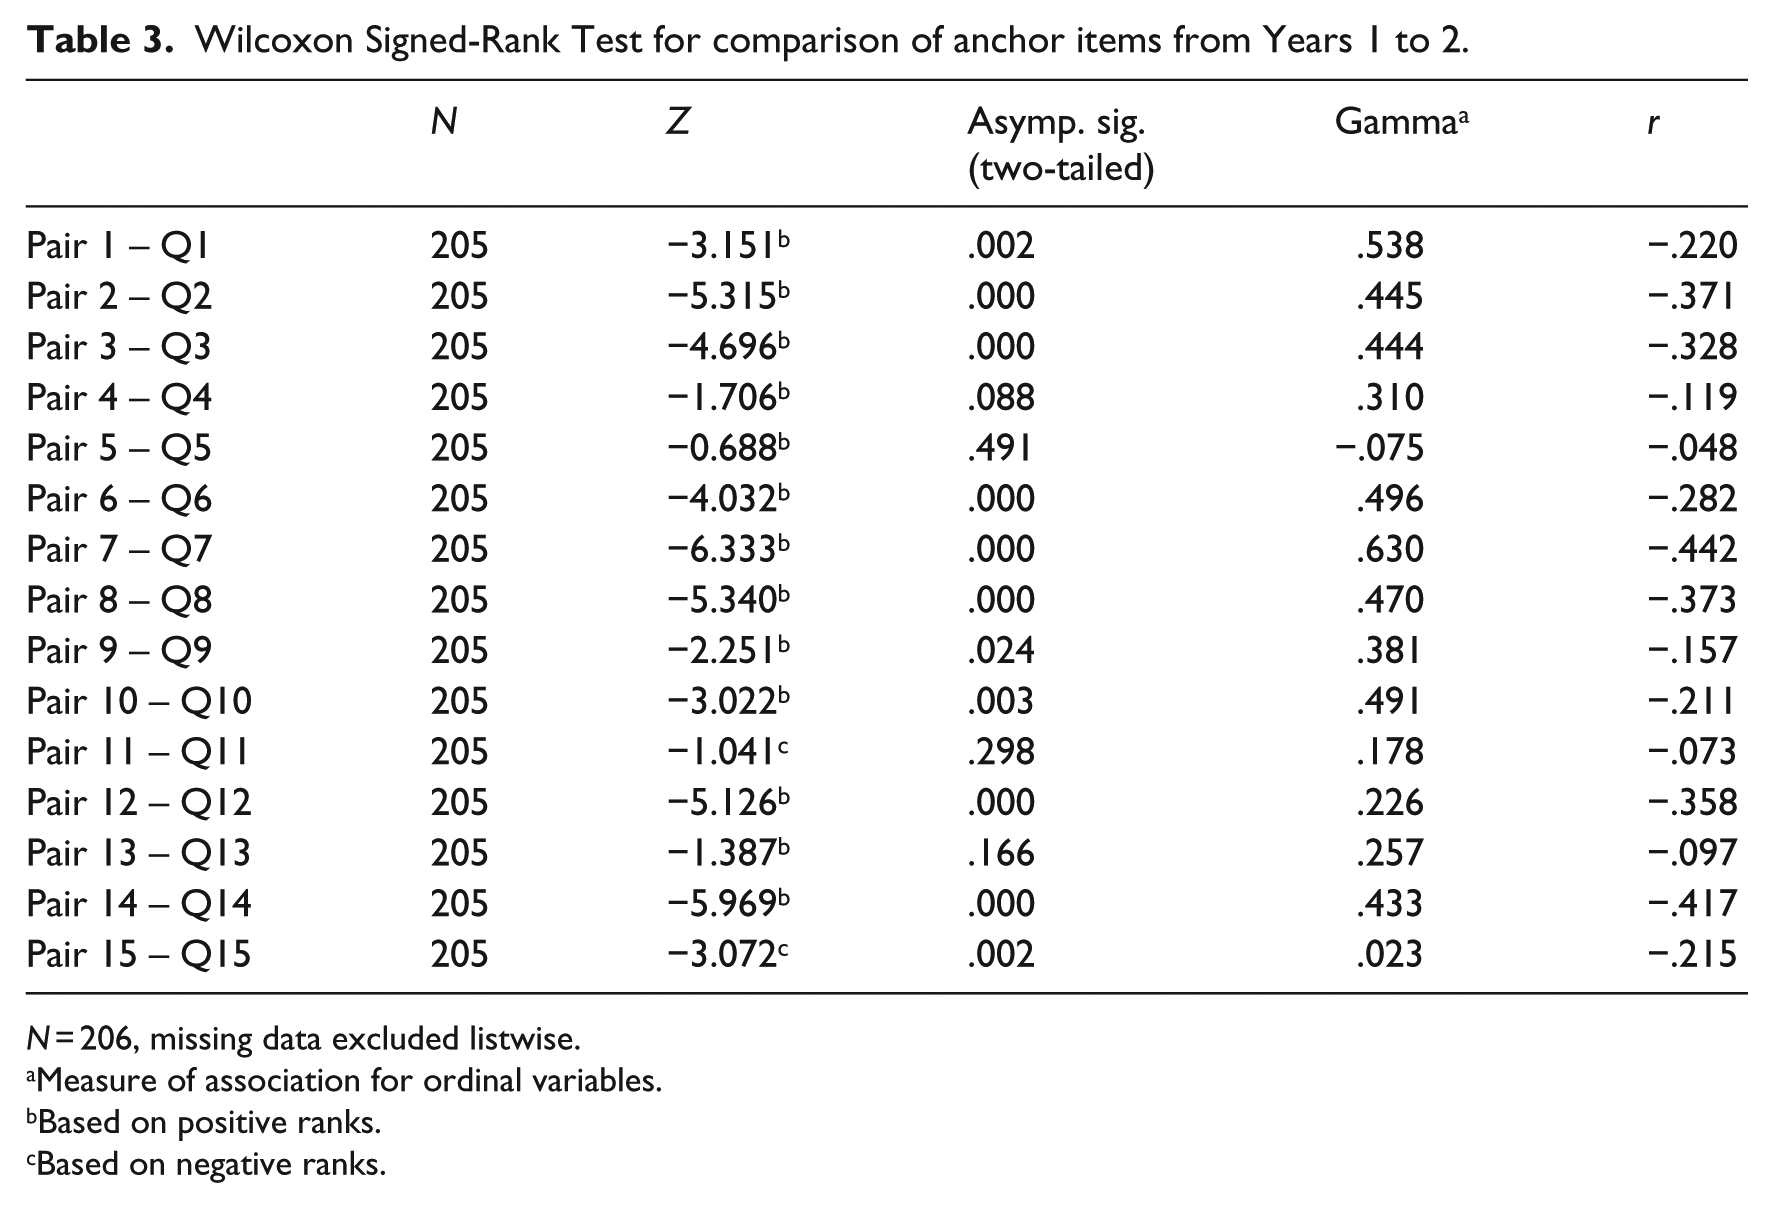
N = 206, missing data excluded listwise.
Measure of association for ordinal variables.
Based on positive ranks.
Based on negative ranks.
The Wilcoxon Signed-Rank Test compared items from Grade 8 to Grade 9 (missing values excluded listwise, N = 205) (see Table 3). A significant difference in the scores for most of the item pairs from Grade 8 to Grade 9 was discerned, with the exception of four pairs, Items 4 (p = .088), 5 (p = .491), 11 (p = .298), and 13 (p = .166) which were not statistically significant when the 2 years were compared. This result suggests that these particular item pairs do not monitor English Additional Language comprehension development as intended by the designers. All items in Table 2 were based on positive ranks, indicating a positive increase from Years 1 to 2 (increase in mean from Grades 8 to 9 which was the aim). The only exceptions were Item pairs 11 and 15, which were based on negative ranks (decrease from Years 1 to 2) and also identified as being potentially problematic in the descriptive examination. Item Pair 11 was not statistically significant in its change, but in the case of Item Pair 15, further investigation was recommended.
The gamma statistic shows the association between the pairs of items. Item 5 (γ = −.75), Item 11 (γ = .178), and Item 15 (γ = .023) resulted in very low associations. Most of the items, which were not statistically different from Years 1 to 2, also produced low or no effect sizes, as can be seen for Item 5 (r = −.048), Item 11 (r = −.073), and Item 13 (r = −.097).
The descriptive statistics identify many of the same items as being problematic, as identified by the Wilcoxon Signed-Rank Test, such as Items 5, 11, 15 (mean differences marginal) and Items 5, 11, 14 (reversal of expected pattern). The descriptive statistics gave an indication of potential problems with items. The non-parametric statistical tests assessed whether what was observed via descriptives, was statistically significant and gauged the magnitude of differences (effect sizes and association). The non-parametric statistics, used to analyse the items, also identified additional problematic items, such as Item 13 which was not, however, significantly different from Years 1 to 2 (p = .166). These findings highlight the need for examining the descriptive results and also conducting statistical testing to confirm results and identify additional problems. As a result of the findings, subject specialists examined the items identified as potentially not adequately assessing change, and consequently rephrased Items 11, 13, and 14.
The subsequent step was to apply the Rasch Measurement Model to the data, using Winsteps 3.75.0 (Linacre, 2012) to confirm the findings of the raw score analysis, to ascertain whether the items identified as potentially problematic should be removed, and in addition, to estimate the proficiencies of the persons in relation to the item difficulties on the same scale.
Independent Rasch analysis
The anchor items, as well as additional items from the Grade 8 test, were entered into Winsteps for analysis, with the same being done for the all Grade 9 test items. The item difficulties, with the measures from the independent analysis rescaled from 0 to 100, were exported for both sets of items. The independent Rasch analysis revealed that the anchor items were very stable, with item difficulties from Time 1 and Time 2 having a correlation of r = .882, p < .01 (see Figure 1). Item 5 was identified as more difficult in Time 2 (M = 29.47) than in Time 1 (M = 27.06) showing that the item is less stable and has disordered thresholds. The same is true of Item 15 (Mean T1 = 48.81, Mean T2 = 57.80). See Appendix 1 which shows Item 5 and Item 15 which were subsequently removed from the instrument. Figure 1 depicts the item-measures from Time 1 and Time 2 plotted with 95% confidence interval lines in Winsteps using Pearson’s correlation coefficient, with Item 15 lying well outside the 95% confidence interval. The empirical slope was 1.023, satisfactorily close to 1. From the independent Rasch analysis, Items 5 and 15 are indicated as less stable items for measurement.
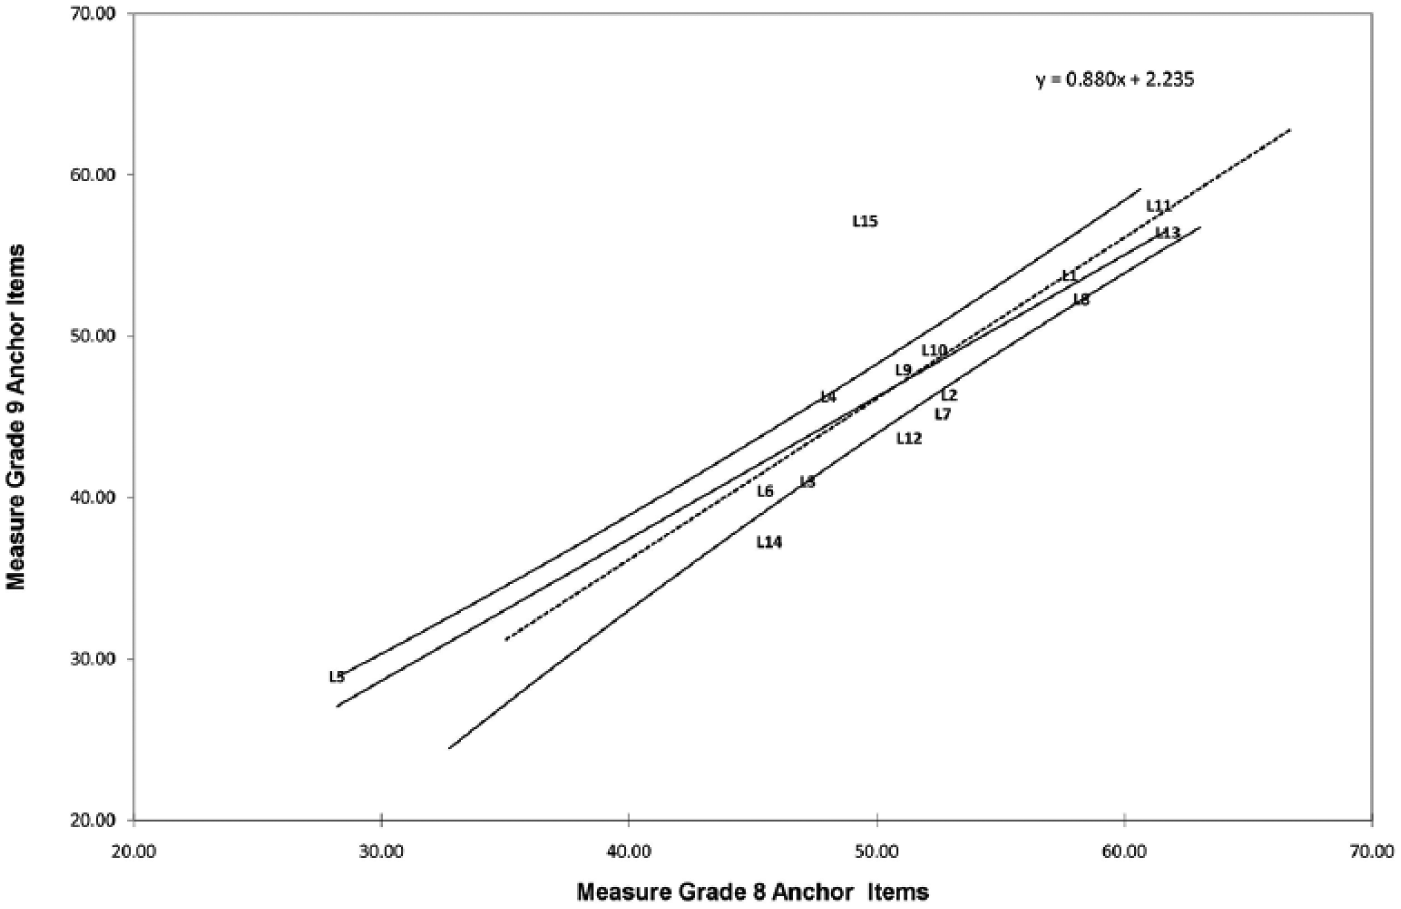
Item-measures based on independent Rasch analysis with 95% confidence interval lines.
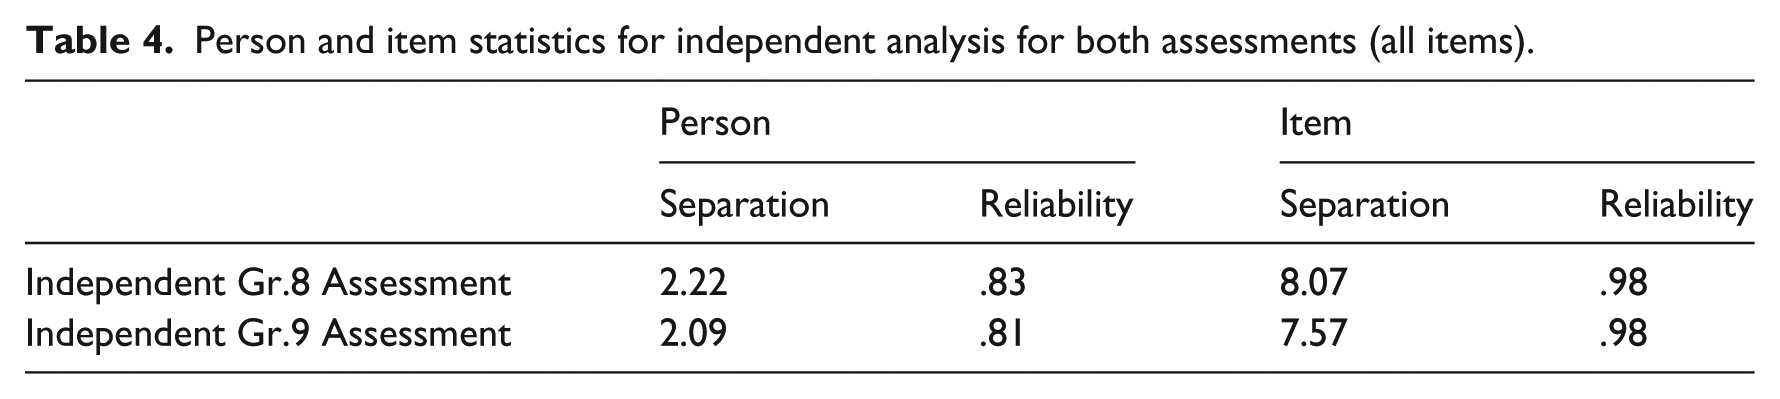
The person and item indices were also examined as these are related to the interpretations of the independent analysis and the precision of the assessment (see Table 4 for a summary of the indices). The person separation indices were above the acceptable cut-off point of 2, and the reliabilities were also within a suitable range with values above .70 (Wright & Stone, 2004). The item separation indices fell well above 2 and the item reliability coefficients were found to be satisfactory, all falling within the prescribed criteria (Bond & Fox, 2007; Boone et al., 2014; Fisher, 1992).
Person and item statistics for independent analysis for both assessments (all items).
The infit and outfit mean square statistics (MNSQ) showed that no items were misfitting for either the Grade 8 or Grade 9 data sets (no items had values above 1.5) and there were no negative point measure correlations (Wright & Linacre, 1994). A total of 2 out of 321 persons had high outfit statistics in the Grade 8 group with none occurring in the Grade 9 group. The high fit statistics were below 2, indicating that the persons were neither adding to the measurement nor detracting from it (Linacre, 2011). The threshold functioning of items with polytomous scales was also examined, and only Item 8 was found to have disordered thresholds (outfit MNSQ above 2.00 for one category, number 2). Item 8 had four categories (0, 1, 2, and 3) and based on RMT results, Categories 1 and 2 were collapsed. After collapsing these two categories, Item 8 no longer displayed disordered thresholds. Further analysis was conducted with collapsed categories for Item 8.
When examining the raw means of each item, Items 5, 11, 14, and 15 had potential problems (means close or reversal of the expected pattern). The Wilcoxon Signed-Rank test showed that Items 4, 5, 11, and 15 may be problematic (low associations and not statistically significant). The Rasch analysis showed that Items 5 and 15 were less stable for measurement. Based on the fact that Items 5 and 15 were indicated by all the methods as potentially problematic items, these were examined by English language specialists. Based on a qualitative analysis by the language specialists, these two items were removed from the analyses and the instruments.
Stacking of data for second Rasch analysis
Stacking was done to measure persons in a more similar frame of reference, thus stacking persons from Time 1 and Time 2 in one data set. After the stacking of the data, the person-measures from Time 1 and Time 2 had a stronger relationship, Pearson Correlation coefficient, r = .697 (p > .01; N = 642). The measurement of persons could now be done in a more comparable framework, though they were not as yet in the exact same framework (Wright, 1996, 2003). However, the stacked analysis did not result in any persons showing high infit or outfit MNSQ values. Local dependence of items was also investigated and no items were correlated above .41, which was well below the recommended number of .70 indicating that items were independent (Linacre, 2011). The total variance explained by a principal component analysis (PCA) conducted in Winsteps was 46.9%. The unexplained variance in contrast 1–3 was above the 2.0 threshold, with residual variance being between 1.9% and 2.5% and variance explained being between 1.1% and 1.5%. The PCA residual variance statistics indicated that the stacked data may contain more than one dimension, possibly due to the presence of data from two different years.
Figure 2 shows a visual representation of the relationship between the Grade 8 and Grade 9 person-measures (stacked), rescaled from 0 to 100.
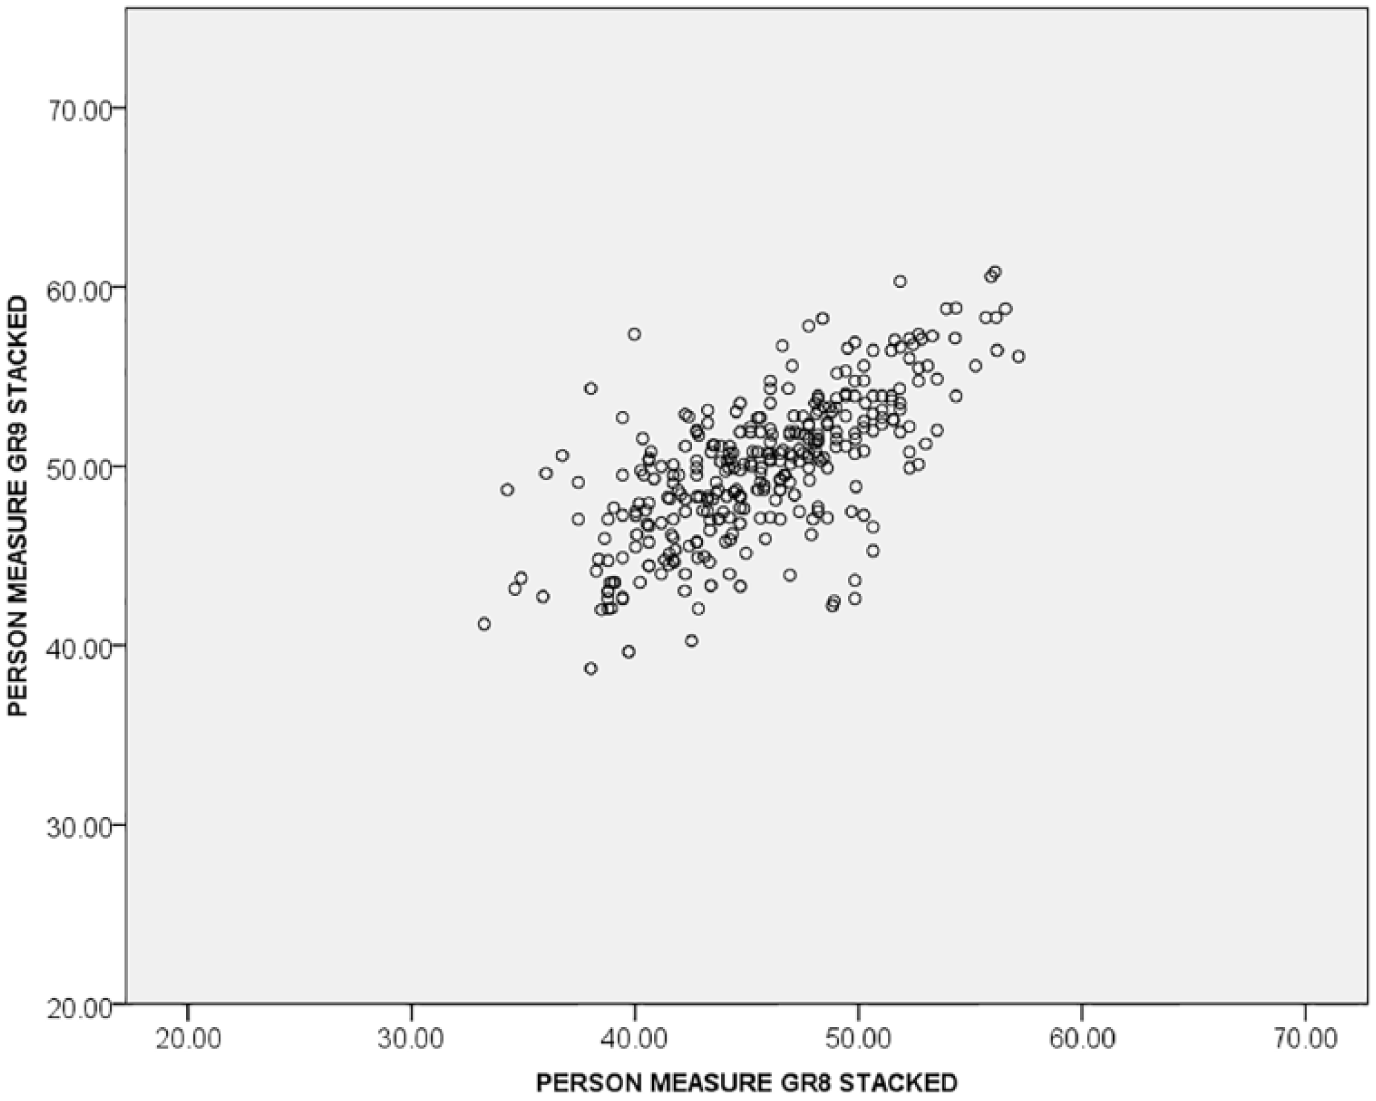
Person measures based on stacked Rasch analysis.
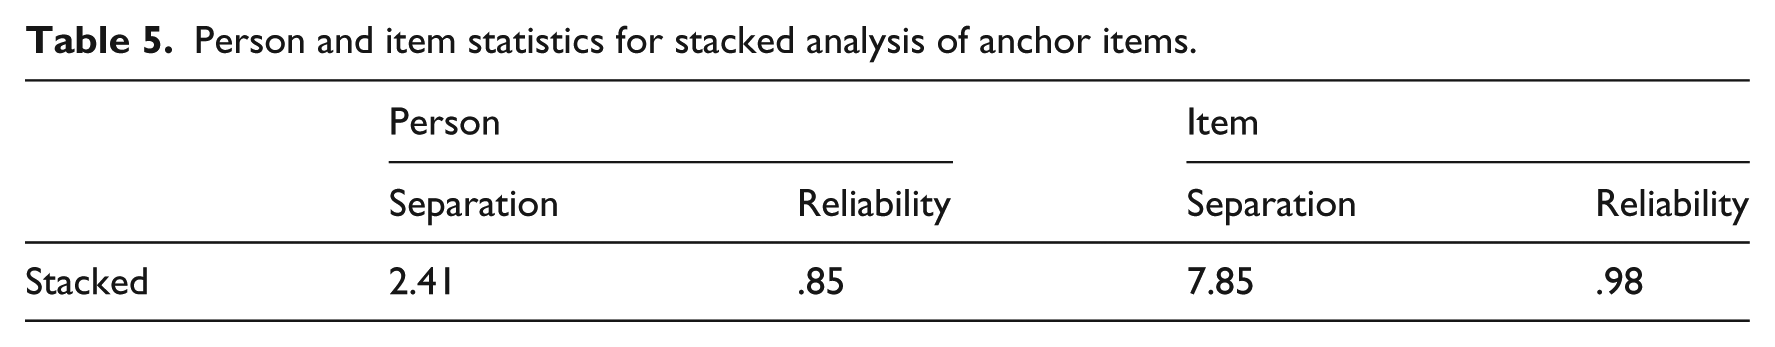
Pre-test standardised residuals were correlated with post-test standardised residuals, resulting in correlations ranging between −.02 and .20, an indication that dependency was not a problem in this analysis. Table 5 contains a summary of the indices for the stacked analysis. The person separation index was above the cut-off point of 2, and the reliability for the persons was acceptable, above .80 (Boone et al., 2014). The item separation indices were again well above the satisfactory levels and also recorded an increase. The reliability estimates, calculated in Winsteps, were mainly based on sample ability and item difficulty variance, length of the instrument and rating scale length, number of categories, sample to item targeting, and sample size (Linacre, 2011). The wider the range of ability and item difficulty, the higher the reliability estimate. The same holds for the length of the instrument, as more items could result in higher reliabilities and if items are well targeted, reliability estimates are also likely to increase.
Person and item statistics for stacked analysis of anchor items.
Item calibrations applied to Time 2
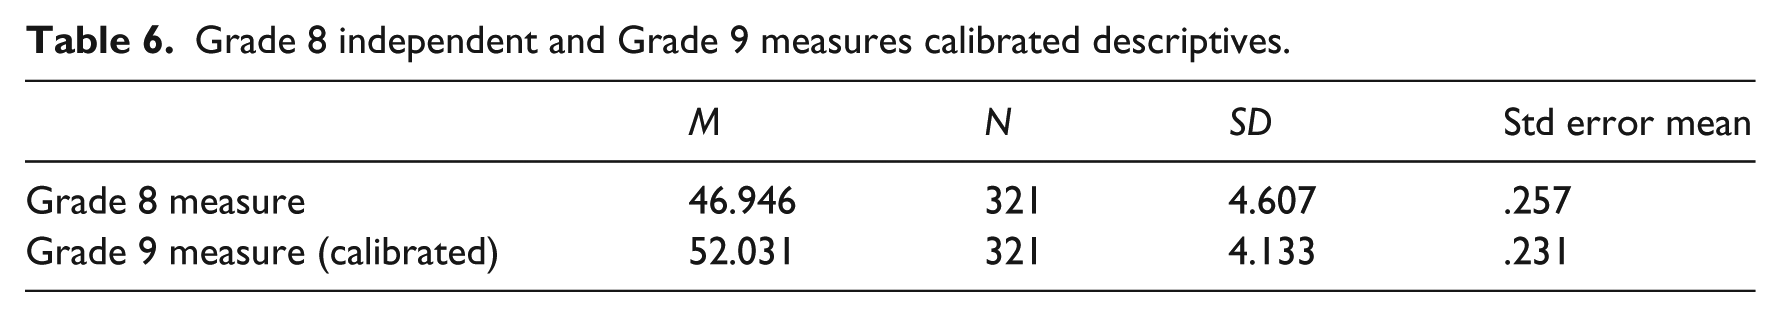
In this step, the benchmark item and threshold calibrations from Time 1 were applied to Time 2 so that Time 2 could be measured with the same metric. The results indicate significant growth in English Additional Language comprehension from Years 1 to 2. To assess the significance of the growth, a paired sample t-test comparison of the Grade 8 and Grade 9 person-measures was done (see Table 6 for Grade 8 independent and Grade 9 measures calibrated descriptives and Table 7 for paired samples t-tests between Grade 8 independent and Grade 9 measures calibrated results).
Grade 8 independent and Grade 9 measures calibrated descriptives.
Paired samples t-tests between Grade 8 independent and Grade 9 measures calibrated results.
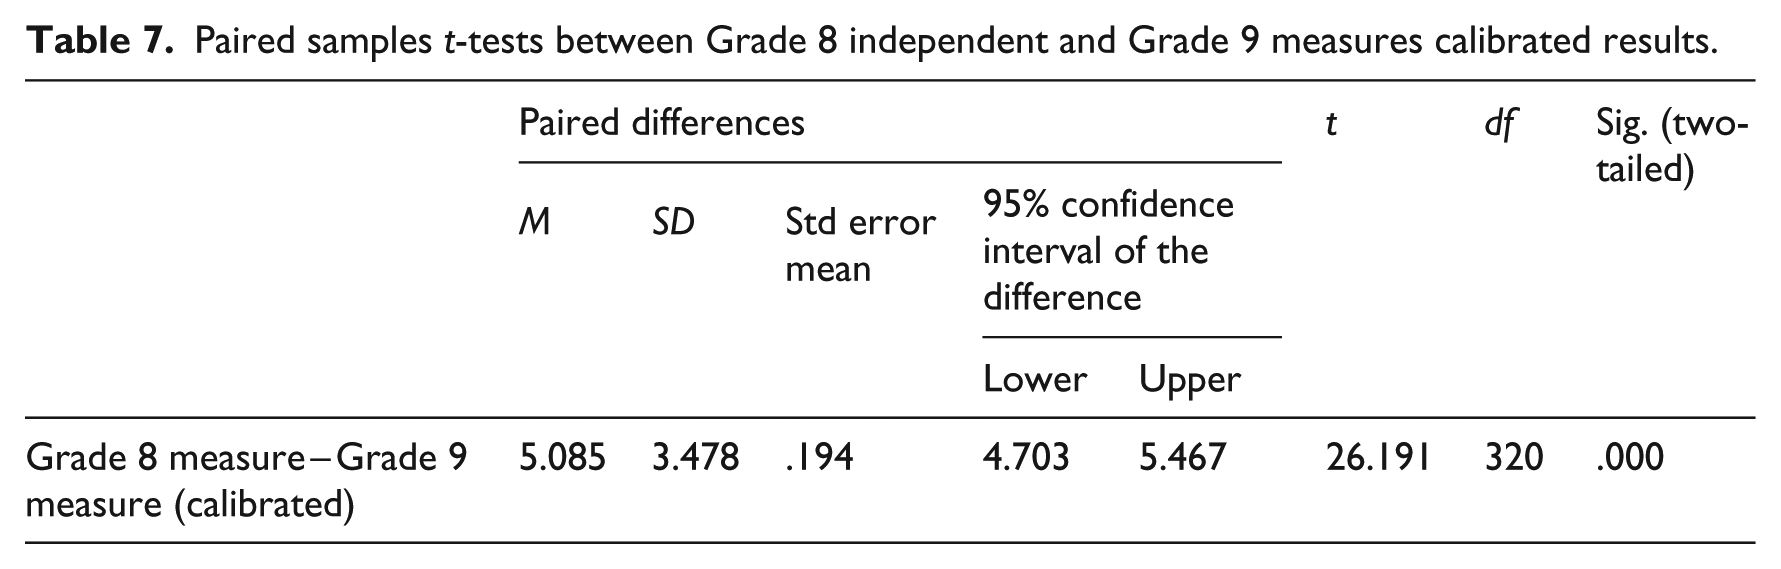
The results indicate growth from one year to the next, with Grade 9 (M = 52.031, SD = 4.133) having a substantially higher mean than Grade 8 (M = 46.946, SD = 4.607). A paired samples t-test yielded t(320) = 26.191, p < .0001. This result is statistically significant and the effect size indicates a very large difference from Years 1 to 2, r = .826 (Smith & Stone, 2009).
Discussion
Rasch modelling allows for the interval ordering of both persons and items. Stacking creates the possibility of comparing different time periods so that persons assessed at different times can be measured with the same metric. This article illustrates measurement of change with Rasch models, using stacking methods. Raw score analysis revealed that the anchor items overall and total score showed learning growth and progression. However, further investigation identified some individual items which might not measure change as these items showed little or no difference from one year to the next and potentially could reveal a reversal of the expected pattern.
Applying the Rasch Measurement Model in an independent analysis, with the 2 years being entered separately for analysis, showed that the items functioned well overall but two items were found to be less stable for measurement (Items 5 and 15). These two problematic items were therefore examined by subject specialists and after discussions, the items were removed for future analysis. One polytomous item also had disordered thresholds and to address this, the two problematic categories were collapsed.
In the stacking of data, persons were entered twice as though they were two different people, to measure persons in a similar framework and to determine how well person-measures correlate. This illustrated that person-measures correlated moderately well and that the calibrations should be applied for a more precise comparison. The final step, using the Rasch Measurement Model, was to apply the item and threshold calibrations from the independent analysis of the baseline, that is, Grade 8 results from Time 1 to the Grade 9 results from Time 2. When persons were measured in the same frame, a more accurate indication of growth was available and paired sample t-tests were done to compare the development from Grade 8 to Grade 9, which resulted in a large effect size. A visual representation of the processes followed is given below (see Figure 3); these processes determined whether each item contributed to measurement and then finally measured the persons in the same frame of reference.
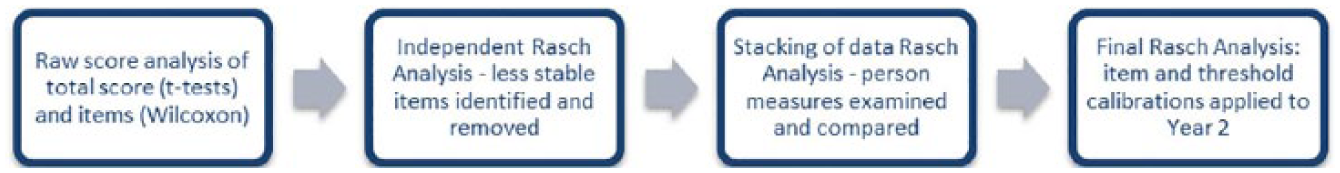
Processes followed for refining anchor items and adjusting measurement frame.
The advantages of using the Partial Credit Rasch model included more accurate measurement of the longitudinal results. Both the raw score analysis and the Rasch modified results showed large effect sizes (r = .591 and r = .826). However, the mean score differences between Grade 8 and Grade 9 for the final analysis was smaller than that of the raw score analysis, with mean difference for raw score = 10.805 versus mean difference for calibrated results = 5.085. These differences are attributed to the refinements made to the anchor items, such as collapsing categories for Item 8, removing Items 5 and 15, and threshold calibrations, which were applied in the revision of the assessment instruments. All of these changes have resulted in more precise indications of change from Time 1 to Time 2.
The sample was well placed for measuring improvement using anchor items as the learners in the sample came from impoverished backgrounds, and had previously attended low-resourced schools. The anchor items assisted in identifying a significant difference in English Additional Language performance from the time the learners entered the schools (end of Grade 8) to having had a year of schooling in these changed circumstances (end of Grade 9). It is important to note that at the time, the coalition schools began at Grade 9 level and as such, had no Grade 8 track; therefore, learners were tested prior to or just after entering the new school system.
This study illustrated that the use of the Rasch Measurement Model assists in refining the anchor items and enhances reporting the final results in the most accurate frame of reference. These results were then fed back into the school system so that teachers and learners could benefit from the monitoring system which would thus inform teaching and learning.
Conclusion
This article found that the usefulness of anchor items for monitoring learning progression can be gauged by conducting non-parametric tests and applying the Rasch Measurement Model through independent analysis and stacking analysis. Improvement of anchor items is important for gaining a clear picture of the progression made by learners, especially for an external monitoring agent that also feeds back into the school system. Earlier it was noted that one of the problems associated with monitoring learner progression is that learners develop and essentially become different persons. The Rasch Measurement Model controls for this shift by applying item and threshold calibrations so that persons are measured in the same way from Time 1 to Time 2. This also gives clearer results of the change that took place and whether this change is beyond mere development.
Footnotes
Appendix 1
Funding
The author(s) received no financial support for the research, authorship, and/or publication of this article.