



Abstract
Risk assessment inventories play a significant role in predicting recidivism risk and informing parole and community supervision orders. This article examines the effectiveness of the Level of Service/Case Management Inventory (LS/CMI) in a study of Australian offenders completing community-based sentences. The study aimed to identify the internal reliability and the factor structure of the LS/CMI. The results indicated that the LS/CMI total score achieved excellent internal reliability. There is concern regarding the capacity for the subscales to function independently. A factor analysis determined a two-factor solution at a subscale level, whereas a more diverse factor solution was obtained at an item level. The LS/CMI was determined to be predictive of recidivism, but this was a weak effect. The results indicate that the LS/CMI as it is currently used in this population may not be an appropriate assessment tool, requiring further research before an international risk assessment is adopted in Australian jurisdictions.
Keywords
While risk assessment inventories play a significant role in both predicting recidivism risk and informing parole and community supervision orders, they also help guide correctional staff to determine an offender’s suitability to programs and interventions to reduce future reoffending. This enhances public safety by protecting people from criminal behaviors. Rigorous risk assessment is crucial in identifying and managing offenders, particularly those who are deemed as being of a high risk of reoffending (Kemshall, 2008). Risk assessments are used for the purpose of measuring the probability that an individual will engage in dangerous or maladjusted behaviors, including behaviors that are against socially acceptable norms such as rule violation and risk taking (Champion, 1994). An assessment of an offender’s recidivism risk can affect the individual in various ways, including how their case is presented in court and the pre-sentence report, as well as what happens to the offender once they have been sentenced. This can include, for example, security classification, community orders, and parole conditions.
Recidivism and Risk Assessment
In criminological research, recidivism is generally used to describe an individual reverting back to, or re-engaging in, criminal behavior that leads to a re-entry into the criminal justice system (Maltz, 1984; Payne, 2008). It is estimated that about 60% of those in custody in Australia have been previously imprisoned (Drabsch, 2006). Furthermore, there is evidence that a disproportionate amount of crime, particularly violent crime, is committed by the most persistent adult offenders who account for a relatively small proportion of the total offender population. For example, Yang, Wong, and Coid (2010) provided an estimate that about 50% of all crimes are committed by 5% to 6% of the offender population. In Australia during 2012, the majority of recorded crime constituted of assaults and occurred at a rate of 969 victims per 100,000. In this same period, 30% of the most serious offenses committed by male police detainees was a violent offense, and for females 27% of offenses comprised of property offenses (Australian Institute of Criminology, 2014).
Many contemporary correctional practices, including attempting to assess an offender’s recidivism risk, are based on the Risk-Need-Responsivity (RNR) model (Andrews & Bonta, 2010). This model has its conceptual basis in personality and social learning theories of human behavior and recognizes that there are dimensions of personality on which most, if not all, individuals can be located. The RNR model has three core underlying principles, which include risk, need, and responsivity. The risk principle has two aspects, including predicting recidivism and matching treatment services to the level of risk of the offender. Need refers to prioritizing identified criminogenic needs for treatment. Finally, responsivity principle considers factors that may impinge on an individual’s response to treatment programs, including cognitive ability, learning style, therapeutic relationships, and program content (Andrews & Bonta, 2010; Ogloff & Davis, 2004).
Many of the current risk assessment instruments used in various jurisdictions are based on the principles of the RNR model. There exists empirical support for the RNR model. Research presented by Andrews and Bonta (2010) indicated a small-to-medium effect size when all three of the RNR principles are adhered to in correctional justice agencies. However, when only two of the three principles are adhered to, this drops to a small effect size. Furthermore, Andrews and Bonta indicate that non-adherence with the RNR principles may actually increase crime and recidivism. This suggests that utilizing the RNR theoretical framework within criminal justice practices is effective in reducing and responding to an offenders’ recidivism risk.
It is important to ensure that the risk assessment being utilized is empirically and psychometrically valid. This has repercussions, not only on the accuracy of the information obtained from which many decisions are based, but can also affect the rights of the offender. An offender’s sentence, including supervision and engagement in interventions, cannot be unjustly intensive or extended for a prolonged period of time as a preventive measure to address reoffending concerns or to protect public safety without undue cause of concern. That is, from a human rights perspective, offenders’ sentence cannot be unfairly restrictive or disproportionate to the crime that they have committed. To do so would raise concerns as their liberty would be restricted due to an inaccurate assessment of their possible future behavior or recidivism risk (Glazebrook, 2010). Therefore, it is important that the risk assessments currently used by expert witnesses and agencies have been empirically validated in the population among whom the assessment is intended to be used. Furthermore, when making recommendations, it is crucial for test administrators to be mindful of the court’s need to balance the offender’s rights with the rights of society (including current and potential victims) when deciding to impose sentences or conditions based on recidivism risk (Yang et al., 2010).
The Level of Service/Case Management Inventory (LS/CMI) and Australian Studies
The LS/CMI (Andrews, Bonta, & Wormith, 2004) was developed as a result of one of the most well-researched risk/need instruments, the Level of Supervision Inventory, which was designed to assist probation officers in planning their supervision of probationers and parolees (Andrews, 1982). The LS/CMI was developed as a case management tool for correctional workers, as well as to adopt a systematic measure to ensure continuity of care across correctional agencies. The LS/CMI consists of 43 items that are grouped into eight general risk/need subscales. These subscales reflect the “big eight” risk/need factors that have received strong support for their predictive utility in assessing an offender’s risk of reoffending. These factors include, listed in order of influence, History of Antisocial Behavior, Antisocial Personality Pattern, Antisocial Cognitions, Antisocial Associates, Family/Marital, School/Work, Leisure/Recreation, and Substance Abuse (for a full discussion, see Andrews & Bonta, 2010; Andrews et al., 2011).
The LS/CMI is the commercially available version of the Level of Service Inventory–Ontario Revision (LSI-OR; Girard & Wormith, 2004). The LSI-OR has been validated on 630 adult male offenders, consisting of 454 inmates and 176 probationers under community supervision, and the results indicate that it is a psychometrically valid instrument. The results of Girard and Wormith’s (2004) research indicated that the internal consistency of the 43 General Risk/Need items was excellent (α coefficient = .91). The internal consistency for the Specific Risk/Need section was alpha = .62. Alpha coefficients for the subscales in the General/Risk Need section varied from .32 (Family/Marital) to .80 (Criminal History). For general recidivism, the LSI-OR’s predictive capacity for both inmates (multiple R = .37) and the community group (multiple R = .40) was significant. The LSI-OR’s predictive capacity was also significant for violent recidivism for both inmates (multiple R = .42) and the community group (multiple R = .25). Receiver operating characteristic (ROC) analyses determined that the General Risk/Need section was better able to predict general recidivism (area under the curve [AUC] = .73), whereas the Specific Risk/Need section was better able to predict violent recidivism (AUC = .71).
A more recent study (Guay, 2012) examined the predictive utility of the LS/CMI in a sample of Quebec gang members. The results demonstrated the LS/CMI was able to identify more significant criminogenic risks and needs in gang members compared with a matched non-gang offender sample. Specifically, in the gang members’ criminal histories, crimes against persons occurred at a higher rate than non-gang members. Furthermore, on the LS/CMI, gang members scored significantly higher on all subcomponents, with the exception of the Family/Marital and Alcohol/Drug Problems subscales. With regard to predictive utility, ROC analyses identified that the LS/CMI was able to predict new general recidivism arrests for both gang (AUC = .71) and non-gang (AUC = .73) offenders. However, the quality of the prediction was lower for predicting new arrests for violent crimes for both gang (AUC = .56) and non-gang (AUC = .61) offenders.
The above research by Girard and Wormith (2004) and Guay (2012) indicated that the LS/CMI may be more suited to predicting general recidivism, whereas agencies may need to administer a specialized violent risk assessment if that is what they are wishing to predict. This appears to be supported by more recent research by Olver, Stockdale, and Wormith (2014) who conducted a comprehensive meta-analysis of the various Level of Service inventories. The results of their research supported the predictive accuracy of the various Level of Service scales and their criminogenic need domains for both general and violent recidivism. Furthermore, although gender and ethnicity were determined to not be substantive sources of effect size variability, differences were apparent when analyses were conducted by geographic region. Canadian samples produced the largest effect size variability, followed by studies conducted outside North America, and then studies conducted within the United States. This suggests that geographic region may be an important source of effect size variation, but not author allegiance or affiliation. The LS/CMI was determined to have predictive accuracy for general recidivism, with a significant medium-to-large effect size, and a significant small effect size was obtained for violent recidivism. Again, this research indicates that the LS/CMI’s strength lies in predicting general recidivism in comparison with violent recidivism.
There is limited Australian research that evaluates the use and predictive utility of the LS/CMI. However, research is available that assessed its predecessor, the Level of Service Inventory-Revised (LSI-R; Andrews & Bonta, 1995). This information can be used to explore the validity and predictive utility of the Level of Service inventories in an Australian population. The results from such studies indicate that risk assessments developed internationally need to be validated and/or adapted to improve their predictive utility within an Australian context. For example, Hsu’s (2010) research determined that there were gender variations on subscales of the LSI-R, as well Indigenous offenders’ scores were consistently higher than the scores of non-Indigenous offenders. Mihailides, Jude, and Bossche (2005) questioned the appropriateness of using Canadian norms to identify Australian offenders’ level of risk of recidivism due to Australian offenders scoring higher across LSI-R subscales compared with Canadian offenders.
However, Watkins’s (2011) evaluation of the LSI-R in a sample of New South Wales custody-based offenders indicated that in relation to discriminative ability, the LSI-R is performing similarly to its use internationally. In terms of AUC values, the highest was obtained for non-Indigenous males (AUC = .694), closely followed by non-Indigenous females (AUC = .687). From analyses of survival time, there was evidence that offenders classified as being “high” risk do reoffend at higher rates and at a faster rate than offenders classified as being of lower risk. The LSI-R’s Cronbach’s alphas, reflecting internal consistency, ranged from adequate (α = .509 for the Accommodation subscale) to good (α = .784 for the Education/Employment subscale).
Research conducted by Ringland (2011) also supported the use of the LSI-R in Australia. Ringland examined the predictive utility of the LSI-R subscale scores in a model of recidivism using data obtained from Corrective Services New South Wales. The results indicated that for males and females, after controlling for standard risk factors, the subscales Education/Employment and Attitudes/Orientation were associated with reoffending. There were also gender variations apparent on subscales associated with reoffending. In terms of predictive utility, the rate of reoffending within a 12-month period increased as the offenders risk level increased. The odds of reoffending were higher for offenders classified as being of medium risk (4.0 for males, 4.6 for females) than the odds of those classified as being at a high risk. Furthermore, the reoffending odds for offenders classified as high risk were higher than offenders classified as low risk (12.8 for males, 10.7 for females). Ringland suggests that the inclusion of the LSI-R subscale scores in models of recidivism (as opposed to only including the LSI-R total score) could help improve the predictive utility of models of recidivism for evaluation.
Underlying Construct Structure of the Level of Service Inventories
Due to the distinct needs of offenders from different jurisdictions, it is argued that the underlying constructs of the Level of Service inventories may differ for, or not apply to, Australian offenders (Hsu, 2010). Hanson, Babchishin, Helmus, and Thornton (2013) argued that empirical actuarial risk tools are not designed to be internally consistent measures of a single latent construct; that is, a variable that cannot be observed or measured directly. Rather, risk assessments are designed by selecting items based on their relationship with the designated outcome, for example, general recidivism, and are therefore criterion-referenced measures. Items may be retained in a risk assessment even when their relevance to recidivism is unknown but they are able to predict recidivism. An example of this includes the “Any Unrelated Victims” item on the Static-2002, which independently contributed to the prediction of sexual recidivism at the p < .001 level (Hanson & Thornton, 2003). As a result, risk assessments rarely contain homogeneous items as a good risk scale will contain diverse psychologically meaningful risk factors that have been established as relating to engagement in antisocial/criminal behaviors and recidivism (Mann, Hanson, & Thornton, 2010). However, exploring the theoretical nature of the underlying constructs of the risk assessment provides information about the appropriateness of the assessment for the population in which it is intended to be used. The LS/CMI has been used in other jurisdictions with the assumption that the factors would be transferable between populations with an unclear level of support for this assumption (Schlager & Simourd, 2007).
Due to the limited available research investigating the factor structure of the LS/CMI, it is useful to refer to research regarding the LSI-R. Various studies have investigated the LSI-R and how its subscales can be arranged into fewer factors. Studies have identified a three-factor solution in Canadian probationers (Andrews & Robinson, 1984) and in Colorado probationers (Arens, Durham, O’Keefe, Klebe, & Olene, 1996). Another study by Loza and Simourd (1994) determined that a two-factor solution identified in Colorado inmates was comparable with Canadian federal male inmates.
A study conducted by Hollin, Palmer, and Clark (2003) examined the factor structure of the LSI-R in a sample of English male offenders. Their results indicated a two-factor solution with the first factor accounting for 41% of the variance. The first factor consisted of the scales that are associated with criminal conduct (Criminal History, Education/Employment, Leisure/Recreation, Companions, Alcohol/Drug Problems, and Procriminal Attitudes/Orientation). The first factor is consistent with Loza and Simourd’s (1994) research, with the Criminal History, Education/Employment, Finance, and Attitudes/Orientation subscales loading on the factor concerning criminal behavior or lifestyle. The second factor accounted for 10.2% of the variance and consisted of those subscales reflecting “personal issues” or lifestyle factors (Family/Marital, Accommodation, and Emotional Personal). This second factor was consistent with that determined by Loza and Simourd (1994) with the exception that the Leisure/Recreation and Alcohol/Drug Problems also loaded onto the second factor. The Finance subscale did not load onto either factor. In contrast, Palmer and Hollin’s (2007) research with English female offenders produced a one-factor solution that accounted for 38.8% of the explained variance. When a two-factor solution was forced, only the Emotional/Personal subscale loaded on the second factor. The Attitude/Orientation subscale did not load on either of the two factors.
An Australian study by Hsu, Caputi, and Byrne (2011) examined the LSI-R at an item level that produced a five-factor solution for male offenders consisting of Static Risk, Employment, Pro-Criminal Attitudes, Mental Health, and Protective Companions. The fifth factor for males was labeled Protective Companions and consisted of two items addressing acquaintances and friends not involved in criminal activity, which could act as protective factors in relation to future offending. A four-factor solution for female offenders was obtained consisting of Static Risk, Employment, Pro-Criminal Attitudes, and Mental Health. Andrews and Bonta (1995) noted that studies have not revealed a consistent factor structure for the LSI-R and suggest that the LSI-R’s factor structure may depend on the population and setting in which it is administered. As these studies demonstrated, fluctuations between jurisdictions may occur requiring the instrument to be calibrated to the specific population. It is appropriate to assume that this line of argument could also apply to the LS/CMI.
The variations in how the subscales load onto common factors may be the result of the heterogeneous nature of the offender population, as well as jurisdictional differences (Maurutto & Hannah-Moffat, 2007). Furthermore, the analytical approaches may also influence each of the factor solutions, for example, principal components analysis (groups common variances) in comparison with factor analysis (identifies latent dimensions or constructs; Child, 1990; Costello & Osborne, 2005). Due to the lack of research regarding the factor structure of the LS/CMI, combined with varied factor structures on the LSI-R, it is appropriate to explore the factor structure of the LS/CMI at the item level to determine whether the previously identified factor structures are supported in different offender populations.
Aims of Current Study
As stated previously, it is important to validate any assessment tool in the population in which it is intended to be used. Girard and Wormith (2004) noted the importance of periodic cross-validation, as well as updating test items, due to ever-changing laws, legal terms, and offender populations. Furthermore, there is a concern regarding the transferability of the Level of Service inventories’ norms across jurisdictions (Schlager & Simourd, 2007). As a result, the present study aims to examine the factor structure of the LS/CMI using Australian offenders who are currently completing community-based orders. It could be expected that the identified factor model will be similar to that identified in Canadian/U.S. offenders (i.e., a two- to three-factor model), or that the factor structure may be more diverse to represent the central eight factors that the LS/CMI encompasses. The internal reliability of the LS/CMI (using Cronbach’s α) will be assessed and any changes (e.g., the removal of items) to the LS/CMI will be examined. Finally, the predictive utility of the LS/CMI will be examined using logistic regression and ROC analyses.
Method
Participants and Procedure
The current sample consisted of 302 participants, with 254 males (84%) and 48 females (16%). The mean age of the sample was 31 years (SD = 10 years, range = 18-67 years). Of this sample, 81% of participants were completing a community-based order, 1% were completing a custodial and parole sentence, and 18% were completing a combined custodial sentence and community-based order.
With regard to previous criminal history, 52.3% of the sample had prior offenses, 39% had previously served a custodial sentence, and 52% had previously completed a community corrections order. A total of 64 participants, or 21% of the sample, reoffended within a 12-month period.
For the purposes of this study, data were retrieved from the Offender Information System database, which is the Community Corrections database within one Australian jurisdiction (Tasmania). The criteria for inclusion of individuals’ data in the analysis included those who had been sentenced for an offense in 2010, had completed an LS/CMI assessment, and were completing either a community-based order or a custodial sentence combined with a supervision period upon release (either at the end of serving a custodial sentence or on parole). Indigenous offenders were excluded due to their low representation within the sample. The information retrieved from the database included demographic information regarding the offender, their previous and current offending information (including any court results), information regarding their current community order completion, as well as any non-technical breaches that had occurred while completing their current orders.
Measures
LS/CMI
The LS/CMI is composed of eight subscales (the number of items on each scale is indicated in parentheses): Criminal History (8), Education/Employment (9), Family/Marital (4), Leisure/Recreation (2), Companions (4), Alcohol/Drug Problem (8), Procriminal Attitude/Orientation (4), and Antisocial Pattern (4). The scores from these subscales form a total score that informs the level (and the likelihood) of risk of future reoffending for that particular offender. This is known as the General Risk/Need total score (i.e., the Section One total score). The LS/CMI was completed by probation staff at the Tasmanian Department of Justice and Community Corrections. The staff had completed Multi-Health Systems (MHS) approved training, and/or were being supervised by a manager who had obtained this training and had completed the relevant educational qualifications. The Department of Justice also completed ongoing quality assurance procedures to ensure that the LS/CMI is being administered and scored according to the manual guidelines. Inter-rater reliability was not available. Some items are scored on a dichotomous basis either scoring “yes” or “no,” whereas some items are scored on a scale of 0 to 3. For consistency in analyzing the data, items scored on a scale were recoded so that scores of two and three were recoded to represent “no,” or the item is not present, whereas scores of zero and one were recoded to represent “yes,” or the item is present. This method of recoding also corresponds and is consistent with the LS/CMI scoring proforma.
Reoffending
Because of variances in the length of probation/supervision, reoffending for the purposes of this study was defined as a reoffense that occurred within 12 months of the index offense, for which the offender was convicted in 2010. For those offenders who received a custodial sentence, data were collected from the date they were released into the community. This ensured that there were boundary limits around the length of the sentence and that all offenders’ reoffending data were for the same time period (i.e., 12 months; Ringland, 2011; Watkins, 2011).
Design and Analysis
To examine the psychometric properties of the LS/CMI, a number of analyses were performed. These included internal consistency using Cronbach’s alpha coefficients, concurrent validity with age and indexes of criminal history and reoffending, and a factor analysis of the scales. In the reconviction analysis, sequential logistic regression was used as it allows variables known to be related to the outcome variable (reoffending) to be controlled. Therefore, the relationship between other variables with reoffending could be examined independently (Tabachnick & Fidell, 2007). A ROC analysis was also conducted to confirm the predictive utility of the LS/CMI.
Results
Group Means and Comparison with the Sample Group
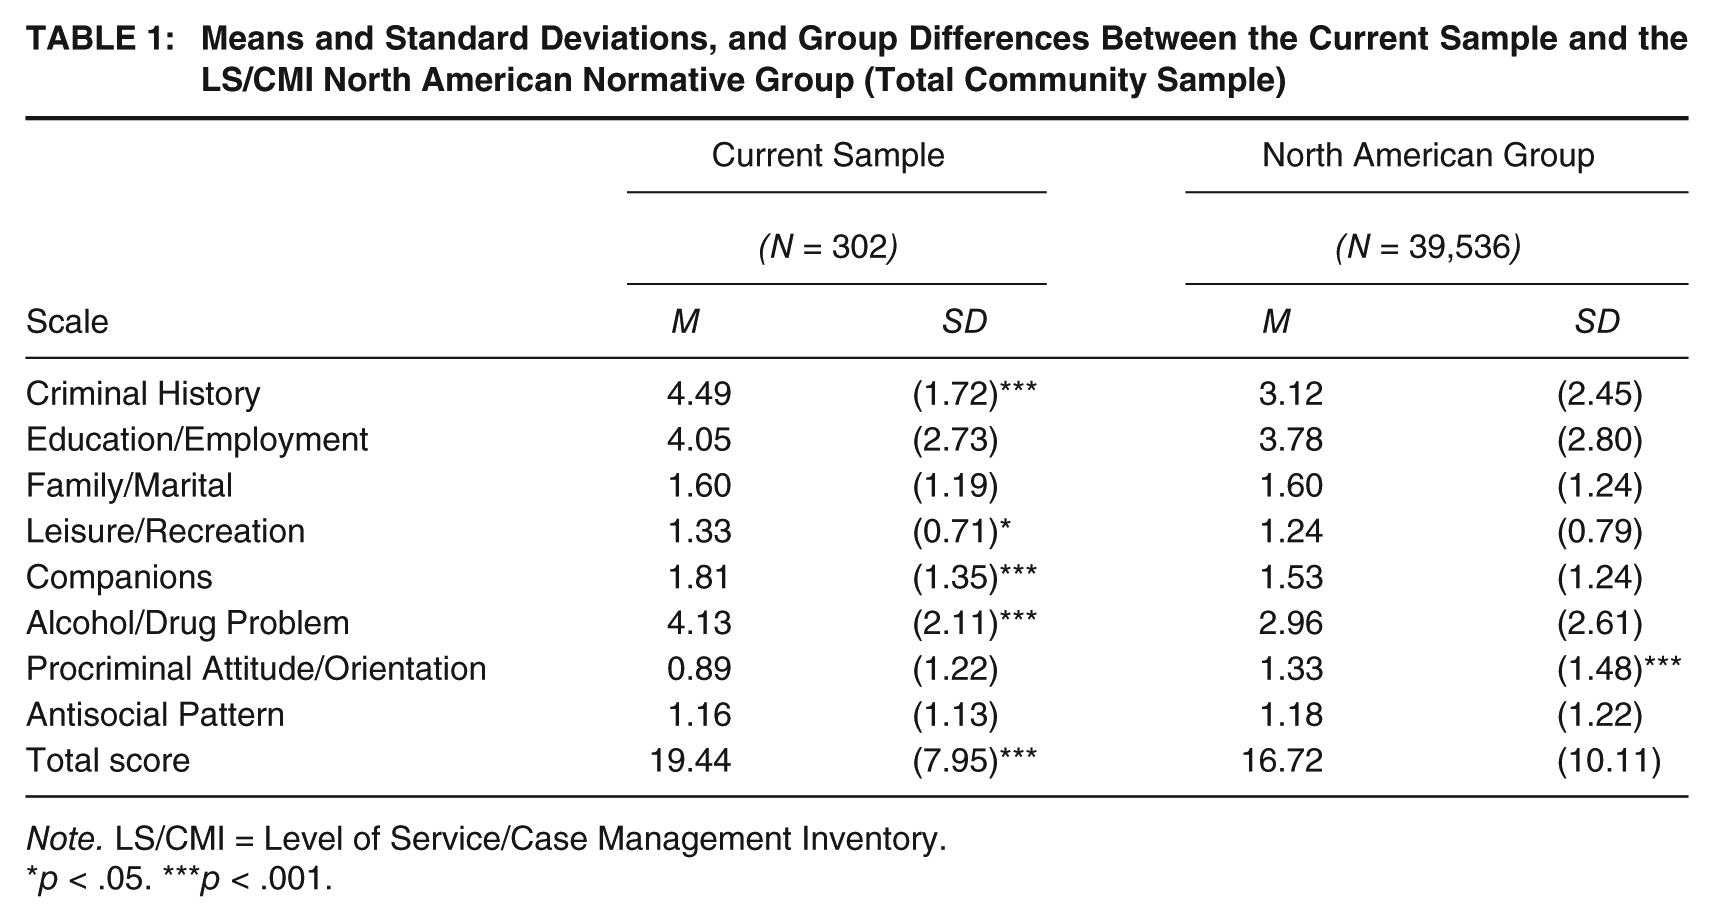
The means and standard deviations for both the current sample and the North American total community sample normative group presented in the LS/CMI manual are presented in Table 1. To determine whether there were significant differences between these two groups, t tests were conducted. The significantly higher mean scores are marked with an asterisk in Table 1. As can be seen, the Tasmanian offenders scored significantly higher on the LS/CMI total score, and the Criminal History, Leisure/Recreation, Companions, and the Alcohol/Drug Problem subscales. The North American normative group scored significantly higher on the Procriminal Attitude/Orientation subscale.
Means and Standard Deviations, and Group Differences Between the Current Sample and the LS/CMI North American Normative Group (Total Community Sample)
Note. LS/CMI = Level of Service/Case Management Inventory.
p < .05. ***p < .001.
Internal Reliability of the LS/CMI
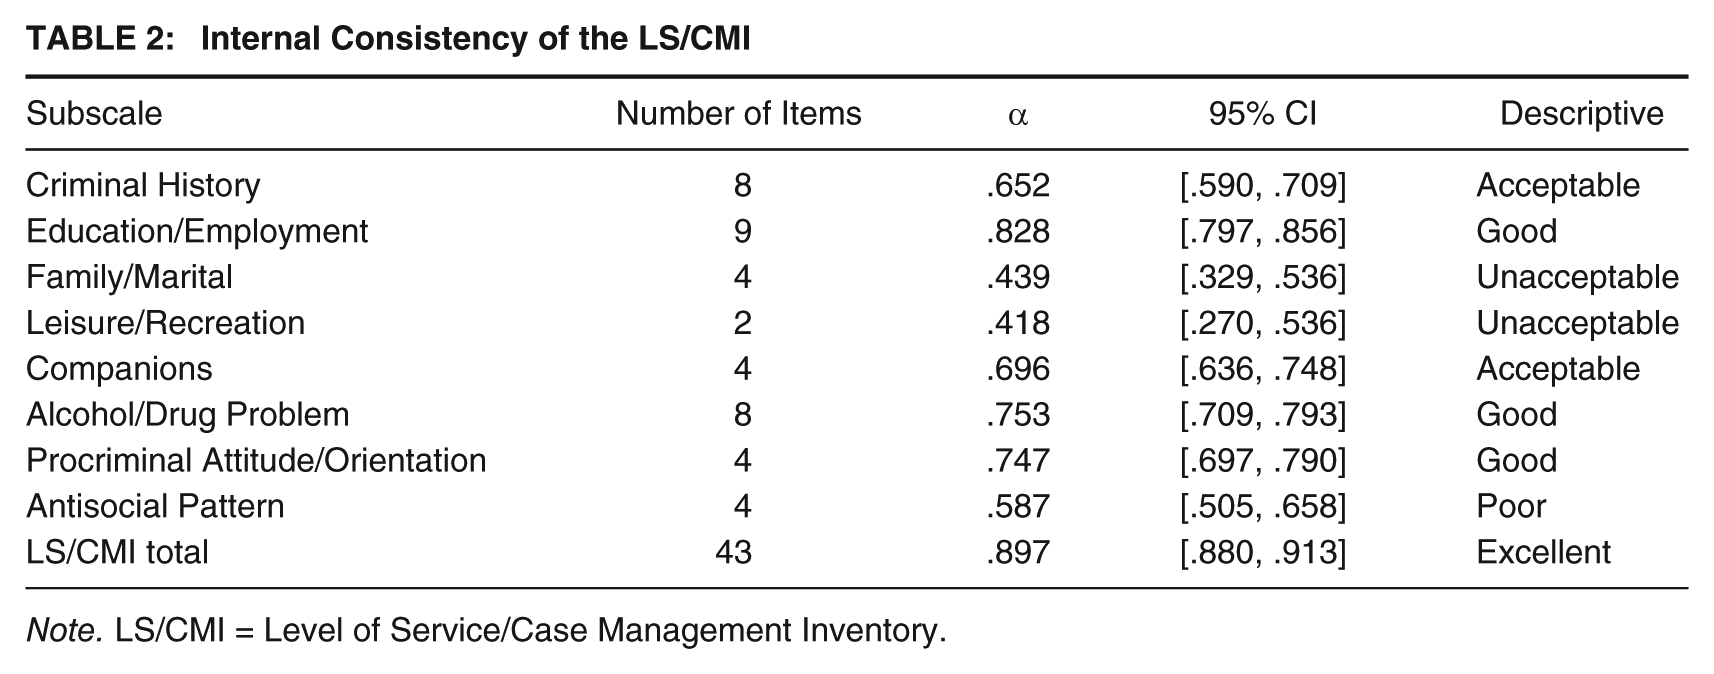
Cronbach’s alpha is a statistical measure of the internal consistency of a psychometric test. Coefficients of .6 to .7 are considered “acceptable,” .7 to .9 are considered to be “good,” and scores higher than .9 are considered to be “excellent.” Coefficients below .6 are considered to be “poor” or at a random level of chance (DeVellis, 2012). As can be seen in Table 2, the subscale and total scores of the LS/CMI ranged from .418 to .924.
Internal Consistency of the LS/CMI
Note. LS/CMI = Level of Service/Case Management Inventory.
At an item level, the alpha coefficient for all 43 items was .897. The item-total correlation table indicated that 12 items from the LS/CMI obtained a correlation value of less than .3. This indicates that these items did not correlate well with the overall scale and may be “dropped” from the scale. With these items removed, a Cronbach’s alpha of .906 was obtained, indicating an excellent level of internal reliability.
Correlations
The direction, magnitude, and significance of the correlations can be viewed in Table 3. As can be seen, the inter-scale correlations were all highly significant, with the majority significant at the p < .001 level. The exception to this was the correlation between the Criminal History and Leisure/Recreation subscales. It can be argued that criminal behavior changes over the course of one’s life, and therefore criminogenic needs may also change (Palmer & Hollin, 2007; Soothill, Francis, & Fligelstone, 2002). A number of significant negative correlations were found between age and scores for the following LS/CMI subscales: Education/Employment, p < .001; Companions, p < .001; Alcohol/Drug Problem, p < .05; Procriminal Attitude/Orientation, p < .05; Antisocial Pattern, p < .001. There was also a significant and inverse relationship between age and the LS/CMI total score, p < .001. Pearson correlations were calculated between age, the LS/CMI scores, and whether offenders had been guilty of prior offenses. All correlations were significant at least at the p < .05 level, with the exception of the Alcohol/Drug Problem and Procriminal Attitude/Orientation subscales. Whether an offender reoffended within a 12-month period was significantly correlated with the Education/Employment, Leisure/Recreation, Alcohol/Drug Problem, Procriminal Attitude/Orientation, and Antisocial Pattern subscales, the LS/CMI total score, and age of the offender.
Correlations Between Offender’s Age, LS/CMI Total and Subscale Scores, Prior Offenses History, and Reoffending

Note. LS/CMI = Level of Service/Case Management Inventory; CH = Criminal History; EE = Education/Employment; FM = Family/Marital; LR = Leisure/Recreation; C = Companions; ADP = Alcohol/Drug Problem; POA = Procriminal Orientation/Attitude; AP = Antisocial Pattern.
p < .05. **p < .01. ***p < .001.
Factor Analysis
Factor analyses at both the subscale and item level were undertaken using a principal-axis factor analysis with direct oblimin rotation. This method was chosen to explore the underlying latent constructs of the LS/CMI. An orthogonal rotation method (direct oblimin) was used as the derived factors are likely to be intercorrelated. For a factor to be considered for inclusion, an eigenvalue of >1 was used as the minimum threshold value. This was also confirmed through a visual inspection of the scree plot. Consistent with the general rule of thumb, only variables with loadings of .32 and above were interpreted as they account for 10% of overlapping variance (Tabachnick & Fidell, 2007). The degree of item cross-loadings across factors (if present) was also considered.
Subscale Level
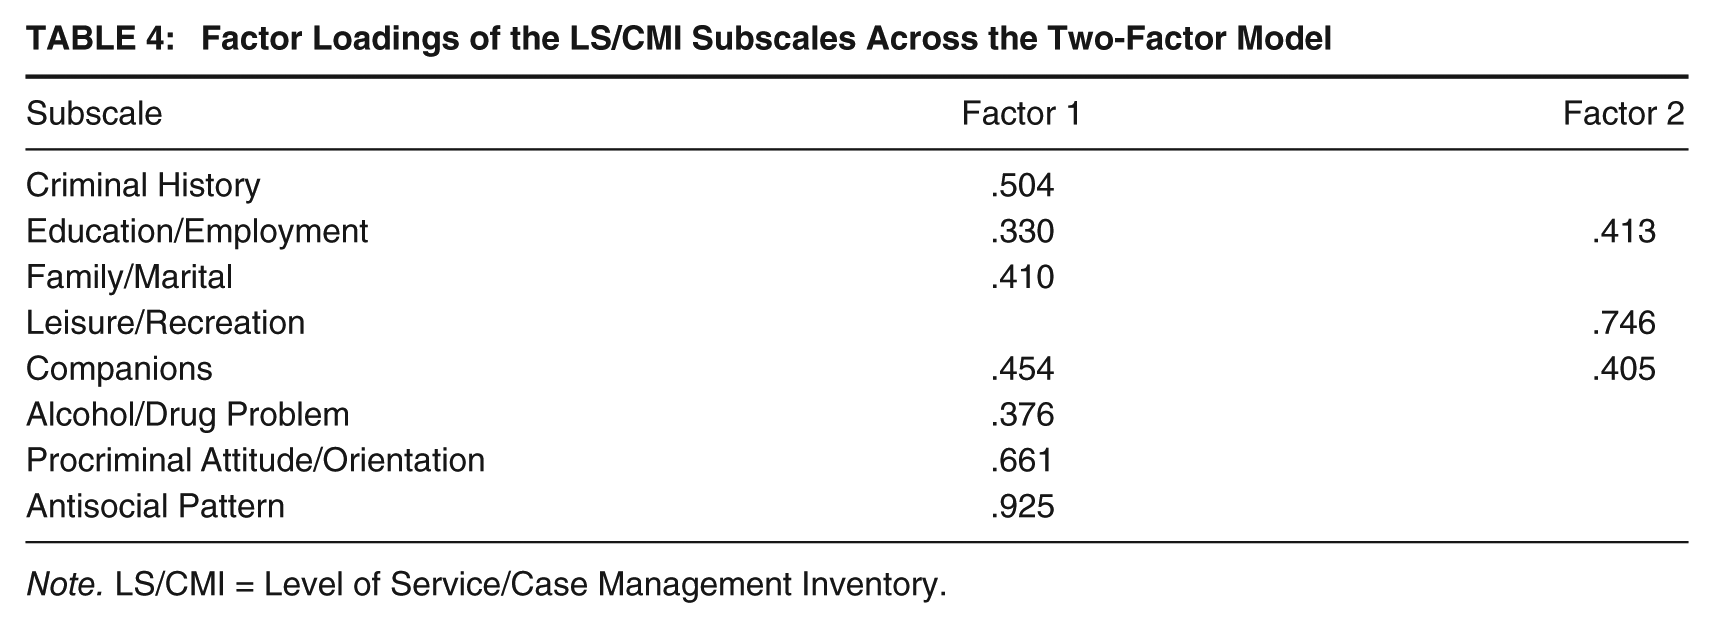
To replicate the factor analysis reported by previous research (Hollin et al., 2003; Loza & Simourd, 1994; Palmer & Hollin, 2007), the LS/CMI subscale scores were examined. The Kaiser–Meyer–Olkin measure of sampling adequacy was .82, above the recommended value of .6, and Barlett’s test of sphericity was significant, χ2(28) = 650, p < .001. This suggested that the data were suitable for exploratory factor analysis. The analysis produced a two-factor solution where factors one and two accounted for 42% (eigenvalue = 3.38) and 13% (eigenvalue = 1.04) of the variance, respectively. The loadings of each of the subscales across the two factors can be viewed in Table 4. It is noted that two subscales loaded almost equally on both factors. This included the Education/Employment subscale (.330 and .413, respectively), and the Companions subscale (.454 and .405, respectively). Factor one represents the subscales relating to criminal conduct and the second factor relates to lifestyle factors.
Factor Loadings of the LS/CMI Subscales Across the Two-Factor Model
Note. LS/CMI = Level of Service/Case Management Inventory.
Item Level
The data were screened for univariate outliers and no problematic values were identified. Initially, the factorability of the 43 LS/CMI items was examined. The Kaiser–Meyer–Olkin measure of sampling adequacy was .85, above the recommended value of .6, and Barlett’s test of sphericity was significant, χ2(903) = 6,150, p < .001. This suggested that the data were suitable for the factor analysis.
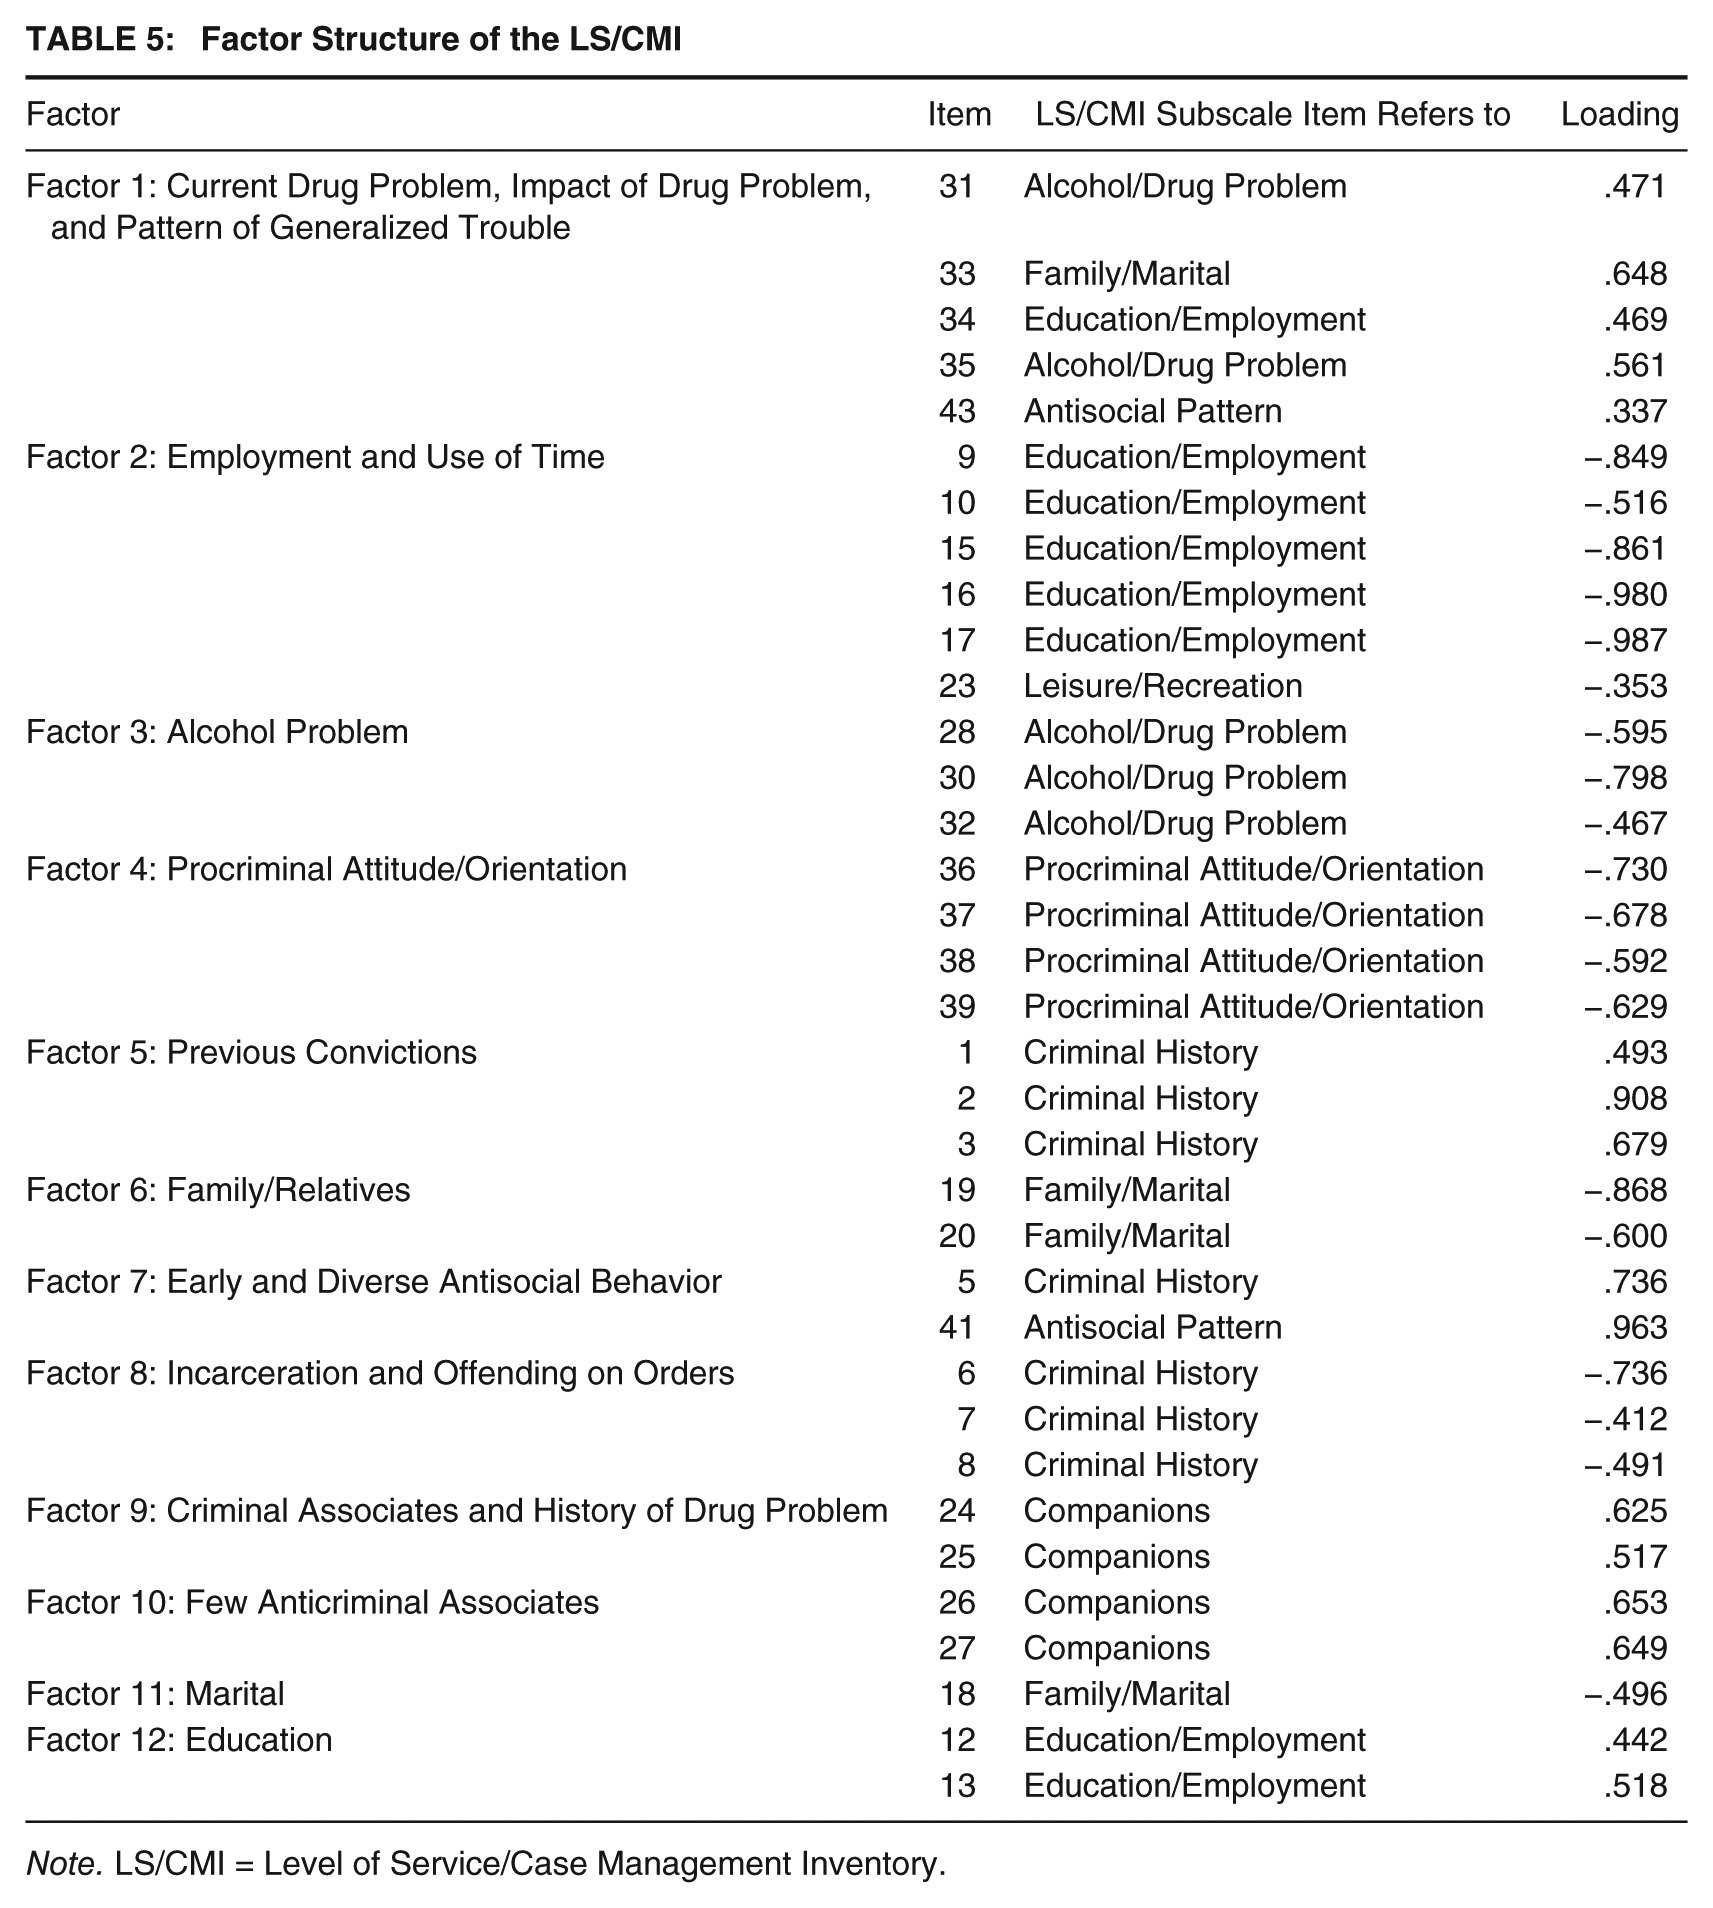
Initial eigenvalues indicated that the first factor explained 22% of the variance and had an eigenvalue of 9.3. Factors 2, 3, and 4 had eigenvalues of two and explained 6.8%, 6.2%, and 5% of the variance, respectively. Factors 5 to 12 had eigenvalues of one and explained between 2% and 4% of the variance. As the LS/CMI is copy-righted and cannot be reproduced, the items loading on each of these factors appear under their original subscales in Table 5. Please refer to the LS/CMI manual for the full item content. These factors have been labeled to reflect the items within each identified factor. As only items with loadings of .32 were considered, seven items did not load onto any of the factors (Items 4, 11, 14, 21, 22, 29, and 40). All the factors appeared to be unidimensional with no cross-loadings present.
Factor Structure of the LS/CMI
Note. LS/CMI = Level of Service/Case Management Inventory.
A total of 12 items did not correlate well with the overall scale (values of <.3 on item-total correlation). Therefore, these items were removed and the remaining items were re-analyzed (31 of the original 43 LS/CMI items). The Kaiser–Meyer–Olkin measure of sampling adequacy was .87, above the recommended value of .6, and Barlett’s test of sphericity was significant, χ2(496) = 5,177, p < .001. This suggested that the data were suitable for exploratory factor analysis.
Initial eigenvalues indicated that the first factor explained 28% of the variance and had an eigenvalue of 8.9. Factors 2 and 3 had eigenvalues of two and explained 8.5% and 6.8% of the variance, respectively. Factors 4 to 8 had eigenvalues of one and explained between 3% and 6% of the variance. As only items with loadings of .32 were considered, item 23 did not load onto any factor. All of the factors appeared to be unidimensional with no cross-loadings present. These factors were also labeled to reflect the items within each identified factor. These factors are Procriminal Attitude/Orientation, Employment and Use of Time, Early and/or Diverse Antisocial Behavior, Impact of Drug/Alcohol Problems, Parent/Relatives, Criminal Acquaintances and Drug Problem, Incarceration and Breach of Orders, and Few Anticriminal Associates. 1
Sequential Logistic Regression
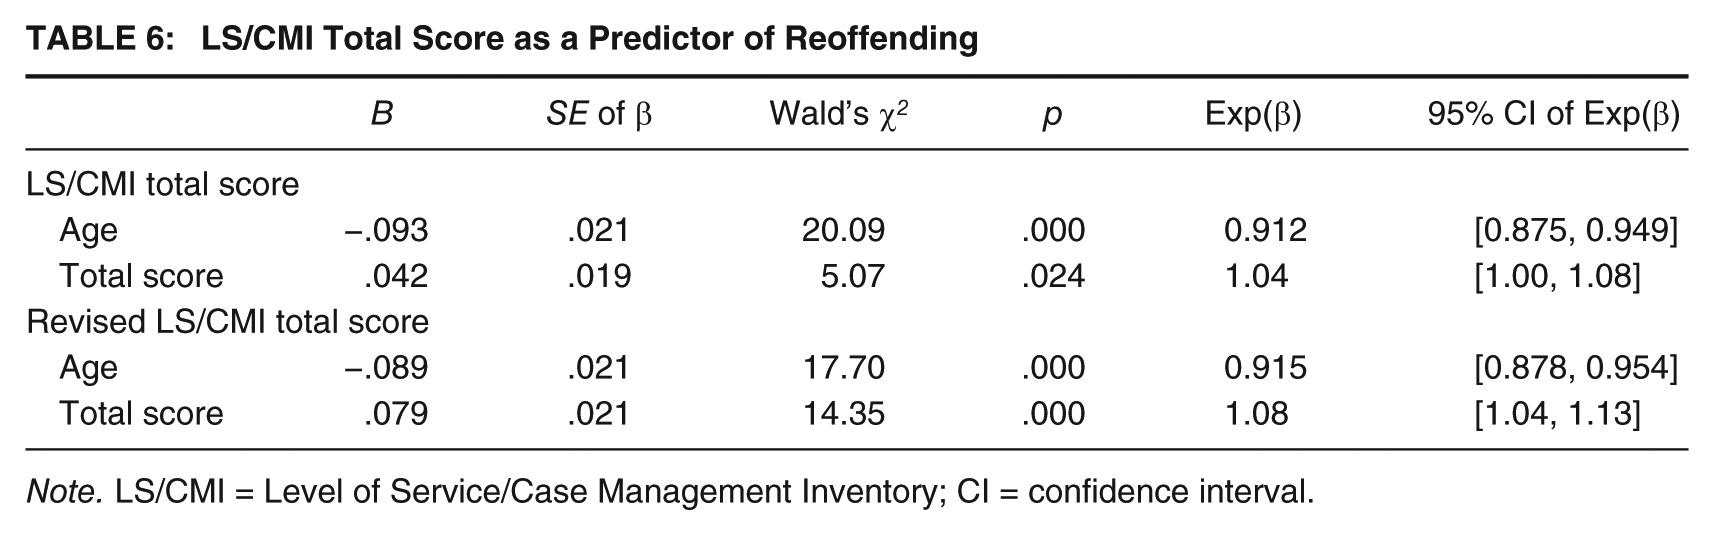
A sequential logistic regression was used to investigate the predictive utility of the LS/CMI. Due to the number of items removed for the revised total score, only the total score and revised total score analyses are reported here, as opposed to analyses of the predictive validity of the subscales. This is due to the subscale totals becoming questionable as they only relied on one item for a total score. In each analysis, the control variable of age was entered in first. The beta coefficients and effect sizes, exp(β), for the models predicting reoffending for both the LS/CMI total score and the revised total score are displayed in Table 6. In the first analysis, the LS/CMI total score was then added in the second step of the model. The overall successful classification rate for the logistic regression model based on age and LS/CMI total score was 78.7%. The model successfully predicted outcomes for the 6% of the 64 offenders who did reoffend, and 99% of the offenders who did not reoffend.
LS/CMI Total Score as a Predictor of Reoffending
Note. LS/CMI = Level of Service/Case Management Inventory; CI = confidence interval.
Next, the 12 items with low item-total correlations previously identified were removed from the data and the LS/CMI total score was recalculated. The previous sequential logistic regression was re-run, replacing the LS/CMI score with the new revised total score. The overall successful classification rate for the logistic regression model based on age and the revised LS/CMI total score was 79.4%. The model successfully predicted outcomes for the 17% of the 64 offenders who did reoffend, and 96% of the offenders who did not reoffend.
The results indicate that an increase in the LS/CMI total and revised total score is associated with a greater likelihood of reoffending after controlling for the effects of age; however, this is a relatively weak effect size. This means that for each one unit increase in the LS/CMI total and revised total score, the chance of recidivism increases by 1.04 and 1.08, respectively. The odds ratios indicated individuals who are identified as being of a higher risk of reoffending are 1.04 (LS/CMI total score) and 1.08 (LS/CMI revised score) times more likely to reoffend than those individuals indentified as having a lower recidivism risk. Sequential logistic regression analyses were also conducted removing the control variable of age. The changes to the exp(β) value was minimal for both the LS/CMI total, exp(β) = 1.05, and the revised LS/CMI total, exp(β) = 1.10.
ROC Analysis
This section investigates the validity of the LS/CMI in predicting reoffending using the ROC analysis. This procedure produces a ROC curve where true positive rates are plotted against false positive rates to display a trade-off between sensitivity, or those offenders who are correctly identified as being at risk of reoffending and actually reoffend, and specificity, or those offenders who are correctly classified as being at low risk of reoffending and do not reoffend (Metz, 2006).
The AUC for the LS/CMI total score was significant at the p < .05 level (AUC = .621, 95% confidence interval [CI] = [.546, .696]). The AUC for the revised LS/CMI total score was significant at the p < .001 level (AUC = .693, 95% CI = [.625, .762]). However, in both instances, the AUC value suggests only a weak discriminative ability. In relation to the magnitudes of the ROC values, following guidelines provided by Rice and Harris (2005) in both instances these values would reflect a medium effect size (Cohen’s d = .4 and .7, respectively).
Discussion
This study provides information regarding the psychometric properties of the LS/CMI in an Australian (Tasmanian) offender population. Specifically, this study examined the internal reliability of the LS/CMI scale, criminogenic risk and need in the current sample, the factor structure of the LS/CMI at both a subscale and item level, and the predictive utility of the LS/CMI using both the General Risk/Need total score and a revised total score. The implications of each of these findings in terms of the LS/CMI’s psychometric properties are discussed in turn.
Group Means and the Internal Consistency of the LS/CMI
An analysis of the current sample’s mean scores on the LS/CMI total and subscales scores indicated that there were significant differences when compared with the North American total community sample normative group presented in the LS/CMI manual. Specifically, the current offenders scored significantly higher on the LS/CMI total score, and the Criminal History, Leisure/Recreation, Companions, and the Alcohol/Drug Problem subscales. This raises concern over the appropriateness of utilizing the Canadian norms to classify Australian offenders’ recidivism risk. It is suggested that more research needs to be conducted to gain Australian normative data to apply to this risk assessment.
Regarding the internal consistency of the LS/CMI, the alpha coefficients determined that the General Risk/Need total score had an excellent level of internal consistency (α = .9). However, at a subscale level, there was variability in terms of internal consistency, with subscale coefficient alpha’s ranging from .42 to .83. This indicated that five of the eight scales achieved an acceptable or higher level of internal consistency, whereas three of the scales were “poor” or “unacceptable.” The variation in the alpha coefficients are comparable with those obtained by Hollin et al. (2003) and Palmer and Hollin (2007), who assert this may be due to the varying number of items across the subscales with some subscales having fewer items than others (e.g., two items on the Leisure and Recreation subscale compared with eight items on the Criminal History subscale). However, correctional agencies use these scales to identify an offender’s criminogenic risk and need (including strengths), as well as to incorporate these scales into sentence, program, and release-based planning. Basing such decisions on scales that have poor internal consistency is problematic as the items do not adequately measure what they purport to measure, and as a result can lead to inaccurate decisions with the potential for serious consequences. DeVellis (2012) suggested Cronbach’s alpha ranges of .7 and above for practical uses. This is important for risk assessments when agencies are basing release decisions, supervision, and intervention strategies upon them. Therefore, the capacity for the subscales to function as independent scales to adequately identify criminogenic risk/needs is questionable and requires further research.
Identified Problematic Items
The item-total correlation table identified that 12 of the 43 LS/CMI items (28% of the items) did not have a high correlation with the overall scale and could be excluded from the scale. Of the items that were excluded, five of these items could be considered “double-barrelled items” in which, for example, the item asked about both youth and adult criminal history. This suggests that these items need to be separated to be adequately measured in this sample of offenders. This information could determine if youth and/or adult offending contributes more to future recidivism within this population. Furthermore, the items addressing the presence of an alcohol problem (previously and currently) were also identified. This is an unusual finding considering the link between alcohol and crime, for example, being under the influence of alcohol when committing the offense (Greenfeld & Henneberg, 2001), and should be an area for future research regarding the prevalence and implications of alcohol problems and its relationship with criminal behavior within this population. Having less than Grade 12 education, but not less than Grade 10, was identified. However, due to the current low Tasmanian retention rates beyond a grade 10 education, this may be a finding specific to the current sample wherein more than a Grade 10 level of education is considered a strength. The item pertaining to a specialized assessment for antisocial pattern may have arisen due to the sample size wherein the item could not be measured efficiently, rather than an implication of the item itself. The remaining identified items could be seen as asking a lot of information for one item, whereas in this sample the items may need to be broken down into several items to capture the true attitude or circumstance of the offender. However, identifying 28% of the LS/CMI items as not correlating with the overall scale suggested that the LS/CMI may not be adequate for the Tasmanian offender sample. This may require conducting further research on the LS/CMI and/or attempting to develop a revised or new risk assessment that explores the impact of separating out identified problematic items to determine whether the issues are present and how they can be measured in a more effective manner to improve the identification of criminogenic needs and their predictive utility.
Correlations
The LS/CMI total and subscale scores (with the exception of the Alcohol/Drug Problem and Procriminal Attitude/Orientation subscales) were strongly associated with criminal history in regard to whether or not the offender had been guilty of prior offenses. This finding is not surprising given that the higher the LS/CMI scores an individual obtains, the higher their recidivism risk. Furthermore, from the current sample, more than half (52%) had a previous conviction, 39% had previously served a custodial sentence, and 21% had reoffended within 12 months of their current conviction. Although this rate of prior offenses and recidivism may seem high, statistics collected by the Australian Institute of Criminology (2014) indicated that of prisoners released in 2008-2009, 40% had returned to prison under sentence, with a total of 46% of offenders returning to corrective services (both prison and community corrections) by the end of the 2011 financial period, reflecting the rate of reoffending within Australia.
Factor Structure of the LS/CMI
The results of the factor analyses were consistent with previous studies (e.g., Hollin et al., 2003; Loza & Simourd, 1994). At a subscale level, the LS/CMI produced a two-factor solution with the factors accounting for 42% and 13% of the variance, respectively. Three of the subscales (Education/Employment, Companions, and Alcohol/Drug Problem) loaded almost equally across the two factors. The subscales loading onto the first factor represents the majority of the central eight factors relating to criminal conduct. The second factor represents those areas relating to lifestyle considerations (or the moderate four factors of the central eight). These items are important considerations that can be targeted through supervision and/or program interventions.
At an item level, a 12-factor solution was produced when all 43 LS/CMI items were included in a factor analysis. The 12 factors were labeled Current Drug Problem, Impact of Drug Problem, and Pattern of Generalized Trouble; Employment and Use of Time; Alcohol Problem; Procriminal Attitude/Orientation; Previous Convictions; Family/Relatives; Early and Diverse Antisocial Behavior; Incarceration and Offending on Orders; Criminal Associates and History of Drug Problem; Few Anticriminal Associates; Marital; and Education. This is in contrast to the findings of Hsu et al. (2011) who determined a 5-factor solution for Australian males (Static Risk, Employment, Procriminal Attitudes, Mental Health, and Protective Companions), and a 4-factor solution for Australian females (Static Risk, Employment, Procriminal Attitudes, and Mental Health), when investigating the psychometric properties of the LSI-R. However, it is important to note that the current study did not examine the factor structure for males and females separately due to the size of the sample. This could be why a differing factor structure was determined for this sample.
It can be considered an unusual finding that criminal history did not load onto the first factor of the factor structure of the LS/CMI as it has done in previous studies (e.g., Hsu et al., 2011). Rather, for this population of offenders, items relating to a current drug problem, its impact on several areas of functioning, and whether the offender displays a pattern of early and diverse antisocial behaviors loaded highly on the first factor. Items relating to an offender’s past and present alcohol problem and law violations loaded onto the third factor. This suggests that these areas are an area of importance for this sample of offenders. Although the relationship between alcohol abuse and criminal behavior is weaker in comparison with that between illicit drugs and crime, and the criminal justice system is less tolerant of illicit substance abuse in comparison with alcohol abuse (Andrews & Bonta, 2010), they are both important considerations when determining an offender’s risk of recidivism. Alcohol abuse among offenders is quite high and offenders often report a high incidence of drinking at the time the offense occurred (Greenfeld & Henneberg, 2001). It can be argued that illicit drug use/abuse has a stronger link to crime because of the illegal nature of the drugs and that they usually place an individual in direct contact with other criminals. The Australian Bureau of Statistics (2005) determined that in 2004, 37% of detainees in the Drug Use Monitoring in Australia Program attributed at least some of their offending to their illicit drug use and/or to support drug habits. Due to these factors, substance abuse can play a critical role in an offender’s management program to help reduce their risk of engaging in future criminal behavior. Muftic and Bouffard (2008) suggested that an effective approach for substance abusing offenders is a combination of intensive supervision programs combined with substantive treatment components. Furthermore, chemical dependency assessment and community service sentences offer benefits to both the offenders and the community, which do not occur with monetary fines and should be considered especially for low-level drug and/or alcohol offenders.
The second factor related to items regarding employment and frequency of employment, as well as the offender’s use of time. Employment may also be an important consideration for Tasmanian offenders in light of the current economic climate. The current unemployment rate in Australia stands at 5.8% in August 2013, which has increased by 0.1% from July 2013. More specifically, Tasmania, where these data were collected, has the highest unemployment rate in Australia of 8.6%, increasing by 0.2% from previously estimated figures (Australian Bureau of Statistics, 2013). It remains a challenge within the population to find adequate stable and permanent employment to meet an individual’s financial needs. Andrews and Bonta (2010) indicated that stability of unemployment is a stronger risk factor than unemployment itself, with criminal behavior increasing with frequent unemployment and longer durations of being unemployed.
It was not until the fourth factor that the big four of the central eight factors appeared. Items on this factor related to an offenders’ procriminal attitude and orientation, or whether they were supportive toward crime and felt that their sentence or order was fair. Antisocial attitudes and cognitions are considered to be one of the best predictors of future criminal recidivism (Andrews & Bonta, 2010). As it is considered to be a dynamic factor, antisocial attitudes and cognitions can be addressed through targeted interventions and supervision through the reduction of antisocial thinking and gaining insight on risky thoughts and behaviors. Furthermore, the offender can be encouraged to build and maintain social connections with anticriminal friends and associates for positive reinforcement of prosocial behaviors and attitudes to reduce recidivism risk.
Although the identified 12-factor solution does reflect the central 8 factors identified by Andrews and Bonta (2010), the factors are reflected in a differing order of importance. Andrews and Bonta (1995) have acknowledged that the factor structure of the LSI-R may depend on the population and setting in which it is administered due to inconsistent factor structures reported in various studies (e.g., Andrews & Robinson, 1984; Hsu et al., 2011; Loza & Simourd, 1994). From the analyses, this appears to be true for the current sample of Tasmanian offenders. This is important as not only does it provide information regarding the latent construct structure of the LS/CMI, but it also provides areas of concern within this offending population. This could inform correctional justice agencies when developing programs and interventions to respond to these identified needs.
Predictive Utility of the LS/CMI
In both sequential logistic regression analyses, the total and revised total scores were found to be predictive of criminal reoffending within a 12-month period. When the previously identified 12 LS/CMI items were removed for the subsequent analysis, the overall successful classification rate improved marginally by 0.7%. However, there was an improvement in the predicted outcomes of offenders who did reoffend, with the total score identifying 6% and the revised total score identifying 17% of the 64 offenders who did reoffend. Despite this improvement, for both the total and revised total scores, there was a relatively weak effect size suggesting that the instrument needs to be more sensitive to the criminogenic risk/needs within this population. This analysis indicates that the LS/CMI only accounts for a small amount of variance that is associated with recidivism, and successfully predicting 17% of offenders who did not reoffend even when the identified 12 items were removed is poor. This low predictive validity of both the LS/CMI total score and the revised score was confirmed by the ROC analyses. In both instances, the predictive utility, although significant, was relatively weak (AUC = .62 and AUC = .63, respectively). Furthermore, the AUC values obtained in the current research were lower than that obtained in Guay (2012) in regard to predicting new arrests for both gang (AUC = .71) and non-gang (AUC = .73) in Canadian offenders. The current AUC values were also lower than that obtained by Girard and Wormith (2004) when evaluating the LSI-OR. This indicates that using the LS/CMI as a measure of recidivism risk is problematic within this population of Tasmanian offenders. Although it is acknowledged that risk assessments do not predict whether an offender will reoffend, they are used to provide a structured statistical assessment of identifying an individual’s level of recidivism risk, which in turn can inform an offender’s sentence, intensity of supervision, and eligibility for programs aimed at reducing recidivism risk for identified criminogenic needs. The current findings question the use of the LS/CMI in doing this, and suggest that further research is required to validate the instrument in the current population, or revise or tailor the current instrument to suit the needs of the population and improve its predictive utility.
Limitations
Several limitations in the current study were identified. In the current study, the data for females and males were combined due to the small sample size. Although it is argued that the Level of Service inventories are gender-neutral, other research finds that females have different criminogenic risk/needs, which may have affected the results (Hannah-Moffat, 2006, 2009). Furthermore, the data were obtained from a community corrections agency limiting the diversity of the sample, as well as possibly the seriousness of the offenses as opposed to, for example, a data sample that included prisoners. As a result, it is suggested that further research be conducted that examines the norms, factor structure, and predictive utility of the LS/CMI as it applies to female and Indigenous offenders, differing risk levels, as well as exploring whether the LS/CMI is predictive of both general and violent recidivism. In using an exploratory factor analysis, the purpose of the presented research included exploring the underlying latent constructs of the LS/CMI. It is suggested that this research could be further expanded by conducting a confirmatory factor analysis to explore the structure and relationships between the latent constructs that underlie the LS/CMI and this could be conducted with a larger sample size.
It is important that these limitations are considered and addressed in future research evaluating both the LS/CMI and other risk assessments. Using a risk assessment instrument that has not been adequately validated in the population it is intended to use can result in various complications. This may include, for example, disproportionately restricting an offenders’ liberty due to an inaccurate assessment of their possible future behavior or recidivism risk (Glazebrook, 2010). This can be avoided through further study of the assessments psychometric properties, and tailoring the instrument if necessary.
Conclusion
An assessment of an offender’s risk of recidivism is an integral part of their case planning within a corrective services environment. By identifying their overall level of risk, including criminogenic risk/needs, corrections personnel are able to develop effective case plans that specifically target areas of concern for the individual offender. The information gained from such risk assessments can also be used for policy decisions including whether to release an offender from custody, parole and probation conditions, and their potential eligibility for community corrections orders. In doing such assessments, it is important to use tests that have excellent empirical reliability and validity. This is to ensure the assessment measures what it intends to measure (i.e., risk of reoffending), and that it does so in a reliable manner. Furthermore, test administrators need to ensure that they adhere to the administration, scoring, and interpretation guidelines of the assessment, as well as ensuring that it is appropriate to use in the target population (Boyle, Saklofske, & Matthews, 2012).
The current study builds on and contributes to the work in criminological research pertaining to risk assessment instruments. Although studies in the international arena have examined the use and efficacy of the multiple Level of Service inventories, there has not been an extended study of the LS/CMI within an Australian context to the best of the authors’ knowledge. As such, this study provides insight into the risk, need, and responsivity issues of Australian offenders by examining the psychometric properties and use of the LS/CMI in an Australian offender community corrections population and reflects on considerations for the future use of such instruments. The findings from the current study indicate that although the LS/CMI had excellent internal reliability in terms of its overall risk/need score, three of the eight subscales achieved a poor or unacceptable level of internal reliability. In regard to the predictive utility of the LS/CMI, the results indicate that both the LS/CMI total and the revised total (12 items removed) scores were determined to have predictive accuracy for general recidivism, with a significant medium effect size.
This has implications for current users of the LS/CMI who are using this assessment tool outside the Canadian context. Australian users of the LS/CMI need to be aware that at present the LS/CMI may not be the most effective means to measure risk without further validation of the instrument. Therefore, it is important for Australian corrective jurisdictions to validate this instrument within the intended offender population to provide valid norms for the LS/CMI. This is crucial as previous Australian research (e.g., Hsu, 2010; Mihailides et al., 2005) has identified concerns when transferring across the Canadian norms of previous Level of Service inventories. As a result, it is suggested that the LS/CMI might not be the most appropriate risk/need assessment tool for use within this population and further research should be conducted before permanently adopting such instruments within an Australian jurisdiction for the purposes of predicting recidivism risk and using this information to inform parole and community supervision orders.
Footnotes
Any views or opinions expressed in this article are those of the authors and do not necessarily reflect the views of the Tasmania Department of Justice.