
Abstract
This study provides both a structural analysis of the Historical-Clinical-Risk Management–20 (HCR-20) Version 3 and an examination of the correspondence between the HCR-20 Versions 2 and 3. HCR-20 Versions 2 and 3 risk ratings were completed for 64 psychiatric inpatients. Moderate to good interrater reliability was observed for the Version 3 subscales and summary risk ratings. Subscale scores and summary risk ratings on the Version 2 were significantly correlated with the corresponding scales and indices on the Version 3, although correlations were stronger when ratings were completed by the same rater as opposed to different raters. Version 3 items corresponding to Violence, Violent Attitudes, Violent Ideation or Intent, and Insight were the strongest predictors of the summary risk ratings, although some differences emerged when risk factor presence ratings were weighted by relevance ratings. The implications of these findings for risk assessment practice are discussed.
Keywords
There are few more important or timely topics in contemporary society than the assessment of violence risk. Violence risk assessment is a crucial component of many clinical and forensic evaluations, and as such, researchers have developed several techniques for improving and refining this process. Risk assessment instruments have become an integral part of the evaluation process for identifying high-risk individuals (Haggård-Grann, 2007; Mills, Kroner, & Morgan, 2011). These instruments are grounded in empirical research that has identified risk factors for future violent behavior. When included as part of a violence risk assessment, structured instruments can help standardize the evaluation process by providing clinicians with a guide as to which factors increase a person’s risk and how these factors should influence clinician judgments (Dolan & Fullam, 2007; Douglas, Guy, & Weir, 2008).
There are two broad categories of instruments used to assess an individual’s risk for violence: those using an actuarial approach and those using structured professional judgment (SPJ; Skeem & Monahan, 2011). Actuarial instruments involve rating an individual on a set of empirically generated risk factors. These items are combined according to a predetermined algorithm to generate a quantitative estimate of violence risk. The Violence Risk Appraisal Guide (VRAG; Quinsey, Harris, Rice, & Cormier, 2006) is the most widely used of these actuarial instruments (Singh et al., 2014). Although there is a wealth of evidence demonstrating the reliability and validity of instruments such as the VRAG (Quinsey et al., 2006), there are some drawbacks to the actuarial approach. One of the primary drawbacks is that these instruments combine risk factors for every individual in the same way. All risk factors receive the same empirical weight, and all risk factors are summed according to the same algorithm, regardless of potentially relevant differences in the individual being evaluated or the situation in which risk of violence is being assessed. There are likely instances in which the algorithm may produce a risk estimate that is not in agreement with the clinician’s professional judgment, at which point the clinician must struggle to reconcile two conflicting sources of information.
The SPJ approach to violence risk assessment represents a middle ground between completely unstructured clinical judgments (i.e., assessments made without the aid of any systematic, empirically grounded instrument) and completely structured actuarial approaches (Douglas, Cox, & Webster, 1999; Skeem & Monahan, 2011). Similar to the actuarial approach, the SPJ approach also involves rating individuals on a set of empirically validated risk factors. However, the clinician decides how the risk factors are to be combined in formulating a final decision about the individual’s risk, rather than following a predetermined algorithm. These instruments still provide structure by offering clinicians a guide as to which factors should be evaluated, but the manuals do not instruct clinicians on exactly how these risk factors should influence judgments about future violent behavior (Dolan & Fullam, 2007; Douglas et al., 2008).
Historical-Clinical-Risk Management–20 (HCR-20)
The HCR-20 (Webster, Douglas, Eaves, & Hart, 1997) is one of the most well-known SPJ instruments (Douglas & Reeves, 2010). In a recent survey of more than 2,000 clinicians across 44 countries, Singh et al. (2014) found that the HCR-20 was the most commonly used instrument for evaluating risk. It is intended for use with adults who have a history of violence and/or mental disorder. The instrument includes three subscales: Historical (H), Clinical (C), and Risk Management (R). The H subscale includes 10 items that reflect static factors known to be associated with violence (e.g., Previous Violence, Substance Use Problems), the C subscale includes 5 items that reflect dynamic risk factors (e.g., Active Symptoms of Major Mental Illness), and the R subscale includes 5 risk items that reflect future situational circumstances that may increase an individual’s risk for violence (e.g., Lack of Personal Support). Versions 1 and 2 of the instrument also include a final risk judgment in which the clinician rates the individual’s overall level of risk of violence as low, moderate, or high.
There is a wealth of research that has provided evidence for the reliability and validity of the HCR-20 Version 2 (Douglas, Blanchard, Guy, & Weir, 2010; Douglas & Reeves, 2010). Several studies have demonstrated good interrater reliability, with intraclass correlation coefficients (ICCs) as high as .94 for the sum of item presence ratings and .90 for the final risk judgment (Belfrage, 1998; de Vogel & de Ruiter, 2004, 2006; Douglas, 1996; Penney, McMaster, & Wilkie, 2014; Webster, Eaves, Douglas, & Wintrup, 1995). Studies have also established that the HCR-20 Version 2 is a robust predictor of violence in psychiatric and forensic populations (e.g., Arbach-Lucioni, Andrés-Pueyo, Pomarol-Clotet, & Gomar-Soñes, 2011; Douglas, Ogloff, Nicholls, & Grant, 1999; Guy & Wilson, 2007; Singh, Grann, & Fazel, 2011). Concurrent validity of the instrument has been demonstrated by comparing it to other, well-validated measures of violence risk. Douglas and Webster (1999) found correlations between the HCR-20 Version 2 and the VRAG and Hare Psychopathy Checklist–Revised (PCL-R; Hare, 1991) of .54 and .64, respectively.
The HCR-20 Version 3 (Douglas, Hart, Webster, & Belfrage, 2013) is the third edition of the HCR-20. The revision increased the instrument’s focus on risk formulation through the inclusion of relevance ratings for each risk factor and scenario planning. In addition, the authors revised several of the risk factors by narrowing their scope and providing more detailed instructions regarding how to conceptualize and code the risk factors. The authors also acknowledged that since the previous version of the HCR-20 was published in 1997, the literature on violence risk assessment has grown tremendously, and a revision was needed to reflect this new research.
The HCR-20 Version 3 is structurally similar to Version 2; it has the same three subscales (H, C, and R), each with the same number of items. However, new items have been added (e.g., Other Antisocial Behavior), whereas some items found on the former version are no longer included on the newest version (e.g., Young Age at First Violent Incident). These changes are described in detail elsewhere (Douglas et al., 2014) and are only summarized in brief here. However, among the most substantial changes to the HCR-20 Version 3 is the inclusion of relevance ratings that are intended to gauge the relevance of each risk factor in the formulation of the individual’s risk of violence. In addition, instead of eliciting a single final risk judgment, Version 3 has three summary risk ratings (SRRs); case prioritization, serious physical harm, and imminent violence.
To date, only a handful of preliminary studies have evaluated the reliability and concurrent validity of the HCR-20 Version 3, and some of these studies used preliminary or draft versions of the instrument (e.g., de Vries Robbé & de Vogel, 2010; Doyle, Shaw, & Coid, 2013; Strub & Douglas, 2009; see Douglas et al., 2013). These studies have demonstrated excellent interrater reliability for the sum of item presence ratings (ICCs between .92 and .94) and good to excellent interrater reliability for the H (ICCs between .72 and .94), the C (ICCs between .69 and .90), and the R subscales (ICCs between .69 and .93). In addition, kappa coefficients for the SRRs have ranged from .72 to .81 (Douglas & Belfrage, 2014; Douglas et al., 2013; Doyle et al., 2014; Kötter et al., 2014).
Concurrent validity of the HCR-20 Version 3 was studied by comparing it with Version 2 (Douglas & Belfrage, 2014; Douglas et al., 2013; Strub, Douglas, & Nicholls, 2014). Correlations between total scores on Versions 2 and 3 ranged from .84 to .93, but correlations for the subscales were more variable. Correlations between the two versions ranged from .60 to .89 for the H subscale, from .59 to .78 for the C subscale, and from .67 to .82 for the R subscale. Correlations as high as .98 have been found between SRRs on the two versions. However, these studies have contrasted ratings made by the same rater on both instruments, avoiding the confounding influence of imperfect interrater reliability (i.e., rater error). Nevertheless, these preliminary data provide some support for the comparability of Versions 2 and 3.
This study represents another step in the process of comparing the new HCR-20 Version 3 with its predecessor, by using independent raters to rate the two different versions of this instrument. Such research examining the overlap between these two versions of the HCR-20 is necessary to determine the extent to which clinicians can rely on research using Version 2 when applying Version 3. In addition, further research is needed to examine the psychometric properties of Version 3, given the limited published research to date. Finally, evaluating the relative importance of item presence and relevance ratings in generating SRRs will contribute to a more comprehensive understanding of this instrument. Specifically, the aims of this study were as follows: (a) to evaluate the interrater reliability of the HCR-20 Version 3 items and SRRs, (b) to examine associations between corresponding subscales and SRRs on the two versions of this instrument (using both the same and different raters), and (c) to explore how Version 3 presence and relevance ratings are associated with SRRs. It was hypothesized that good to excellent interrater reliability would be observed for the HCR-20 Version 3. It was also hypothesized that strong associations would be observed between corresponding subscales on the two versions of this instrument and that the Version 2 final risk judgment would be highly correlated with all three SRRs on Version 3. Lastly, it was hypothesized that the interaction between presence and relevance ratings would more strongly predict SRRs than relevance ratings alone.
Method
Participants
Participants were 64 patients who were admitted to an urban public psychiatric facility between February and December of 2013. The sample was nonconsecutive, including all English-speaking patients admitted to the hospital on days when research staff was present. Age ranged from 18 to 70 years with an average of 37.97 years (SD = 13.15). Participants were 73% male (n = 47) and 27% female (n = 17). Participant race/ethnicity was 14% White (n = 9), 69% Black (n = 44), 2% Asian (n = 1), and 5% mixed race/ethnicity (n = 3); 11% (n = 7) did not have race/ethnicity coded in their charts. The majority of the participants had a principal diagnosis of schizophrenia or schizoaffective disorder (86%, n = 55) and 14% (n = 9) had a principal diagnosis of a mood disorder. Most participants were transferred from an acute care hospital (75%, n = 48), whereas 22% (n = 14) were transferred from prison and 3% (n = 2) were admitted from other locations.
Measures
HCR-20 Versions 2 and 3
The HCR-20 is a risk assessment instrument used to help clinicians assess the likelihood of violence in criminal offenders and psychiatric patients. The clinician rates the presence of each of the 20 risk factors as present, partially or possibly present, or definitely present. For research purposes, these ratings were transformed into numbers: 0 = not present, 1 = possibly or partially present, and 2 = definitely present. A rating is omitted if there is not enough reliable information by which to judge the presence of the risk factor. On Version 2 of the instrument, once the 20 items have been rated, the clinician makes a determination about the individual’s overall risk level by rating the final risk judgment as low, moderate, or high. This 3-point scale was adapted for the present study to include intermediate ratings (low-moderate, moderate-high) to allow for more subtle distinctions in the patient’s risk level. These ratings were converted into an ordinal scale (1 = low risk to 5 = high risk) for statistical analyses.
The HCR-20 Version 3 is the third edition of the HCR-20. The overall format and structure of the newest edition of this instrument closely resembles that of Version 2 but with a number of changes previously described. In addition to presence ratings, the clinician is asked to rate the relevance of each risk factor as low, moderate, or high. As with Version 2, for statistical analyses, presence and relevance ratings were converted to numerical ratings (0 = not present/low relevance, 1 = possibly or partially present/moderate relevance, and 2 = present/high relevance). If an item presence rating was omitted or the item was rated as not present, the relevance rating for this item was omitted as well. Presence and relevance ratings were used to inform three SRRs: case prioritization, serious physical harm, and imminent violence that were rated as low, moderate, or high. Qualitative ratings were then converted into numerical ratings for statistical analyses (1 = low risk, 2 = moderate risk, and 3 = high risk).
Procedure
Approval to conduct the study was obtained from both the psychiatric hospital’s institutional review board and the institutional review board of the authors’ university. Violence risk ratings for Versions 2 and 3 were completed, on average, about 4 weeks after the patient was admitted to the hospital. However, the length of time between the patient’s admission to the hospital and completion of the two versions varied from patient to patient, depending on the availability of research staff, ranging from 14 days after admission to post-discharge. The rating period for the clinical subscales on both versions was the preceding 3 months. If the patient had been discharged at the time the instruments were coded, the rating period started 3 months before the date of discharge. Researchers coded risk management ratings based on discharge or release plans, as if the patient was to be released into the community at the time of the evaluation with the existing plans.
Research staff included four raters: one forensic psychologist who routinely uses the HCR-20 in clinical practice and three MA-level doctoral students in clinical psychology who received both didactic and supervised training in the administration and scoring of the instruments before the project began. All raters rated both Version 2 and Version 3 (in that order), making independent ratings for each scale and scoring both instruments based on information contained in the patient’s medical records and, when possible, brief interviews with the patient’s treatment team. Comprehensive interviews with study participants were not available. Of the 64 participants included in this study, 35 were rated independently by two raters.
Results
Interrater Reliability
Intraclass correlation coefficients (ICCs; two-way, absolute agreement) were calculated to evaluate interrater reliability between two raters who independently rated 35 of the 64 cases. The distribution and reliability of HCR-20 Version 2 ratings can be found in Tables 1, 2, and 3. On Version 2, good to excellent interrater reliability was observed for the total sum of item risk ratings (ICC = .80), the sum of risk ratings for H items (ICC = .84), the sum of risk ratings for C items (ICC = .70), and the sum of risk ratings for R items (ICC = .60). The interrater reliability of the final risk judgment was also good (ICC = .66), but using the more conservative kappa standard, exact agreement between raters appeared to be no better than chance (kappa = .05). ICCs at the item level ranged from −.12 to .93.
Distribution and Reliability of Sum of Presence Ratings
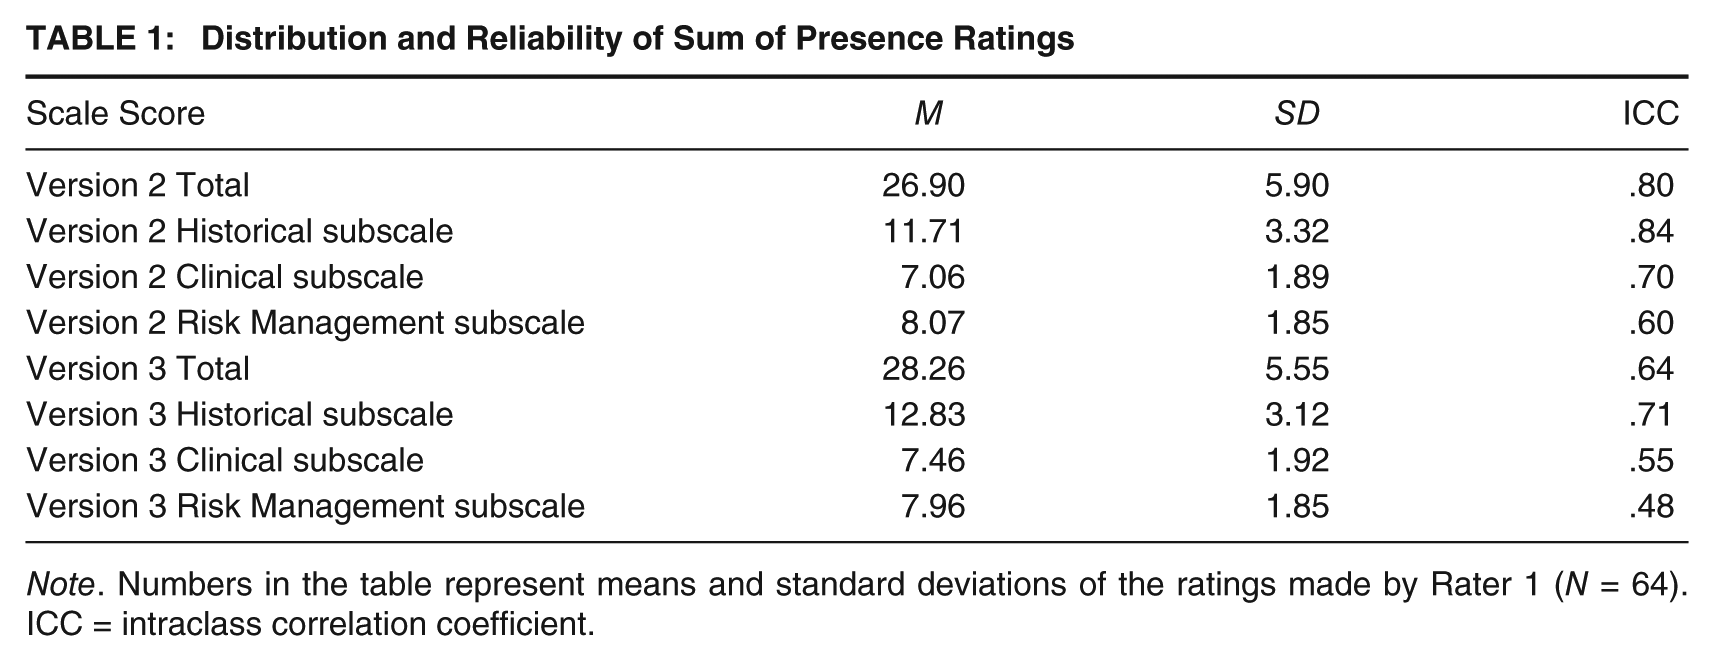
Note. Numbers in the table represent means and standard deviations of the ratings made by Rater 1 (N = 64). ICC = intraclass correlation coefficient.
Distribution and Reliability of Summary Risk Ratings
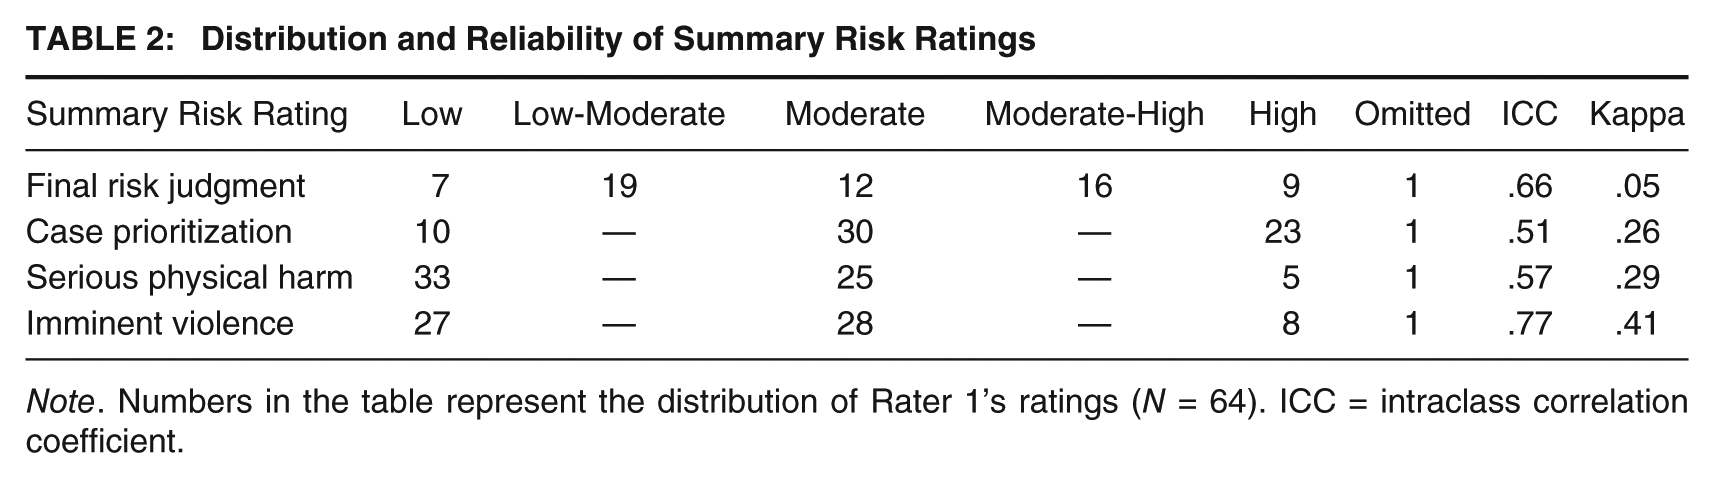
Note. Numbers in the table represent the distribution of Rater 1’s ratings (N = 64). ICC = intraclass correlation coefficient.
Distribution and Reliability of Version 2 Presence Ratings
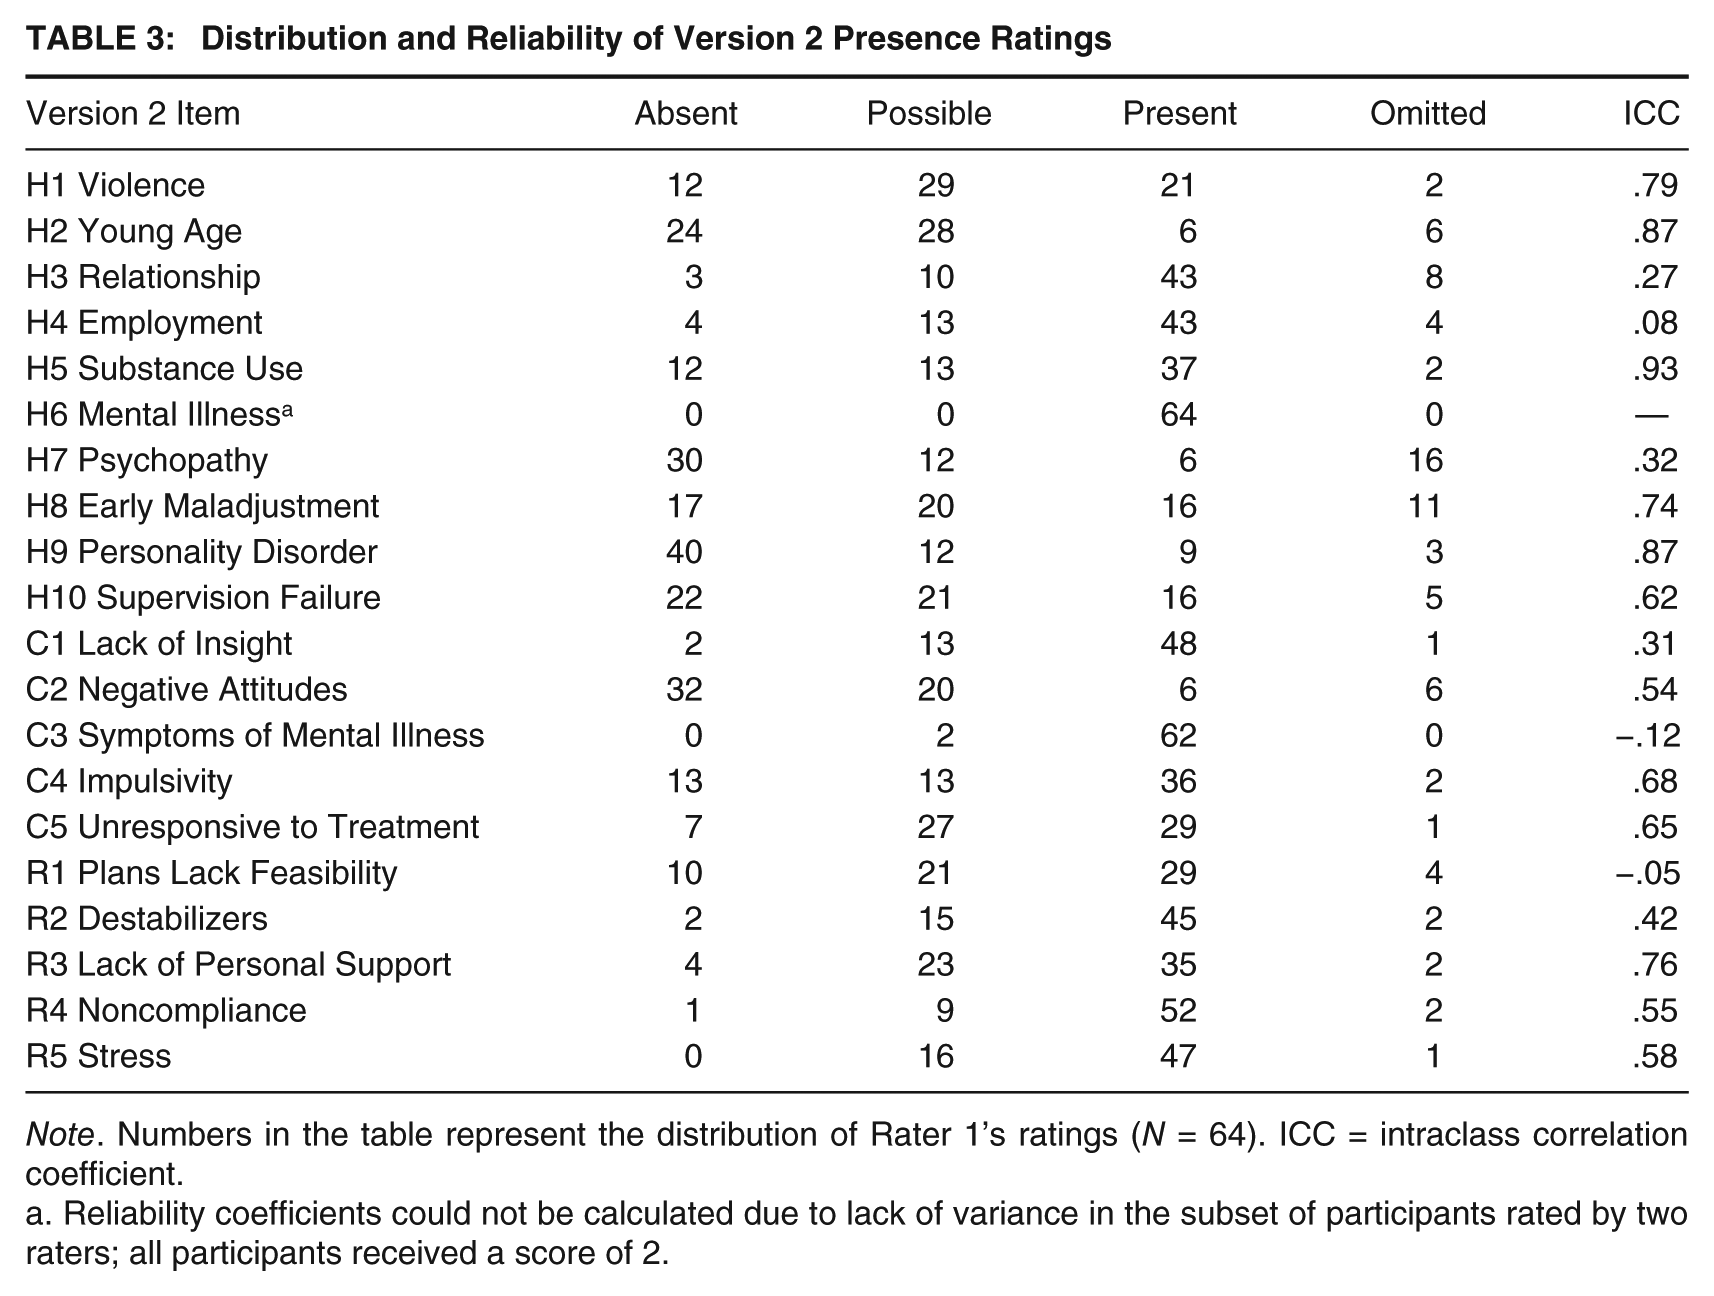
Note. Numbers in the table represent the distribution of Rater 1’s ratings (N = 64). ICC = intraclass correlation coefficient.
Reliability coefficients could not be calculated due to lack of variance in the subset of participants rated by two raters; all participants received a score of 2.
The distribution and reliability of HCR-20 Version 3 ratings can be found in Tables 1, 2, 4, and 5. On Version 3, good interrater reliability was observed for the sum of all 20 presence ratings (ICC = .64) and for the H subscale (ICC = .71). Moderate reliability was observed for the C subscale (ICC = .55) and R subscale (ICC = .48). With regard to the three SRRs, the imminent violence rating had excellent interrater reliability (ICC = .77), whereas reliability for both the case prioritization and serious physical harm ratings was somewhat lower (ICC = .51 and ICC = .57, respectively). Using the more conservative kappa standard, all three SRRs had fair to moderate agreement between raters (case prioritization = .26, serious physical harm = .29, and imminent violence = .41). ICCs at the item level ranged from .02 to .94 for presence ratings and −.66 to .79 for relevance ratings.
Distribution and Reliability of Version 3 Presence Ratings
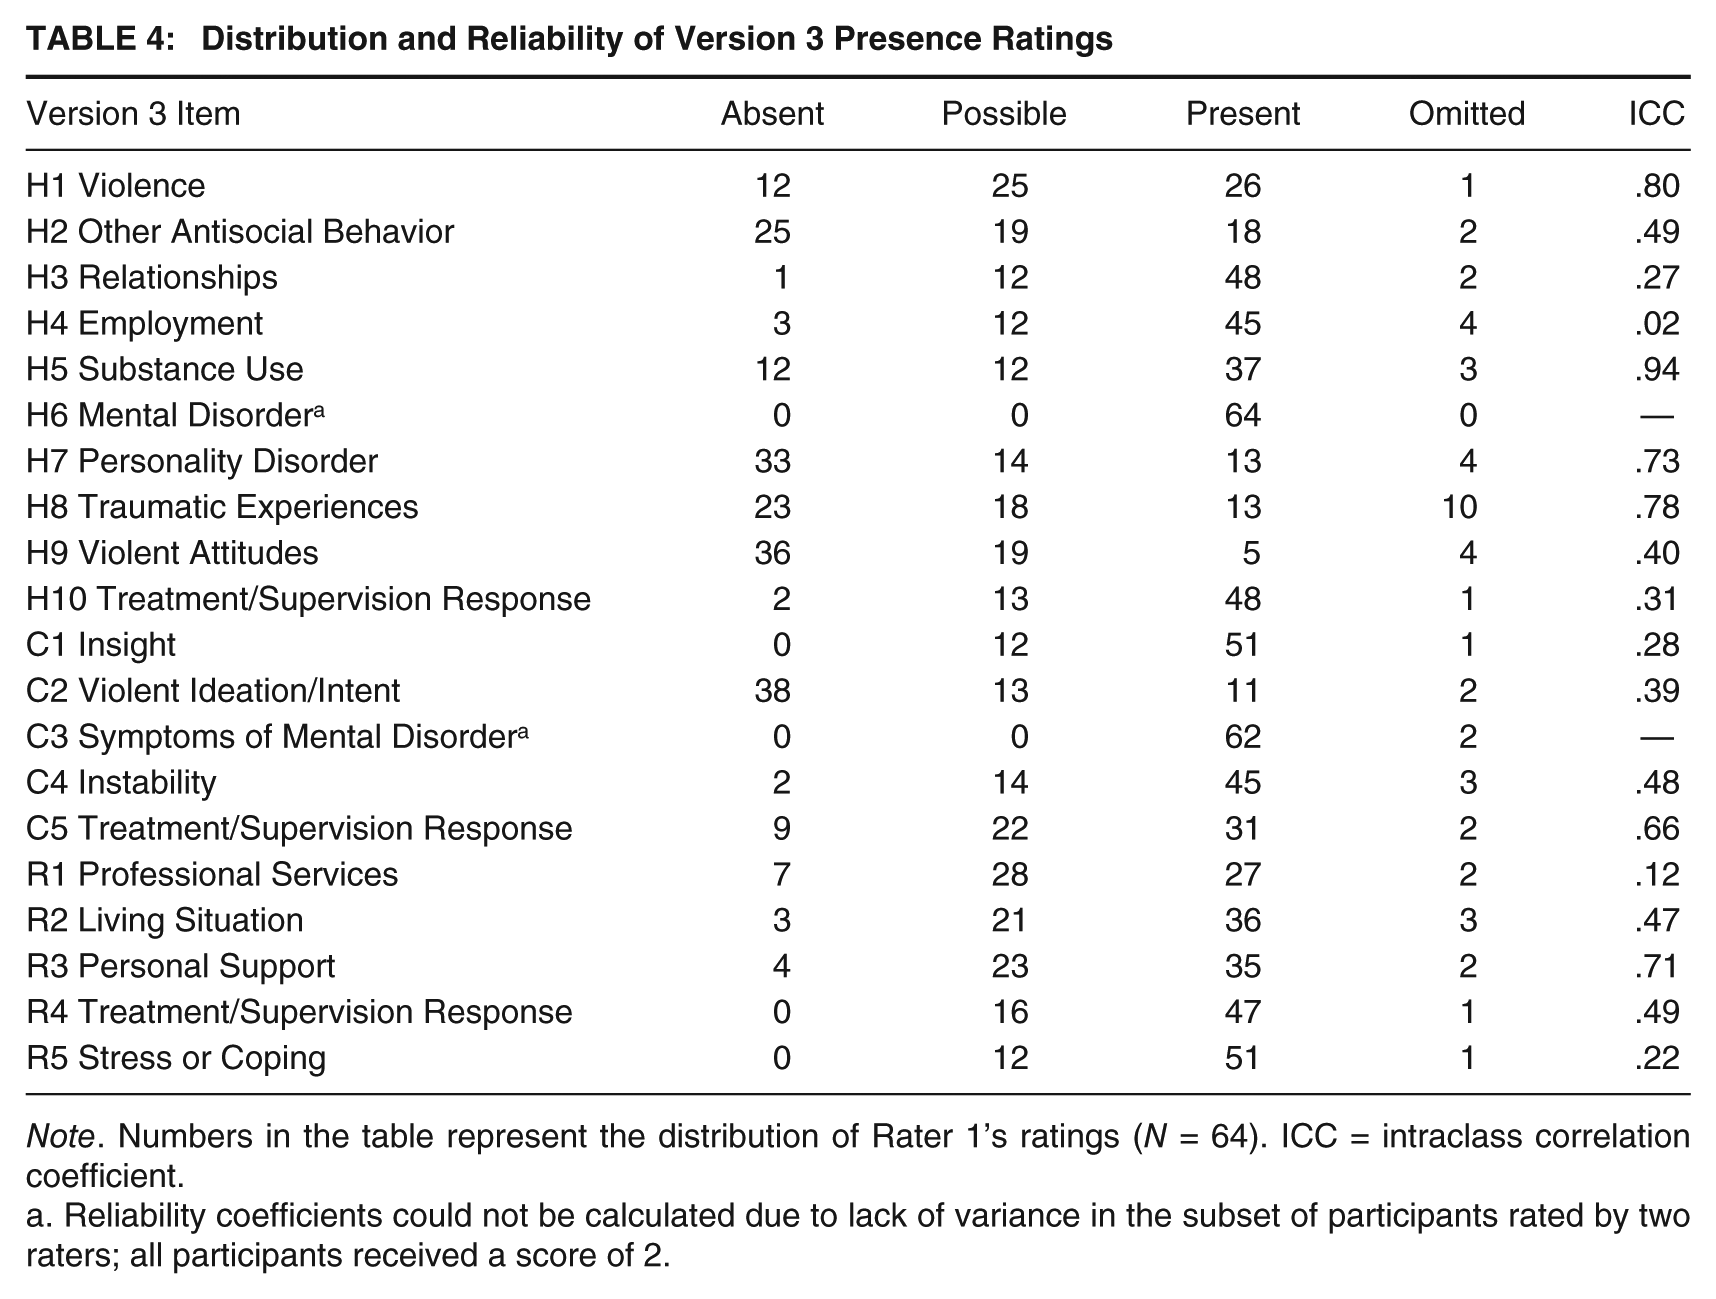
Note. Numbers in the table represent the distribution of Rater 1’s ratings (N = 64). ICC = intraclass correlation coefficient.
Reliability coefficients could not be calculated due to lack of variance in the subset of participants rated by two raters; all participants received a score of 2.
Distribution and Reliability of Version 3 Relevance Ratings
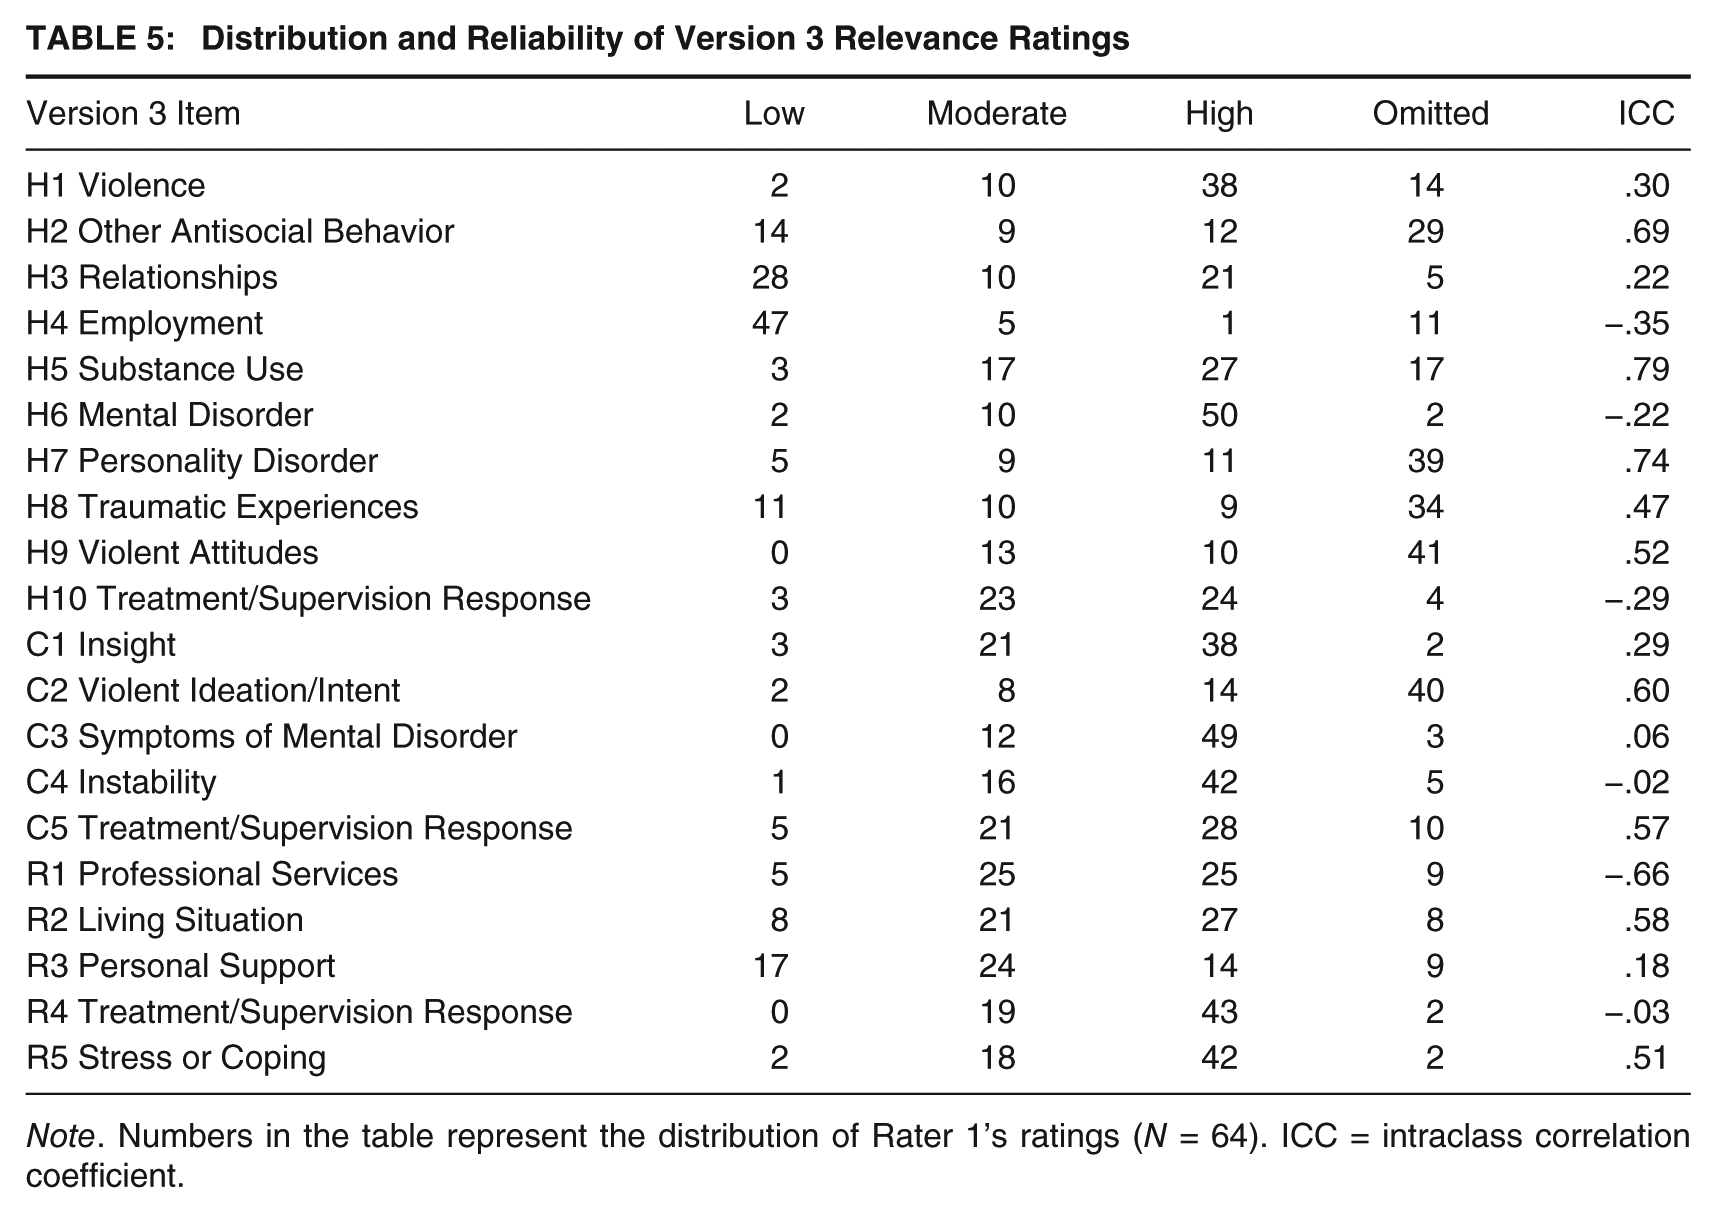
Note. Numbers in the table represent the distribution of Rater 1’s ratings (N = 64). ICC = intraclass correlation coefficient.
Associations between the HCR-20 Versions 2 and 3
In past research that has evaluated the association between Version 2 and Version 3, both versions were rated by the same rater (Douglas & Belfrage, 2014; Douglas et al., 2013; Strub et al., 2014). Because this study included 35 cases in which two independent raters rated both instruments, correlation coefficients were used to compare one rater’s Version 2 ratings to a second rater’s Version 3 ratings. Pearson correlation coefficients were employed because it was expected that mean differences would exist between the two scales. Using this method, the correlation between total scores on Version 2 and Version 3 was significant but moderate (r = .62, p < .001). The correlation between the H subscales on Versions 2 and 3 was also significant (r = .68, p < .001) but was somewhat lower for the C and R subscales (r = .48, p = .004 and r = .46, p = .005, respectively). Version 2’s final risk judgment was significantly correlated with all three SRRs on Version 3 including case prioritization (r = .40, p = .02), serious physical harm (r = .39, p = .02), and imminent violence (r = .58, p < .001).
Not surprisingly, associations between Version 2 and Version 3 were substantially stronger when ratings on both versions were made by the same rater. The correlation between total scores was significant and strong (r = .90, p < .001), as were correlations between the H (r = .84, p < .001), C (r = .80, p < .001), and R subscales (r = .85, p < .001). Version 2’s final risk judgment was also significantly correlated with that rater’s Version 3’s case prioritization (r = .67, p < .001), serious physical harm (r = .71, p < .001), and imminent violence ratings (r = .75, p < .001).
Analysis of HCR-20 Version 3 Items
Correlational analyses were used to estimate the associations between HCR-20 Version 3 presence and relevance ratings and the three SRRs. In addition, to explore how presence and relevance ratings may interact, these ratings were multiplied together to create an interaction term. Correlations between presence ratings and case prioritization ratings ranged from .53 (H1: Violence) to .14 (H5: Substance Use; see Table 6). Correlations between relevance ratings and case prioritization ratings ranged from .38 (H1: Violence) to .01 (H9: Violent Attitudes). Correlations between the Presence × Relevance interaction and case prioritization ratings ranged from .61 (H1: Violence) to .15 (R1: Professional Services). A similar pattern of correlations was observed between item presence, relevance, and interaction ratings and serious physical harm and imminent violence (see Tables 7 and 8).
Correlations With Case Prioritization Ratings
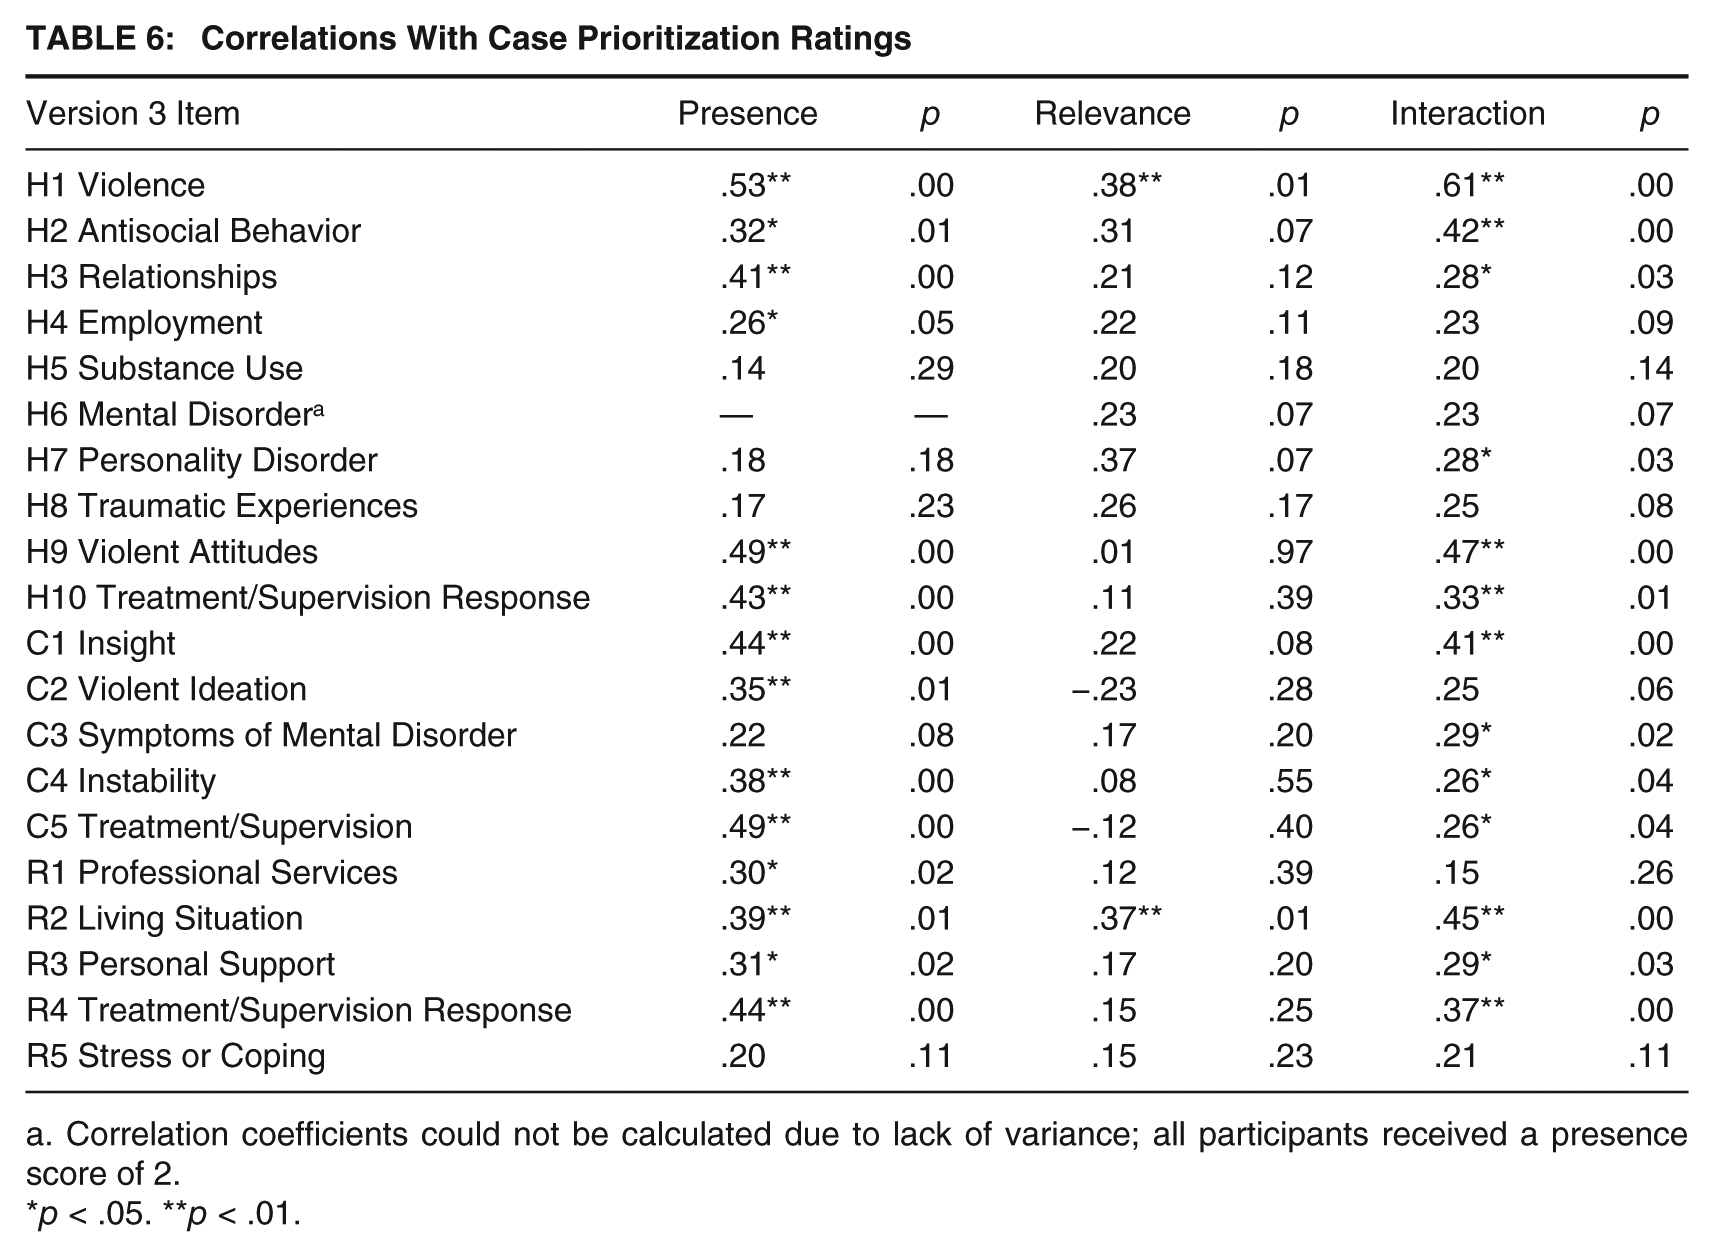
Correlation coefficients could not be calculated due to lack of variance; all participants received a presence score of 2.
p < .05. **p < .01.
Correlations With Serious Physical Harm Ratings
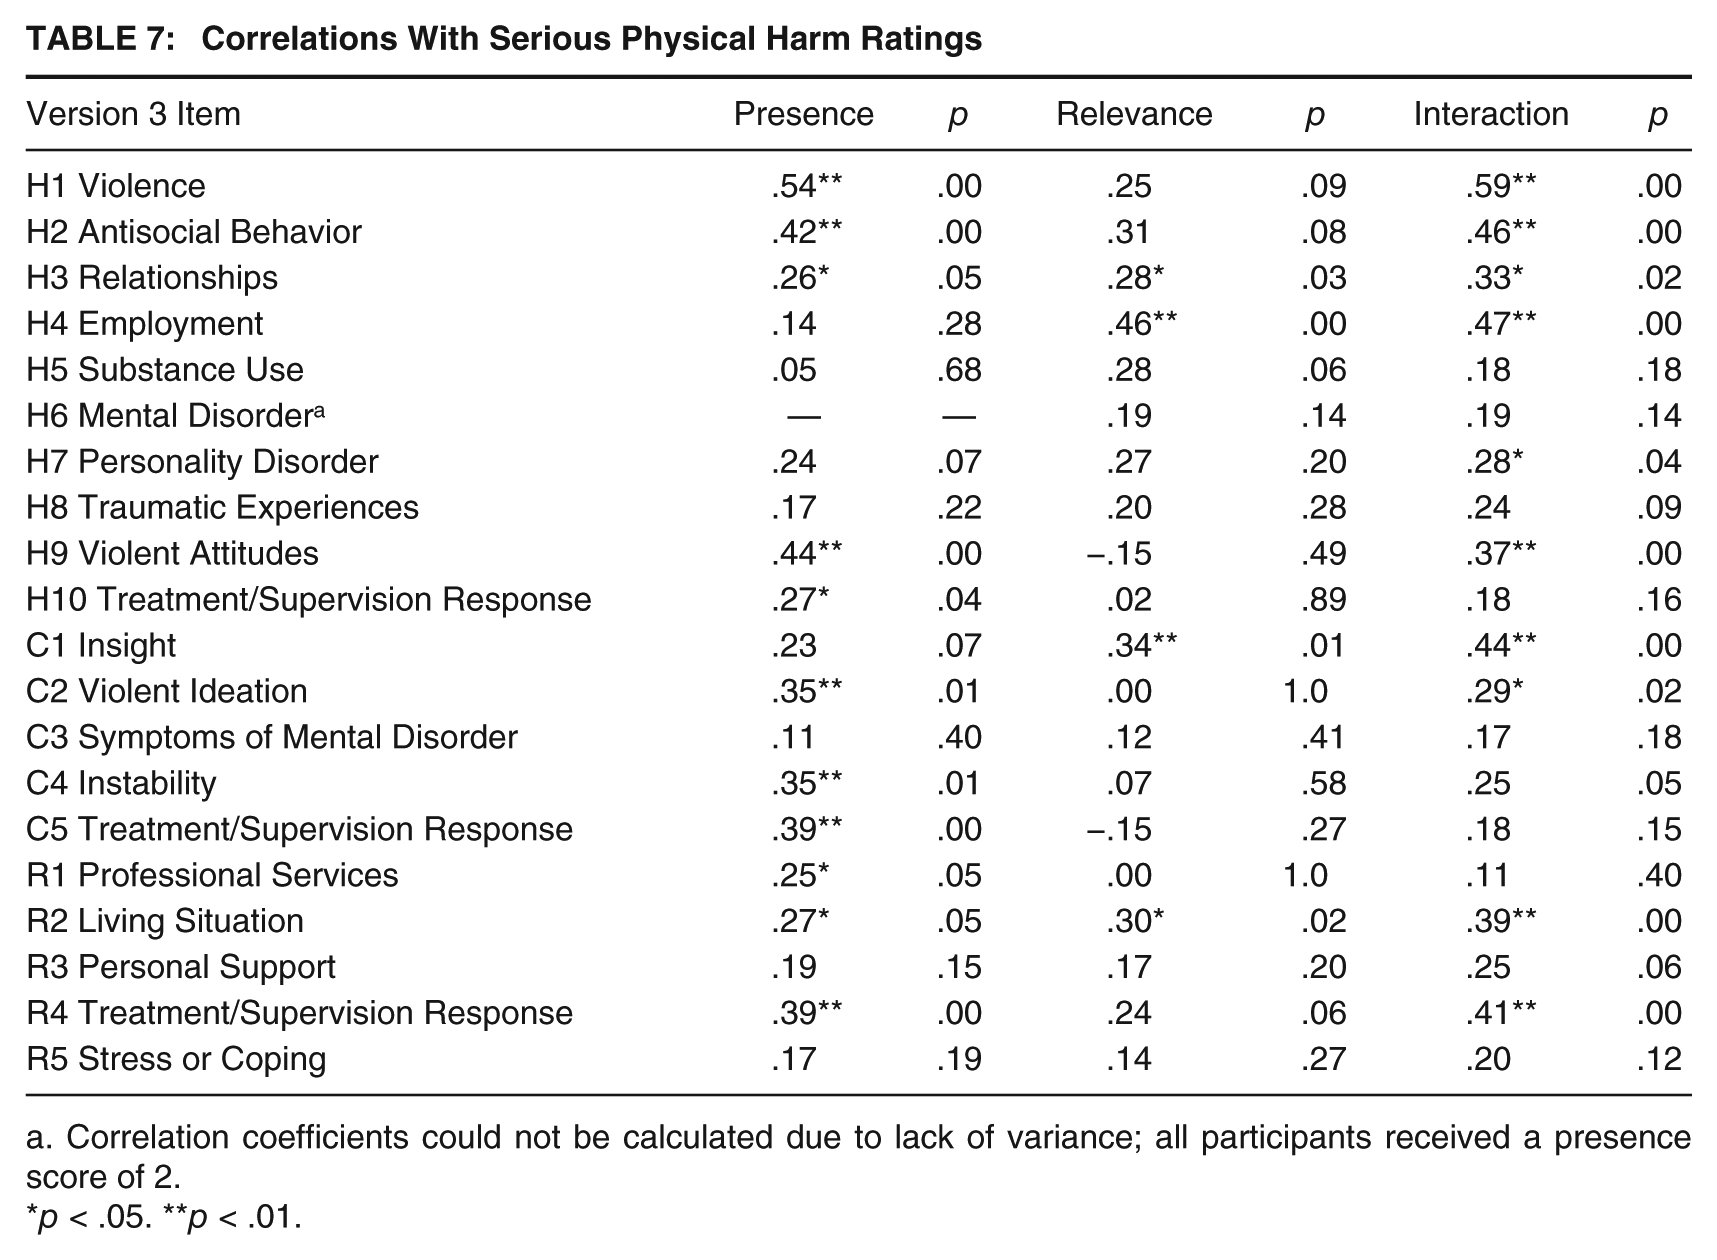
Correlation coefficients could not be calculated due to lack of variance; all participants received a presence score of 2.
p < .05. **p < .01.
Correlations With Imminent Violence Ratings

Correlation coefficients could not be calculated due to lack of variance; all participants received a presence score of 2.
p < .05. **p < .01.
Finally, to determine which aspects of the individual items (presence, relevance, and the Presence × Relevance interaction) were the strongest predictors of case prioritization ratings, a series of regression analyses were estimated in which the item presence rating was entered in the first block, that item’s relevance rating was entered in the second block, and the Presence × Relevance interaction term was entered in the third block. Results varied across the different Version 3 items (see Table 9). For example, for the R item Professional Services, the presence rating (β = 1.08, t = 4.33, p < .001), relevance rating (β = 1.01, t = 3.24, p = .002), and interaction term (β = −1.55, t = −3.59, p = .001) were all significant predictors of case prioritization, F(3, 51) = 6.61, p = .001, R2 = .28. In contrast, for the R item Treatment or Supervision Response, the addition of the interaction term (β = 1.35, t = 1.97, p = .05) resulted in the presence rating becoming no longer significant (β = −0.29, t = −0.75, p = .46) in the prediction of case prioritization, F(3, 58) = 6.22, p = .001, R2 = .24. Of the 20 individual Version 3 items, the Presence × Relevance interaction provided a unique contribution to only four models.
HCR-20 Version 3 Items Predicting Case Prioritization Ratings
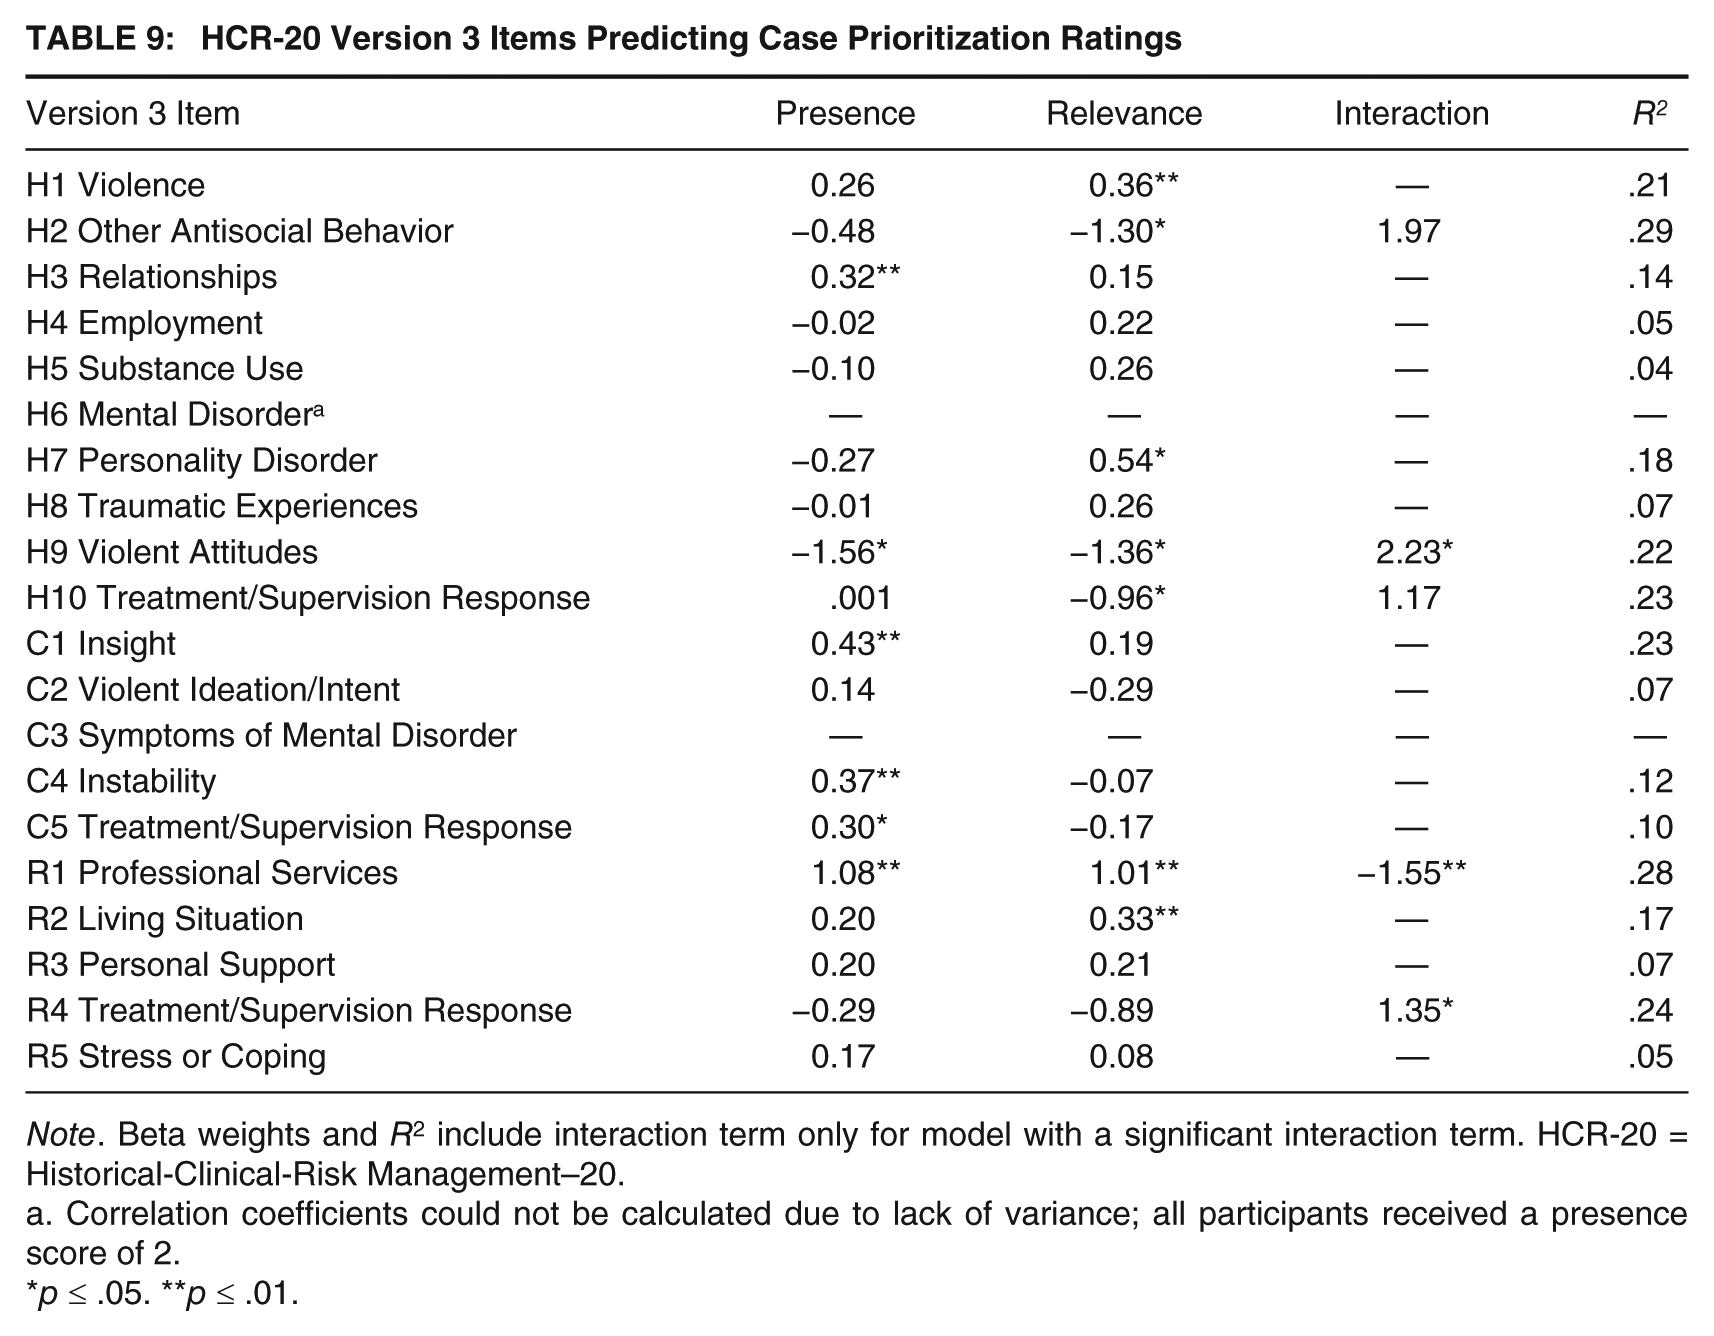
Note. Beta weights and R2 include interaction term only for model with a significant interaction term. HCR-20 = Historical-Clinical-Risk Management–20.
Correlation coefficients could not be calculated due to lack of variance; all participants received a presence score of 2.
p ≤ .05. **p ≤ .01.
Discussion
This study found considerable similarity between Version 3 of the HCR-20 and its predecessor, Version 2. Strong and significant correlations were found between scores on corresponding subscales, and between SRRs, indicating that changes made at the item level did not substantially impact summary scores and clinical judgments. For example, although three out of five items on the R scale were renamed and reconceptualized on Version 3, summary scores on the subscale remained comparable. In addition, the final risk judgment on Version 2 was significantly and highly correlated with all three SRRs on Version 3. As these findings are consistent with previous research (Douglas et al., 2013; Strub et al., 2014), it appears that one of the goals of the revision—continuity of concept—has been achieved. The two versions are closely related to one another, and the core aspects of the instrument have been preserved.
When independent raters were used to compare the two versions (i.e., one rater’s Version 2 ratings with a second rater’s Version 3 ratings), correlations between corresponding subscales and indices were considerably smaller. This finding is no doubt due to the impact of unreliability on the associations. Hence, the importance is of analyzing the comparability of Version 2 and Version 3 using two different approaches, each of which has advantages and disadvantages. The advantage of using the independent rater approach is that the association between the versions is not inflated because the error variance attributable to raters’ unreliability has not been removed. However, the disadvantage is that in studies such as this one, the associations between versions are likely confounded by the modest levels of interrater reliability. Thus, it is difficult to determine whether correlations between the two versions were limited by genuine differences between the versions or due to disagreement between raters. Without question, the analysis of comparability using independent raters provides a more conservative and arguably more ecologically valid estimate of scale equivalence. However, the same rater approach may offer a high degree of external validity because in practice, clinicians who were familiar with Version 2 will now be shifting their own ratings to complete Version 3, and this analysis provides an indication of what this shift might look like in an actual clinical context. Although the association between versions was likely inflated using this method because a rater’s ratings on Version 2 could possibly influence his or her ratings on Version 3, an analysis of ratings made by the same rater likely reflects the upper bound on the estimated association between the two versions. Neither approach is necessarily correct or incorrect, but the analysis of both same and separate raters is clearly a unique strength to this study and has not been previously reported in past studies comparing Versions 2 and 3.
Although interrater reliability was excellent for many subscales and SRRs, reliability for others was more modest. At the item level, reliability was even more variable, both for item presence and relevance ratings. In fact, the recently published validation studies of the HCR-20 Version 3 found somewhat higher levels of interrater reliability for the total score and the H, C, and R subscales, as well as for the SRRs (Douglas & Belfrage, 2014; Doyle et al., 2014; Kötter et al., 2014). The lower levels of interrater reliability observed in this study are likely due to a combination of factors including the reliance on chart review to code items, the variable length of time between ratings, and the use of graduate students as raters.
Consistent with past research, the SRRs had lower interrater reliability than the total score or the H, C, and R subscale scores. This is no doubt due to the restricted variance of the SRRs. However, this pattern of findings could also suggest that while there is strong agreement about the number of risk factors present, there is less agreement about how the item ratings inform SRRs. Of course, this analysis is further confounded by the highly variable interrater reliability found at the item level, which also suffers from the problem of restricted variance. Also worth mentioning is the finding that interrater reliability was stronger for the HCR-20 Version 3 presence ratings than for relevance ratings, perhaps reflecting the lesser familiarity with relevance ratings on the part of raters or the greater complexity in assessing relevance. Of note, past research has also found the interrater reliability of presence ratings to be highly variable across items, with ICCs ranging from .06 to .99 on Version 3 (Kötter et al., 2014) and from .01 to 1.00 on Version 2 (Belfrage, 1998; Douglas, Ogloff, & Hart, 2003).
This study also attempted to explore the ways in which the addition of relevance ratings might affect how clinicians make decisions about risk. This study analyzed the relationship of the relevance ratings to the SRRs in two ways: as a “main effect” and by calculating a Presence × Relevance interaction. Neither of these statistical approaches is necessarily correct, nor are they the only approaches to integrating relevance ratings, but both are worthy of further investigation. The relevance rating demonstrated fewer significant correlations with SRRs than presence ratings, but in several cases, correlations between the interaction terms and the SRRs were stronger than for presence ratings alone. These findings are consistent with those of Smith, Kelley, Rulseh, Sörman, and Edens (2014), who found that relevance ratings contributed unique variance to the prediction of SRRs beyond that accounted for by presence ratings alone. The multiplicative model used in this study represents a novel approach to investigating the relative contribution of presence and relevance ratings. Nevertheless, further investigation is needed to identify the optimal method for investigating the utility of relevance ratings in clinician decision making.
This study also examined the differences across the three Version 3 SRRs. Contrary to expectations, the Version 2 final risk judgment was more strongly associated with the imminent violence rating on Version 3 than with the case prioritization and serious physical harm ratings. In addition, imminent violence was also the SRR that was most reliably rated. Exploratory analyses identified several risk factors that had differential associations with the three SRRs, but other items had roughly comparable associations with all three SRRs. For example, Previous Violence and Insight were strongly and significantly correlated with all three SRRs, while Substance Abuse and Traumatic Experiences were not associated with any of the SRRs in this sample. However, Personal Support was significantly associated with case prioritization but not with ratings of serious physical harm or imminent violence. Clearly, these associations require further investigation before any conclusions can be drawn, but they highlight the potential for important distinctions among the three SRRs included on the new version of this instrument.
Limitations
There are, of course, several limitations to this study. First and foremost, there was no outcome variable that measured actual violence committed by the patients subsequent to the rating of these instruments. Therefore, this study cannot address the concurrent or predictive validity of the SRRs, nor of the association between presence and relevance ratings and actual violent behaviors. An additional limitation has to do with the nature of the sample. Participants were hospitalized in a public psychiatric facility that provides long-term care. Although this sample was likely representative of chronic psychiatric patients in most urban settings, there was little or no variability in some items (e.g., all patients suffered from a major mental disorder and had active symptoms of major mental disorder). The lack of variability prevented an analysis of how these items related to the three SRRs. The facility at which this study was conducted may also limit generalizability to other civil psychiatric settings, such as an acute care setting where patients suffer from a wider range of mental disorders and are hospitalized for both short-term and long-term periods. The small sample size (N = 64) is also a limitation to this study, particularly in the context of the interrater reliability analyses that included only a subset of the larger sample (n = 35). This small sample size may have led to unstable correlation coefficients (as evidenced by the negative ICC values for some variables, which indicate a high degree of unreliability), which in turn could raise concerns about the stability and replicability of the current findings.
There were also methodological limitations that may impact the validity and generalizability of the findings. Limited resources precluded standardization of the timing of HCR-20 ratings across individuals, as some were made early in the patient’s hospital stay and others were completed after discharge. This same limitation applied to interrater reliability ratings, as one rater may have completed the instruments while the patient was still in the hospital, while the second rater completed the instrument after discharge. As a result, when raters made the ratings further into the patient’s hospital stay or after the patient had been discharged, there was much more information available to rate the items. More information may have skewed the ratings in nonrandom ways (e.g., more information was typically available for items such as Problems with Professional Services or Living Situation), likely hindering interrater reliability.
As a result of the modest sample size, time elapsed between the patient’s admission and the time at which the ratings were made, or time between paired ratings, could not be accounted for in the analyses. In addition, the order in which the Version 2 and Version 3 ratings were completed was not counterbalanced within or across raters. Because Version 2 was always rated first, Version 3 ratings may have been unduly influenced by Version 2 ratings. Finally, the instruments were rated based on chart review and not clinical interviews with the patients themselves. A reliance on charts to rate the HCR-20 is likely to have the greatest adverse impact on presence and relevance ratings for Risk Management items as information about patients’ future plans is not always recorded in a systematic manner in the medical record, particularly during the first weeks of the hospitalization. These limitations all likely decreased interrater reliability but particularly for the Risk Management items.
These limitations notwithstanding, this study represents a useful step in the examination of Version 3 of the HCR-20 and supports the applicability of the extensive research base that has been developed on Version 2 of this instrument. Examining the psychometric properties of newly revised instruments is essential in expanding the literature on violence risk assessment and improving the process through which mental health professionals make decisions about patients’ risk for violence. By improving this decision-making process, violence committed by patients who present with mental health issues may be decreased. Continued research exploring the role of relevance factors, the differences among SRRs, and the ways in which study methodology might impact reliability and predictive validity will help continue this emerging literature.
Footnotes
Acknowledgements
The authors thank Michael Greenspan, MD, who participated in the initial development of this study; Matthew Grover, MD, who assisted in data collection; and Lily Bopp, for data entry assistance.