
Abstract
Procedural justice (PJ) theory suggests that if incarcerated people perceive their treatment to be fair and just, greater acceptance of staff authority, less misconduct, better mental health, and improved recidivism outcomes will follow. This study developed a measure of and explored PJ perceptions for people in English and Welsh prisons. Factor analysis was used to create a 27-item PJ measure, using data from around 20,000 people who completed the Measuring quality of prison life survey during a 4-year period. The measure had good internal consistency. We found differences in perceptions across groups of people and prison types. Poorer perceptions were weakly associated with self-harm and attempted suicide. There was a negative association between perceptions and misbehavior/incidents in custody, although PJ perceptions were not a significant predictor of incidents.
Introduction
Securing the compliance of people in custody is essential if prisons are to be stable, ordered, and peaceful environments. Keeping staff and people living in prison safe, protecting the well-being of those incarcerated, and helping them to desist from crime are legal requirements or priorities for most prison services. A growing body of research shows that for people living in prison, perceptions of fair treatment may influence these types of outcomes.
Procedural justice (PJ) theory argues that experiencing fair and just procedures leads people to view the law and authority figures as legitimate, and leads to greater compliance with, and commitment to obey the law (Lind & Tyler, 1988; Tyler, 1990), and vice versa. PJ involves four principles: voice, neutrality, respect, and trustworthiness (Tyler, 2008). People need to have the chance to tell their side of the story and to feel that authority figures will sincerely consider this before making a decision. They need to see authority figures as neutral and principled decision-makers, who apply rules consistently, and do not base their decisions on personal opinion or bias. They need to feel respected and treated courteously by authority figures, believe that their rights are considered equal to those of others, and that their issues will be taken seriously. Finally, people need to see authority figures as people with trustworthy motives, who are sincere and authentic, who listen and care, and who try to do what is right for everyone involved. Studies have indicated that perceptions of PJ influence perceptions of legitimacy, which in turn influences compliance, although legitimacy as a mediating variable has not been universally supported (Nagin & Telep, 2017).
A large body of research on PJ exists, particularly in court and policing settings, which has provided empirical support for the relationship between PJ perceptions and respect for and compliance with the law or legal authorities (e.g., Mazerolle et al., 2013; Sunshine & Tyler, 2003; Tyler, 2008). Applying PJ theory to the prison context, if people in prison perceive their treatment to be fair and just, adherence to rules, acceptance of staff authority, and less misconduct should follow. The findings from a more recent and growing body of quantitative research in prisons supports the conclusion that PJ influences such outcomes. Studies from England, Slovenia, North America, and the Netherlands have investigated, and consistently supported, a relationship between perceptions of unfair and unjust treatment and misconduct (including violence) in custody. This relationship has been demonstrated for self-reported and officially reported misconduct, and includes misconduct in the forms of violence, rule breaking, organized defiance, and institutional resistance (Butler & Maruna, 2009; Day et al., 2015; Reisig & Mesko, 2009). This relationship has also been found for specific processes. For example, when people’s grievances were dealt with in ways that might be perceived to be unjust (such as when responses were late, complaints were ignored, deemed irrelevant, or not requiring action), significantly higher rates of serious violence in U.S. prisons were found (Bierie, 2013). Although much of this work is cross-sectional, a recent longitudinal study (Beijersbergen, Dirkzwager, Eichelsheim, & Van der Lann, 2015) was able to test for a causal relationship between PJ and institutional adjustment and compliance. After accounting for previous misbehavior, people in prison who perceived their treatment to be procedurally just reported less rule breaking/misconduct 3 months later. They were also less often charged with violating prison rules. The explanation for this effect laid in the fact that procedural injustice created feelings of anger. People who felt they were treated unjustly were more likely to experience anger, and then were more likely to misbehave.
PJ perceptions have also been linked to mental health outcomes in custody. People in prison who feel treated unfairly and disrespectfully are more depressed, distressed, and anxious (e.g., Gover et al., 2000; Liebling et al., 2005). The Dutch Prison Project (Beijersbergen et al., 2014) demonstrated a causal relationship between PJ and mental health. When people in prison perceived their treatment by the prison to be procedurally just, they reported fewer mental health problems 3 months later. Furthermore, the benefits of PJ in prison appear to extend beyond the short-term. The Dutch research established a causal relationship between people’s perceptions of PJ and reoffending outcomes 18 months following release (Beijersbergen et al., 2016). A person who evaluated their treatment in prison as procedurally just (four out of five on their PJ scale) was 5.3 percentage points less likely to be reconvicted 18 months later than someone rating their perceptions as neutral (a score of three on the scale). To date, the most sophisticated and robust quantitative research into PJ in prisons comes from the Netherlands (conducted by Karin Beijersbergen and colleagues at The Dutch Prison Project), where prisons are more liberal than in most countries, and where prison sentences are shorter. However, the Dutch findings appear consistent with prisons in the United States and England, as well as being in line with research from other areas of the criminal justice system (CJS).
Summary and Implications for Her Majesty’s Prison and Probation Service (HMPPS)
Although not yet extensively researched in prisons, positive PJ perceptions have been found to be significantly related to, and predictive of, improved custodial behavior, mental health, and reoffending rates after release. These are three priority outcomes for most prison services. For HMPPS specifically, rates of violence, self-harm, and self-inflicted deaths have increased in prisons in recent years causing considerable concern (Ministry of Justice, 2019). Improving PJ offers a potential opportunity to positively impact a range of priority outcomes by ensuring that those living in prison feel treated in a fair and just way. Adherence to the four PJ principles can be affected in all interactions and by all authority figures, rather than requiring the introduction of specialist services or interventions, and as such should be reasonably economic.
Study Aims
This study aims to develop a valid and reliable measure of PJ perceptions for people living in prison, and use this to explore their perceptions in English and Welsh prisons. Although previous studies of PJ have developed their own measures, we aimed to determine if a measure of PJ could be created using variables in a large preexisting HMPPS data set. This would save resources and enable more timely conclusions to be drawn than if taking a formerly established PJ measure, which would need to be administered for a period with those residing in English and Welsh prisons, before data were available for analysis. Furthermore, the preexisting data set in question is routinely updated in its current form by HMPPS, and therefore a measure created from this would allow PJ scores to be repeatedly calculated by the organization in the future, without additional administrations of the measure and associated cost.
As previous research suggests that PJ matters more to compliance than distributive justice (perceptions of fair outcome distribution), the focus of this study is on the former. The majority of the research questions are informed by previous research-identifying variables associated with PJ (e.g., misconduct). In these cases, directional hypotheses will be tested to explore whether similar findings are identified within HMPPS. In other cases, we will explore the relationships between PJ and variables of interest to the organization. For example, differences in perceptions across parts of the prison estate and time are of interest to policy makers and practitioners in England and Wales. Furthermore, examining survey year allows for potential changes in perceptions that may be related to major changes HMPPS has undergone over recent years, particularly regarding staffing numbers. Finally, establishing potential predictors of PJ may offer useful insights into how an organization may develop perceptions of those in their care, either by identifying those people with the poorest perceptions to try to target, or identify situational variables that might be amenable to change.
The study aimed to answer the following research questions:
Does the PJ scale have good content validity, demonstrate acceptable construct validity (including concurrent validity), and have good internal consistency?
(a) Have PJ perceptions changed over time? (b) Do perceptions vary by prison type? (c) Have perceptions changed over time for people in particular prison types?
Are perceptions of PJ related to self-reported incidents? We hypothesize PJ perceptions will be negatively related to self-reported incidents of self-harm and attempted suicide.
Are perceptions of PJ related to officially recorded incidents? We hypothesize PJ perceptions will be negatively related to officially recorded incidents of assault, self-harm, disorder, and self-inflicted death in prisons. We also ask whether the relationship between PJ perceptions and incidents differs according to prison type?
Are PJ perceptions related to the time someone has served in custody? We hypothesize that PJ perceptions will be negatively related to the length of time served on their current sentence, the length of time they have served in their current prison, and the number of prison sentences they have served.
What factors predict perceptions of PJ?
Method
Sample
The main data set comprised questionnaire data gathered via Measuring quality of prison life surveys (MQPL; Liebling & Arnold, 2002; Liebling, Crewe, & Hulley, 2011) conducted between January, 2012 and December, 2015. In total, this included 21,353 surveys of people in prison from 190 survey administration occasions at 127 different prisons (the remaining 63 survey occasions were repeat visits to prisons during the 4-year period). The majority of the sample (91.12%) was male. Most participants were living in the adult prison estate, with only 9.14% located in young offender institutions (YOIs) or prisons with dual designation for adults and young people. The average participant age was 35.09 years when they completed the MQPL (range of 18–89 years). The majority of participants were White (71.32%); the next largest group were Black (10.57%). Of the 190 survey administration occasions, 71 (37.35%) were administered at male training prisons (holding sentenced people of Category B or C status), 55 (28.95%) at male local prisons (Category B prisons serving the courts) and 18 (10.53%) at male open prisons. There were 17 male YOIs, 17 women’s prisons (open and closed), nine male dispersal (Category A prisons), and three male dual-designated prisons (holding both adults and young adults). There was a reasonably even spread of survey administrations across the 4 years: approximately 20% for both 2012 and 2015, and approximately 30% for both 2013 and 2014.
Measures
MQPL
People aged 18 or older in English and Welsh prisons have been routinely surveyed since December 2002. The MQPL was designed and constructed by the Prisons Research Centre (PRC) to measure relatively stable latent constructs that cannot otherwise be observed, for example, respect, fairness, bureaucratic legitimacy, and personal autonomy (Liebling & Arnold, 2002). Approximately every 30 months prisons complete a survey; on each administration occasion at each individual prison, around 120 people imprisoned at the site are selected using stratified systematic sampling to anonymously complete the paper-based questionnaire. It comprises 128 questions about the quality of prison life, answered on a 5-point Likert-type scale (1 = strongly agree, 5 = strongly disagree), one question rating overall quality of life (on a 10-point scale) and two to elicit positive and negative aspects of life in prison. The PRC derived the statements from appreciative inquiry (an approach which encourages people to reflect explicitly on positive experiences (Cooperrider, 1990; Matza, 1969) with people in prison, most of whom were men in Category B prisons. One hundred and twenty-two of these items form a standard set of 21 dimensions (leaving six “standalone” statements). The validation of the MQPL has been a cumulative process based on research projects conducted over several years (Liebling, Crewe, & Hulley, 2011). Although it has not yet been subject to confirmatory factor analysis, the tool was largely conceptually validated using principal components analysis. The current study used a number of the 41 background or demographic questions included in the questionnaire (such as age, time served, ethnicity, and self-harming experience).
HMPPS Hub Data
HMPPS has used the Hub since 2008 for collecting and reporting prison and probation data. The metrics used included: officially recorded incidents of self-harm, self-inflicted deaths, assaults on staff or people living in prison, and disorder (barricades, concerted indiscipline, hostage taking, and incidents at height) in each prison. 1 These outcomes were identified based on prior research already described, indicating a relationship between PJ, misconduct, and psychological health. Hub data were also used to examine or control for (some) features we thought may be related to or influence our outcome variables. This included the number of hours worked in industry (used as a measure of purposeful activity), and the number of people on different levels of the Incentives and Earned Privileges (IEP) scheme (used as a measure of deprivation). The IEP scheme was the system (replaced in January 2020) through which people in prison could earn additional privileges by demonstrating a commitment toward their rehabilitation, engaging in purposeful activity, reducing their risk of reoffending, behaving well, and helping others. The higher the level the person is on, the greater the privileges received. Poor behavior can lead to a person moving to a lower level, and losing privileges as a result. Using 6 months’ worth of data prior to the MQPL administration date, monthly rates per 100 people in that prison for each metric were calculated. Staff-incarcerated people ratios were calculated using official population figures from the same 6-month time-frames. The staff official figures represented full-time equivalent staff numbers.
Analysis
Item Selection and Content Validity
To establish content validity (i.e., that the selected items were representative of the PJ principles), the MQPL items (without dimension information) were scrutinized independently by five researchers who were familiar with PJ theory and research. Each separately compiled a list of items believed to be related to the four principles. The items on which three or more researchers agreed were collated and retained (19 items), and the remaining items were recirculated for further scrutiny and discussion. Further items which three or more researchers then agreed on were subsequently added, creating a provisional measure of 29 items. The PJ scale was subjected to validity and reliability testing, as described below.
Construct Validity and Internal Consistency
Factor analyses tested the construct validity of the measure, on first the male, and then the female data sets. Exploratory factor analysis (EFA) was conducted on the 29 items to explore the underlying theoretical structure or dimensions of the construct, and to identify items that do not contribute well as they are not good representations. As there is some conceptual overlap between the four principles of PJ (and so the extracted factors were expected to be correlated), oblique, rather than orthogonal, rotation was used. Inspection of the scree plot, and examination of Eigenvalues (>1), factor loadings and the Velicer MAP test determined factor extraction (Costello & Osborne, 2005). Cronbach’s alpha was computed for the PJ measure, and the factors identified from the factor analysis, to assess internal consistency.
PJ Score Calculation
We calculated mean person-level PJ scores from the individual items supported by the factor analysis, creating a score between 1 and 5. Positively worded items were reverse-scored (so higher scores represented more positive perceptions) before mean scores for each participant were calculated. The analysis excluded participants with more than 10% of items missing; where up to 10% of items were missing, we replaced missing scores with the mean of the available item scores (Rosenthal, 2017). Although there are limitations with this method, it was only used for small amounts of missing data. Average prison-level PJ scores were calculated for each prison administration, using the scores for all people surveyed at that location on that occasion.
Exploration of PJ Scores and Concurrent Validity
Analysis of variance (ANOVA), analysis of covariance (ANCOVA), and multiple linear regression tested differences in scores by prison type and survey year, and identified variables predicting scores. Independent samples t tests, area under the curve (AUC) statistics where appropriate, ANOVA, correlation, and multiple linear regression analyses examined the relationships between PJ and theoretically expected correlates (self-harm, attempted suicide, self-inflicted deaths, assaults, disorder, time served, and the number of prison sentenced served). For some analyses, where possible, we also stratified by gender.
Person-level analyses were conducted when both a PJ score and the other measures were available for individuals. Prison-level analyses were conducted when variables were only measured at this level using a prison-level PJ score. The types of analyses conducted depended on the nature of the data (categorical or continuous). The vast majority of variables were categorical due to the way MQPL items are worded; only the prison-level data were continuous in nature. Interpretation of effect sizes (r, partial eta squared [
Results
Internal Consistency and Factorial Validity
The factor analysis was an iterative process. On the male sample (n = 16,378), EFA using maximum likelihood extraction and oblique (direct oblimin) rotation was performed on the 29 items. This produced a three-factor solution. After removing two items with low loadings (Question 88: “staff in this prison turn a blind eye when prisoners break the rules,” and Question 96: “in this prison, it is clear to me what I need to do in order to progress/prepare for court”), examining the scree plot and conducting a Velicer MAP test, a single-factor solution emerged as the most appropriate fit, and all item loadings were at least .30. Table 1 shows the factor loadings, means, standard deviations, and corrected item total correlations. The solution explained 46.80% of the variance. The internal consistency of the scale (α = .96) was excellent (Cohen & Swerdlik, 2010). Readers should be aware that with increasingly large sample sizes, alpha estimates of internal consistency might be more likely to be positive. EFA was then performed on the data set of women (n = 1,623), specifying a single factor solution. This model fitted as well for women as it had men, and explained 48.42% of the variance (see Table 1 for factor loadings, means, standard deviations, and corrected item total correlations). The internal consistency was excellent (α = .96).
Final Factor Matrix Loadings, Means, SD, and Corrected Item Total Correlations for Male and Female Samples

Note. rq = reverse-scored items; q = items not requiring reverse scoring.
We computed average scores for each participant based on the 27-item scale generated via the analyses. The “PJ score” ranged from 1 to 5, as this was the response format of the MQPL items used to create the scale. Neutral, undecided, or equally split perceptions were represented by a score of 3, higher scores indicated more positive perceptions, and lower scores indicated poorer perceptions.
Descriptive Statistics
PJ scores could be calculated for 95.32% of the sample, and their descriptive statistics are presented in Table 2.
Sample Descriptive Statistics
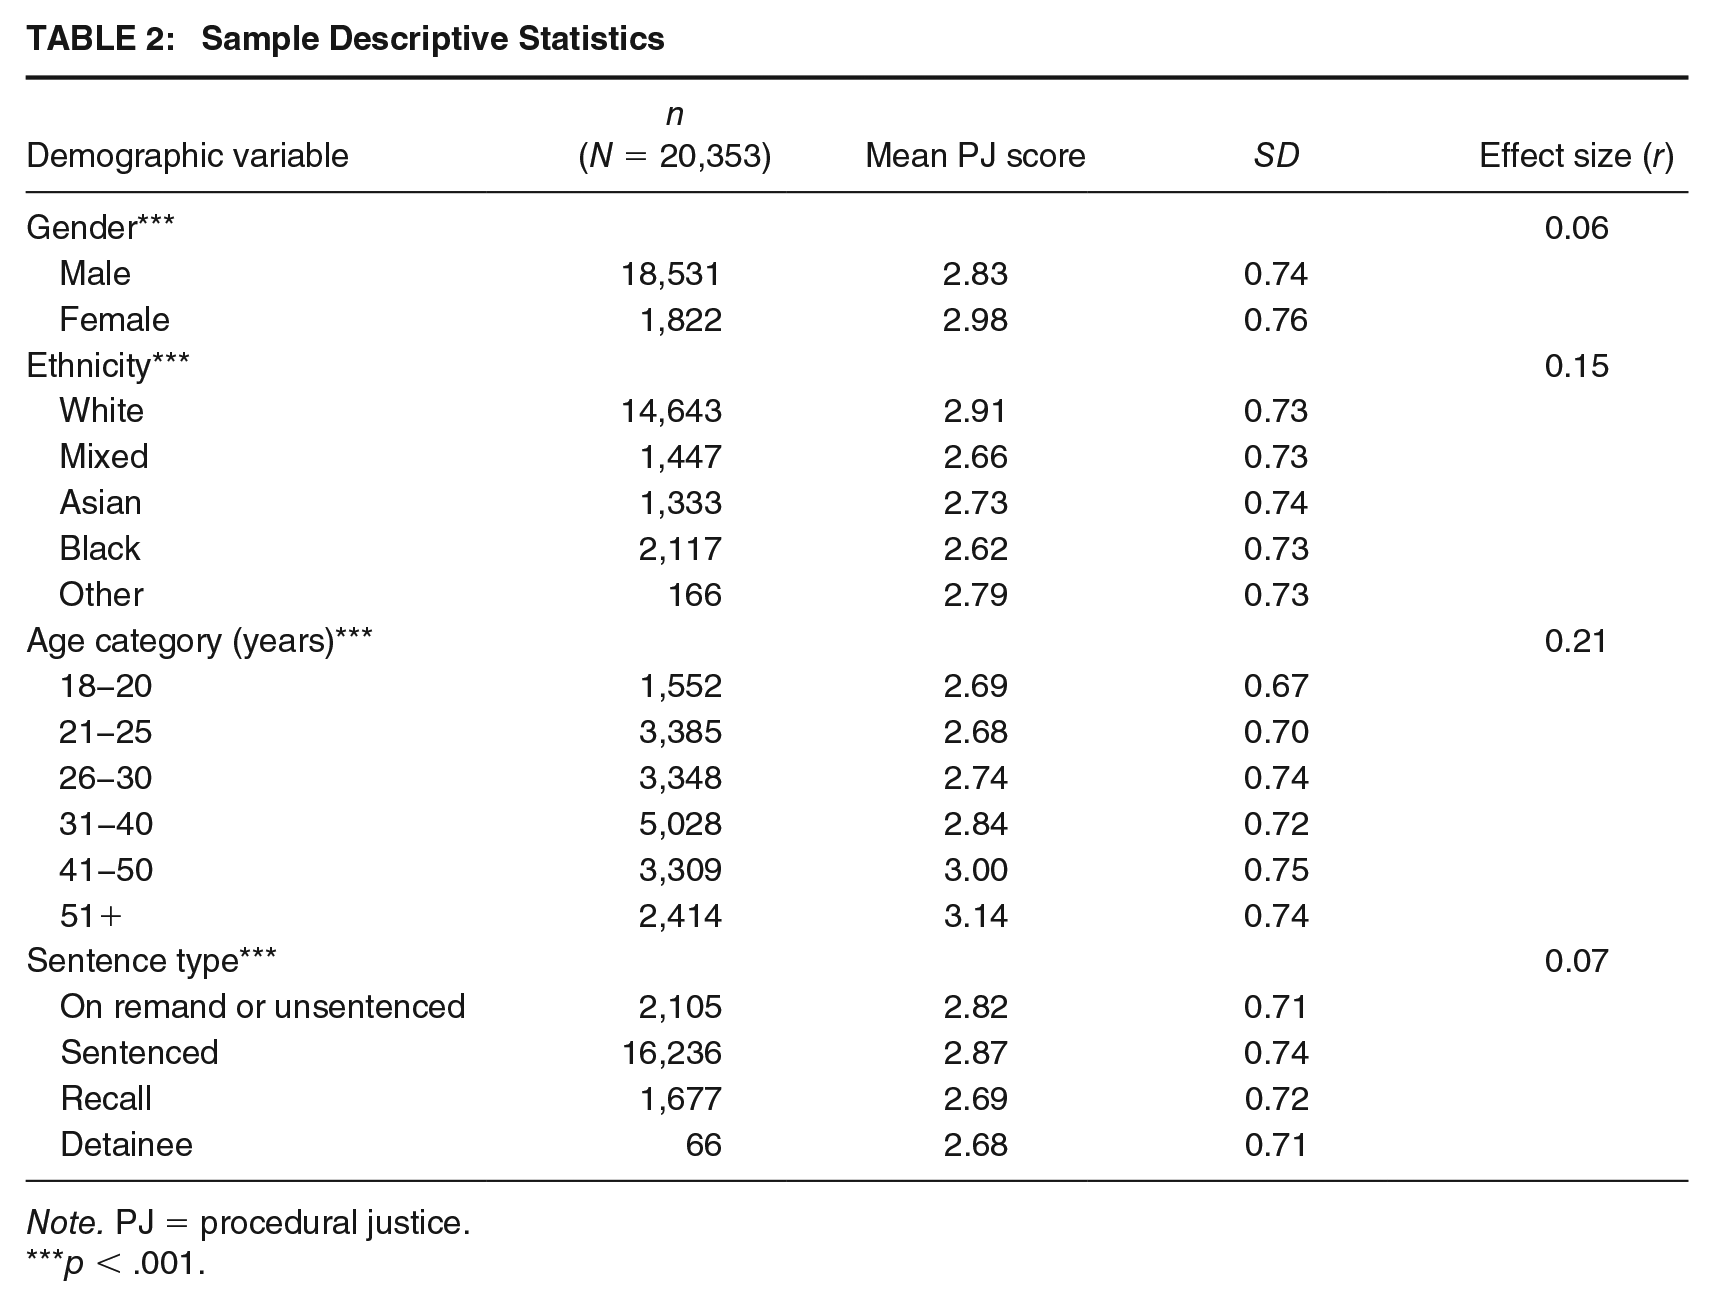
Note. PJ = procedural justice.
p < .001.
The mean PJ score for the whole sample, on a 5-point scale, was lower (more negative) than neutral, although the standard deviation indicated variability in scores. Women had significantly more positive perceptions than men, t(20,351) = −8.08, p < .001, r = .06, 95% confidence interval (CI) = [0.05, 0.07], although the size of the effect was very small. Perceptions varied significantly by ethnic group, but scores for all groups were below neutral and the effect size was also small, F(4, 19,701) = 58.49, p < .001, r = .15, 95% CI = [0.14, 0.16]. White participants had the highest scores, and Black participants the lowest. Scores for White participants were significantly higher than for Black, Asian, or Mixed heritage participants (Bonferroni p < .001 for all comparisons). Significant differences according to age group, with a small effect size, were also observed, Welch’s F(5, 7,435.40) = 170.31, p < .001, r = .21, 95% CI = [0.19, 0.23]. Bonferroni post hoc tests demonstrated that the youngest two age groups had the lowest (and statistically similar) scores. After those two groups, with increasing age group, justice scores increased significantly with each rise (p < .001 for all rises). The 51+ age group had significantly higher scores than all other groups (p < .001 for all group comparisons). The vast majority of participants had been sentenced (80.84%). Significant differences were observed according to conviction status, Welch’s F(3, 309.65) = 31.90, p < .001, r = .07, 95% CI = [0.05, 0.08]; again, the size of this effect was small. People who had been recalled to prison had significantly poorer perceptions than sentenced and unsentenced/on remand groups (p < .001), who had statistically similar scores to each other. Less than 1% of the sample were detainees, making meaningful comparisons between them and other groups problematic.
Concurrent Associations With Time and Prison Type
Person-Level Data
A two-way ANOVA revealed significant main effects of year, F(3, 20,329) = 4.13, p = .006,
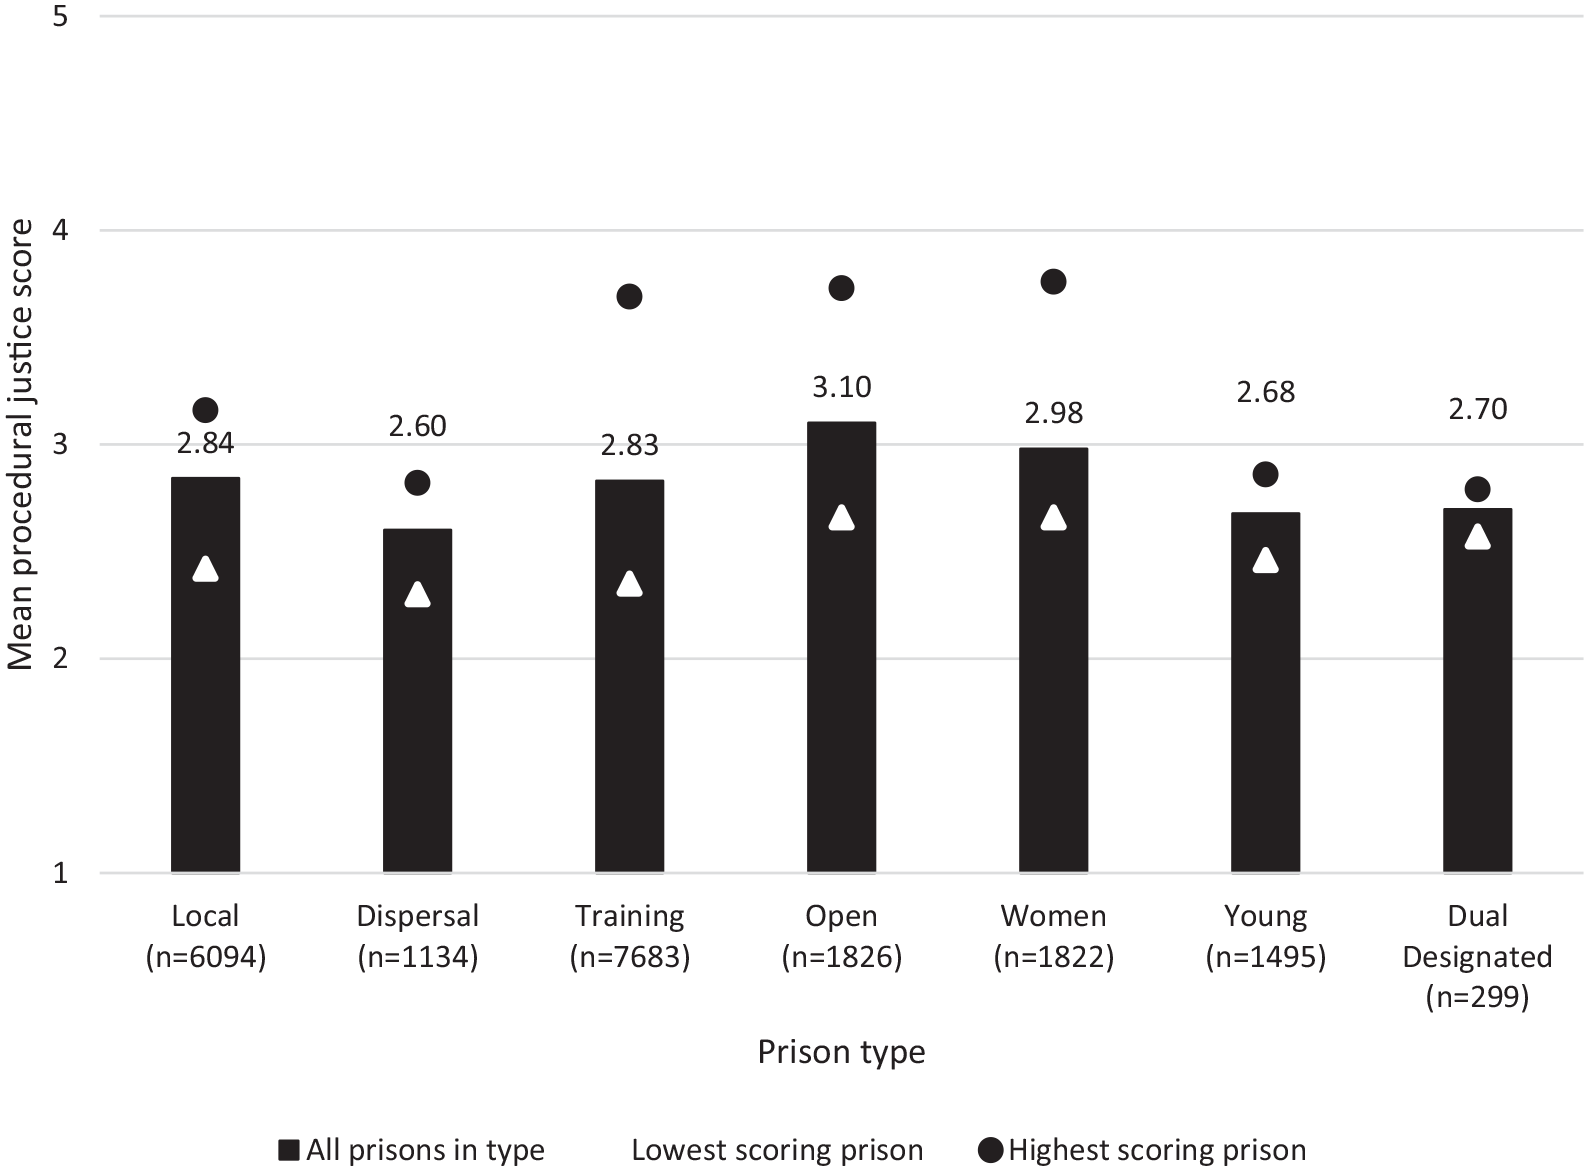
PJ Scores by Prison Type, and Highest and Lowest Scoring Prisons
Overall, perceptions fluctuated across time, increasing from 2012 to 2013, decreasing in 2014 and then increasing in 2015. Bonferroni post hoc tests revealed perceptions to be significantly better in 2013 (M = 2.90, SD = 0.73) than in all other years (p < .001 for comparisons with 2012 and 2014, and p = .005 for 2015). Perceptions in 2012 and 2014 were comparable with each other (p = 1.00); scores in both of these years were significantly poorer than in 2013 and in 2015 (p < .001 and p = .02, respectively). A significant interaction between year and type, F(14, 20,329) = 9.44, p < .001,
The patterns appear to show, for example, that in the 3 surveyed years, people in open prisons had more positive perceptions of PJ, and their scores appear relatively stable across time. This appears to be different from the pattern observed in women’s prisons, where scores tend to be lower than in the open estate and vary more noticeably across the years. Although people in prison overall had highest scores in 2013, here we can see that for a number of prison types this was not the case; people in training prisons, for example, had their “best year” in 2012. Homogeneity of variance could not be assumed, meaning these findings should be treated as indicative only.
Prison-Level Data
The ratio of staff-to-incarcerated people varies between prisons and prison types; at the time of the analysis, the dispersal estate has the highest average ratio (1.13, so a little over one staff member to each incarcerated person), and the open estate the lowest (an average of 0.38, so around three incarcerated people to each staff member). A two-way ANCOVA, using 159 survey administrations (involving nine dispersal prisons, 13 women’s, young persons, and open prisons), found ratio to be a significant covariate, showing a medium-sized relationship with peoples’ perceptions of justice, F(1, 136) = 21.15, p < .001,
Concurrent Associations With Harm to Self and Others
Person-Level Data
Table 3 provides the descriptive statistics for two measures of self-reported self-harm and two measures of attempted suicide (introduced into the MQPL at different times during the 4 years of study), for around 7,000 people, stratified by gender. Individuals who had self-harmed had significantly lower PJ scores (M = 2.73, SD = 0.79) than those who had not (M = 2 .86, SD = 0.75), t(6,970) = 4.01, p < .001, r = .05, 95% CI = [0.03, 0.07]. The analyses, stratified by gender, found this to be true for both men, t(6,548) = 3.64, p < .001, r = .04, 95% CI = [0.02, 0.06], and women, t(420) = 2.53, p = .012, r = .12, 95% CI = [0.02, 0.21]. Individuals reporting attempted suicide also had significantly lower PJ scores than those who did not for the overall sample, t(357.39) = 3.59, p < .001, r = .19, 95% CI = [0.17, 0.21]. When stratified by gender, this finding was also the case for men, t(310.55) = 3.58, p < .001, r = .19, 95% CI = [0.17, 0.21] (equal variances not assumed). For women the difference was not significant, however, t(413) = 1.44, p = .15, r = .07, 95% CI = [−0.03, 0.17]. The effect sizes for all analyses were very small. In addition, calculation of AUC statistics (.52 and .56 for self-harm and .5.1 and .55 for attempted suicide, for men and women, respectively) suggested that these significant differences may be due to the large sample size rather than true group differences.
Number, Mean, and Standard Deviations for Self-Reported Self-Harm and Attempted Suicide Stratified by Gender

Note. PJ = procedural justice.
p < .05.**p < .01. ***p < .001.
More nuanced analysis of four response options (never harmed themselves, harmed before coming to their current prison, harmed only since arriving there, and harmed before and since arriving) showed justice perceptions differed significantly for men on self-harm, F(3, 6,549) = 5.80, p = .001, r = .04, 95% CI = [0.02, 0.06], and attempted suicide, Welch’s F(3, 334.94) = 5.38, p = .001, r = .05, 95% CI = [0.03, 0.07]), and for women for self-harm, F(3, 421) = 4.28, p = .005, r = .15, 95% CI = [0.06, 0.24], but not attempted suicide, Welch’s F(3, 46.42) = 1.30, p = .29, r = .09, 95% CI = [−0.01, 0.18]. However, again the effect sizes were very small.
People who had only ever behaved in these ways since arriving at their current prison had the lowest justice scores for both men and women. Post hoc tests (Bonferroni) for the analysis with men revealed that this group’s scores were significantly lower than people who had never self-harmed and those who had previously self-harmed but not since coming to their current location (p = .001 for self-harm comparisons, and p = .01 and p = .002 for attempted suicide comparisons). Their scores did not differ significantly from those reporting previous and recent harm to self though (p = .32 for self-harm, and p = 1.00 for attempted suicide). There were no significant differences in post hoc tests between groups for the women and attempted suicide, but for self-harm, women who had harmed themselves in their current prison had significantly poorer perceptions than those who had never harmed themselves (p = .004).
Prison-Level Data
Table 4 shows the correlations between PJ scores and officially recorded incidents (per 100 people in a month). Due to the thankfully low base rates of self-inflicted deaths, and due to only a quarter of prisons having available self-harm data, the findings for these types of incidents are unlikely to be meaningful or interpretable. A significant but small negative relationship between PJ and violence and disorder was found, however. Further analysis revealed that this was the case only for training and women’s prisons (small-to-medium sized effects). Sample sizes for the different prison types varied; 51 local, nine dispersal, 63 training, 16 open, 14 women’s, 13 YOIs, and three dual designated. The nonsignificant findings for the less prevalent prison types should be interpreted with some caution.
Correlations Between Officially Recorded Incidents and PJ Scores
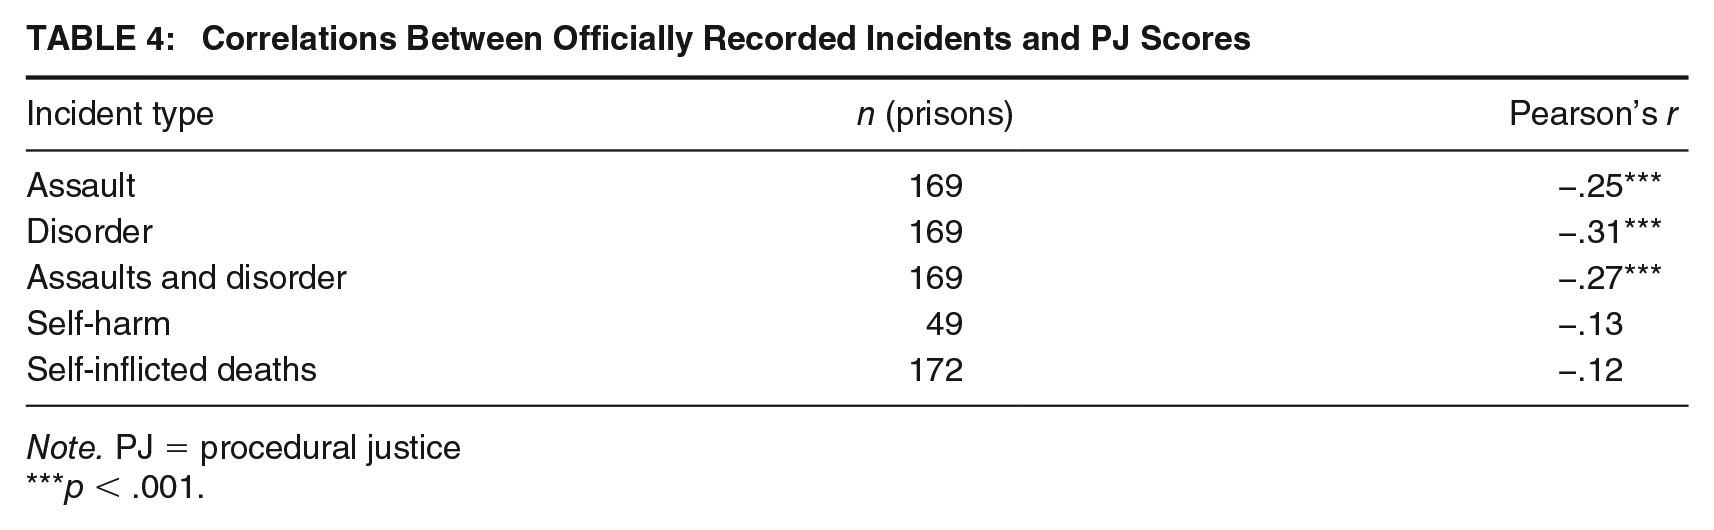
Note. PJ = procedural justice
p < .001.
Multiple regressions examined which factors predicted assaults and disorder incidents from 70 prisons that had available data. The predictor variables included are shown in Table 5. The models were significant for assaults, F(8, 61) = 12.64, p < .001, R2 = .62, adjusted R2 = .57, and disorder, F(8, 61) = 3.92, p = .001, R2 = .34, adjusted R2 = .25, explaining 62% of the variance of assaults, and 34% of the variance of disorder incidents. The 10% difference between the R2 and adjusted R2 values in the disorder model suggests it may not generalize well. Age was a significant predictor in both models. The average PJ score for each prison was not a significant predictor of either type of incident.
Predictors of Assault and Disorder Incidents (Monthly Mean per 100 Imprisoned People)
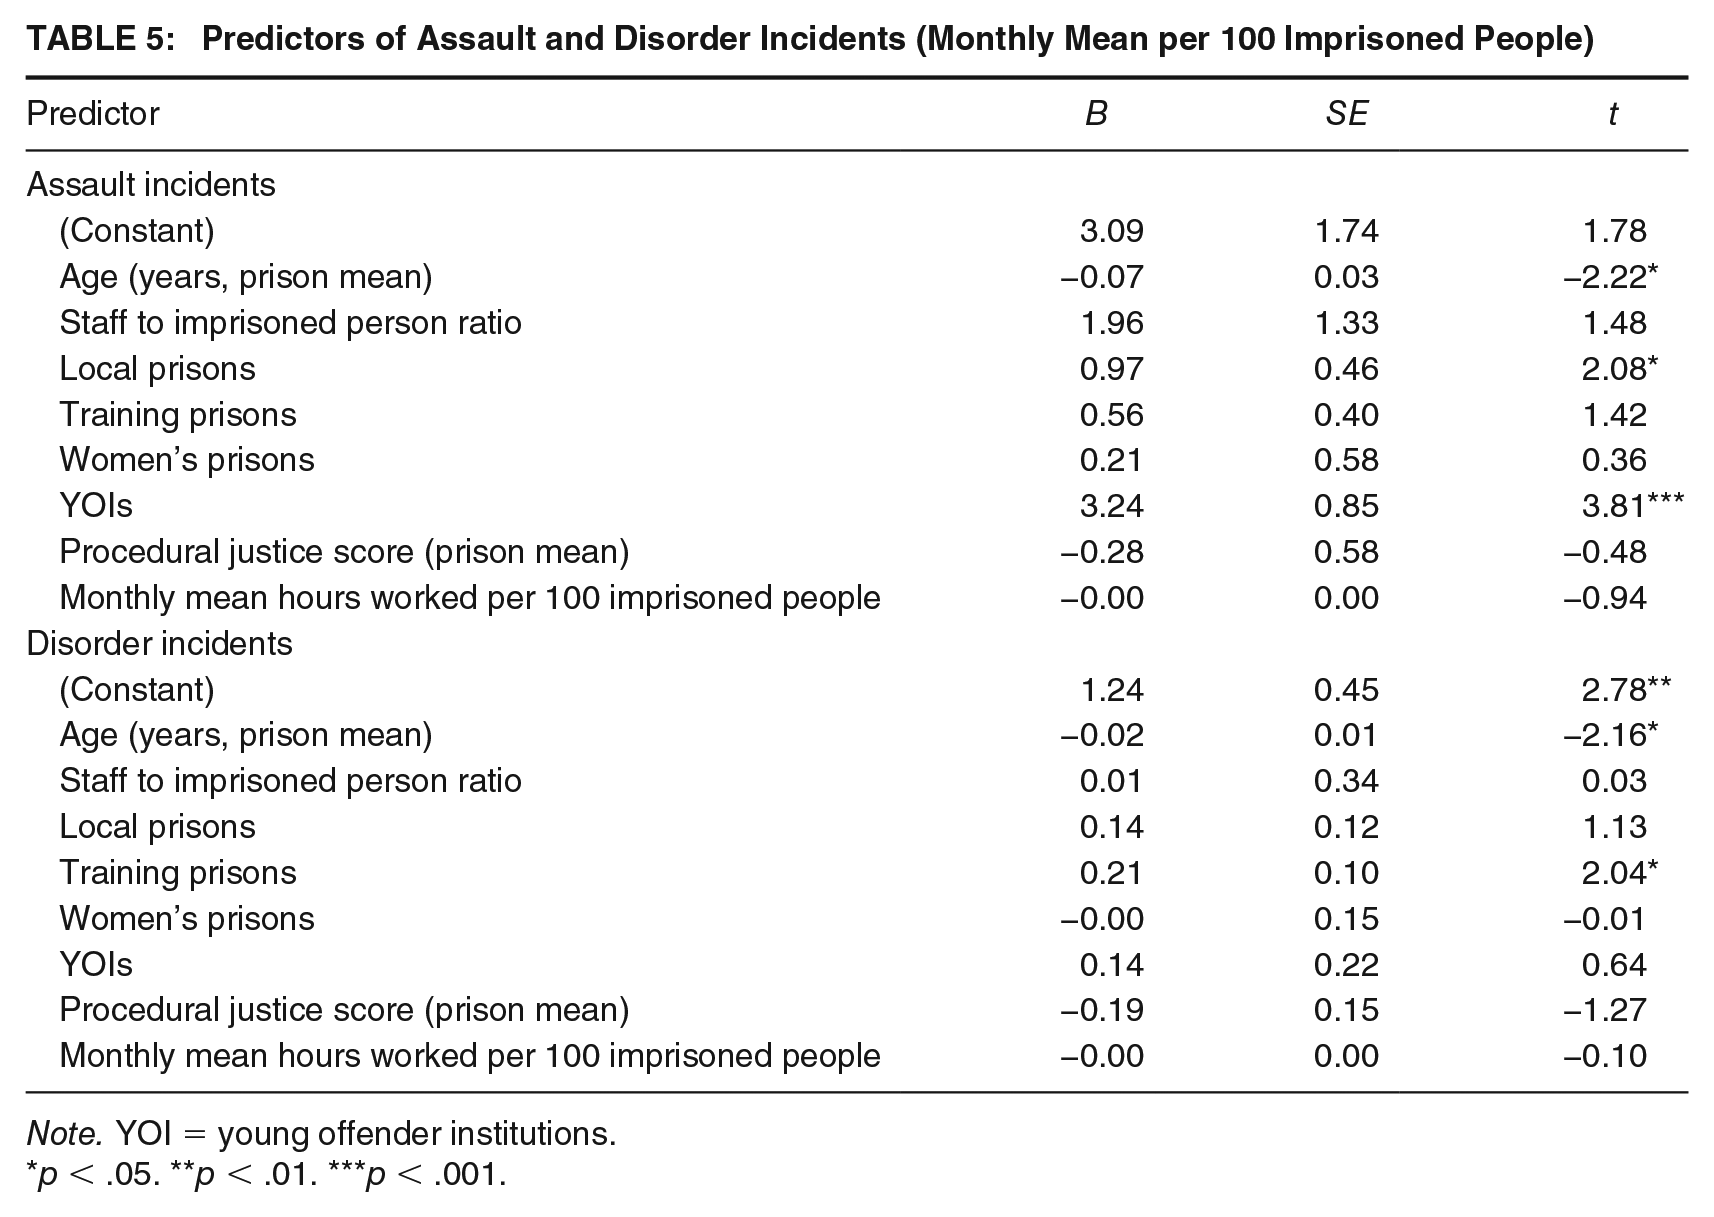
Note. YOI = young offender institutions.
p < .05. **p < .01. ***p < .001.
Concurrent Associations With Time Served
Three measures tested the relationship between PJ perceptions and time served, with different sample sizes according to when the MQPL items came into existence. The number, mean, and standard deviations are presented in Table 6, stratified by gender.
Number, Mean, and Standard Deviations for Time Served Variables Stratified by Gender

Note. PJ = procedural justice.
p < .05.**p < .01. ***p < .001.
A significant effect for length of time served on the current sentence was found for the overall sample, Welch’s F(5, 1,347.14) = 7.95, p < .001, r = .07, 95% CI = [0.05, 0.09].
However, when the analyses were stratified by gender, for women there were no differences in PJ scores between those serving different lengths of time on their current sentence, Welch’s F(5, 54.08) = 1.09, p = .44, r = .10, 95% CI = [−0.00, 0.10]. For men, a significant small effect of time served on the person’s current sentence was observed, Welch’s F(5, 1,215.56) = 7.15, p < .001, r = .07, 95% CI = [0.04, 0.10]. Post hoc tests (Bonferroni) indicated that men who had served less than 1 month had similar scores to those who had served 10+ years (p = 1.0). The pattern shows that after serving 1 month, scores decreased significantly and remained at a similarly lower level until increasing significantly at the 10+ years point.
A similar pattern of increasing time in custody being associated with poorer perceptions was also evident for how long each participant had served in their current prison. A significant small effect of time (with five response options ranging from less than 1 month to more than 2 years) was observed for the whole sample, Welch’s F(4, 7,185.58) = 26.99, p < .001, r = .05, 95% CI = [0.04, 0.06]. When conducted for men and women separately, the same finding emerged. For men, Welch’s F(4, 6,493.52) = 23.45, p < .001, r = .05, 95% CI = [0.04, 0.06], and women, Welch’s F(4, 636.13) = 3.00, p = .03, r = .07, 95% CI = [0.02, 0.12]. Men who had served less than 1 month in their current prison had significantly more positive perceptions of justice than all other groups (p < .001 for all comparisons). The remaining groups were all statistically similar to each other. For women, those who had served less than 1 month had significantly more positive perceptions of justice than those who had served more than 2 years (p = .03).
Examining the relationships between the number of prison sentences served and PJ scores, five response options were available, ranging from the current prison sentence being their first to 11 or more prison sentences served. A significant small main effect of sentences served on PJ scores was found for the overall sample, Welch’s F(4, 6,632.82) = 45.73, p < .001, r = .09, 95% CI = [0.08, 0.10]. The analyses were then conducted separately for men and women, and the same finding was obtained; for men, Welch’s F(4, 6,177.45) = 35.08, p < .001, r = .07, 95% CI = [0.06, 0.08], and women, F(4, 1,804) = 8.79, p < .001, r = .12, 95% CI = [0.07, 0.17]. Post hoc tests (Bonferroni) showed that for men, those who were serving their first prison sentence had significantly higher justice scores than all other groups (p < .001 for all comparisons). Justice perceptions for those on their second prison sentence were also significantly higher from those who had served three to six prison sentences in all (p = .002). From that point on, no further significant changes were observed (p = 1.00). For women, those who were serving their first prison sentence had similar justice scores to those who were currently serving their second (p = 1.00) and those who had served three to six in total (p = .16). However, they had significantly higher justice scores than women who had served seven to 10, or 11 or more sentences (p = .001 and p < .001, respectively).
Predictors of PJ
Person-Level Data
A total of 16,617 individuals were entered into a linear regression model to predict people in prisons’ PJ scores. The predictor variables are shown in Table 7. The model was significant, F(23, 16,593) = 71.34, p < .001, R2 = .09, adjusted R2 = .09, but explained very little (9%) of the variance in justice scores. As shown in Table 7, all but three predictor variables (2012 survey year; and 3–6, and 7–10 prison sentences served) were significant. The B values indicate that prison type, ethnicity, and how much time had been served in the current prison contributed most.
Predictors of People in Prison PJ Perceptions Using Person-Level Data
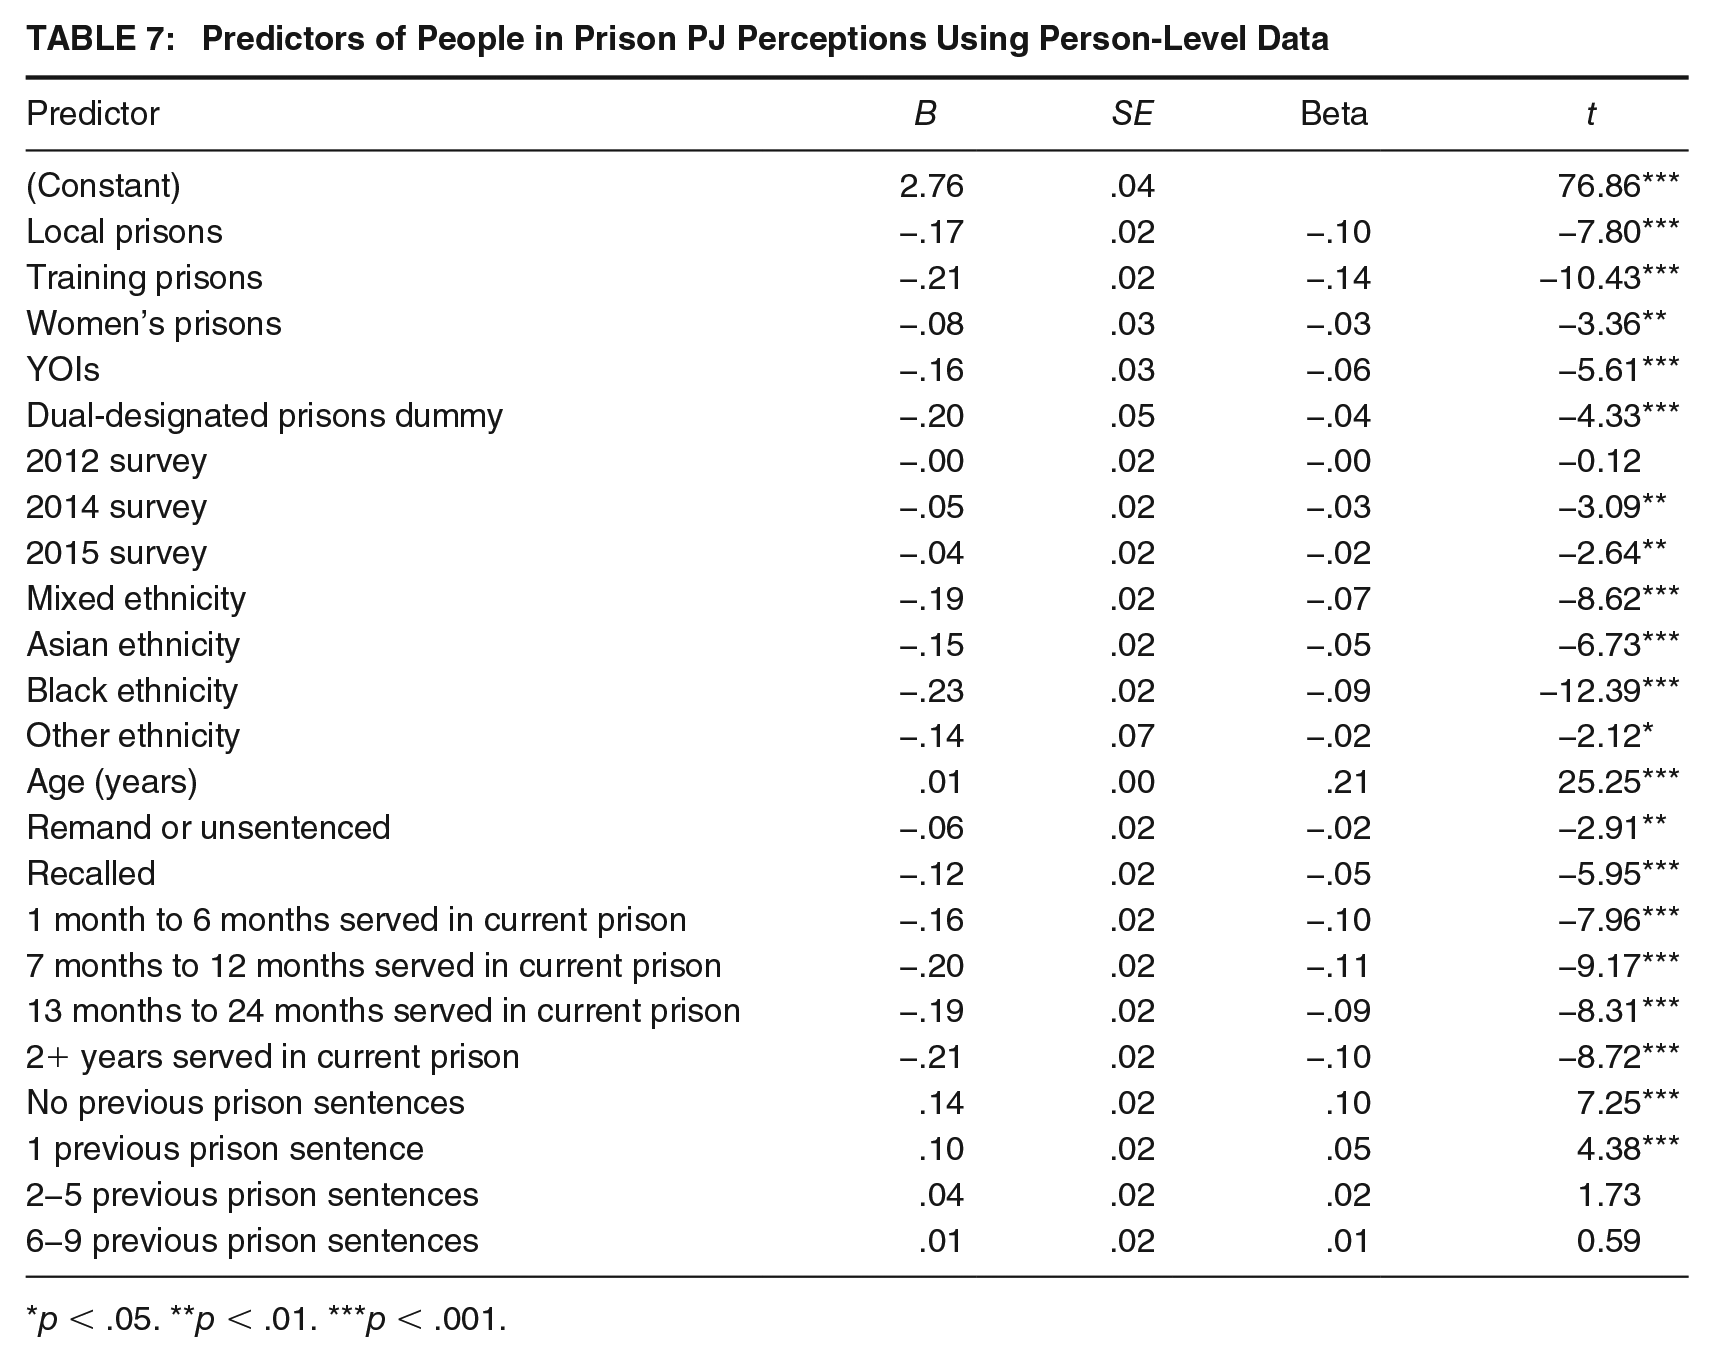
p < .05. **p < .01. ***p < .001.
Prison-Level Data
Predicting PJ scores at prison-level involved data from 69 prisons. Predictor variables are presented in Table 8. As different metrics became available at different times in the 4-year period of study, to minimize listwise deletion and maximize sample size, the four survey years were combined into a binary variable: 2012/2013 and 2014/2015. The model was significant, F(11, 60) = 5.90, p < .001, R2 = .52, adjusted R2 = .43, explaining 52% of the variance in prison-level PJ scores, substantially more than when using person-level variables. The difference between the R values indicated that the model may not generalize to other samples perfectly, but it should be kept in mind that the number of prisons included in this analysis is approximately half the total number of prisons across all of England and Wales and thus represents a huge number of people in prisons. As shown in Table 8, no independent variables were significant predictors of PJ scores.
Predictors of People in Prison PJ Perceptions Using Prison-Level Data
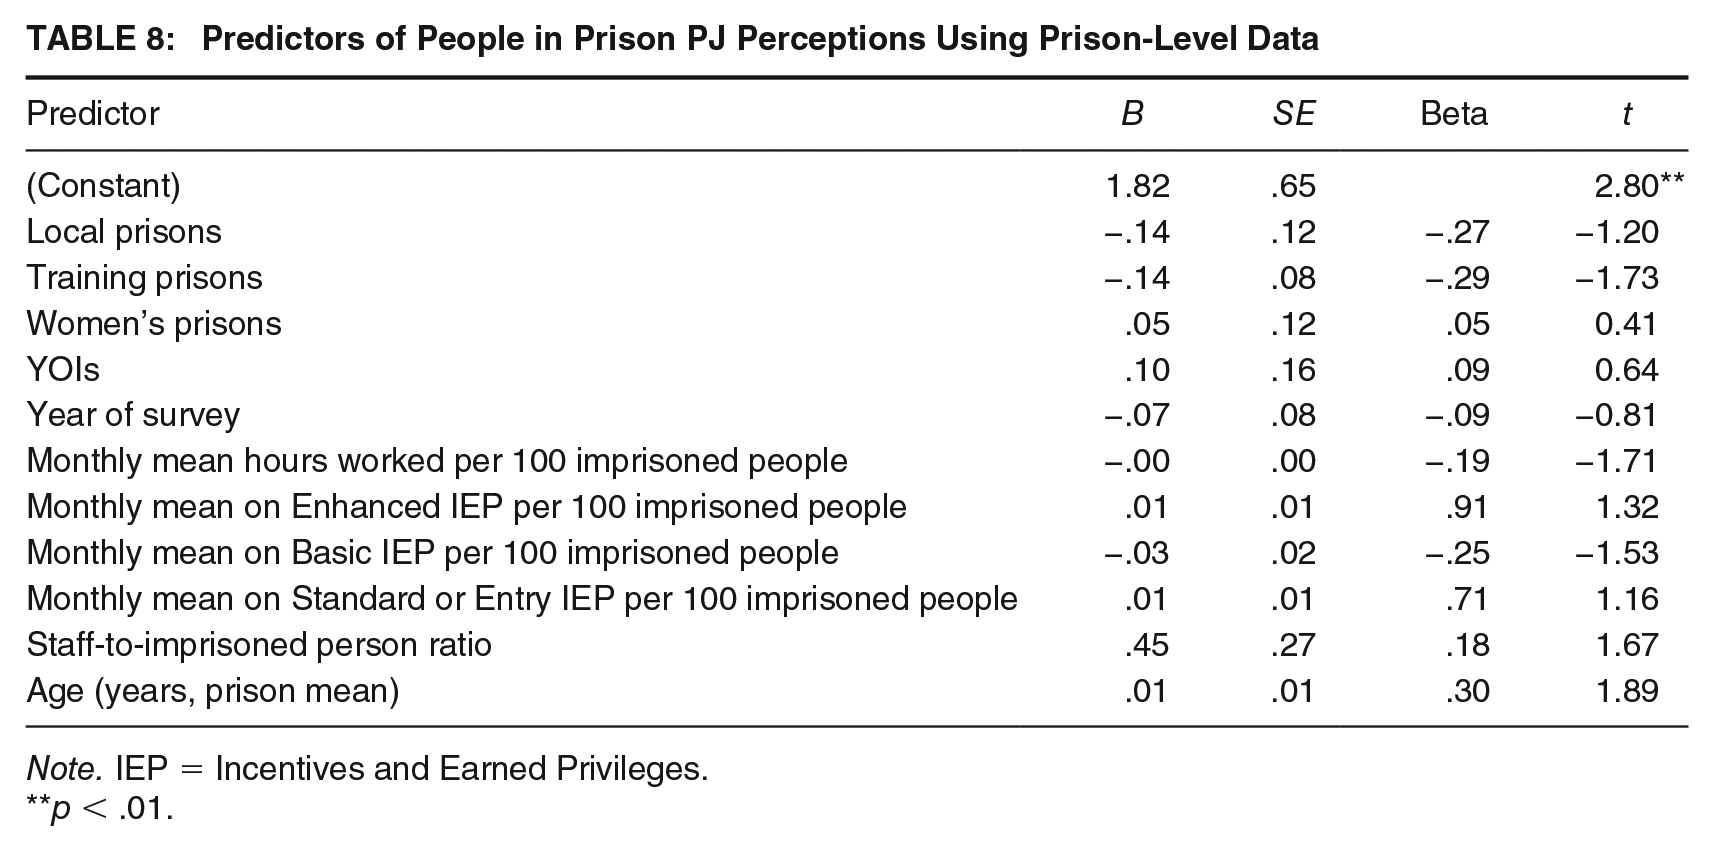
Note. IEP = Incentives and Earned Privileges.
p < .01.
Discussion
This study aimed to develop a valid and reliable measure of, and explore, people in prisons’ PJ perceptions in England and Wales. We developed a measure that had good content validity. Although our measure was longer, the items used were broadly similar in wording and coverage of the four PJ principles as the measures used in previous research; in fact, some items were identical to previous work as we used items from the MQPL. An advantage for HMPPS of our measure relying only on MQPL items, is that each time this survey is administered in future, PJ scores can be calculated as a matter of course and shared with prison governors to help them better understand the people in their care, and consider this in their work (particularly around improving or maintaining safety). The factor analysis produced a single-factor solution for both men and women, which had good internal consistency. The single-factor solution produced for both groups was not unexpected given the conceptual overlap between the PJ principles.
Group Variations in PJ
Based on a very large sample, perceptions of PJ for people living in English and Welsh prisons appear, on average, to be slightly below neutral. Differences based on person characteristics revealed that women, White people, older people, and sentenced people, all held significantly more positive PJ perceptions. The significance of ethnicity has been highlighted in previous research. For example, in an exploration of relationships between those working and those living in an English prison (Liebling, Arnold, & Straub, 2011), social and cultural differences, and ethnicity were identified as barriers to, or explanations for, low levels of trust of staff by incarcerated people. A review of the treatment and outcomes for Black, Asian, and Minority Ethnic people in the English and Welsh CJS (Ministry of Justice, 2017), reported that this group of people were more likely to report unfair treatment with regards to incentives and earned privileges, and less respectful treatment generally.
Higher justice scores with increased age is consistent with previous research from the Netherlands (Beijersbergen, Dirkzwager, Eichelsheim, & Van der Lann, 2015; Beijersbergen et al., 2014). This might reflect actual situational and relational differences for younger people, such as the regime in YOIs compared with the adult estate, or differences in how staff treat younger and older people in prisons (e.g., the likelihood of providing explanations for decisions and giving a voice). Alternatively, this might reflect individual changes due to maturation, such as the development of psychosocial maturity with age. Poorer perceptions of people recalled to custody are also consistent with prior research. People in prison have described the recall experience as unfair and unjust. They speak of this lacking collaboration and clear and understandable decision-making, and decisions seeming (at times) to be inconsistent and personal (Fitzalan Howard, 2019). Variations in PJ perceptions by gender, age, and ethnicity raise questions of whether this reflects objective differences in how groups are treated. Whether this is a case of objective or subjective differences, the fact that groups appear to perceive their treatment in prison to be less fair has important ramifications; the areas of the prison estate responsible for these groups could make most use of PJ in their practice.
Concurrent Associations With Time and Prison Type
Our exploration of PJ scores over time revealed significant fluctuations. As part of a wider government approach to achieving efficiencies, a benchmarking program in prisons was introduced in 2013 with the aim of delivering better quality services at lower cost. In addition to changes such as to regime and activity, and management structures, there was a notable reduction in staffing numbers. Benchmarking was introduced gradually, beginning with the adult male prison estate, followed by other prison estates, with each prison having 12 months to mobilize the plan. The major changes to how prisons were operating may in part explain changes or fluctuations in PJ perceptions over time.
The findings suggest overall, however, that prison type exerts the largest effect on justice perceptions, more so than the year of survey. Even after accounting for differences in ratios of staff to those living in prison, people in dispersal prisons had significantly poorer perceptions than almost all other prison types, and people in open prisons had significantly better perceptions than all other prison types. This may be explained by the fact that different prison types hold different types of people. Alternatively, it suggests that there may be something about the nature or culture of different prison types and how life is led in them, which exerts more of an influence on how those living there perceive their treatment. Although staffing is important (exerting a medium-sized effect), consistent with the findings of a study in the Netherlands (Beijersbergen, Dirkzwager, Molleman, et al., 2015), it does not appear to matter as much as other factors. This suggests that to improve the justice perceptions of incarcerated people, it would be worthwhile targeting certain prison types (particularly dispersal and young), and further investigating the nature and use of authority and decision-making in those sites where more positive perceptions are found (such as open prisons). We should bear in mind, however, that although there appear to be real differences emerging by prison type, mean justice scores for individual prisons within each type vary (some prisons score more positively and others more poorly). Presumably prisons of the same type hold reasonably similar people to each other, and thus, this variability within type may be better explained in differences in their individual cultures, nature and attitudes of the staffing group and other unique differences in how they run (rather than by individual differences of the people held in them). This is consistent with Dutch research also, which has reported that perceptions were significantly better in prison units with more female staff, and staff who held more positive attitudes toward rehabilitation (Beijersbergen, Dirkzwager, Molleman, et al., 2015).
Concurrent Associations With Time Served
Consistent with previous research identifying a relationship between prior incarceration and increasing time in custody with poorer justice perceptions (Beijersbergen, Dirkzwager, Eichelsheim, & Van der Lann, 2015; Beijersbergen et al., 2014), the current study repeatedly identified a significant negative relationship between time served and PJ perceptions. Overall, as people serve more prison sentences, as they serve more of their current sentence, and as they spend longer in an individual prison, there appears to be a decline in their perceptions of the fairness of authority. This appeared to be mostly consistent for both men and women. An interesting exception appeared; once men had served more than 10 years of their current sentence, their perceptions appeared to improve and were comparable with those who had served less than 1 month. The overall pattern is unlikely to be explained by increasing age, as previous analysis showed that steadily increasing age is in fact associated with steadily improved perceptions (rather than a sudden jump later in life). Once someone has served a decade or more, perhaps their sensitivity to injustice or expectations of treatment alters; or perhaps after such a long period of time, they have learned to relate to prison staff in ways which bring about fairer outcomes. It may be that those with longer sentences over time gain an understanding of the need for positive relationships with staff to manage their time in custody.
Concurrent Associations With Harm to Self or Others
In line with previous literature suggesting that positive perceptions are related to better mental health outcomes, less distress, and anxiety (Beijersbergen et al., 2014; Gover et al., 2000; Liebling et al., 2005), our findings at person-level showed, for the overall sample, and for men and women individually, self-reported self-harm was weakly but significantly associated with poorer PJ perceptions. This was also the case for men who self-reported attempted suicide. Interestingly, the relationships were strongest for people who had harmed themselves only in their current prison, notably for men. This may suggest that people who act this way repeatedly through the course of their time in prison, wherever they are, are driven more by imported factors (such as personal vulnerability or depression). In contrast, those who behave this way in just one prison may be driven more by situational factors. The differences observed between men and women may be due to the smaller sample of women included in the analyses. Although we cannot say based on these findings that improving perceptions of PJ will lead directly to a reduction in harming behaviors, this is certainly a plausible hypothesis. Any programs of work to manage and reduce self-harming in prisons may benefit from utilizing PJ.
At prison level, although the sample (and thus the power to detect an effect) was smaller, the analyses pointed to a small negative association between assaults and disorder incidents and PJ perceptions, indicating that better perceptions correspond to fewer incidents in training and women’s prisons. This result is consistent with previous research demonstrating a similar relationship (Day et al., 2015; Reisig & Mesko, 2009). Although the sample was smaller, it is noteworthy that the number of prisons included in our analysis included almost all of the prisons in England and Wales, suggesting this to be a valid and generalizable finding. Unlike previous research that has found PJ perceptions to predict misconduct and violence in prisons (Beijersbergen, Dirkzwager, Eichelsheim, & Van der Lann, 2015; Bierie, 2013), our analyses did not find this. There are several possible explanations. It may be that injustice and violence is associated or indirectly linked but the relationship is not causal, and is instead explained by other factors such as overly heavy staff authority. Alternatively, this may be due to prison-level rather than person-level analysis, which prevented us from examining the relationship between people’s perceptions and their personal behavior (as most of the prior research has done). We cannot be sure that the surveyed people were present during the 6 months covered by the incident data, nor that they were the people who engaged in those incidents. It is also possible, however, that this relationship is not replicable in English and Welsh prisons, or the problem lies in the measure of PJ used.
Predicting PJ
One of our ambitions was to identify features that may predict peoples’ PJ perceptions. We hoped this would provide insight into groups that HMPPS may want to target more directly to help improve their perceptions, or to help identify features of prisons or regimes that could be examined to learn from and replicate or change to influence perceptions. Our findings were disappointing; although a number of variables were identified as significant predictors, overall it seems clear that some or many important variables were not accounted for in our analysis.
Limitations
Using prison-level data substantially reduced the sample size, and thus the power of some of our analyses. As the MQPL is completed anonymously, we could not match PJ scores to individual records. Some data were unavailable, limited or unusable, preventing some analysis and the control of potentially confounding variables. For example, when metrics were introduced only part way through our 4-year period, when staffing numbers included those without contact with people in prison (when ideally, for us, they would not), or when certain relevant data were not routinely collected by HMPPS. These aforementioned limitations meant we were unable to test some types of validity, specifically predictive, discriminant, concurrent, and test–retest validity. Although the self-report MQPL data allow us to measure hard-to-observe constructs like perceptions, it has its own limitations, such as being potentially influenced by a person’s feelings at the time they answer the questions. Underrepresentation of certain groups and prison types also prevented some comparisons. Finally, ideally, confirmatory factor analysis would have been used to confirm the validity of the measure’s structure, rather than a second EFA. This was prevented due to inaccessibility to appropriate software.
Future Research
Given the importance of perceptions of PJ in prison, we recommend further research should be conducted in prisons and probation settings to more fully understand how to affect people’s justice perceptions, and what effect these perceptions (and changes to them) may have on outcomes (including well-being, misconduct in prison, compliance in the community, and longer-term recidivism). The national and international research provides a compelling picture that PJ matters, and in our opinion the focus now needs to be on how to use this to experimentally affect real change. What practically works to help people working in prison and probation to use the PJ principles to improve the perceptions of the people in their care, and their subsequent behavior? Future research should also aim to boost the sampling or testing with minority groups, and those on probation in the community. Furthermore, testing the relationship between the PJ perceptions of prison staff and those living in prison would be of interest.
Conclusion
The findings support, to some extent, the notion that improving people in prisons’ perceptions of PJ could lead to safer, more rehabilitative prisons, for both men and women. The findings also indicate this attention to PJ could be most important for certain groups—and in certain types of prisons—although even the higher-scoring prison types have room for improvement. The more positive perceptions in certain types of prisons are worthy of particular consideration; what is it about their cultures and use of authority that could be emulated in other prisons? This study expands on prior research by developing a reliable and valid measure of perceived PJ using a large existing survey that measures the culture of prisons in England and Wales. The analysis is strengthened by the large samples and data gathered over the course of 4 years, which has allowed us to explore change over time and across many subgroups of the people in prison population. Improving PJ is likely to be cost-neutral or incur only minor cost, and if it results in fewer acts of violence and self-harm, let alone reduced reoffending after release, it is a concept worthy of far greater research and policy attention.
Footnotes
Authors’ Note:
We would like to thank Dr Rosie Travers, Heidi Scott-Neale and the late Dr. Ruth Mann, for their valuable contributions.