
Abstract
The present study addresses a topic neglected by the public administration literature: government corruption and its effects on public service systems. Specifically, the study focuses on the institutionalized form of government corruption and offers a framework to explain how corrupt industry operates. The results indicate that in countries with a high level of corruption, a higher ratio of public expenditure on education is associated with less effective educational outcomes, supporting the “wagon-wheel effect” (i.e., policy aimed to promote public service quality leads to its deterioration). The implications of the results for the administration of public service systems are discussed.
Governments intervene in markets, among others, through the provision, financing, and regulation of public services (Rhodes, 2000). Government corruption is considered a by-product of this intervention (Acemoglu & Verdier, 2000). Government corruption involves officials using public resources and authorities for personal gain (Rodriguez, Uhlenbruck, & Eden, 2005). As the interests of politicians and administrators take precedence over the public interest, the quality of governmental services decreases. Research on government corruption has flourished in the 1960s and 1970s, and since the beginning of the 2000s, it has experienced a renaissance (Sandholtz & Koetzle, 2000). Nevertheless, little is known about government corruption and much additional research is required for several reasons. First, a great deal of the empirical knowledge was produced in single-country case studies (e.g., Agbiboa, 2015; Sandholtz & Koetzle, 2000). Second, the research paid attention mostly to the effect of corruption on economic outcomes (e.g., Fisman & Svensson, 2000; Wei, 2000). Third, the systematic investigation of the relationship between corruption and the provision of social services such as health care and education services is relatively new (e.g., Gupta, Davoodi, & Tiongson, 2000; Lewis, 2006). Fourth, currently most research on government corruption is anecdotal and lacks theoretical grounds, particularly on how corrupt public industry operates and on how it affects the effectiveness of public services.
The present study focuses on the effect of government corruption on public service effectiveness in a cross-country exploration, aiming to investigate how corrupt public industry operates and how it affects government services. I begin by exploring the definitions of corruption and reviewing works about the effect of government corruption on economic outcomes and public service effectiveness. Next, I zero in on government corruption to make a conceptual distinction between sporadic government corruption (in which corrupt acts are performed by individuals or groups in the public system) and institutionalized government corruption (in which corrupt acts become legitimized in the public service industry and are integrated into public service practices). I focus on situation of institutionalized government corruption and present the corrupt industry operation triangle theory, and its hypothesized “wagon-wheel effect” on government services. In the following sections, I present the method of the systematic cross-country analysis and its results. Finally, I discuss the implications of the results and the limitations of the study.
Conceptual Framework and Hypotheses
Government Corruption and Its Outcomes
In this section, I discuss definitions of government corruption and some of its effects on society and services. The literature offers several definitions for the concept of corruption. A basic distinction is between normative, positivistic, and legal-based definitions (Khan, 1996). The normative perspective suggests that corrupt acts deviate from the dominant conceptions held by the relevant public; the positivistic perspective suggests that corrupt acts can be acknowledged only by their consequences; and the legal perspective suggests that corrupt acts deviate from formal regulations and exceed permitted standards. All definitions share a baseline assumption that corruption involves individuals repudiating their duty in favor of a possible or tangible financial or political gain. Corruption can take root in all types of organizations, but the most problematic is considered to be corruption that spreads in government.
Some argue that corruption at various levels is endemic in all governments (Nye, 1967). Government corruption can manifest in two forms that involve officials repudiating their public duty. The best known form of government corruption is the one in which public officials, whether as individuals or as a coordinated group, use their administrative power to transfer public resources to themselves to increase their personal wealth (Acemoglu, Verdier, & Robinson, 2004). A good example is embezzlement of public funds or demanding personal fees for government services. Another form is related to public officials using their administrative power to influence the distribution of public funds to preserve and expand their political power (Rose-Ackerman, 1999). This situation arises when officials selectively appoint individuals to public positions, grant licenses, allocate resources and contracts, or enforce the law to gain political support (Fjelde & Hegre, 2014). These two forms of government corruption have been described figuratively as “looting” and “cheating” (Nyblade & Reed, 2008).
Corruption is difficult to measure objectively in an international comparison because it is associated with local legislation that often defines felonies differently (Lambsdorff, 2007). In some cases, corruption is undocumented because it has spread to law enforcement agencies, and therefore often the documentation of corrupt acts does not reflect their scope (Khan, 1996). Moreover, studies document cases in which corrupt politicians legalize corruption (Jávor & Jancsics, 2013). Furthermore, there are questions about the bias and validity of data obtained from official national statistics and experts in highly corrupt countries. Therefore, using public perception of government corruption is considered a suitable replacement (Lambsdorff, 2007).
One of the essential aspects of government corruption has to do with its association with effectiveness. The literature offers two alternative hypotheses regarding the link between corruption and effectiveness (Méon & Weill, 2010). The first one suggests that government corruption assists inefficient public institutions to bypass dysfunctional bureaucracy thereby promoting government efficiency (i.e., “grease the wheels” effect; Leff, 1964). Corruption of this type is regarded as a successful tactic for motivating officials to speed up prolonged and inefficient bureaucratic procedures, or to overcome ideological resistance and prejudice that stand behind bureaucratic obstacles (Méon & Weill, 2010). The second and more commonly accepted hypothesis suggests that government corruption prevents government institutions from setting relevant goals and implementing policies successfully, thereby promoting administrative inefficiency (i.e., “sand the wheels” effect; Méon & Sekkat, 2005). Corrupt officials attempting to extort bribes can cause delays and distort economic logic for personal financial gain (Kurer, 1993; Myrdal, 1968). Often the highest bribers who “win” public bids are unmotivated and under-regulated, and therefore provide low-quality services (Rose-Ackerman, 1997). Thus, corruption frequently results in reallocation of public funds to less efficient goals and programs (Mauro, 1998). Government corruption is also said to have an indirect effect on the effectiveness of public systems. For example, when government corruption leads to low-quality services, some individuals withdraw from these services and refuse to pay for them, thereby diminishing the ability of government to offer quality services (Gupta et al., 2000).
Although the research suggests that there is a negative effect of government corruption on economic effectiveness, only limited empirical evidence exists on the negative association between government corruption and the effectiveness of public services. Gupta and colleagues (2000) find that countries with lower level of corruption are perceived to provide more efficient public services. Government corruption was found to be related to higher child and infant mortality, lower immunization coverage, and low birth weight (Gupta et al., 2000). In education, high levels of corruption were found to be related to higher student drop-out rates, up to 5 times higher than that in countries with low levels of corruption (Gupta et al., 2000). Therefore, I propose,
Corrupt Public Industry and the Wagon-Wheel Effect
To better understand the effects of government corruption, it is necessary to zero in on its various manifestations. Corruption is a multilevel phenomenon that combines interactions between individuals, groups, industries, nationalities, and nations (Ashforth, Gioia, Robinson, & Trevino, 2008). I attempt to conceptualize the difference between sporadic government corruption (i.e., “bad apples and bad barrels”: corrupt political actors and officials acting as individuals or in coordination) and institutionalized government corruption (i.e., “bad industry”: corruption that spreads throughout the public services and infiltrates the system) in the following.
Sporadic government corruption includes both individuals and groups within the government (“bad apples” and “bad barrels,” respectively). At the individual level, corruption is regarded as a predisposition associated with low integrity, immoral inclinations (Aquino & Reed, 2002; Frost & Rafilson, 1989), and even psychopathology (Babiak & Hare, 2006). The focus on individuals leads to the conclusion that corruption can be eradicated by distancing corrupted individuals from organizations (Lanyon & Goodstein, 2004). But corruption is often a cultural characteristic of a group: antisocial and unethical behaviors spread to other group members through social learning, information processing, and imitation (Ashforth & Anand, 2003; Weaver, Treviño, & Agle, 2005). The formation of an unethical climate not only inspires corrupt behavior but also legitimatizes it. Thus, in some social circles, corrupt behavior can become not only accepted but also normative (Ashforth et al., 2008).
Government corruption can be even more invasive and reshape an entire system, converting the public service industry into a “hub” for corruption (i.e., institutionalized government corruption). Scholars suggest that in business-related fields, lack of regulation and high pressure to meet financial targets can make industries more susceptible to corruption (Ashforth et al., 2008). The literature also describes situations in which the public service industry becomes corrupt: Corrupt politicians desire to provide incentives for their supporters by allocating public resources and positions to them, creating a systematic social network of exchange often referred to as “patronage politics” (Acemoglu et al., 2004; Auyero, Lapegna, & Poma, 2009). In this way, a public service industry can become a breeding ground for government corruption that involves multiple actors and processes.
Sporadic and institutionalized government corruption is likely to influence differently the operation and effectiveness of public systems. To illustrate this distinction, I conceptualize in the following the operation of a corrupt industry. Through analogy with the idea of the “fire triangle,” often used to describe the three elements required for igniting a fire (heat, fuel, and an oxidizer), I outline a corrupt industry operation triangle (see Figure 1), the main indicator of which is the wagon-wheel effect (a policy that normally supports the system in practice leads to its deterioration). This effect is manifest when the three elements that shape a corrupt industry interact: institutionalized corruption (heat) occurs in a system in which configurational, political, and loosely coupled (CPLC) design (fuel) is dominant and substantial funds (oxygen) flow into the system. In a sense, the three elements affect one another, as when substantial funds are injected into the classic CPLC system, so that institutionalized corruption is likely to spread. A corrupt industry in which the three elements appear leads to an operational outcome that manifests in the wagon-wheel effect.
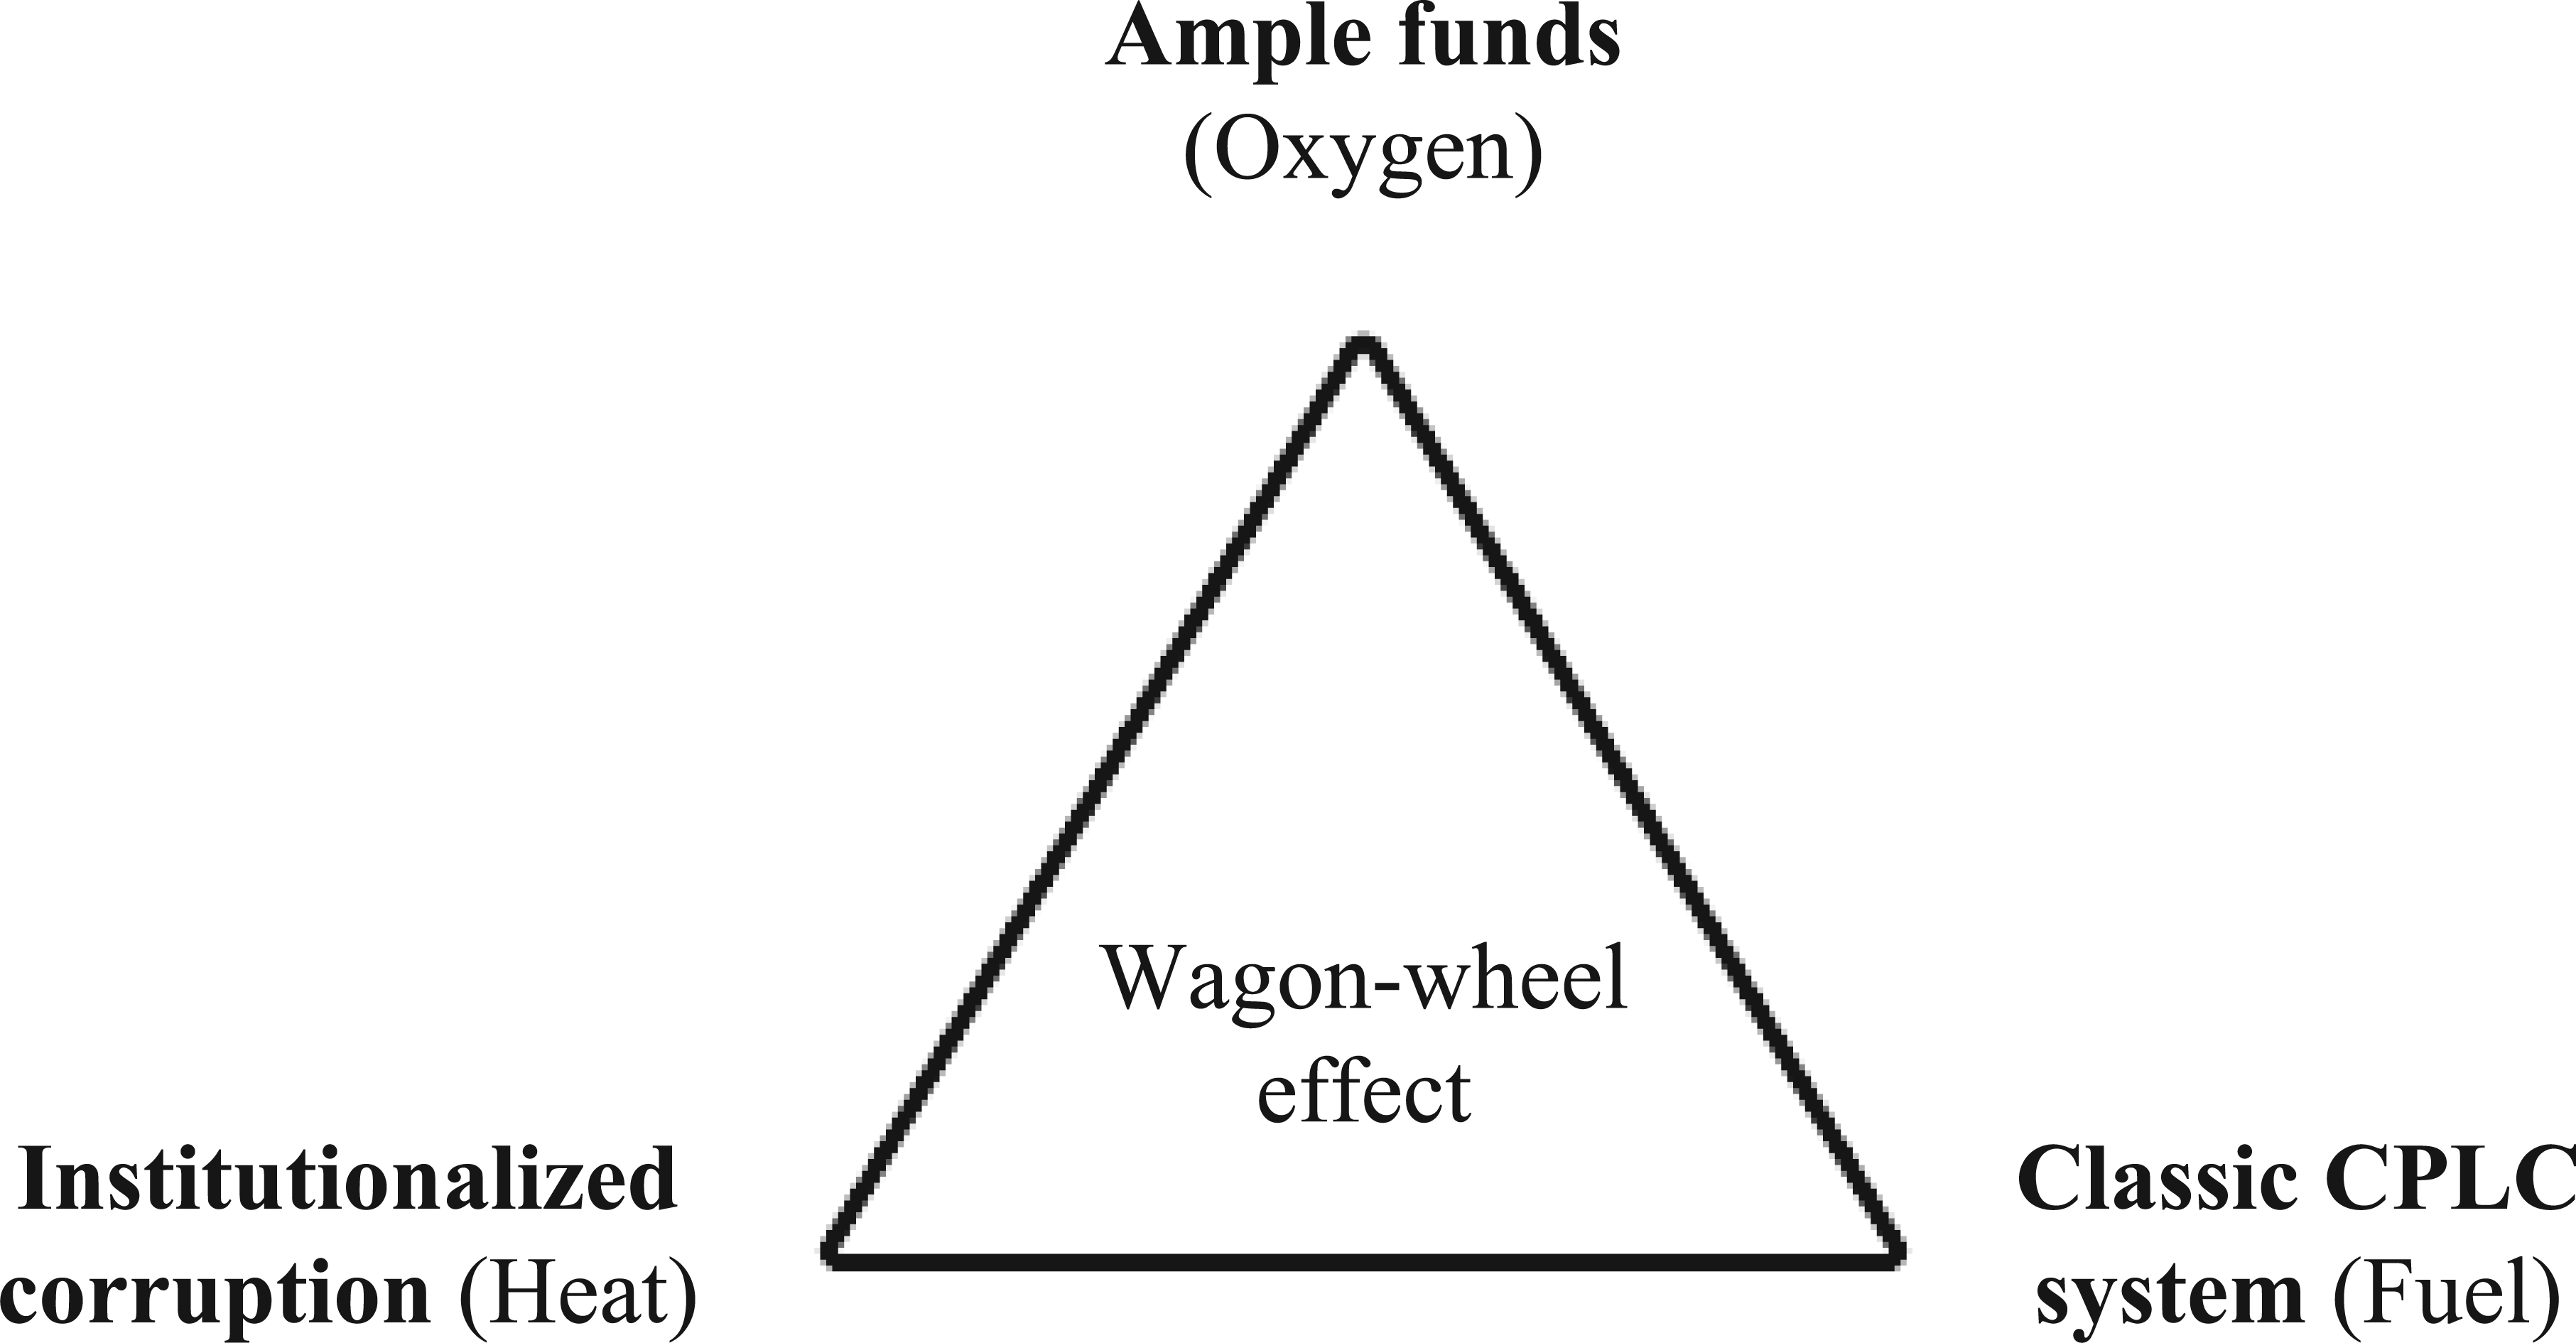
The corrupt industry operation triangle.
The first element in the triangle is institutionalized corruption. The effect of government corruption on efficacy occurs when corruption is normalized in the system and reshapes many routine practices (Ashforth & Anand, 2003) in a manner that serves corruption-related interests rather than the public interest. For example, Lewis (2006) outlines the manifestations of institutionalized corruption in a public health care system. Among the corrupt practices he mentions are (a) selling public positions to under-motivated and under-trained individuals; (b) embezzling public funds targeted for supplies and infrastructures; and (c) charging clients to complement public officials’ income. Lewis suggests that these practices lead to low productivity and poor service. Another portrait of an institutionalized corruption in a public system is painted by Heyneman (2004), who describes the operation of a corrupt education system that includes the following corrupt practices: (a) selection mechanism of students that favors elite mobility; (b) accreditation of educational institutions that prevents competition; (c) fixed contracting that allows a few privileged providers to attend and win bids; (d) professional misconduct at the school level, such as selling grades or using school resources for personal purposes; and (e) profiting from educational buildings.
The second element in the triangle is a classic CPLC system design. Lynn, Heinrich, and Hill (2000) contend that public government is by nature CPLC. According to them, public systems are a configuration of a variety of layered and at times contradicting aspects: legal and normative, economic and programmatic, and organizational and bureaucratic. This structure enables and also constrains public service delivery. They argue further that public systems are political because they have multiple stakeholders with different goals and values. Thus, their administration involves bargaining and compromising when distributing resources and responsibilities. Lynn and colleagues suggest that public systems are loosely coupled despite their formal structure because end units can operate in isolated manner without influencing or being influenced by other units, enabling field personnel to use relatively great discretion and limiting hierarchical supervision. I suggest that the classic CPLC system design is susceptible to corruption and misuse. For example, multiple hierarchical levels between the central government and the field units make the transfer of funds a complex operation, providing ample opportunities for theft (Dehn, Reinikka, & Svensson, 2003; Lewis, 2006).
Substantial funds make up the third element in the triangle. The link between allocation of public funds to public services and corruption is complex. Mauro (2002) argues that it is possible to outline two causal explanations for such a relationship. The first one suggests that corruption leads to a lower investment in social services. For example, often, high levels of corruption are associated with increased military expenditure (Gupta, de Mello, & Sharan, 2001) and reduced spending on health and education services (Mauro, 1998). Mauro also offers a second explanation, according to which a corrupt government may increase spending on social services, but in practice corruption diverts the public funds from their public goals. In such circumstances, a negative association emerges between public expenditure on social services and the desired outcomes.
To the best of my knowledge, only one work, by Swaroop and Rajkumar (2002), ties these three elements together and offers a new insight on how a corrupt public industry operates in the domain of public services. The researchers found that the effect on reducing child mortality of public spending on health was associated with integrity rating (low perceived corruption), and that countries that improve their governance of public spending on primary education are effective in increasing primary school attainment. This study uses a problematic quality indicators (such as child mortality rate and primary school attainment) that favor developed countries over developing ones, and which are influenced by socioeconomic factors outside the system. But assuming that these findings are valid, government corruption seems to have a moderating effect on the relationship between ample public funds and public service effectiveness, which leads to a paradoxical situation because in a corrupt public industry, when public funds are injected into the system, service effectiveness deteriorates. I call this situation the “wagon-wheel effect” because of its similarity with the optical illusion that occurs when a wheel appears (usually on film) to be rotating in opposite direction from the one in which it rotates in reality. In a corrupt industry, increase in public funds, which logically should increase performance, in practice results in poorer outcomes.
Method
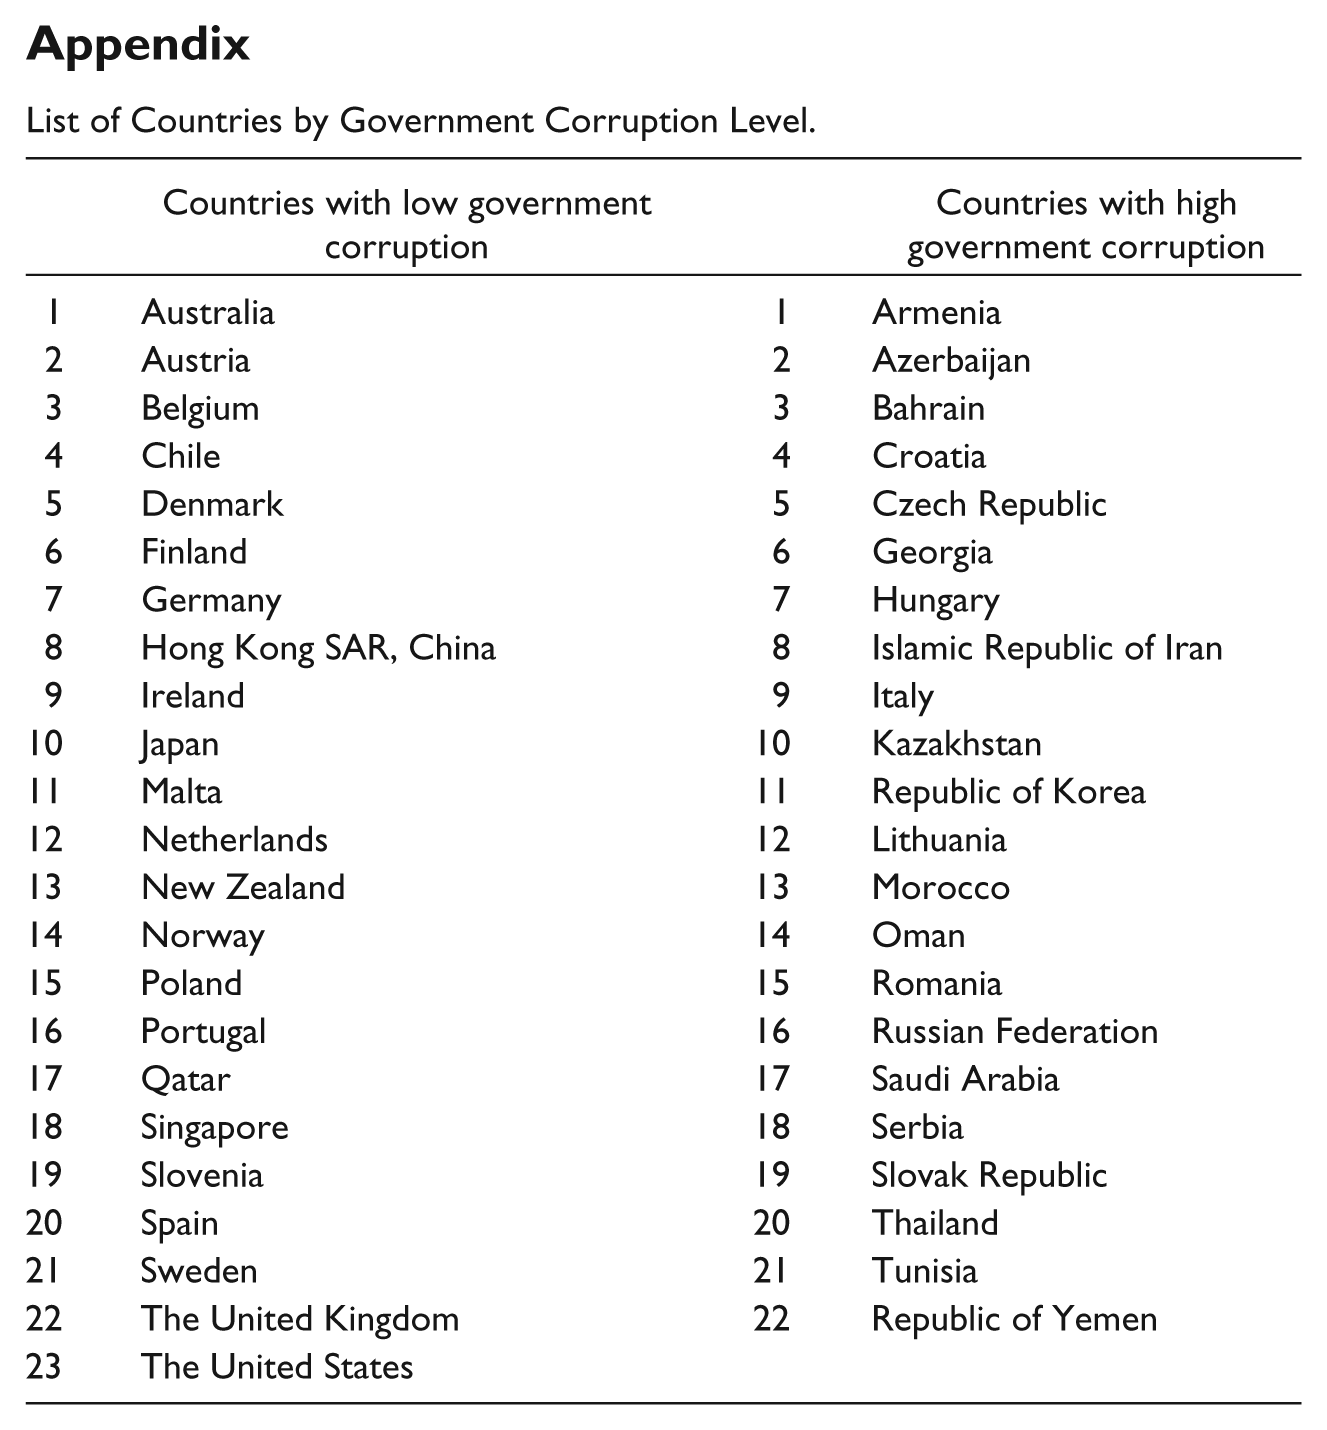
The effectiveness of government cannot be easily quantified (Mauro, 2002), but new international databases currently offer opportunities for cross-country exploration. It is now feasible to explore public service effectiveness in an international analysis of the field of education because in recent decades educational achievement has been assessed in a reliable and comparable manner. For the purpose of the present study, I used the Trends in International Mathematics and Science Studies (TIMSS) assessment database. Specifically, as the sample list, I focused on countries participating in the TIMSS fourth-grade mathematics test in 2011. The initial list included 50 countries (excluding benchmarking regional entities). Five countries were removed because of missing data in variables of interest, so that the final sample included 45 countries (see the appendix).
Indicators
I used several international indicators to explore the study hypotheses. The first was educational achievement. One of the key challenges in conducting an international comparative analysis, particularly in education, is lack of congruent data (Nir & Sharma Kafle, 2013). Because this was a key constraint in designing the data set, the available international information about educational achievements served as the cornerstone of the data set of the current study. As an indicator of educational achievement, I used the TIMSS results. TIMSS is an international assessment of mathematics and science knowledge of fourth- and eighth-grade students used worldwide. I chose to focus on fourth graders’ scores because primary education has become a norm in the vast majority of countries. In developing regions, enrolment in primary education reached 90% in 2012 (United Nations, 2014). To reduce variance linked to economic differences between counties as a result of their varying abilities to provide infrastructure for science education, I used the TIMSS fourth-grade math scores for 2011. The TIMSS 2011 data were collected during the years 2010-2011. The TIMSS scores are scaled at each grade level. The scale center of 500 points is aligned with the mean of the overall achievement distribution, and the 100-point range is aligned with the standard deviation of the achievement distribution. Because TIMSS fourth-grade scores represent the effectiveness of a 4-year learning process taking place in the primary school system, I aspired to use data from the relevant period (2008-2011), wherever possible.
The second indicator was government corruption, using scores from the Corruption Perceptions Index (CPI) of Transparency International. The CPI ranking is based on aggregated scores from several surveys of the perception of business executives regarding corruption among politicians and public officials. The CPI is composed of corruption-related data collected in polls by trustworthy institutions such as the World Bank and other reputable non-government and private organizations. A minimum of three data sources have been used to calculate the score of each country. Specifically, I used the CPI ranking from the year 2011, which includes data collected during 2009-2011 (Transparency International, 2011). The original CPI 2011 scores range from 0 (highly corrupt) to 10 (very clean). For the purpose of the current study, the scores were reversed and multiplied by 10. Thus, corruption scores in the present study range from 100 (highly corrupt) to 0 (very clean).
The third indicator was public expenditure on education, which includes all public spending on educational institutions and subsidies for students. The indicator incorporates the expenditure on education made by central government, regional (province, state, etc.) and local (municipality, district, etc.) authorities and other public agencies. Frequently, public expenditure on education is represented as a percentage of total public spending. This ratio indicates the priority that government ascribes to education over other government services, and a higher ratio means relatively lower investment in the domains of health, welfare, and defense. The data regarding public expenditure on education represent average scores for the period 2008-2011, adopted from the World Bank Database. Missing data in the World Bank Database on Northern Ireland, China, Kuwait, Turkey, and the United Arab Emirates led to their exclusion from the sample.
Control Variables
Based on the literature, I included two variables as controls in analysis: GDP (gross domestic product) per capita and the Gini index. GDP is an indicator of the economic strength of the countries, which is often used in cross-national research. The GDP represents the value of all goods and services produced domestically in a calendar year. The GDP figure is converted into a per capita score by dividing the GDP by the number of citizens in the country. GDP per capita represents a citizen’s average share of the overall GDP, and it is considered to be indicative of the average wealth available per person in a given nation. Often, GDP per capita is used to signify the potential ability of a country to invest in the public. For the purpose of this study, GDP per capita scores were obtained from the World Bank Database. I also included the Gini index scores as a control. The Gini index measures the income distribution of a nation and indicates wealth inequality among its citizens. In a perfectly equal society, each individual receives the same income (Gini score = 0), whereas in a society in which inequality is the greatest, a single person receives the total income and the other individuals receive nothing (Gini score = 1; Organisation for Economic Co-Operation and Development [OECD], 2011). Income inequality is said to lead to a lower level of educational attainment and to uneven access to education (United Nations, 2013). For the purpose of the current study, the Gini scores of the World Bank were used. These scores are equivalent in design to the regular Gini scores but are a multiplication of the original Gini scale by 100 (Haughton & Khandker, 2009). These scores are not routinely collected, therefore only the latest available scores for each country in the World Bank Database were used.
Data Analysis
The data were analyzed in three steps. First, an independent t-test procedure was used to account for differences between corrupt and uncorrupt countries in socioeconomic background and educational quality outcome. Second, a regression analysis was conducted to determine the degree to which public expenditure on education and government corruption are significant predictors of educational effectiveness, controlling for social and economic characteristics. Third, a moderation analysis was performed to test the hypothesis that government corruption moderates the relationship between public expenditure on education and educational effectiveness.
Results
Table 1 presents the correlations between the study variables of interest: government corruption, educational effectiveness, and public expenditure on education as a percentage of total government expenditure, as well as national characteristics such as the GDP per capita and the Gini index. Analysis of the correlations indicates a preliminary support for the suggested negative association between government corruption and educational achievements, as countries whose government is perceived to be corrupt are less likely to be characterized by higher educational achievements. The matrix also indicates that the economic production level of a country, manifested in GDP per capita, is positively linked with educational achievement.
Correlations Between Research Variables (N = 45).
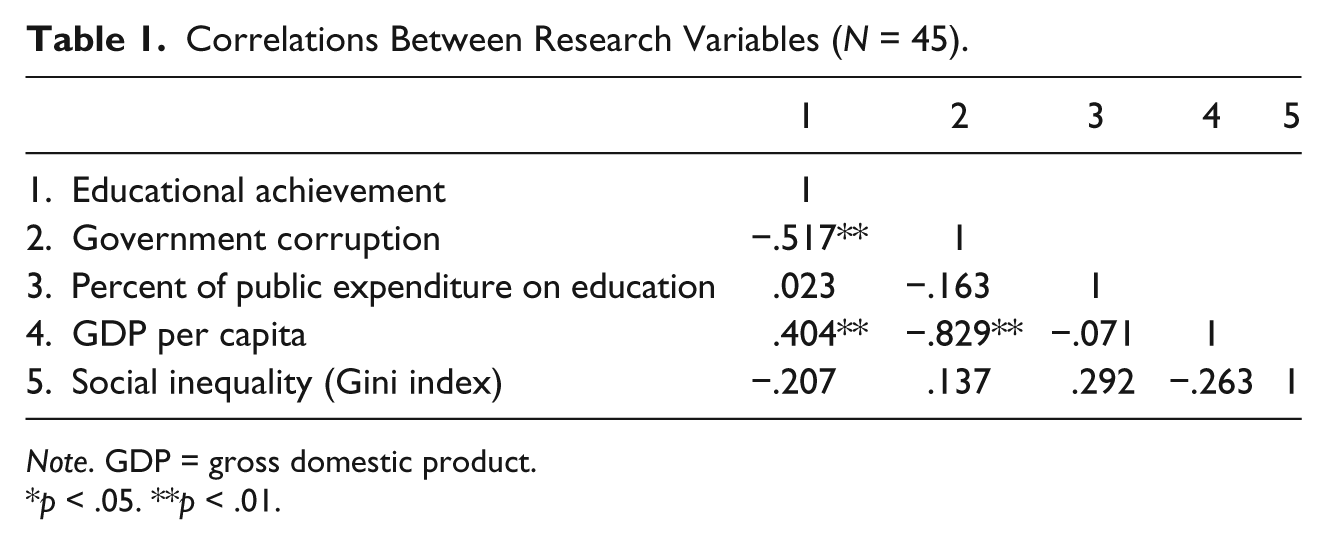
Note. GDP = gross domestic product.
p < .05. **p < .01.
Subsequently, to explore the differences between countries with high and low government corruption level, an independent t test was conducted. The results of the analysis are presented in Table 2. The mean score of educational achievements in countries with higher government corruption level was lower than that in less corrupt countries. A similar difference was found in GDP per capita between countries with different levels of corruption: In more corrupt countries, the mean GDP per capita was significantly lower than in less corrupt countries. It is not possible to make causal deductions based on these findings, but two alternative explanations can be given for the link between GDP per capita and government corruption. One is that government corruption harms the economic strength of countries, the other is that low economic environments foster corruption and motivate individuals who lack financial incentives and normative constrains to oppose corruption. Inequality does not appear to vary significantly between countries as a function of government corruption level.
Independent t-Test Results: Comparison Between Countries With High And Low Government Corruption Levels.
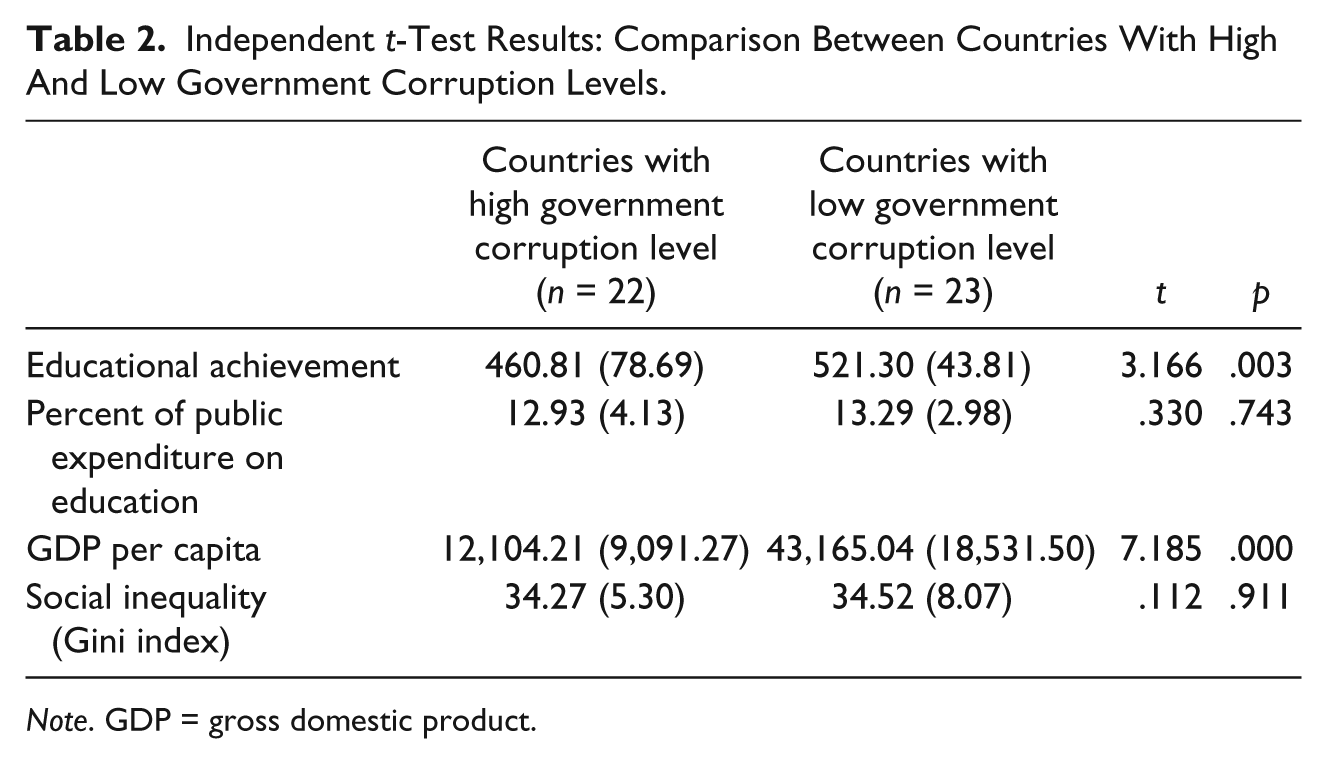
Note. GDP = gross domestic product.
Next, a regression analysis was performed to determine the extent to which government corruption may be viewed as a predictor of educational achievement, and whether an interactive effect exists between the percent of public expenditure on education and government corruption on educational achievement (see Table 3). In the first step, GDP per capita was entered as a predictor of educational achievement, and it accounted for 16% of the variance in the criterion variable F(1, 43) = 8.383, p < .01. In the second step, government corruption, percent of public expenditure on education, and their interaction were added to the regression. The second model emerged as a significant improvement over the first, Fchange(3, 40) = 3.202, p < .05, and accounted for 32% of the variance in educational achievement, F(4, 40) = 4.819, p < .01. The results indicate that government corruption negatively predicted educational achievement (p < .05), supporting Hypothesis 1. Furthermore, the results of the regression analysis indicate that the interaction between the percent of public expenditure on education and government corruption marginally predicted educational achievement (p < .1), supporting Hypothesis 2.
Multiple Regression Analyses of Interaction Between Educational Achievement and Predictors.
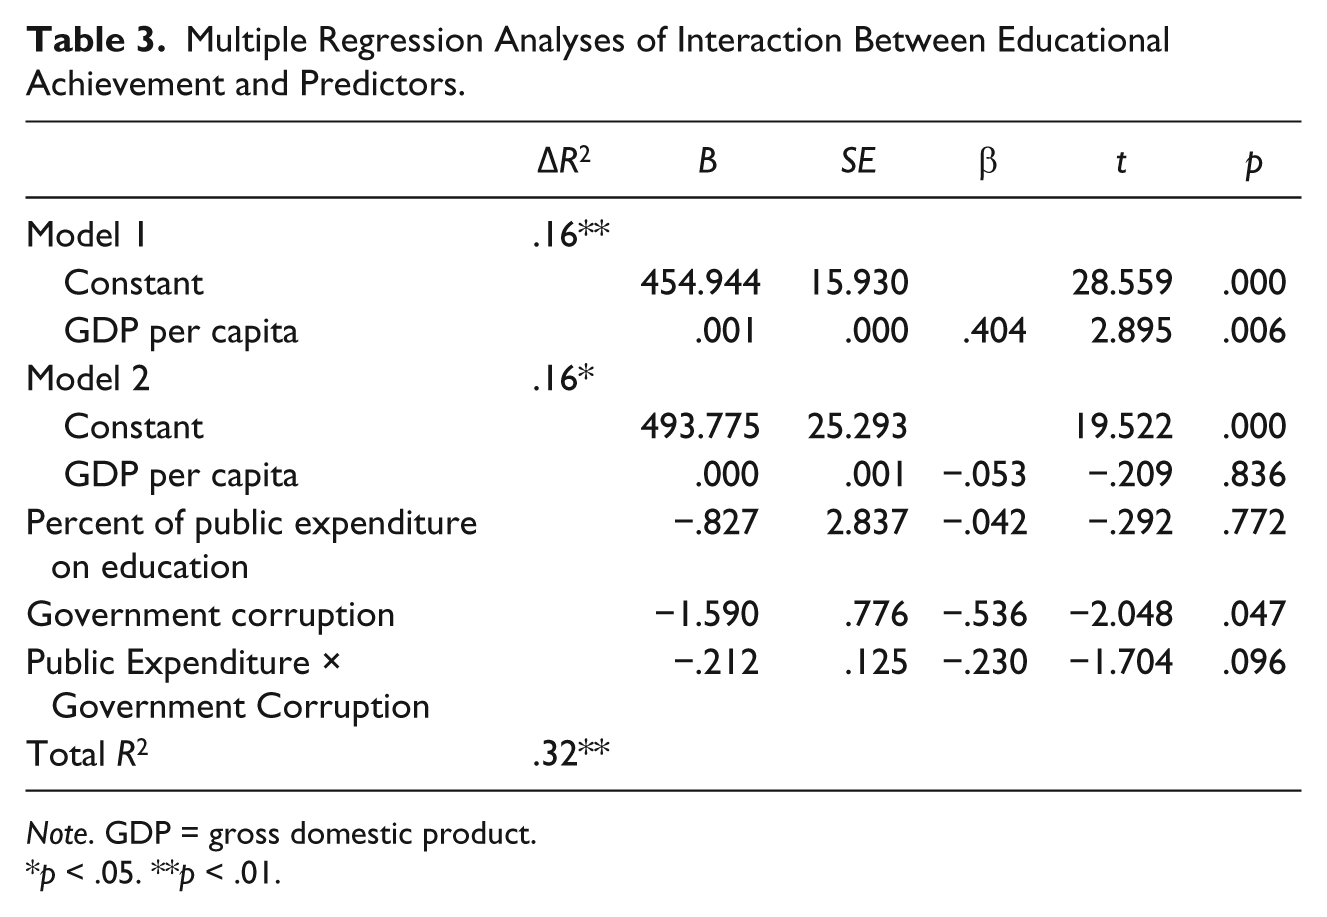
Note. GDP = gross domestic product.
p < .05. **p < .01.
Next, the interaction effect was plotted according to the Aiken and West (1991) procedure. Regression lines were calculated at high and low levels of government corruption (+1 SD above and −1 SD below mean), as recommended for reducing biases in coefficients. Figure 2 shows the nature of the interaction effect. For countries with low government corruption level, a positive correlation was found between public expenditure on education (as a percentage of government expenditure) and educational achievement; for countries with high government corruption level, this relationship was negative. Despite the significance, the level of the interaction effect was marginal; thus this finding deserves cautious attention. Note that the sample size limitation, which is inherent in international comparative analysis, makes it more difficult to reach statistically robust findings, but the present sample includes about a quarter of the countries in the world.
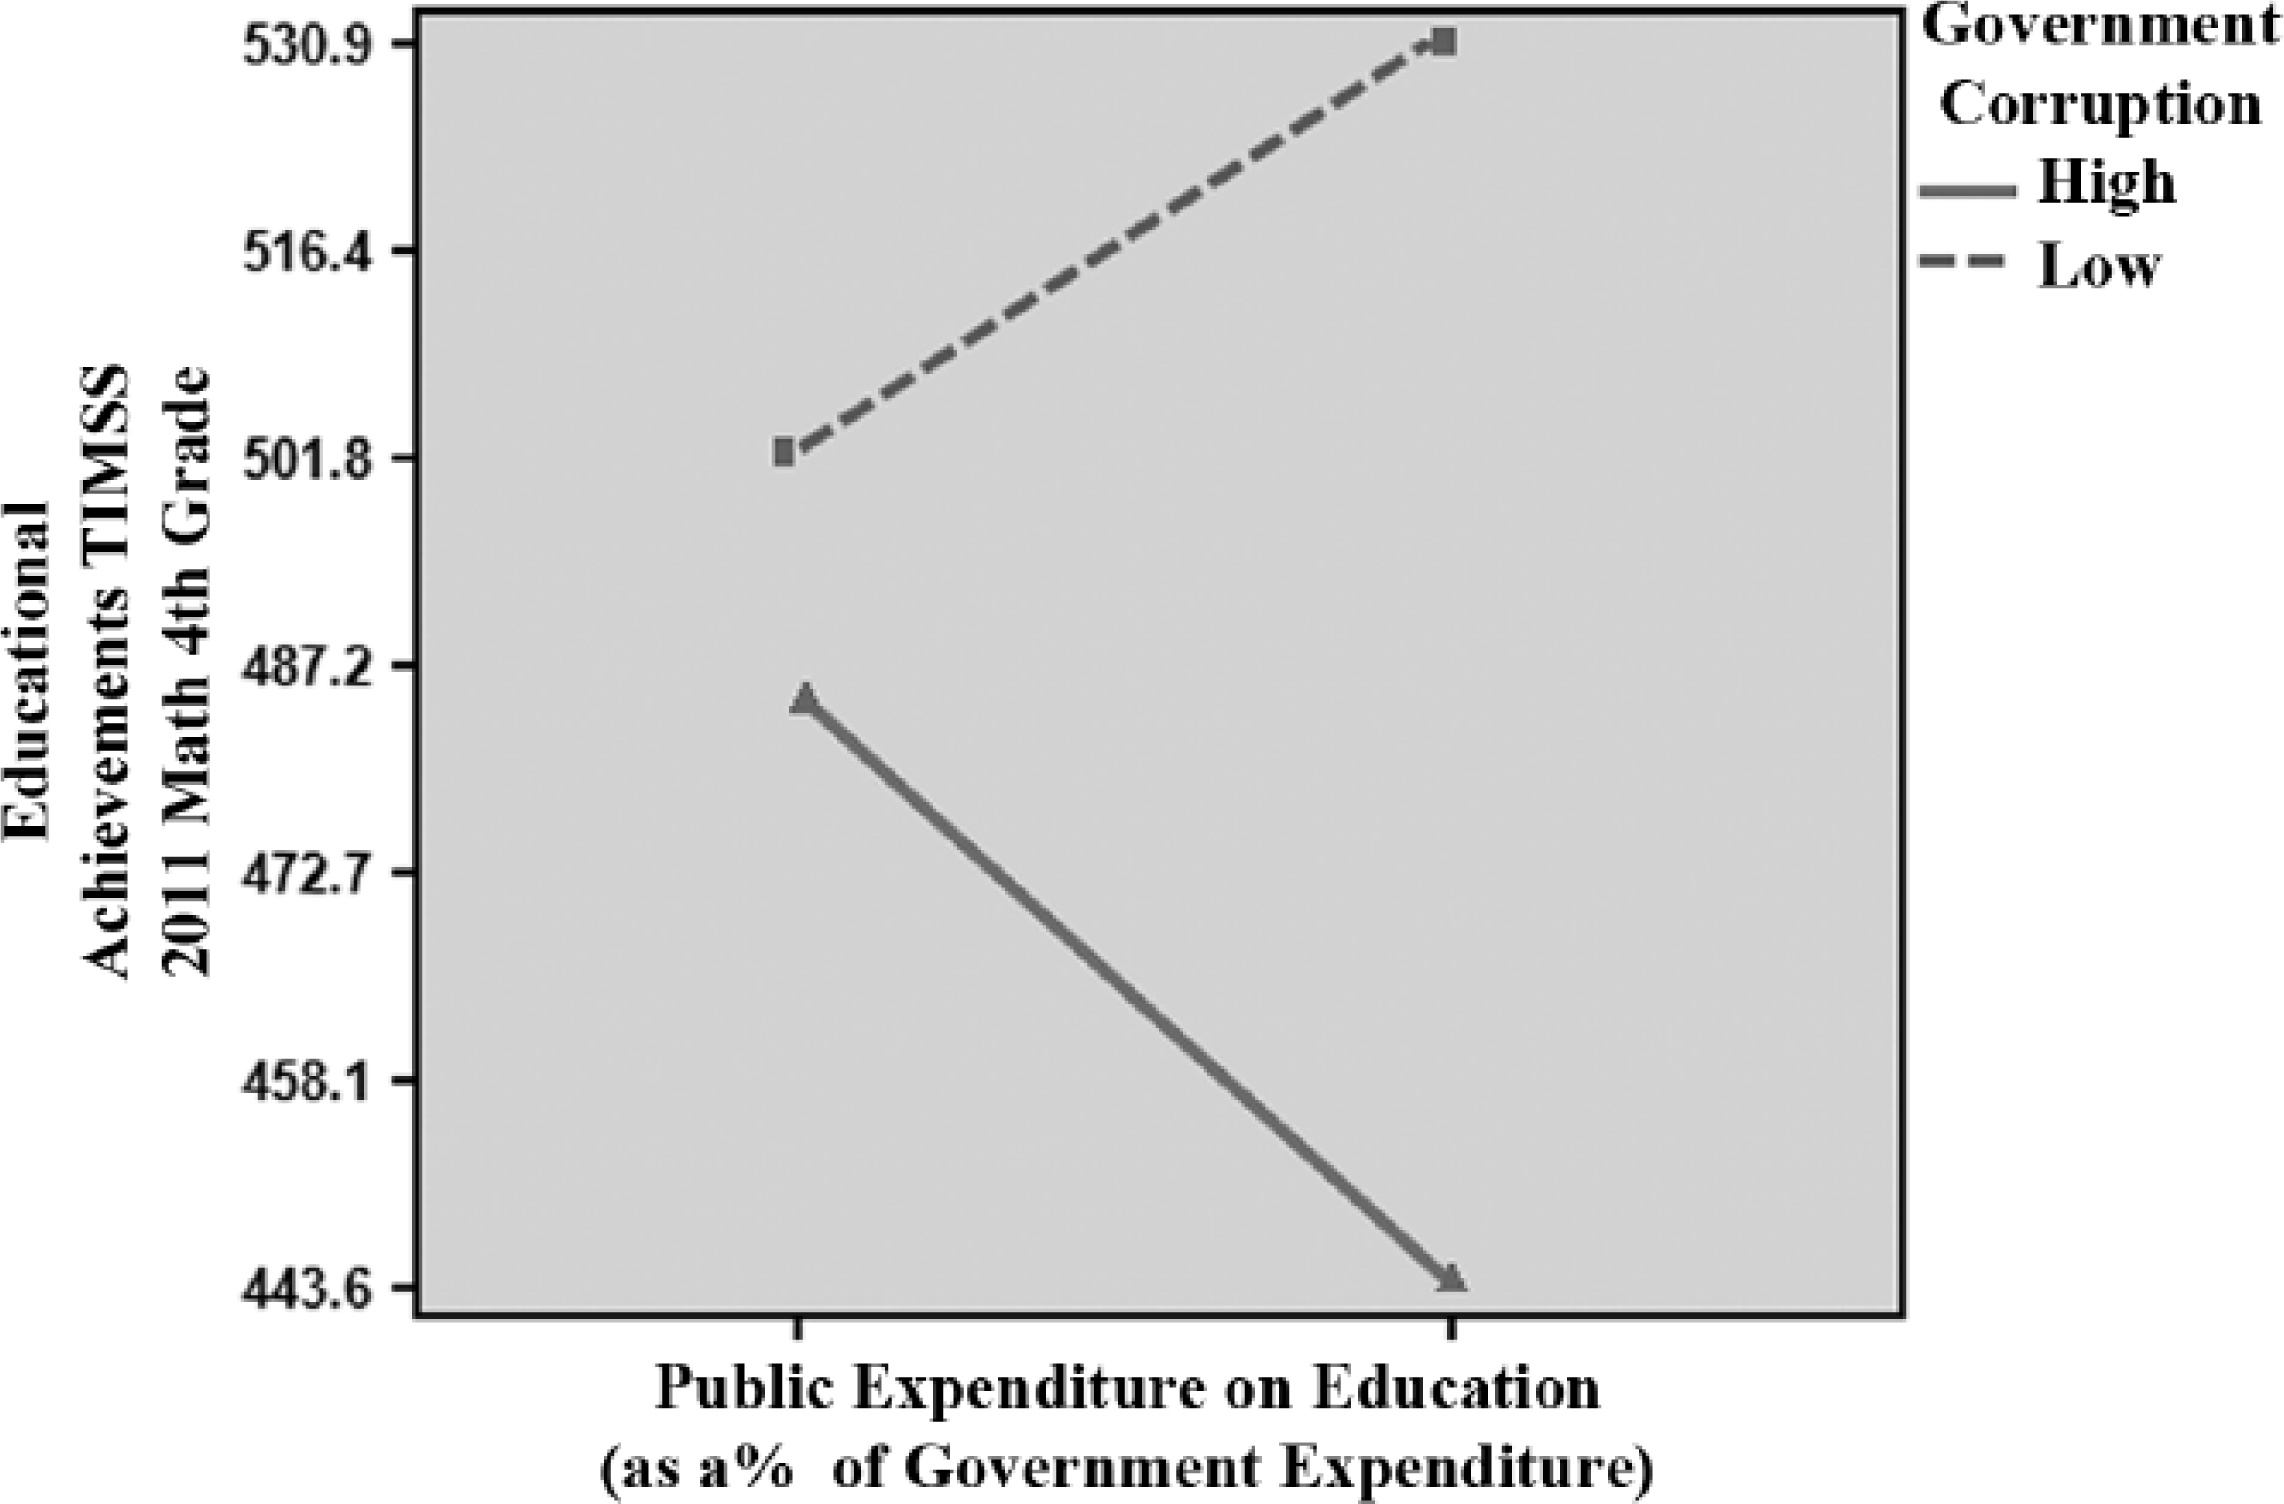
The moderating effect of government corruption on the relationship between public expenditure on education and educational quality.
Discussion
The commitment of government to promoting public interests and to ensuring the effectiveness of public services is the cornerstone of its legitimacy. But to date our understanding of the relationship between the two was limited by a lack of comparable data, adequate effectiveness measurers, and a suitable theory, particularly in circumstances in the presence of a corrupt government industry. To address these issues, the present cross-country study explored the operation of a corrupt industry. The findings suggest that institutionalized government corruption fueled by extensive public funds in a public system of a classic CPLC design results in decreased public service effectiveness (the wagon-wheel effect). The study is among the first to conceptualize and document this effect in the public administration literature, and as such it has valuable theoretical and practical implications for researchers and policymakers.
The theory developed in this article outlines the operation of a corrupt public industry. First, the study emphasizes the need for a greater differentiation between sporadic and institutionalized corruption, and shows that the two types operate in a different manner and have different outcomes. Embracing this differential viewpoint can produce important insights about the antecedents and remedies linked with manifestations of government corruption. Sporadic government corruption is a hidden problem of “bad apples” and “bad barrels,” which if detected can be removed from the system. By contrast, institutionalized government corruption is a visible phenomenon and a much more profound one, because corruption becomes entrenched within many actors, levels, and processes. Institutionalized government corruption undermines the ability of governmental services to serve as “public goods” (Heyneman, 2011), because corrupt use of services harms others’ ability to use them and to enjoy full access, equity, and quality (Heyneman, 2009). Additional research on these two manifestations of government corruption and on the relations between them would be beneficial.
Second, the cross-country nature of the study offers a new understanding of government corruption, which may contribute to viewing corruption not merely as a given state but also as a process. The secretive manner in which corruption occurs, and the absence of tools that can accurately assess its scope, frequently limit our understanding of the phenomenon. But because “corruption is both a state and a process” (Ashforth et al., 2008, p. 671), there is great significance to understanding how government corruption operates. The operation and its outcomes can serve as important indicators of the scope of government corruption. The wagon-wheel effect discovered by the present research suggests that institutionalized government corruption can run deep and “eat away” at the core processes of the public system. This finding supports prior claims that institutionalized government corruption operates in a virus-like, “infective” manner, with expanding circles of influence (Ashforth et al., 2008). A possible description of such a transition from sporadic to institutionalized corruption may involve a change in the situation from one in which corrupt acts occurs in a few peripheral organizational operations to one in which they are embedded into all aspects of organizational operation. Thus, it may be beneficial to explore the transition from sporadic to institutionalized corruption. Such investigation may be especially productive in countries where a centralist regime has collapsed or where growing pressures are placed on individual success, because these contexts are said to increase the likelihood of this transition (Heyneman, 2011).
Third, the present study contributes specifically to the understanding of how institutionalized corruption affects the effectiveness of educational services. Moreover, the theory introduced in this article may shed light on the probable economic costs of institutionalized corruption in education. Education is said to develop knowledge and skills (i.e., human capital) that result in favorable economic outcomes both for society as a whole and for individuals (Becker, 1993; Lutz & Samir, 2011). However, it appears that the effects of corruption in education on economic outcomes may be less obvious when the unit of analysis is society as a whole (Osipian, 2012). Perhaps because other factors, such as natural resources, also influence the national economy. By contrast, at the individual level of analysis these effects are more direct. In education, even the mere perception of a corrupt system is harmful, because individuals are often denied the social advantages associated with the education (Heyneman, 2013). Heyneman, Anderson, and Nuraliyeva (2008) find that when corruption is prevalent, educated individuals are less likely to earn high income in high-income countries, and are more likely to be poor in lower-income countries. Integrating these findings with those of the present article suggests that the future economic costs of institutionalized government corruption in education on knowledge economics, in which human capital is among the primary means of production, and on educated individuals are not fixed. These costs may vary as a result of policymakers’ actions that influence the level of public funds allocated to the national education systems or of the levels of CPLC elements in the system design. Therefore, further exploration of the implications of the present theory for the economic costs of corruption in education may be valuable.
Practical Implications
The conceptualization of corrupt industry operation (Figure 1) suggests several courses of action that have the potential to constrain and eliminate the wagon-wheel effect in public systems. Although each apex of the triangle can be addressed individually, it is not recommended that governments reduce spending on public services, such as education, or reduce its priority, because if the additional resources are used effectively they can contribute greatly to the social and economic strength of the country. Thus, in practice, it makes sense to address only two apexes in an attempt to promote public service effectiveness.
One course of action is based on altering the classic CPLC design of the public system. This effort must include a variety of measures, including on one hand structure management to reduce autonomy, and on the other legislation of new anti-corruption laws and their enforcement with strict penalties (Lange, 2008). Lewis (2006) makes several suggestions for re-coupling the loose couplings of the public system in the case of governmental corruption. For example, he suggests making the compensation of professionals proportional with the time they spend on servicing their clients. He also suggests limiting political influences on the system by setting clear criteria for hiring and promotion, and by initiating centralized hiring, promotion, and deployment mechanisms that neutralize undesirable local variability. Other scholars suggest structural reforms enabling autonomous external audits of the system and public oversight of system management, to limit the configurational nature of the public system, thereby limiting the effects of corruption on service (Heyneman, 2004). For example, prior research indicates that a newspaper information campaign regarding the allocation of resources is an effective means of promoting public monitoring of funds (Reinikka & Svensson, 2005). For the purpose of improving service delivery and its effectiveness, it is necessary to have better data on performance, transparent data on resource allocations by government, and a more direct allocation system that bypasses the intermediate levels (Lewis, 2006). Therefore, as the likelihood of being caught increases, so does the deterrence against corrupt behavior.
Another possible course of action is the de-institutionalizing of corruption, which involves also breaking the normalization process of corruption in the public system. The literature identifies reciprocal reinforcing processes that foster the normalization of corruption (Ashforth & Anand, 2003). Two of these processes can be resisted by public leaders determined to reduce corruption: the rationalization of corruption by employees, as they develop ideologies to justify corruption; and socialization of newcomers, when they are encouraged to regard corruption as desirable. In this regard, ethics education can be valuable (Piotrowski, 2014), as it defines new work norms. For example, Heyneman (2004) describes the practices of a corruption-free education system as ensuring (a) equal access to services; (b) fair distribution of educational materials; (c) transparency in the selection and training of professionals; (d) fair accreditation of institutions, (e) professional conduct of civil service employees; (f) fairness in the acquisition of educational services; and (g) just treatment of cultural minorities. De-institutionalizing corruption changes it from a commonly accepted practice into a deviant one that is associated with individual propensities (Méon & Weill, 2010). When corruption returns to being a sporadic phenomenon, the effect of corrupt individuals and groups on system effectiveness is limited, and corrupt individuals can be removed from the system if detected.
In sum, when the public service industry is corrupt, additional funds injected into the system must be accompanied by measures that address the two other aspects in the corrupt industry operation triangle: classic CPLC design and institutionalized corruption. This solution is consistent with the growing recognition of corruption as a complex phenomenon that is the result of the interaction between multiple factors (Misangyi, Weaver, & Elms, 2008).
Limitations and Further Research
The current research has several shortcomings. One limitation is that perceptions of corruption are not accurate accounts of actual corruption because factors such as national democratic or religious traditions can influence the manner in which corruption is perceived (Donchev & Ujhelyi, 2013). As new comparative means of accounting for corruption develop, it may be beneficial to replicate this study. Another shortcoming has to do with the focus on the education system, which can be conceived as having a more pronounced CPLC design than other public services, for example, the health care system. Although key actors in both systems can be regarded as semi-professionals (Etzioni, 1969), it is possible to argue that education is more political and involves more abstract processes and outcomes (Elboim-Dror, 1971) than does health care. Therefore, future research should focus on comparing different public service systems and finding uncompounded indicators for the effectiveness of diverse public services. One last important shortcoming is related to the cross-sectional design of the study, which limits the possibility of causal inferences that can be made from the study and requires caution in interpreting the findings. Future research may benefit from focusing on selected national contexts and accounting for the influences over time. Keeping this limitation in mind, however, the present study provides a conceptual framework for the study of the operation of a corrupt public industry, and as such opens the door for future explorations.
Footnotes
Appendix
List of Countries by Government Corruption Level.
| Countries with low government corruption | Countries with high government corruption | ||
|---|---|---|---|
| 1 | Australia | 1 | Armenia |
| 2 | Austria | 2 | Azerbaijan |
| 3 | Belgium | 3 | Bahrain |
| 4 | Chile | 4 | Croatia |
| 5 | Denmark | 5 | Czech Republic |
| 6 | Finland | 6 | Georgia |
| 7 | Germany | 7 | Hungary |
| 8 | Hong Kong SAR, China | 8 | Islamic Republic of Iran |
| 9 | Ireland | 9 | Italy |
| 10 | Japan | 10 | Kazakhstan |
| 11 | Malta | 11 | Republic of Korea |
| 12 | Netherlands | 12 | Lithuania |
| 13 | New Zealand | 13 | Morocco |
| 14 | Norway | 14 | Oman |
| 15 | Poland | 15 | Romania |
| 16 | Portugal | 16 | Russian Federation |
| 17 | Qatar | 17 | Saudi Arabia |
| 18 | Singapore | 18 | Serbia |
| 19 | Slovenia | 19 | Slovak Republic |
| 20 | Spain | 20 | Thailand |
| 21 | Sweden | 21 | Tunisia |
| 22 | The United Kingdom | 22 | Republic of Yemen |
| 23 | The United States |
Declaration of Conflicting Interests
The author(s) declared no potential conflicts of interest with respect to the research, authorship, and/or publication of this article.
Funding
The author(s) received no financial support for the research, authorship, and/or publication of this article.