



Abstract
Studies of the effects of class attendance on class performance typically are quasi-experimental because students choose whether or not to attend class; that is, the samples are self-selecting. The lack of random assignment prevents one from establishing a causal relationship between attendance and performance. Relating attendance to performance using the students in a research methods class, regardless of whether the data show a significant relationship, can serve as the basis of a discussion of quasi experiments and the alternative explanations that are inherent in their design. This article gives suggestions for presenting and discussing the data.
“80% of success is showing up.”
An important distinction that is made in most research methods textbooks is that between true experiments, which are marked by random assignment of participants to different experimental conditions, and quasi experiments, which usually lack random assignment. Because of the lack of random assignment, quasi experiments often carry threats to their internal validity, which provide alternative explanations for differences in the dependent variable between groups. This article describes an example of a quasi experiment that is particularly relevant to students and that typically generates substantial discussion: a study of the relationship between class attendance and class performance. One of my former teaching assistants dubbed the two groups attenders and slackers, terms which I have continued to use.
Intuitively, it seems that attending class would contribute to improved performance, and studies generally have shown a positive correlation between class attendance and performance (e.g., Jones, 1984; Launius, 1997; Van Blerkom, 2001; Vidler, 1980). However, it is difficult to directly manipulate attendance in a real classroom. As a result, research on attendance and performance is usually correlational and cannot reveal a causal relationship between the variables. Golding (2011) reviewed a small number of experimental studies in which attendance was manipulated indirectly through use of a classroom attendance policy and found that increased attendance was not always associated with improved performance.
This article is not concerned specifically with the relationship between attendance and performance, but rather, with its use as the basis of a demonstration of quasi-experimental research. My goal is to present a quasi experiment that has numerous inherent shortcomings and then to encourage students to identify the shortcomings and to suggest improvements in the research design. In the demonstration, I take attendance during one lecture of my research methods course, and then I compare the current performance of attenders and slackers. One appealing aspect of this example is that it “works” in most semesters in that attenders typically perform significantly better than slackers, consistent with the correlational research cited previously. However, even when the differences between attenders and slackers are not statistically significant, the example readily lends itself to a discussion of the limitations of interpreting quasi experiments.
Demonstration
At the end of my first lecture covering quasi experiments, I tell my students that one aspect of teaching a course in research methods that I particularly enjoy is the fact that almost any instance of behavior that interests me can be made into a classroom example. In this case, I tell students that I believe that my lectures lead to greater learning. It is important to phrase the claim as “my lectures increase learning” rather than “attendance improves performance” because the former introduces problems in the interpretation of the results that students subsequently can identify. I suggest to the students that one way to test my hypothesis is to take attendance, which I do not normally do, and to compare the performance of students who are present to the performance of those who are absent. At this point, I leave the details of the prediction and methodology as vague as possible to allow room for later discussion. I ask that each student write his or her name on a piece of paper and deposit it in a box on the way out of the lecture hall. After posing the question, I usually receive some bemused looks from students, who seem to realize that I am putting myself on the spot by directly questioning the efficacy of my lectures.
Data Analysis
Final grades in my course are based on a weighted combination of scores on many different activities, not all of which are scored by the same person. Exam points make up a large proportion of a student’s grade, so I will focus on those data here. (More specifically, all students in the course register for a single large lecture section and one of 10–14 smaller lab sections. Students’ final grades are based on points accumulated in both lecture and lab. Exam scores make up 37.5% of the final grade, but exams account for 94% of the available points that are based on lecture material as opposed to lab material.) I have found that performance measures from many different types of course activities reveal differences between attenders and slackers, but it is not even necessary for differences to exist in order for the classroom discussion of this demonstration to be fruitful.
In the lecture after the one in which I take attendance to determine attenders and slackers, I present the means and standard deviations of both groups. I also report t and p values to compare the group means. For example, Table 1 shows mean point totals for all exams (of the 450 possible points) for attenders and slackers in the last nine semesters and the results of the t-tests testing the differences. (The tabled p values are for one-tailed tests for the case in which the alternative hypothesis states that my lectures improve performance for attenders.) The data in Table 1 cover all exams in each semester, but because I make the comparison midsemester, I am able to include data from only two or three exams.
Comparison of the Mean Total Points on All Exams for Attenders and Slackers by Semester.

Usually, when I discuss the data midway through the semester, the mean difference between attenders and slackers is statistically significant, but rather small and perhaps unimpressive (the largest difference in Table 1 amounts to about 5% of the possible points). Several years ago, a student asked that I show grade distributions for attenders and slackers. I now also display the numbers of attenders and slackers who would receive each letter grade if final grades were assigned at that point in the semester, and I show histograms of the percentages of attenders and slackers who would receive each letter grade (see Figure 1). (Instructors may not want to show the data in this way if their classes are so small that students will learn the letter grades that specific students are earning.) I also report the chi-square statistic and p value to test the difference between these distributions. The histogram shows the half grades grouped together (e.g., B−, B, and B+) for visual clarity, but I show numerical totals for the 11 individual grade categories to the students and I compute the chi-square statistic for those distributions. The differences between the distributions usually are statistically significant, and the visual differences between the histograms seem to be more salient to the students than the mean point differences of Table 1. Overall, the students seem to be particularly interested in the data, perhaps because it involves their actual performance in the class and it indicates (and I play up the idea) that they, the attenders, are in some way superior to the slackers.
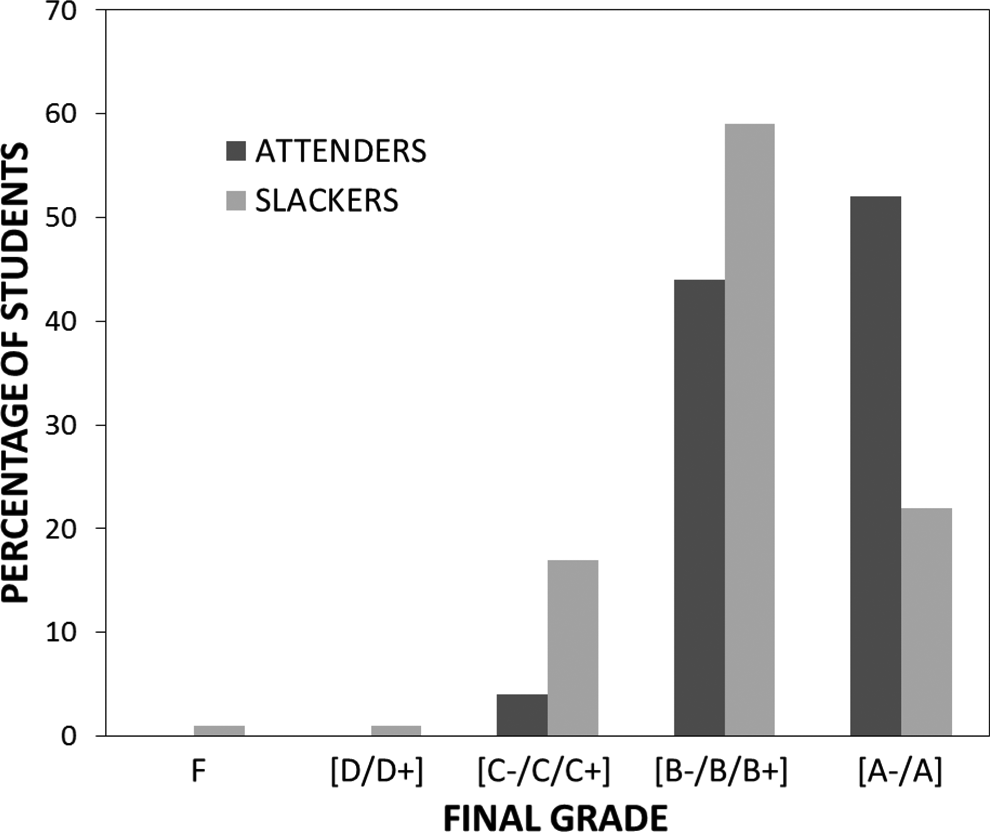
Percentages of attenders and slackers who received final grades in each indicated range in the spring semester of 2012.
Classroom Discussion
After showing the data, I tell the students that my conclusion is that my lectures increase learning (assuming that the results favor that interpretation). I then ask the students what is wrong with that conclusion and they readily identify many problems. The biggest problem is that the samples were self-selecting. The attenders chose to attend the lecture and slackers chose not to attend. This raises a problem for the interpretation of the results because there may be some characteristic of students who chose to attend class that is different from those who did not. That characteristic, rather than the lectures themselves, might determine performance in the class. For example, students are quick to point out that attenders simply may be better students or they may be more concerned about doing well in their classes, which causes them to study harder. In other words, it is possible that the people categorized as attenders would perform better than slackers even if the attenders also did not attend lectures. Related to this point is the fact that my claim refers to “learning,” which implies an increase in performance from before to after the lectures, whereas my dependent measure reflects static performance measured only after the lectures. If I want to show that learning has occurred, I would have to show a change in performance from a pretest given before the lectures to a posttest given afterward, particularly because we potentially are studying nonequivalent self-selecting groups.
Students usually also identify other problems in the methodology and interpretation, such as the fact that the operational definition of “attendance” is based on self-report during only one lecture, which may not be appropriate for distinguishing between attenders and slackers. For example, maybe someone who was present when attendance was taken missed most of the previous lectures and was more of a slacker, or a student who was present might have left early and did not place his or her name in the attendance box. A possible solution to this problem is to count the number of lectures that a student attends rather than taking attendance in only one lecture. However, this may become problematic if students know that their attendance is being monitored and they alter their attendance behavior in response.
There are also problems associated with the use of any measure of attendance to support my hypothesis. My hypothesis was that my lecture (implicitly, cognitive processing of my lecture) improves performance. However, my measure of attendance merely measures the physical presence of a student in the lecture hall. Students may be present but may not actually pay attention to the lecture because they are doing something else, such as listening to music, using Facebook, or sleeping.
Even if the difference between attenders and slackers is not statistically significant (although at least the trend has always been in the predicted direction), there is ample potential to discuss the methodology and interpretation. For example, if I do fail to find a significant difference, I simply say that it seems that my lectures have no effect on student performance and we are all wasting our time by coming to lecture (this probably is at least as amusing to students as when the difference is significant, and students seem to appreciate my candor in suggesting this interpretation). Students usually easily identify problems with this interpretation as well. For example, in addition to the points noted above, students often suggest that attenders may have performed better as a result of attending lectures than they would have if they had not attended. In other words, attenders might have a learning style that causes them to learn more effectively by experiencing the lecture and slackers might benefit more from reading the book and learning on their own. This could lead to further discussion of how one might test the notion of learning styles. (See Pashler, McDaniel, Rohrer, and Bjork [2009] for material to support a discussion of the concept of learning styles and its experimental validation.)
In fact, whether or not the attender–slacker difference is significant, it is instructional to discuss the interpretation of both possible results. The bottom line is that because of the differences between attenders and slackers that might cause them to attend or slack, we cannot conclude anything from this comparison about the effects of my lectures on student performance.
I then ask students to tell me what would be the correct way to test my hypothesis. Usually, students correctly indicate that I would have to randomly assign students to attend or not attend lecture. Through random assignment, the characteristics that distinguish those who otherwise would choose to attend or slack will be distributed across the two groups. (Furthermore, we would need to ensure that those chosen to attend actually do so, or we would have nearly the same situation as in our quasi experiment.) We then discuss the fact that random assignment would be difficult to implement in a real classroom, which is why testing this type of question usually requires a quasi experiment.
A final question for discussion is: How can students apply the results of this quasi experiment to themselves? When attenders perform significantly better than slackers, we have evidence of a real performance difference between the groups. The problem lies in identifying the cause of that difference. Whatever the cause, should this result lead students to change their behavior in some way? If my lectures really do cause better performance, students who want to perform better in the course should attend lectures. On the other hand, if there is some other characteristic of attenders that results in superior performance, maybe simply by acting like an attender and doing the things attenders do, a student can improve his or her academic performance. In other words, by behaving like an attender, one might start to perform like an attender. Regardless of the explanation for the relationship between attendance and performance, students have to ask themselves if it is worth taking the chance of having their performance suffer by slacking. This may be a situation in which it is beneficial to take advantage of the correlation even if the underlying cause is not completely understood.
Final Points
To conduct a robust comparison between attenders and slackers that is more likely to work in your favor, it is probably best to maximize the number of slackers. Therefore, I suspect that this demonstration is most likely to be effective in large lecture sections, in which students might feel more anonymous and students might believe that slacking will be less noticeable. If a class is too small to facilitate an attender–slacker comparison, readers can use the data in this article that were collected at “a large Midwestern university.”
One way to provide evidence that this demonstration is effective would be to show that attenders answer more exam questions about quasi-experiments and random assignment correctly than slackers. This logic, of course, would be circular because we already know that attenders usually perform better than slackers on exams, and better performance on questions related to quasi experiments might be attributable to the same explanations that arise in our in-class discussion. Likewise, I could survey students to ask them if the demonstration was instructional, but, again, I would only obtain responses from attenders. Furthermore, Wesp and Miele (2008) point out that student opinions of the effectiveness of teaching activities generally are uncorrelated with subsequent exam performance. However, it is interesting to note that on one course evaluation, I received a comment that the attender–slacker comparison, which I update throughout the semester as students complete more coursework, was “bogus” because it was based on attendance in only one lecture. Given that I acknowledged that fact in our original discussion, I can only conclude that the comment was made by a slacker who independently deduced one of the points of the demonstration.
Footnotes
Declaration of Conflicting Interests
The author declared no potential conflicts of interest with respect to the research, authorship, and/or publication of this article.
Funding
The author received no financial support for the research, authorship, and/or publication of this article.