



Abstract
This article reviews PsyToolkit, a free web-based service designed for setting up, running, and analyzing online questionnaires and reaction-time (RT) experiments. It comes with extensive documentation, videos, lessons, and libraries of free-to-use psychological scales and RT experiments. It provides an elaborate interactive environment to use (or modify) the existing questionnaires and experiments from the PsyToolkit library or to design new studies. Once users have set up their study, they can recruit participants for online participation, and data can be downloaded in spreadsheet format after collection. This article provides examples of how questionnaires and RT experiments can be set up using the website. The PsyToolkit links to online questionnaires and experiments, and these links can easily be embedded in social media networks for participant recruitment, including Amazon's Mechanical Turk. PsyToolkit’s exhaustive documentation enables students to work independently. This article finishes with pedagogical considerations.
Many psychological studies can or must be conducted on a computer, such as online questionnaires and cognitive psychological reaction-time (RT) experiments. Therefore, the teaching of psychology requires tools and student-appropriate documentation for the establishing, running, and analyzing of such studies. Even though a variety of software technologies can run online questionnaires, and some even online RT experiments, they are difficult to use in teaching psychology for a number of reasons. One limitation is cost, although this limitation can be overcome by using open source instead of commercial software (for a review of such software, see Mathôt, Schreij, & Theeuwes, 2012). A second limitation is the requirement of technical skills, which might form a barrier for students and staff. This limitation is less of an issue for online questionnaires than it is for online RT experiments. But even in the case of free online questionnaire tools, they do not easily satisfy more specific demands of psychology students, such as the randomization of the question order or a convenient way of scoring and giving feedback to participants about their test scores. Setting up online RT experiments is even more difficult for those without skills well beyond what can be expected from psychology students (or staff). One of the more popular online testing options, “Amazon’s Mechanical Turk (MTurk)” has been reviewed in this Journal (Johnson & Borden, 2012), yet has some limitations. It can only be used by users based in the United States, and the programming of an experiment measuring RTs in the millisecond range requires considerable experience with Internet technology (Johnson & Borden, 2012). This latter technical barrier is no different in other web-based solutions for programming RT experiments, such as jsPsych (De Leeuw, 2015). Nonetheless, MTurk is an excellent tool for recruiting participants, and there are users who combine Mturk (for recruitment) and PsyToolkit (for the online RT experiment part of the study).
The web-based resource PsyToolkit specifically aims to resolve financial and technical limitations in the following ways: (1) It is a free resource, (2) it is specifically designed for running online questionnaires and cognitive psychological experiments, (3) it is designed for a teaching environment, and (4) the technical barriers are minimal. For example, users do not need to understand the underlying computer technology necessary for running online studies nor do they need to have access to a separate web server for the web hosting of their online study. Such technical issues are handled automatically by the PsyToolkit web server. To facilitate online studies, PsyToolkit comes with its own ways of constructing online questionnaires and experiments. It also comes with examples of existing psychological scales and experiments, such that students can learn from these examples when implementing their own psychological questionnaires or experiments. It also comes with extensive online documentation and tutorials (including detailed instructional videos) to conduct studies from start to end.
The Website (www.psytoolkit.org)
To begin, there is a “lessons” section. To make the lessons accessible to a wide variety of psychology students (in both secondary and tertiary education), they are written without assumptions about psychological background knowledge. There are four different categories of lessons. Category 1 lessons are about general concepts used in cognitive psychological experiments and about basic computer technologies that cognitive psychologists often rely on. Category 2 lessons are about cognitive psychological paradigms (e.g., the Stroop, 1935, paradigm). These short lessons are basic demonstrations that focus on the psychological phenomena rather than on how to establish the experiment or the data analysis. Each of these lessons comes with a demonstration of the task which can run in all modern browsers (e.g., Google Chrome, Firefox, Internet Explorer) and that gives feedback about the user’s speed and/or accuracy. Category 3 lessons are about other software which can support setting up and analyzing cognitive psychological experiments (e.g., Inkscape, which is a free drawing program that is highly suitable for drawing visual stimuli). Finally, Category 4 lessons are for those who want to set up their own online questionnaires or experiments. These lessons take users through every step of the process with examples and video tutorials; these lessons elaborate on the design of the study, the creation of stimuli, the description of the experiments and questionnaires, data collection, storage, data download, and importing data into SPSS.
The second resource is the interactive user account system. Following registration, users can login and create their own online studies. Users can save and store multiple questionnaires and experiments, including participant data. They can also conduct online analyses, manage and monitor existing online studies, and share their developed studies with others. There is also a special interface for teachers to have easy access to their students’ accounts (students need to consent and sign up for this feature).
The third resource is a library of cognitive psychological experiments, which can be accessed without registration. Currently, the library includes more than 20 different paradigms, including popular paradigms such as the Stroop (1935) task, the N-back task (Kirchner, 1958), and visual search (Treisman, 1977). Each entry in this library comes with a short description, references, and a demonstration that can run in the browser. Each library experiment can be downloaded and modified in a user’s own PsyToolkit account.
The fourth resource is a library of psychological questionnaires. Currently, this library includes more than 80 different peer-reviewed scales. There is a short description about the background of the psychological trait or problem the scale is about, and there is a reference to the relevant literature. There are numerous scales for different subdisciplines of psychology, including scales for measuring the Big Five personality traits (e.g., the short Big Five Inventory [BFI-S], Lang et al., 2011), mental health issues (e.g., Clinically Useful Depression Outcome Scale, Zimmerman, Chelminski, McGlinchey, & Posternak, 2008), negative traits (e.g., the Buss–Perry Aggression Scale, Buss & Perry, 1992; the Problematic Internet Use Questionnaire, Demetrovics, Szeredi, & Rózsa, 2008), and handedness (which is practical in combination with certain RT experiments; Veale, 2014). Each of these questionnaires can be tried out without registration, and these questionnaires present users with feedback on their own score on the scale as well as the average scores in the population. Each of the scales shows the PsyToolkit questionnaire script that can be copied and pasted into a user’s own PsyToolkit account for the user’s own online research project. Each scale from the survey library can be changed or combined with other scales.
These libraries allow users to build their own online study using existing experiments and psychological questionnaire scales (i.e., “plug and play”). For example, a student might want to carry out a project about the relation between various aspects of executive control functions. The student can establish an online questionnaire, copy and paste the questionnaire code of the Cognitive Flexibility Scale (Martin & Rubin, 1995) or the Webexec (Buchanan et al., 2010), and then embed a task-switching experiment (e.g., using the alternative runs task-switching paradigm, Rogers & Monsell, 1995) to relate self-reported measures of executive control with RT data. Combining existing surveys and experiments from the library is simple to do, supporting students in addressing and exploring novel psychological questions using existing measures.
Creating an Online Survey With PsyToolkit
To give a feeling of how online surveys are setup, the following section will explain how to set up an online survey step-by-step. This information is also available on the PsyToolkit website. To establish a new study, users need to first register on the website. Registered users can login to the interactive web-browser interface of PsyToolkit and then select the option “create new survey” from the menu of options (on the left of the browser window, Figure 1A). After doing so, the user is presented with a page into which information about the new survey can be entered (Figure 1B). Entry fields on this website are typically accompanied by a round question mark button that links to an online explanation.
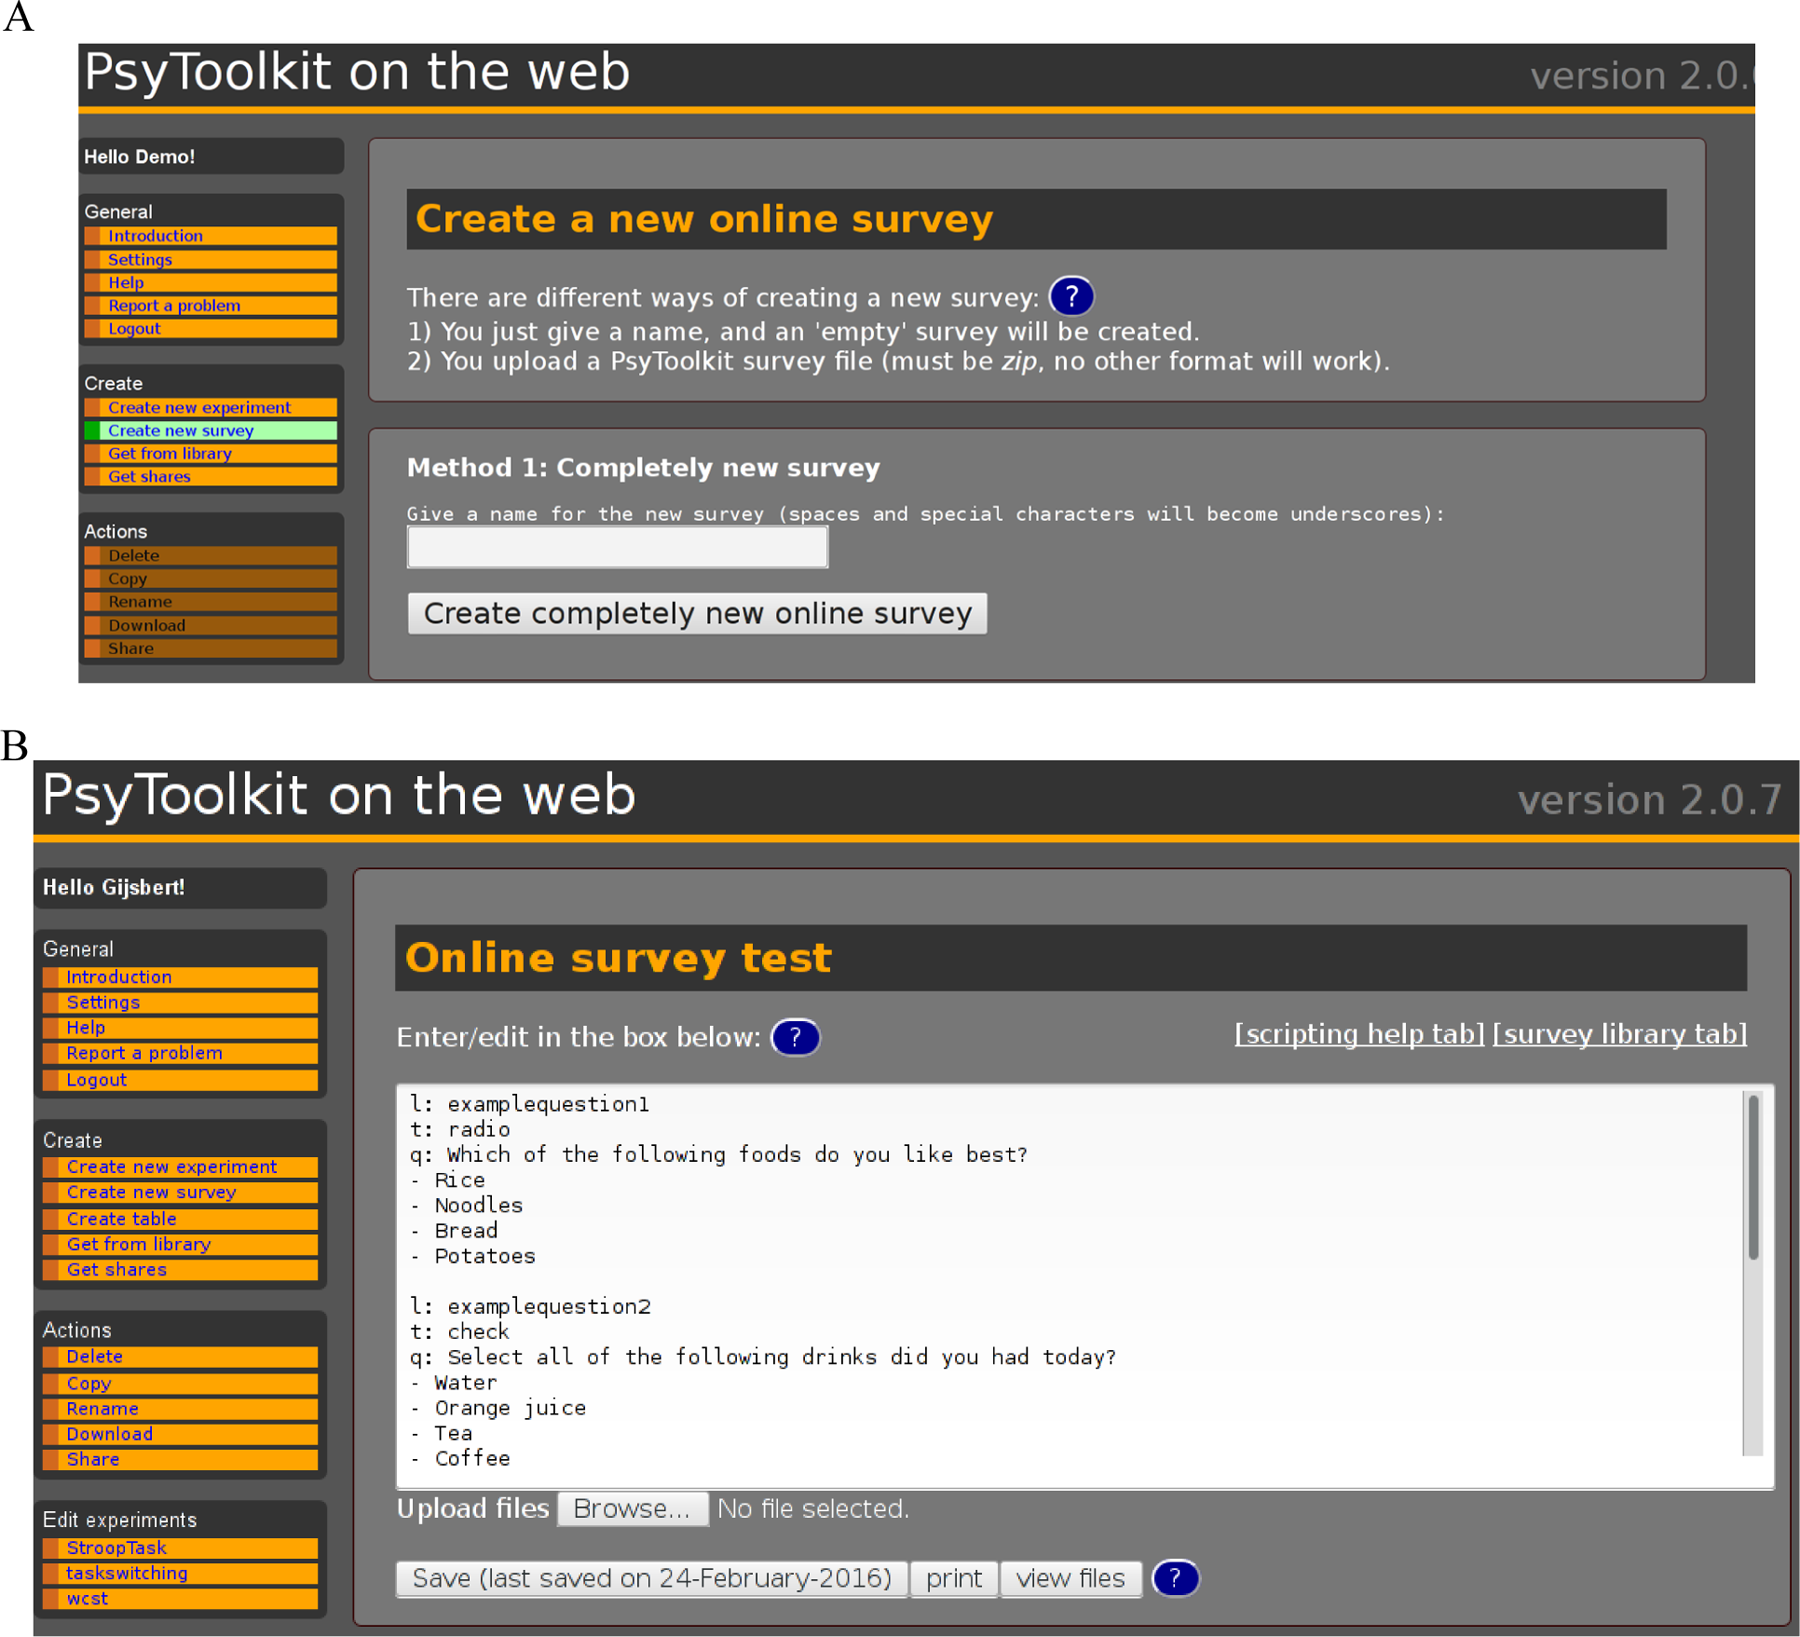
(A) Screen capture of the survey creation function. This screenshot shows how web-based functions are ordered in menus on the left of the browser window, whereas editable areas related to the function are on the right. (B) Screen capture of the survey edit function. The same organization is present, with functions on the left. Now, the online survey edit function is present right of the menu, with the two default questions presented in a new survey. An upload button is present for uploading survey-specific image files. The “scripting help tab” on the right opens a new browser tab with an online guide about PsyToolkit scripts. Note that only the top of the browser window is shown; however, there are more entry fields, such as, for example, for describing the online survey welcome screen.
The first of these entry fields is an editable “text area,” in which the survey script can be typed; surveys need to be entered in accordance with a simple “scripting language” specifically designed for PsyToolkit surveys (examples below). When a user creates a new survey, the text area will by default contain a few simple example questions written in this scripting language to give new users an impression of commonly used question types. Apart from the survey script, there are separate places to enter information for the welcome screen to be presented to online participants. The welcome screen can include a description about the study, researcher contact information, consent information, and so on. There are various other options for language (besides English, it has support for Arabic, Bulgarian, simplified Chinese, Danish, Dutch, Finnish, French, German, Greek, Hebrew, Hungarian, Italian, Norwegian, Polish, Portugese, Romanian, Russian, Spanish, and Turkish). Once the script and additional information have been entered via the PsyToolkit website, the user can click the “compile” button to create a working online questionnaire. The user then receives a link to the survey which can be advertised on social media (e.g., Facebook or Twitter), via e-mail, or in MTurk studies.
When users establish questionnaires, they need to type in the questions one by one (or copy and paste an existing questionnaire from the survey library). Thus, the whole questionnaire consists of a set of text lines, and each line tells the computer how to present the question on screen to the participants. Different questions are separated from one another by an empty line. Each question starts with the letter code l, followed by the label (i.e., identifier) of that question. The label is never seen by the participant of the survey but is purely for the person setting up and analyzing the survey. The label is used for a number of functions. First, it is used for representing the answers of participants in a downloadable spreadsheet. Each question label will be at the top of the output spreadsheet with the answers participants gave to the specific question. Second, other items in the survey scripting language can use the labels to calculate scores or to conditionally skip certain questions depending on the answers given (e.g., some questions might only be presented if the participant indicates to be of a certain age or gender).
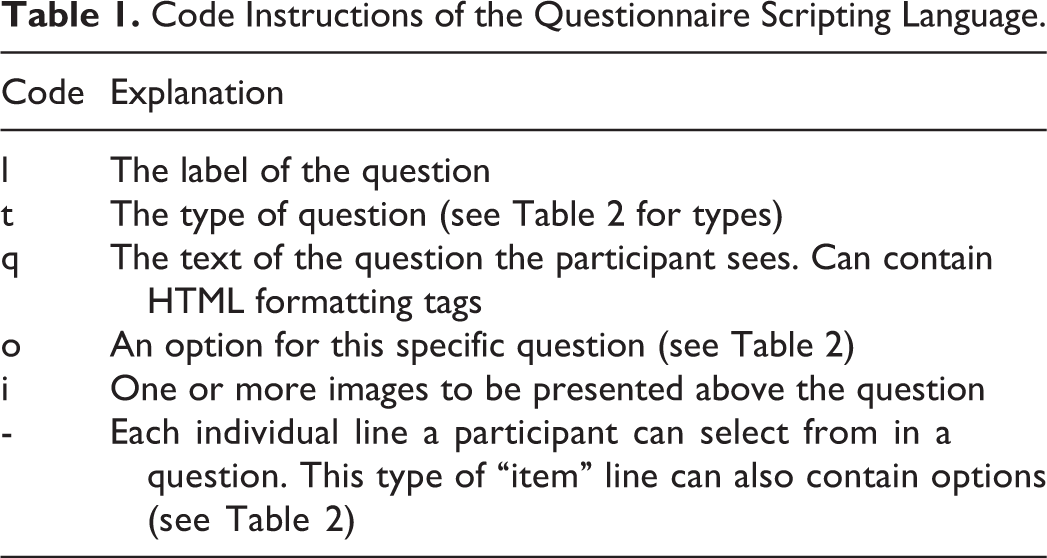
After the first line of the question specifying the label, the next line starts with the letter code t, followed by the “type” of the question. There are different types of questions (see Table 2 for all available types) and special items (such as videos or embedded RT experiments, see Table 2). One of the frequently used types is the “radio” question that allows users to select exactly one of the multiple options (the term radio is borrowed from computer science and refers to old style radios, which used to have arrays of buttons of which only one at the time could be pressed down). The next line starts with the letter code q, followed by the question text the participant will be presented with. All following lines starting with a “-” describe the different choice items a participant sees. Below is an example of a radio question (survey script Example 1; Figure 2) . The default scoring of this radio question scores rice as 1, noodles as 2, and so on. It is also possible to specify alternative scores with the optional “{score=value}” code in the lines describing the different options.
Code Instructions of the Questionnaire Scripting Language.
Question and Control Types in the Questionnaire Scripting Language.
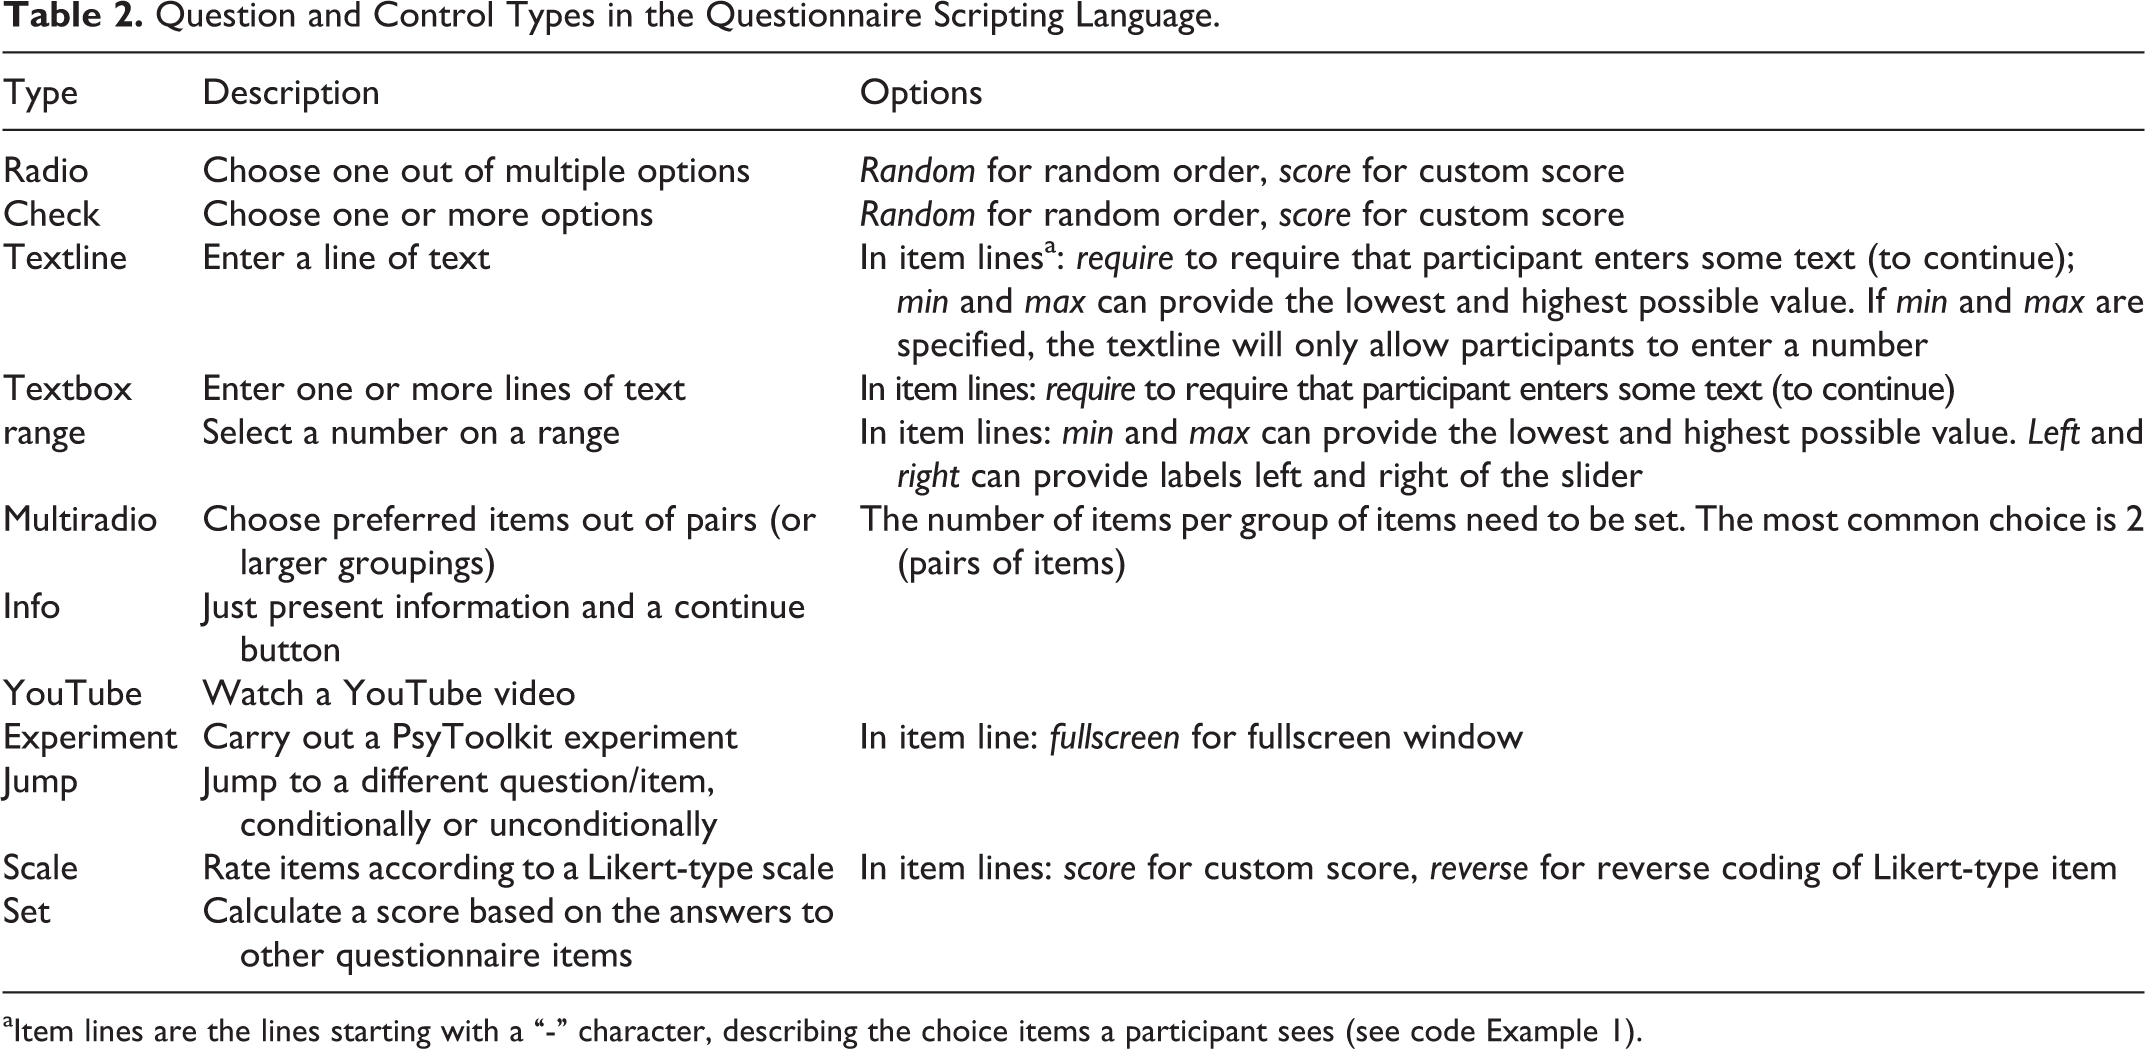
aItem lines are the lines starting with a “-” character, describing the choice items a participant sees (see code Example 1).

The way survey script Example 1 looks when a participant runs the questionnaire.
Survey script Example 1.
In contrast to the question type “radio”, the question type “check” allows participants to select one or more items from a list. The question type “scale” allows participants to rate items on a list according to a Likert-type scale. Likert-type scales can be defined separately using the “scale”: instruction. Each scale being used has a name and can be used in one or more scale questions (survey script Example 2). Users can customize the scoring method (which is in the survey script Example 2 is 1–3 for disagree, neutral, and agree, respectively), for example, by coding which item lines need to be reverse coded. All custom options need to be put in curly brackets.
Survey script Example 2:
The “textline” and “textbox” question types allow participants to enter answers using the keyboard, such as entering a name or e-mail. Special options are available to specify the number of lines available in these text boxes. For both these questionnaire item types, participants can be forced to enter some text before they can continue (using the require option, Table 2). The “range” question type allows participants to choose a number using a horizontal slider. The “multiradio” question type allows participants to select the preferred items of pairs (or triplets, etc.). This type of selection of preferred items from pairs of sentences is sometimes used in psychological scales, such as the 16-item Narcissistic Personality Inventory (Ames, Rose, & Anderson, 2006).
The survey scripting language also allows the presentation of special items, such as YouTube videos and embedded RT experiments. Embedding videos can be useful for studies in which a participant needs to watch a video clip followed by questions about their attitudes toward the viewed material.
Some elements in the survey scripting language are not for presenting information to participants but for scoring and selective presentation of questions depending on how earlier questions were answered. The type “set” can calculate a new numerical value based on the answers to previous questions. The type “jump” allows to jump to specific questions depending on how earlier questions were answered. For example, it is possible to ask a participant about their gender and then only present certain questions to participants who indicated to be female (code survey script Example 3).
Survey script Example 3:
The jump description is useful, although it can be considered somewhat of an advanced feature. In any case, it allows users to tailor questionnaires to the answers participants give. For example, some questions might only make sense for one gender. In the example above (survey script Example 3), if a participant answers male to the question about gender, this is coded as 1 and female is coded as 2. In a jump description, the dollar sign in front of a label represents the value of the answer to the corresponding question “gender.”
In addition to the codes used for describing the label, the question type, and the main question text, there is the o letter code to specify options (Table 2). For example, the “o: random” option will randomize the order of the choices in a question for each participant.
PsyToolkit will process questions and control items in the questionnaire description one by one. It is, however, possible to randomize the whole questionnaire or sections of the questionnaire. Questions between the lines “random: begin” and the “random: end” will be presented to the participant in random order. Finally, the scripting language allows to present images above questions. The i letter code followed by the name of the uploaded image will present an image above the question text. It is also possible to use images in the answers using the “{image=filename}” option in the lists of items. This latter option allows users to present, for example, emoticons instead of text answers (code survey script Example 4).
Survey script Example 4:
Once a user has created a questionnaire survey, the user can make the questionnaire available online (a unique Internet link will be provided). Users can monitor how many participants have completed the survey and which answers they have given. After data collection, users can also download the collected data as a spreadsheet file.
Creating an Online Experiment Embedded in an Online Questionnaire With PsyToolkit
PsyToolkit allows users to program RT experiments and to embed these in online questionnaires. This enables users to combine questionnaire scores with RT or accuracy data. Similarly to scripts which describe an online survey, there are scripts which describe an experiment (see Appendix for an annotated example). There are, for example, functions to show a stimulus, play a sound, and record the time (in milliseconds) it took the user to press a keyboard button (the details of the scripting language are described elsewhere, Stoet, 2010).
Users can create a new experiment, or they can copy an existing experiment from the experiment library. Most students who use PsyToolkit will start with copying an existing experiment from the experiment library. Students can easily modify the script, for example, to add more trials, to change the colors of stimuli, to change the duration of stimulus presentation, or the keyboard keys used by participants.
Once an experiment has been set up successfully, users can run it within the browser. By default, visual stimuli of experiments are displayed in a 800 × 600 pixels area of the screen (many desktop and laptop computer screens measure nowadays 1,920 × 1,080 pixels). There are options to change this resolution or to run experiments in full-screen mode. When the user has finished the experiment, a button underneath the experiment area will appear giving users the opportunity to view (and copy) the output data. There is also an option to save the produced output data to the user’s personal PsyToolkit account. This allows users to later analyze the data with the built-in website tools to do so or to download these raw data at a later date.
Users can analyze the RT and accuracy data within the website. For example, users can request the descriptive statistics of the RT and error rates for each experimental condition. The analyze section of the website shows output data in tabular format and can create basic figures representing the data.
The PsyToolkit webpage comes with tools to help with data analysis and further video documentation on how to analyze data. For example, the analyze section of experiments enable users to determine how data from experiments are averaged into the scores which can ultimately be viewed in the spreadsheet (all raw data files are available for download as well).
Pedagogical Considerations
There are different ways teachers currently use PsyToolkit in teaching psychology, varying from merely using it for demonstrating basic psychological scales or questionnaires to having students set up their empirical research project with PsyToolkit. For those teachers who just want to use it for demonstrations, no specific training is needed. Teachers can point to the link of the survey or experiment library to students. Texts are written in simple English, and links to other background resources are given (e.g., to YouTube videos with the authors speaking about the trait measured by a questionnaire, such as Marvin Zuckerman speaking about the sensation seeking trait).
Students can study the background information themselves, and if they have access to a university library, they can download the references provided. Most importantly, though, is that the students can fill in the questionnaire online and directly get a score themselves and learn how they compare to the general population (e.g., on sensation seeking). To the best of the author’s knowledge, the PsyToolkit experiment and questionnaire libraries are unique in that they provide background information as well as a useable online survey or experiment with direct feedback about scores.
Depending on the course being taught, teachers can also ask students to set up their own online questionnaire for an empirical research project. The advantage of this is that the documentation is extensive, and currently many students manage to set up their own studies using the online text and video tutorials. The author’s experience is that hundreds of students have succeeded in using the PsyToolkit website this way without demanding additional help from their teachers. The learning curve is no more severe than other commonly used software packages (e.g., SPSS or SurveyMonkey), and in some ways less severe, because this software has been specifically designed with psychology students in mind.
Teachers may wonder why they would choose PsyToolkit over other online questionnaire presenters. There are a couple of specific advantages. One reason is that the PsyToolkit website comes with an extensive library of surveys and experiments. This allows students to look at working examples, to use these examples, or to modify them. Further, PsyToolkit is designed with psychological surveys in mind, which means that commonly used questionnaire types (e.g., Likert-type scales) are very easy to set up, and question order can easily be randomized. Another reason for the special advantages of PsyToolkit is that it comes with various features that standard questionnaire presenters do not have, such as the easy integration of images in questions (e.g., emoticons), integration of videos, and multilingual support.
Finally, teachers who wish to employ PsyToolkit do not need to worry about technical difficulties—using PsyToolkit is straightforward and requires no specific training, unless teachers want to set up complex novel experiments from scratch. The latter is an option but might only reflect a small segment of the potential usage options of PsyToolkit.
Conclusions
PsyToolkit consists of a set of well-documented resources to run online psychological studies, including tools for online questionnaires and experiments. PsyToolkit is free of cost and aims to reduce the technical barrier of setting up online studies.
Footnotes
Appendix
Annotated example of an experiment script. This experiment is an implementation of a Simon’s (1969) task. The script uses three image files, which would need to be created separately: a left-pointing arrow, a right-pointing arrow. Please note that this examples aims to illustrate what an experiment script looks like. For those who wish to try out this or other examples, it is recommended to try them out using the website http://www.psytoolkit.org.
Author’s Note
Research conducted by Gijsbert Stoet, Leeds Beckett University.
Acknowledgments
I would like to thank those students and colleagues who have helped to translate the interface texts and the many students for their helpful feedback and comments on the website. I would to thank Niamh Friel, two anonymous reviewers, and the editor (Andrew Christopher) for helpful comments on an earlier draft.
Declaration of Conflicting Interests
The author declared no potential conflicts of interest with respect to the research, authorship, and/or publication of this article.
Funding
The author disclosed receipt of the following financial support for the research, authorship, and/or publication of this article: This research was partially supported with a grant by the Economic and Social Research Council (ES/J020796/1). PsyToolkit has been supported by Grant ES/J020796/2.