
Abstract
Research methods and statistics are core courses in the undergraduate psychology major. To assess learning outcomes, it would be useful to have a measure that assesses research methods and statistical literacy beyond course grades. In two studies, we developed and provided initial validation results for a research methods and statistical knowledge concept inventory for eventual use in further scholarship of teaching and learning. In Study 1, we created vignettes and administered open-ended questions to psychology subject pool students. In Study 2, we refined the vignettes and created multiple-choice items using participant responses from Study 1. After administering the measure to psychology subject pool students and a community-based sample of Amazon Mechanical Turk workers, we used item response theory to select 20 items to compose the final Psychological Research Inventory of Concepts.
Research methods and statistics in the behavioral sciences are core domains of learning at the undergraduate level, consistent with Goal 2 of the American Psychological Association’s (APA, 2013) guidelines for the psychology major Version 2.0. Yet, courses in research methods and statistics are often “dreaded” by psychology students (Conners, McCown, & Roskos-Edwoldsen, 1998; Dempster & McCorry, 2009; Freng, Webber, Blatter, Wing, & Scott, 2011; Vittengl et al., 2004). These courses are typically taken because they are required, not out of genuine interest, with low levels of intrinsic motivation and low expectations of performing well, both of which are more likely to involve performance goals (e.g., obtaining a good grade) over actual mastery goals (e.g., learning and retaining the material; Pintrich, 2003). Most students are capable of learning the material for long enough to pass a test, but doing so does not ensure actual knowledge acquisition or the ability to apply the knowledge to a novel situation (e.g., reasoning).
Beyond APA’s guidelines, mastery of research methods and statistics also serves a practical function. Psychology has been criticized by other disciplines as a “soft” science (Berezow, 2012; Wilson, 2012). Even worse, psychology is considered “less scientific” than other fields (e.g., physics) even by teachers of psychology (Howell, Collisson, & King, 2014). Most students and faculty in psychology, when informing a new acquaintance that psychology is his or her field of study, can attest to receiving responses such as “Are you analyzing me right now?” that imply mind-reading abilities and an interest in psychotherapy, despite the broad nature of psychological science. Beyond simply “passing the word” that psychology is scientific, undergraduate psychology majors are likely to encounter popular press depictions of psychological research. An important global role of psychology education is to give students the ability to critically evaluate media reports of behavioral science (Lawson, Jordan-Fleming, & Bodle, 2015), even if the majority of undergraduate majors do not pursue careers in the discipline. In short, grasping the concepts of research methods and statistics is vital to the undergraduate psychology curriculum, which means it is important to ensure that teaching in research methods and statistics produces learning that lasts beyond the current semester.
How can we know if our teaching produces mastery learning? Traditional research on teaching techniques uses exam grades (e.g., Burkley & Burlkey, 2009; Stansbury & Munro, 2013) or study-specific measures (Bachiochi et al., 2011) as outcome variables. Course and exam grades are not ideal as outcome measures because they typically do not reflect reasoning ability within the content area, and study-specific measures may not be generally applicable or reproducible. Researchers have also used longer term outcomes such as global measures given to senior majors upon graduation to assess methodology and statistics knowledge. As one example of this, the psychology Area Concentration Achievement Test (http://www.collegeoutcomes.com) assesses learning in several subareas, including experimental design and statistics. Other researchers have used the test successfully to demonstrate the influence of programmatic choices (e.g., sequencing and integration of methods and statistics) on scientific knowledge (Barron & Apple, 2015; Pliske, Caldwell, Calin-Jageman, & Taylor-Ritzler, 2015). However, this test is intended to assess learning in graduating seniors only and costs money to administer and score, which makes it less feasible for examination of teaching within a semester-long course.
To improve teaching and assessment in research methods and statistics, it would be useful to have a tool that helps instructors differentiate between students who simply perform well in a course (assessed via course grades) and those who actually learn the material (Hake, 2015). Other fields have developed such tools, called “concept inventories” (Anderson, Fisher, & Norman, 2002; Evans et al., 2003; Halloun & Hestenes, 1985a, 1985b; Wallace & Bailey, 2010). The physics inventory, for example, distinguishes actual reasoning about motion learned through physics coursework from lay or commonsense beliefs about motion (Halloun & Hestenes, 1985a, 1985b). Concept inventories serve multiple functions, including use as a placement exam to evaluate instruction and as a diagnostic test for identifying misconceptions. Concept inventories are typically quick and free to administer, simple to score, and easily accessible to instructors and researchers alike. As such, a research methods and statistics concept inventory may hold promise for assessment of teaching within semester- or year-long courses as well as for programmatic assessment of scientific literacy in psychology.
To date, psychologists (and other behavioral scientists) do not have a good measure of applied research methods and statistical knowledge. We have measures assessing interest in research (Vittengl et al., 2004), fears of math or statistics (Onwuegbuzie & Wilson, 2003), willingness to invest effort toward knowledge acquisition (Norris, Pacini, & Epstein, 1998), and measures of general critical thinking (Facione & Facione, 1994). However, we have no measure that can differentiate knowledge and reasoning from grades. Indeed, even measures that are conceptually closer, such as research self-efficacy, are aimed at graduate students actively engaging in production of research (Forester, Kahn, & Hesson-McInnis, 2004), which is a concept not applicable to the average undergraduate population. Researchers in mathematics developed the Statistics Concept Inventory (SCI; Allen, 2006) to test facility with probability, descriptive statistics (e.g., frequencies, data presentation and summary), distributions, and regression, among other topics. Although useful, the SCI does not assess practical aspects of interpreting and applying statistical results that are needed to succeed in a research methods course and to critically examine psychological literature or media reports of scientific findings. Finally, the best measure, or the measure that comes closest to evaluating scientific literacy in psychology, is the Psychological Critical Thinking Exam (Lawson, 1999). This newly revised exam (Lawson et al., 2015) uses vignettes about psychological research and has students identify problems in an open-ended format. The test appears to have adequate psychometric properties (Lawson et al., 2015), but as an open-ended test, it requires coding to score and would likely be less amenable to administration in large courses or large assessment programs, especially as a pretest/posttest format.
The purpose of the current project was to develop a concept inventory that would test core components of scientific knowledge, statistical literacy, and correct interpretation of study results. We aimed to model processes students would need to critically evaluate media reports of social science and behavioral research. Our goal was to create a measure that was brief enough that it could be completed within one class period (approximately 50 min to an hour), easy to score, and amenable to multiple administrations, similar to the concept inventories in other fields. In Study 1, we conducted a qualitative study by constructing vignettes and administering them with open-ended questions to obtain responses as the basis for multiple-choice foils. In Study 2, we administered an initially wide range of multiple-choice items and used item response theory (IRT) to select a set of 20 well-performing items for use in a multiple-choice concept inventory. Ultimately, our goal was to develop a measure that can be used for assessment of research methods and statistical literacy for use in the further scholarship of teaching and learning as well as for undergraduate psychology program assessment.
Study 1
Method
Design and Measure
To capture the full scope of concepts to cover in our instrument (Clark & Watson, 1995), we first generated a list of topics within the area of research methods and statistics. This list of topics was vetted by other experts (psychology faculty at a teaching of psychology conference). The topics included importance of replication, external influences on studies (e.g., sampling bias, experimenter bias), operationalization of variables, reliability and validity of measurement, interpreting correlations, correlation and causation, random assignment procedures, experimental design/confounds, comparing the strength of two studies, factorial designs, order effects, group-level data applied to the individual, interpreting mean differences (using both graphs and numbers, interpreting statistics), external validity and generalizability, influences on statistics (e.g., ceiling and floor effects, outliers, restriction of range), and a few “general” questions that did not fit into another category.
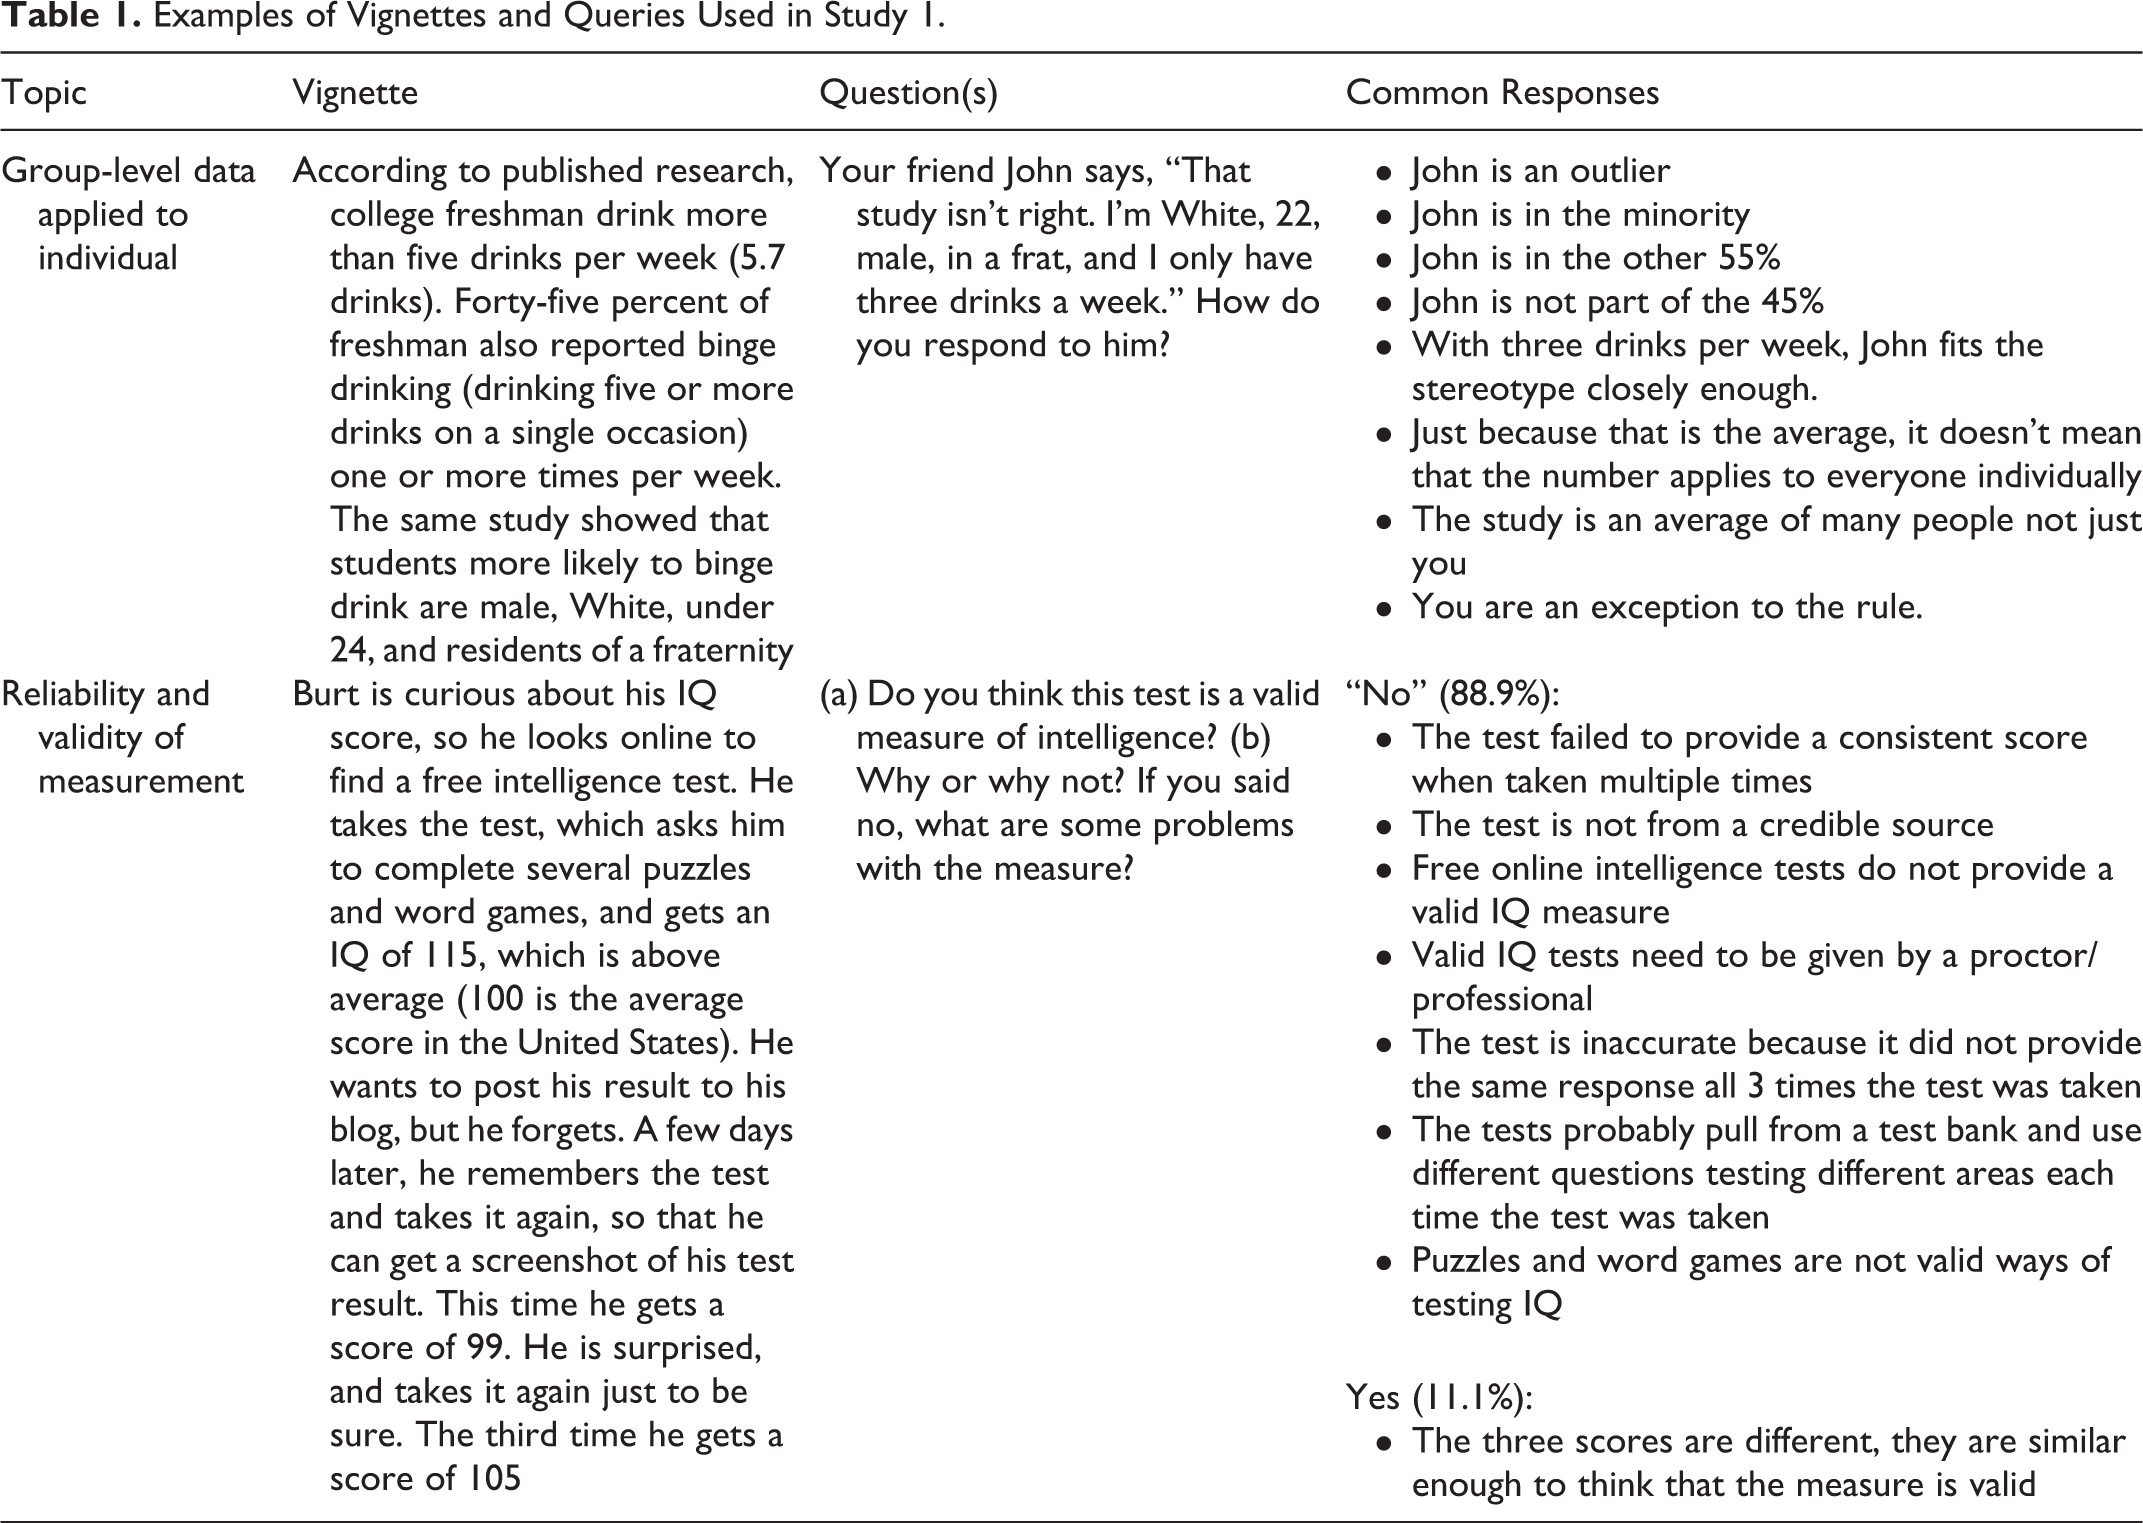
We then created two to four short vignettes per topic, followed by some yes/no (e.g., “do you agree with the conclusion of the researcher in this scenario?”) but mostly open-ended questions asking the participants to critically evaluate the study or specific features of the study (e.g. method and conclusions). Two example vignettes from Study 1 are provided in Table 1.
Examples of Vignettes and Queries Used in Study 1.
Participants and Procedure
Participants were 196 college students at a mid-South university, participating in a psychology subject pool who received partial course credit in Introductory Psychology in exchange for completing the study. The participants were mostly college freshman (59.2%), had an average age of 19.32 years (SD = 1.41), and were 56.6% women and 81.1% White. A sizable percentage (40.8%. n = 80) of the participants reported taking a psychology course in high school, and 33.3% indicated prior history with a statistics or research methods course (though not necessarily research methods in the behavioral sciences). After excluding 21 participants who did not complete the study in one setting (identified by duration times of more than 150 min), the average time to complete a set of items was 53.34 min (SD = 23.30).
Participants completed the study online via Qualtrics (Provo, UT) and were told the study would examine knowledge of and attitudes toward research methods and statistics in the behavioral sciences (see https://www.qualtrics.com/support/research-resources/cite-reference-qualtrics-research/). Due to the large number of vignettes, each participant was randomized to one vignette per topic to prevent fatigue and to ensure that the length of the study session would be approximately 1 hr per person. Thus, each participant responded to an average of 16 vignettes, and each vignette was completed by between 49 and 98 students.
Results and Brief Discussion
The two goals of this study were to evaluate our vignettes for readability and to use participant-generated responses to create multiple-choice items. In the service of our first goal, we identified several vignettes and questions that, based on the responses given, were not easily understood by our sample. For these vignettes, we either edited vignette for clarity or marked it for elimination.
For our second goal, we examined the content of the responses qualitatively, focusing on general trends and themes that emerged when considering the responses to each question for each vignette. Research assistants grouped the responses by similar content or theme; most questions had several common responses (see Table 1 for example). We then examined the responses for well-phrased “correct” answers and well-phrased “incorrect” answers that we used as the basis for multiple-choice responses.
Overall, the open-ended questions were successful in generating a large amount of data and providing us insight into participants’ thought processes. We note three central findings from Study 1. First, there was significant variability in how participants responded, but neither ceiling nor floor effects were present; none of the questions generated responses that were all accurate or all inaccurate. Second, as we had hoped, the vignettes varied in their level of difficulty. Some of the vignettes (e.g., factorial designs, interpreting statistics) were associated with few correct answers, whereas others (e.g., interpreting correlations, group-level data applied to an individual) were associated with on-target answers from the majority of respondents. As we hoped to include items with a range of difficulty levels in our final measure, the qualitative findings were promising. Finally, the participants converged on similar themes in their responses. The common “incorrect” answers allowed us to generate plausible foils, which we would have had a difficult time generating on our own; as instructors of research methods and statistics, we can no longer easily “think like a novice.”
Study 2
The goal of Study 2 was to develop a multiple-choice version of the vignette-based measure described in Study 1 and to test it using Item Response Theory (IRT). For each vignette retained from Study 1, we converted the open-ended questions into question stems amenable to multiple-choice answers and developed four to five responses (1 correct and the remainder incorrect) for each question. The incorrect responses were generated from the most common answers given in Study 1 and reworded for uniformity and style when needed. With the intention of creating a final measure of about 20 items, our first revision reduced the item set to 38 questions based on 32 vignettes (several vignettes had multiple associated questions, such as the factorial design scenarios), retaining 2 vignettes per topic.
Method
Participants and Procedure
Data from Study 2 were collected from two sources: (a) individuals from a large mid-Southern University psychology subject pool and (b) individuals recruited from Amazon Mechanical Turk (MTurk), a web-based service where “workers” receive small amounts of money to complete online tasks, including questionnaires. Subject pool participants (n = 284) signed up for the study via an online study management program (Experimetrix) and received partial course credit for participation. MTurk participants (n = 474) were required to be from the United States and were paid US$3 for completing the full inventory plus demographics.
Of the 758 individuals who completed the study, the final sample was 624 after exclusions. We excluded people who reported they did not live in the United States (MTurk = 3, subject pool = 2) and people who did not click the “consent” box (MTurk = 11). We also excluded people with duration of less than 20 min (MTurk = 38, subject pool = 27) after pilot testing revealed the average time to complete the measure was around 40 min. Based on this pilot, we considered it implausible for a person to read the vignettes and respond to all items in less than 20 min. We also excluded people who admitted they did not read the vignettes or put in less than 70% effort into the study (MTurk = 27, subject pool = 67). In total, 58 people were excluded from the MTurk sample and 76 were excluded from the subject pool sample (note that many people excluded were excluded for multiple reasons). A greater percentage (26.76%) of the subject pool sample was excluded compared to the percentage of the MTurk sample (12.21%) who were excluded, χ2 = 25.82, p < .001. However, there were no significant differences between people included and excluded on gender or ethnicity.
The 32 vignettes were administered in random order via Qualtrics. We also asked participants demographic questions (age, gender, and ethnicity) and several questions about educational history. Specifically, we asked about educational level (some high school, high school diploma, trade school certification, some college, bachelor’s degree, or advanced degree). We also asked for ACT and/or SAT scores and whether they had taken high school and/or college psychology or statistics courses. We also asked about completion of a college-level research methods course (assuming that the majority of high schools do not offer a research methods course specifically).
Results
Demographics of both samples are listed in Table 2. Unsurprisingly, the MTurk sample was older than the subject pool sample. The subject pool sample also had a higher percentage of women and lower ACT scores than the MTurk sample, with no differences in ethnicity. In terms of educational achievement, more of the MTurk sample had completed a college degree (39.7% had an undergraduate degree, and an additional 10.9% had an advanced degree beyond the bachelors), and only a small portion of MTurk workers were currently enrolled in college.
Demographic Characteristics for Participants in Study 2.
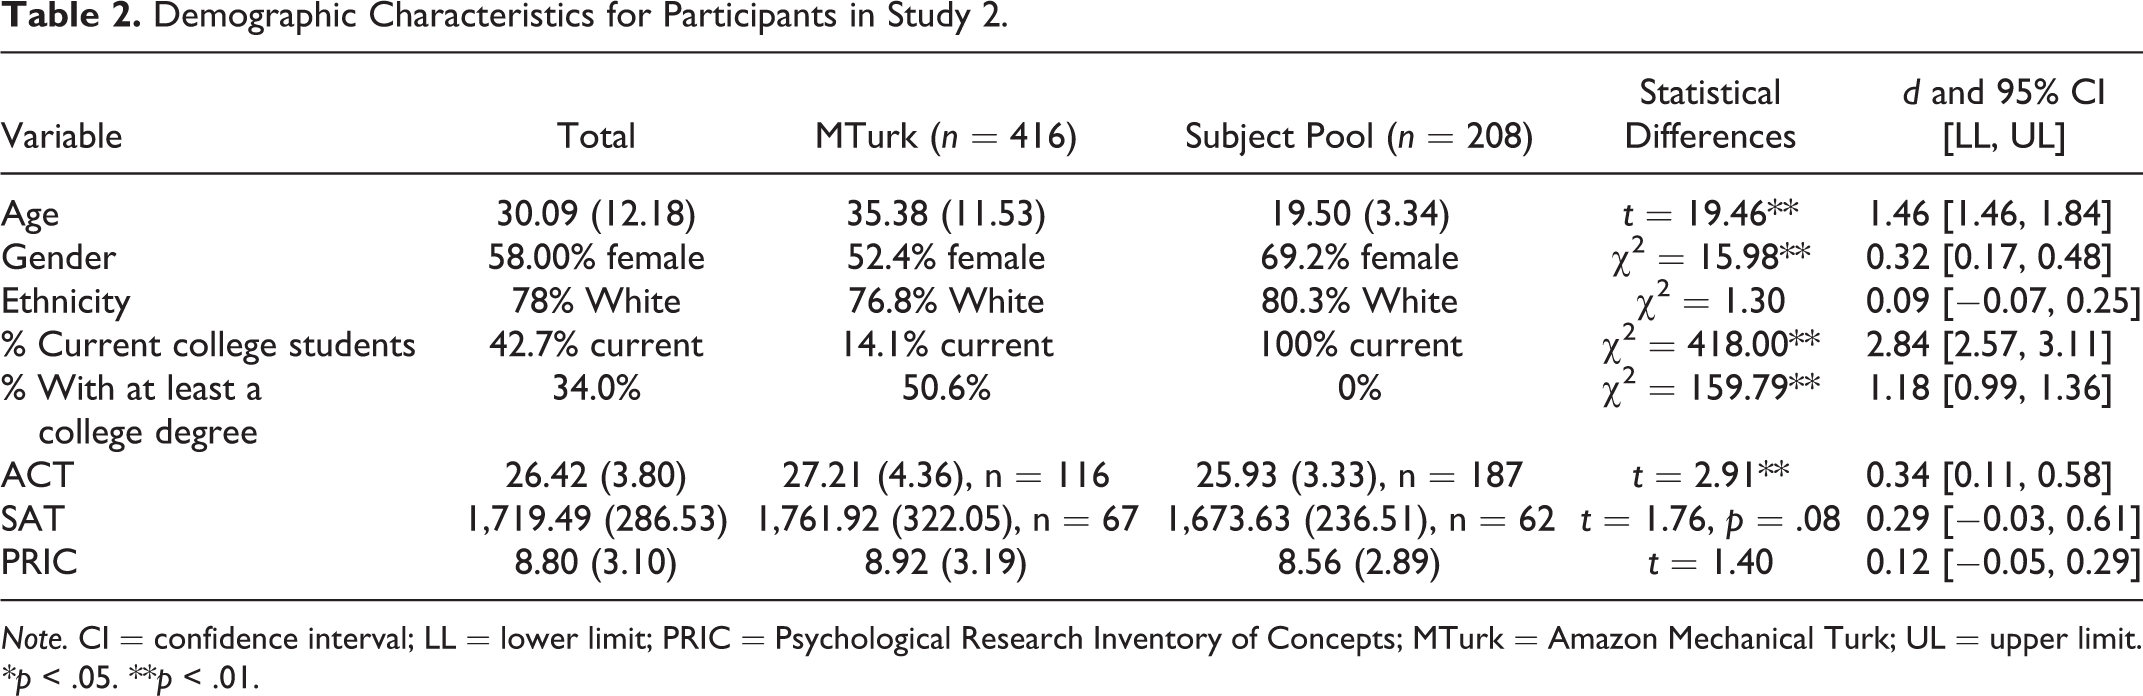
Note. CI = confidence interval; LL = lower limit; PRIC = Psychological Research Inventory of Concepts; MTurk = Amazon Mechanical Turk; UL = upper limit.
*p < .05. **p < .01.
Any person with a college degree or currently enrolled in college was also asked about their major and was coded as a psychology major (9.4%, n = 43), a nonpsychology major (85.8%, n = 394), or undetermined (including undeclared; 4.8%, n = 22). The proportion of psychology majors in the MTurk sample was not statistically different than in the subject pool sample, χ2 = 3.62, p = .16.
IRT
IRT is a sophisticated analytic strategy for evaluating measurement quality. Unlike classical test theory, which uses the simple percentage of correct responses as an index of item difficulty, IRT uses logistic functions to model the relationship between individual item response and participants’ abilities. A full description of IRT as used in scale design and assessment is not possible here (for use of IRT with concept inventories, see Bristow et al., 2012; Stone, Ye, Zhu, & Lane, 2009; Wang & Bao, 2010; see also Edelen & Reeve, 2007). Essentially, IRT provides item-level information for people with varying ability levels, modeled via item characteristic curves (ICCs), and allows for more nuanced decision-making when selecting items in the context of scale development (Edelen & Reeve, 2007). For the current analysis, items were recoded as correct or incorrect and thus modeled as dichotomous. We first conducted some basic item analyses (e.g., percentage correct and point biserials) on the full data set, with both samples combined. IRT analysis assumes the latent construct is unidimensional, so 5 items with negative point biserials were discarded. Point biserials and percentage correct of all remaining 33 items are listed in Table 3.
IRT Parameters for Items in Study 2.
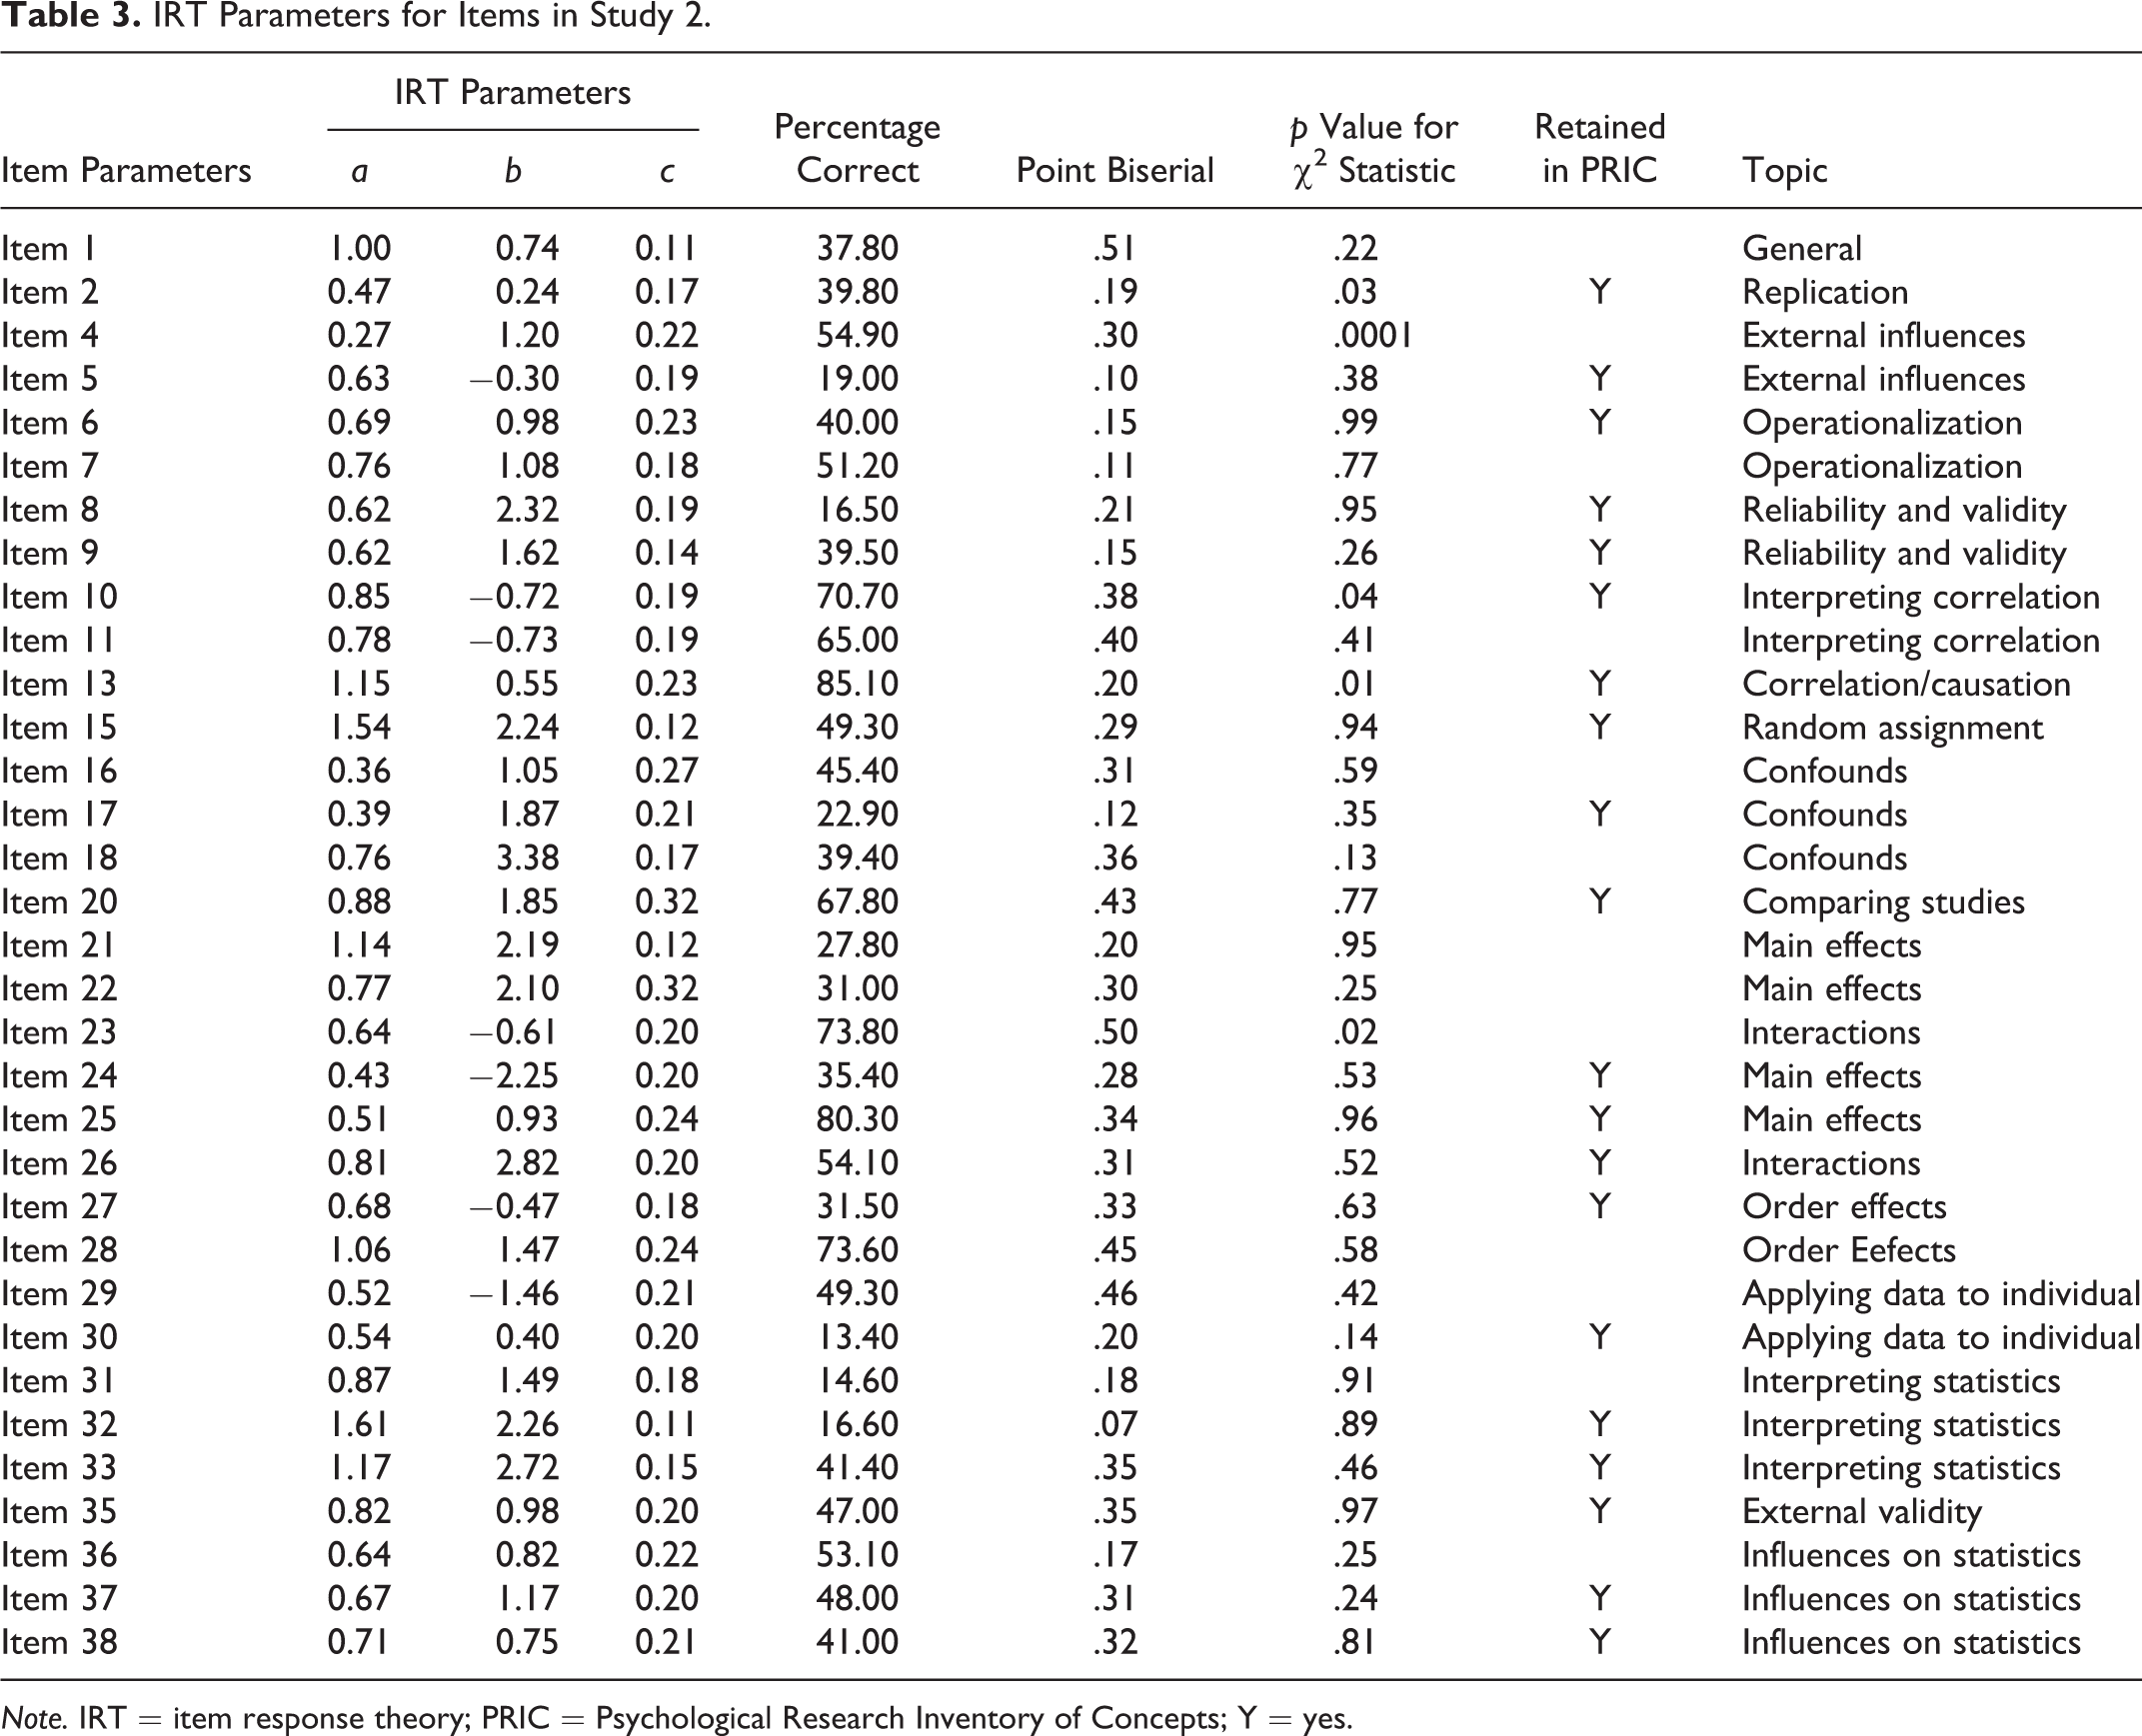
Note. IRT = item response theory; PRIC = Psychological Research Inventory of Concepts; Y = yes.
Because a correct answer can be obtained purely by chance or via guesswork, we wanted to use the three parameter (3PL) model, which includes a c parameter or “guessing” parameter, beyond the two parameters included in a 2PL model. In IRT, b is the location parameter (also known as the difficulty parameter) and essentially indicates the ability level associated with a 50% probability of obtaining the correct response. Higher b values (which typically range between −3 and 3, akin to z-scores) indicate greater ability is needed to increase likelihood of obtaining the correct answer (e.g., harder items), whereas lower b values suggest easier items. The second parameter, the a parameter, also called the discrimination parameter (which typically range between 0 and 2), provides the slope of the ICC at the difficulty level associated with parameter b, where steeper slopes are more representative of the latent construct and are more discriminating of people with different abilities.
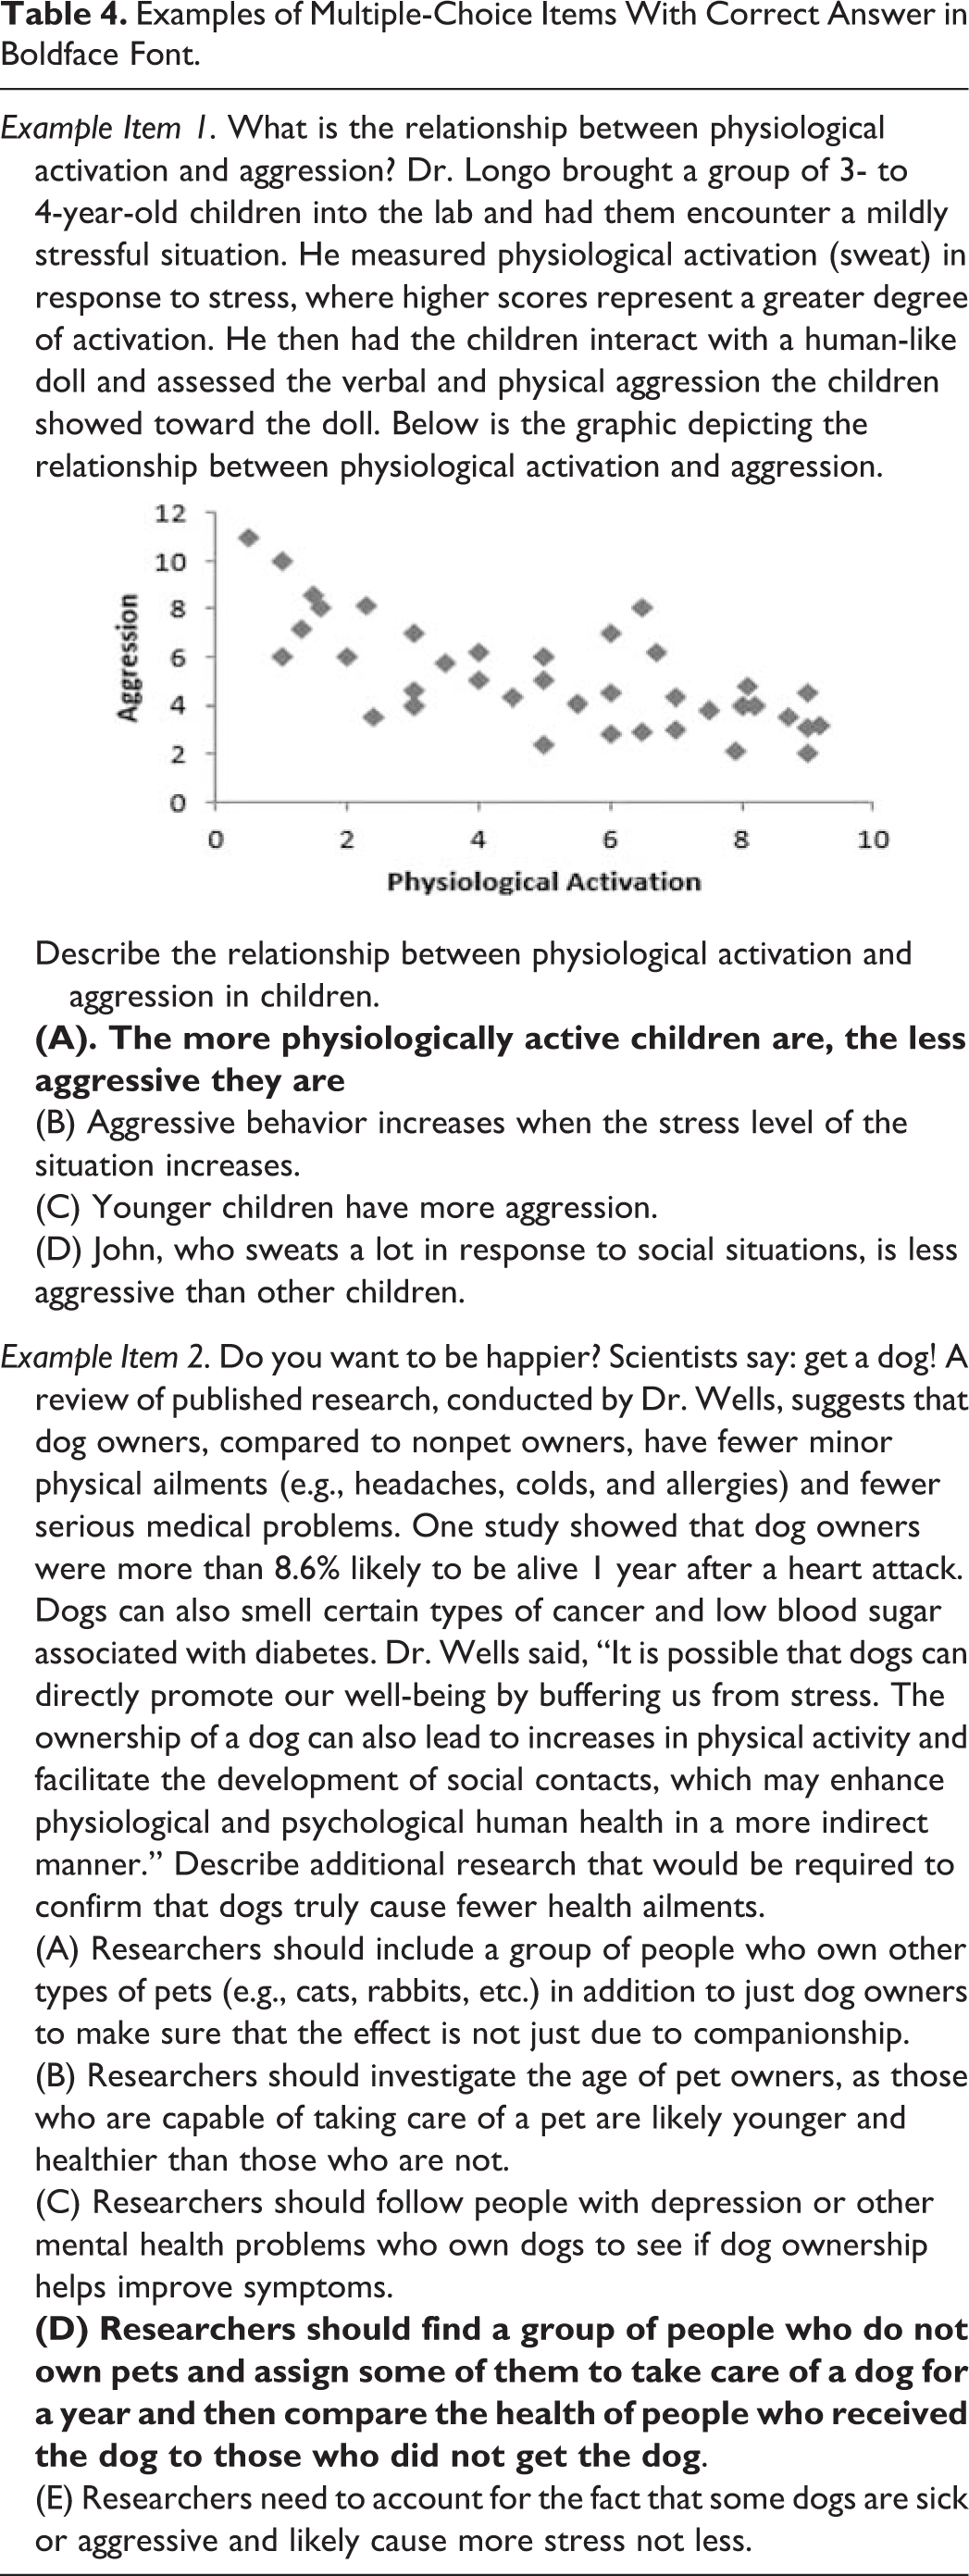
After removing the 5 items with negative point biserials, we proceeded with fitting a 3PL model to the data using BILOG-MG software (Zimowski, Muraki, Mislevy, & Bock, 1996). 1 We then examined item parameters along with the ICCs for the categories of items included in the measure (all item parameters and percentage correct listed in Table 2). Of note, we evaluated item fit not only by looking for nonsignificant χ2 but also by examining fit plots. Beyond item fit, we examined the set of parameters to include items with varying difficulties (b values), and when items were otherwise similar, we typically retained the items with better discrimination (a values). We typically kept one vignette per topic, with a few exceptions (reliability and validity of measurement had two questions for one vignette, main effect and interactions had three questions for one vignette, interpreting statistics had two questions for one vignette, and we kept two ‘influences on statistics’ vignettes). Although we retained 2 items with significant χ2 (Items 2 and 10), the fit plots for these items did not suggest significant misfit (Wallace & Bailey, 2000). In total, 20 items were retained for the final version of the Psychological Research Inventory of Concepts (PRIC; full measure available from authors). To preserve integrity of the entire version, we present two example items with good fit statistics that were not retained in the final iteration in Table 4.
Examples of Multiple-Choice Items With Correct Answer in Boldface Font.
Initial Scores
The mean raw score of items correct out of 20 was 8.80 (SD = 3.10, range = 1–19) or 44.02% (SD = 15.51, range = 5–95%). Of note, the 20-item final version correlated at .90 with the full score, suggesting the 20-item version is a good representation of the overall constructs assessed. There were no differences between MTurk sample PRIC scores and subject pool scores (see Table 2).
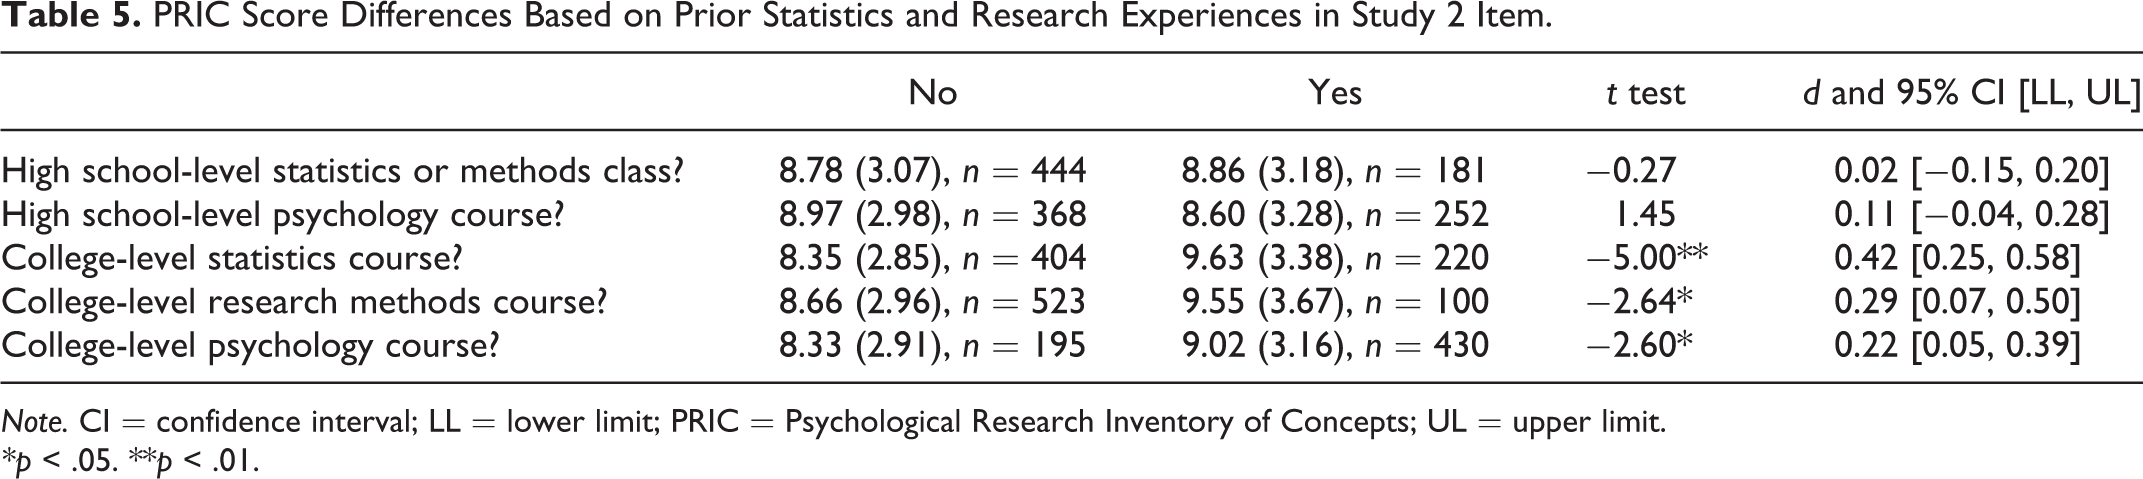
We found that the PRIC score significantly correlated with participant provided ACT score, r = .40, p < .001 (n = 303), and SAT scores, r = .22, p = .01 (n = 129). Because we also asked about prior experience with psychology, research methods, and statistics courses, we were able to tabulate score differences based on educational history. Table 5 includes the PRIC scores based on past experience with psychology, statistics, or research methods courses. There were no differences in PRIC scores based on enrollment in high school statistics or psychology courses. However, individuals who had taken college-level coursework in statistics, research methods, or psychology performed higher on the PRIC than those who had not. We also asked people who had taken college coursework if they completed the course within the last year (or were currently enrolled), if they completed the course 1–5 years ago, or more than 5 years ago. Time since course completion was not significant for college statistics, F(2, 214) = 1.64, ns, η2 = .02, or for college research methods, F(2, 97) = 1.14, ns, η2 = .02. However, for those who had completed a college psychology course, F(2, 428) = 4.18, p = .02, η2 = .02, those who completed the course more than 5 years ago (M = 9.48, SD = 3.26) scored higher than those who completed the course within the least year or were currently enrolled (M = 8.54, SD = 2.99), p = .02. Those who completed the course 1–5 years ago (M = 9.26, SD = 3.23) were not significantly different from either other group using Bonferroni post hoc tests.
PRIC Score Differences Based on Prior Statistics and Research Experiences in Study 2 Item.
Note. CI = confidence interval; LL = lower limit; PRIC = Psychological Research Inventory of Concepts; UL = upper limit.
*p < .05. **p < .01.
In terms of educational differences, a one-way analysis of variance revealed significant differences between education groups, F(2, 615) = 22.96, p < .001, η2 = .07. Specifically, Bonferroni post hoc tests revealed that people with an advanced degree scored higher on the PRIC (M = 11.13, SD = 3.47) than people with a bachelor’s degree (M = 9.41, SD = 3.10), p < .001, who in turn scored higher than those without a bachelor’s degree (M = 8.29, SD = 2.89), p < .001.
Brief Discussion
Our central goal for Study 2 was to test a multiple-choice version of our concept inventory, developed from the open-ended responses of Study 1, and reduce the item set to a well-performing 20 items using IRT. We were able to do that successfully and ended up with a 20-item inventory that includes items varying in difficulty and discriminability.
As an initial step toward measurement validity, we found that higher PRIC scores were associated with higher standardized test scores (ACT and SAT), which follows as both are performance-based measures and may reflect careful thinking and problem-solving. We also found evidence that individuals who had college- but not high school-level coursework in statistics, research methods, and psychology actually performed better on the PRIC than people who had not taken college-level coursework in these subjects. Although only an initial test, these findings are promising in the scope of measurement development, as they suggest that at the cross-sectional level, the PRIC assesses constructs taught in research methods, statistics, and psychology courses.
One limitation of Study 2 is the large number of participants who were excluded. Low effort, whether assessed directly via a question asking about effort or indirectly by the duration of measure completion, is common in both subject pool and MTurk samples (Goodman, Cryder, & Cheema, 2012; Oppenheimer, Meyvis, & Davidenko, 2009). Participants who are paid for their time (MTurk) or who need to complete studies for course completion (subject pool) are not inherently invested in the topic and thus might not find putting forth significant mental effort worthwhile. However, the lack of significant differences between MTurk and psychology subject pool samples on both the PRIC score and proportion identifying as psychology majors suggests that these are fairly comparable groups in terms of research methods and statistical knowledge, even with the exclusions.
General Discussion
The two studies in this article describe the process used to create the PRIC, a measure used to assess understanding of and reasoning about critical concepts in research methods and statistics within the behavioral sciences. Overall, we provided initial evidence supporting the PRIC as a valid measure of reasoning and application of statistics and research methodology in psychology. We also demonstrated that individuals who scored higher on the PRIC had greater academic ability, indexed by standardized test scores (ACT and SAT), and that people with more advanced education also scored higher on the PRIC compared to those with less education. The creation of this measure fills a needed niche in the behavioral sciences, a standardized way for educators and researchers to assess research methods and statistical reasoning.
One major advantage of the PRIC is its brevity; it can be used in college-level classes that average 50–75 min. The PRIC is also easy to administer and score, given that it employs multiple-choice questions with a single correct answer. Students can complete the PRIC online, which allows for easy randomization of items and response options. However, an instructor or researcher may also choose to administer the PRIC in a supervised paper format. These features and flexibility of the PRIC make it a useful educational and research tool.
An additional strength of the PRIC is that it was developed iteratively, using participants own language for the multiple-choice responses, and that we used IRT to guide development and refinement of the items. IRT provides considerable psychometric advantages over classical test theory approaches to measurement development (Edelen & Reeve, 2007), as the basis for including or excluding items involves more than just interitem correlations. With IRT, items can be evaluated for discriminability and difficulty, and inclusion of a guessing parameter, the latter particularly useful for multiple-choice items. As such, our IRT analyses demonstrated that our final set of 20 multiple-choice items varied both in difficulty and in discrimination between high- and low-ability individuals, suggesting that the PRIC may be useful not only for evaluation of teaching but also for identification of students’ ability levels in the research methods arena.
Finally, a strength of the PRIC is that it was developed using multiple samples. Overall performance on the PRIC was similar for both the college-aged novice sample (undergraduate psychology subject pool students) and a wide range of adults in the United States recruited via MTurk. This can be taken as evidence that the PRIC does not merely test content knowledge in the area of social sciences. Instead, the PRIC appears to test the ability to reason about and apply information to scenarios about research and statistics, which is likely why our currently enrolled introductory psychology students did not perform differently from a diverse, older MTurk sample.
Despite promising initial results, questions remain about the usefulness of the PRIC in departmental and classroom settings. We found that higher PRIC scores were associated with greater academic ability and greater educational achievement. Thus, it is plausible that the PRIC assesses perseverance toward long-term goals (e.g., grit; Duckworth, Peterson, Matthews, & Kelly, 2007), cognitive effort (Frederick, 2005), or basic knowledge in psychology (Smith & Barker, 2008), not specific reasoning in research methods and statistics. We also recognize that people with college or advanced degrees may perform better on the PRIC because of critical thinking skills accumulated throughout an undergraduate education as opposed to the particular type of critical thinking needed in research methods and statistics. Finally, it will be important to know if statistics and/or research methods courses increase PRIC scores. Although the idea of a concept inventory is to assess research methods and statistical knowledge beyond grades, it would still be useful to know if PRIC scores are associated with higher grades in research methods or statistics courses. Thus, we recognize that further work is needed to provide further validation of the PRIC, and we turn to answering these questions in subsequent studies (Veilleux & Chapman, 2017, this issue).
Footnotes
Declaration of Conflicting Interests
The authors declared no potential conflicts of interest with respect to the research, authorship, and/or publication of this article.
Funding
The authors disclosed receipt of the following financial support for the research, authorship, and/or publication of this article: This work was funded by a “Research in Teaching” grant from the University of Arkansas Teaching and Faculty Support Center and from a Society for the Teaching of Psychology/Psi Chi Assessment Grant.