
Abstract
New Testament texts are compared with texts from the Septuagint and from writers of Standard Hellenistic Greek (SHG). The aim is to identify which texts are similar in style to which, and which texts differ most from each other. The criteria which are used are 30 very common words and word-endings: prepositions, conjunctions, connectives, particles and some genitive endings. Such items are good stylistic markers in Greek and other languages. Results show first that texts in a more Semitic Greek (Revelation, 4 Kingdoms) differ most from Dionysius of Halicarnassus and Polybius, who make much more use of δέ, πɛρί, κατά and the genitive endings. Some might call this a difference of dialect. Luke–Acts lies between these extremes. There is also a second major type of difference between narratives and argumentative epistles, as the latter make much greater use of ἀλλά, γάρ, οὐ̑ν, ɛἰ, οὐ, μή. Speeches and treatises lie between these extremes. This second difference is one of genre or register.
Introduction
(Technical terms marked * are explained in a concluding glossary.)
The issue addressed here relates to a long-continuing debate over the extent to which the Greek of the New Testament texts is similar to, or differs from, the Greek of the Septuagint, or that of the Papyri, or of writings in Standard Hellenistic Greek, or of Greek technical treatises. 1 The method to be used here depends on counts of a set of 30 frequent Greek words and word-endings. The use of these is counted in large samples of text, normally 5,000 words long. The 30 criteria are: ἀλλά, γάρ, δέ, καί, μέν, οὐ̑ν, ἄν, ɛἰ, ἐάν, ἕωϛ, ἵνα, ὅπου, ὅταν, οὐ/οὐκ/οὐχ, μή, ὅπωϛ, ἀπό, εἰϛ, ἐκ, ἐν, δɩά, κατά, μɛτά, πɛρί, ἐπί, πρόϛ, -ντοϛ, -ντων, -μένου, -μένων. These are ‘function words’*, i.e. they are words (or word-endings) that mainly serve a syntactic function and are less related to the topic or content of the text. 2
The counts of the 30 items are used by a method that then works out which texts are most similar to which other texts. It does this by grouping together texts that use the same subset of words and word-endings more heavily. For example, texts from Polybius and Plutarch use δέ, κατά, μέν and the genitive endings much more than do texts that favour καί such as Revelation, 4 Kingdoms and Isaiah. There are also texts such as Paul and Acts which lie between these two contrasting groups. Some would wish to call this divergence a difference of dialect, but for present purposes it is sufficient to remain content with a more cautious description of this stylistic divergence. The main contrast should for the moment be characterized as that between some texts more heavily influenced by Hebrew or Aramaic, and those texts (using Standard Hellenistic Greek) that contrast with them.
The method used also detects a second contrast between the texts. The Pauline epistles occupy the middle ground on the first contrast, but are much more distinctive in their use of other words from the list of criteria. Their use of words such as ἀλλά, γάρ, οὐ, μή and ἵνα is in the main much higher than that in samples from other texts, and they use other words less. So on this second scale the Pauline texts are highest, and contrast with texts such as Markan narrative which are far lower. Other narratives are also low, while Synoptic logia, Johannine discourse and the treatises of Philo lie between these extremes.
Figure A is an initial much simplified diagram that illustrates the two-way contrast. First a more Semitic writer to the left contrasts with a writer of Standard Hellenistic Greek to the right. Secondly, argumentative epistles are much higher up than texts with more narrative in them. The simplified diagram shows only the bare outline; the statistical plot shown later has more accurate detail.
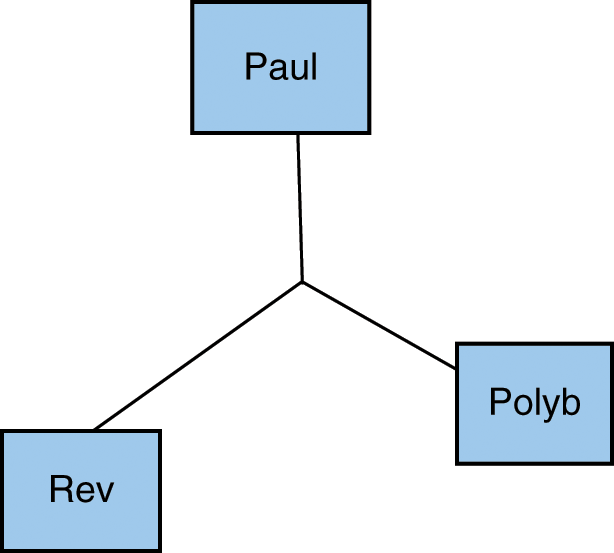
Diagram showing authors
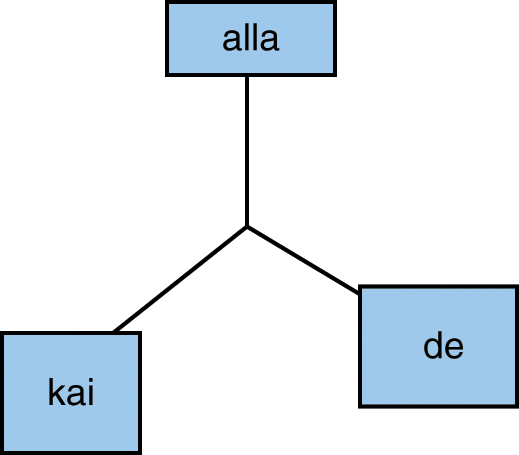
Figure B is a second simplified diagram which shows three of the words associated with these texts. So καί is used more heavily by Revelation (as also by 4 Kingdoms and Mark). The connective δέ is used far more by Polybius (and also by the samples from Plutarch, Josephus, Dionysius and Philo). Other words are also used more by one of these groups than by another, but more of that will be displayed in due course. For the second contrast one can note that Paul is the heaviest user of the connective ἀλλά, but several other words are also characteristic of texts at the upper end of the contrast between narrative and epistle. Table 1 shows the figures for three words in samples from three authors, with the highest usage for each word in bold.
A word favoured by each author
Counts in samples of the same size from three authors

Texts more like Revelation, which use more of the words favoured by Revelation, will be ‘pulled’ towards the lower left. Texts more like Paul, which use several of the words favoured by Paul, will be pulled up the chart towards Paul. And texts more like Polybius, which use more of the words he favours, will be pulled more to the lower right. The same is true for the location of the words and word-endings. Words used more by Revelation, Mark and 4 Kingdoms will appear towards the lower left. Words favoured by Paul such as γάρ and οὐ̑ν will cluster towards the top centre area. Other words more favoured by Polybius and Dionysius, such as genitive participles, πɛρί and κατά will cluster in the lower right.
What has just been described may sound impressionistic, but the reality is that the statistical method being used is doing what is described above in a carefully measured manner, so that precise calculations are made from the word-counts, and the distances between the texts result from the different way the words and word-endings are used in those texts. The method takes account of all the samples and all the criteria in doing what it does, but that is more a matter for the main sections than for this introduction.
Stylometric methods and the selection of samples
Stylometric studies regularly use sets of words that are found frequently in texts, though some analyses of novels containing many thousands of words do also make use of rarer features. The texts to be examined here include some that are only a few thousand words long, and for this purpose it is essential to select words that are frequent in the texts. As content words are more likely to be attributable to the conscious choice of the authors, and to vary with subject matter, there is good reason to prefer function words (Holmes 1998: 113-14). Some recent work reported by J. José Alviar (2008) has also used patterns of repetition of character strings* (i.e. sequences of letters such as ‘in the’) or distances between repetitions of words used more than once in a text. 3 But those features are not used here. The function words used here include connectives, conjunctions, prepositions and a set of four genitive endings mainly used in genitive participial constructions. The function words include familiar Greek words such as δέ, καί, γάρ, ɛἰ and ɛἰϛ as listed in the introductory section above. The counts for δέ average 20 per 1,000 words in the NT, but vary between the samples of text. The technical name for these key words when used in statistical analysis is that they are variables*, as their frequency varies from text to text.
In order to ensure that passages of text are reasonably representative of the works from which they are taken, texts are normally divided into several samples. (The technical term for this is that they are partitioned*.) The spread of these samples then gives a clear indication of the extent of internal consistency within a text. Partitioning of data in this way is a crucial element in using statistics. In this article, however, larger cumulated samples are used in order to focus on the main comparisons between 23 samples from 16 very different authors or groups of authors. The partitioned set consisting of a very much larger number of samples of normal size was also tested, and results for that may be presented elsewhere, though they are more briefly reported here.
A brief point needs to be made about scale on the axes* on the plots, i.e. the scale along the base of the plot, and that up the left side of the plot. An important stipulation for the statistical method used here is that the scales on the axes of the plots must match. If the same number of points is allotted to each axis*, then the plot must be square. It is essential for statistical reasons that the plot should only be oblong, as in Figure C, when the number of points on one axis is extended, never as a result of presentational or printing vagaries. This ensures that distances between text data points are comparable. The horizontal scale* (left to right at the foot of the plot) shows 60 basis points to the left, and 80 to the right (0.01 is one basis point).
Plot showing large samples from first-century and related Greek texts
The set of large samples used here consists mainly of samples containing 5,000 words of text each. These were obtained by combining groups of samples of 1,000 words from a range of authors broadly contemporary with the NT. The set of larger combined or cumulated samples depends on this more numerous set of normal samples. A description of the process of selecting these samples follows, as it draws attention to steps necessary for the statistical analysis.
There were 91 regular 1,000 word samples from the NT, and these represent almost two thirds of the entire text of the NT, in fact 65.9% of the total 138,019 words in the NT. Normally quotations were excised from the samples, and passages of very unusual style such as genealogies, or lists of greetings, were either avoided or carefully flagged. The samples were classified as containing narrative or speech, or as being of mixed genre. They were also cross-classified by author, and where appropriate by source. There were a further 87 samples from other Greek texts of the Hellenistic and Roman period making 178 samples in all. With 178 samples and 30 criteria the original table of data held 5,340 observations.* (An observation is the count of a given word in a given sample of text.) The set of 23 large samples was derived from 114 of the 178 by cumulating these samples into larger blocks. Normally 5 samples of 1,000 words each were combined to make a larger sample of 5,000 words. 4 As the same 30 criteria were counted in these 23 large samples, the latter produced 690 observations.
Interpreting the distances between the texts
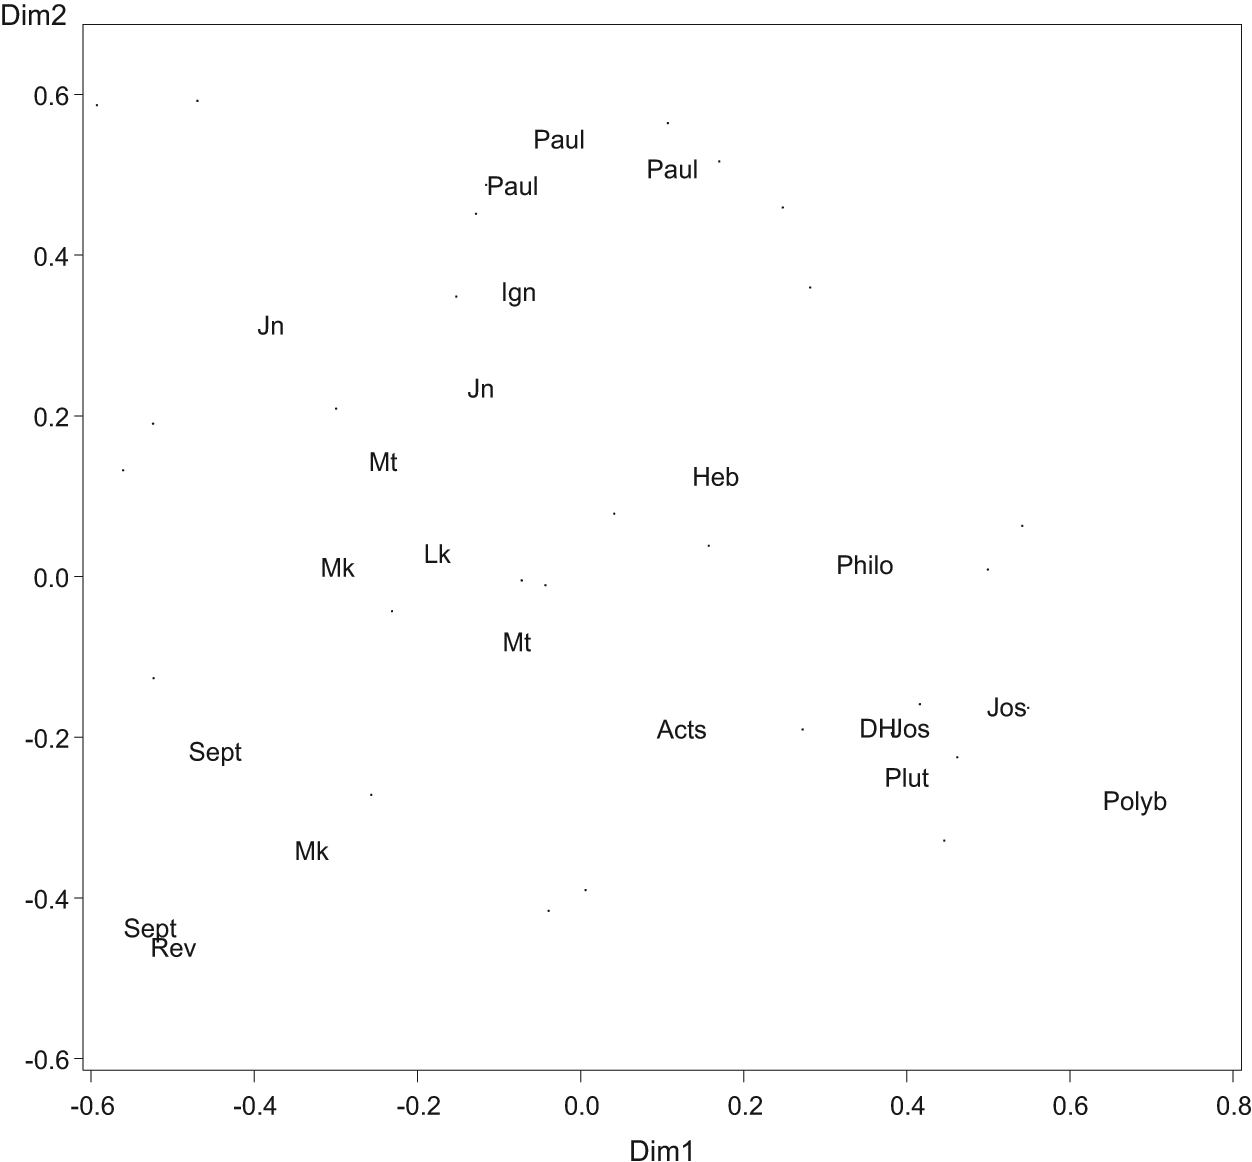
The main method used is Correspondence Analysis*, which is one of a family of multivariate* statistical methods. (Multivariate methods use many criteria simultaneously. The reason for using Correspondence Analysis here is that it shows not only which texts are associated with, or distant from, each other, but also which common words each text favours, or avoids.) It can assess the data from the counts of 30 words in 23 or 178 samples, and identify the major types of diversity in the texts. The largest and most significant contrast between the texts is placed on the first dimension* (the base line running left to right) of a series of plots. The first plot placed 4 Kingdoms on the far left at 53 points left of centre, and Polybius on the far right some 68 points the other side of centre. They are thus separated by 121 points. Revelation, Isaiah and Mark are also pushed towards the lower left by their heavier use of καί, ἐν and other words, and lesser use of δέ, κατά, μέν and the genitive endings. Polybius and his associates Plutarch, Dionysius and the like do the opposite; they make less use of καί, and much more use of δέ, κατά, μέν and the genitive endings. The statistical output includes items that make it clear that these texts differ most 5 and which criteria are most implicated. 6
The first major contrast between the texts is shown as that between texts on the left and those on the right. The second major contrast in the style of the texts is shown as that between texts that are lower on the plot and those that are much higher. On the second contrast, Markan narrative was quite low (−.34), 4 Kingdoms even lower (−.44) and the major Pauline epistles very high (+.49 to +.55). The scale for this second contrast runs up and down the left side of the plot. Again further statistics show that the different words favoured by Paul and the texts on the lower left make them the main contributors to this second contrast. A plot of the first two dimensions provides a map that takes account of the two major features of the data. These two contrasts account for just over 60% of the information yielded by the method about the variation in style contained in the counts of the 30 criteria in the 23 large samples of text. 7
That gives rise to the first conclusion from the evidence. This is that the first dimension (running left to right) contrasts a text evidently translated from Hebrew with one by a historian who produces literary Hellenistic Greek, and the relative distance separating many other texts between these extremes is now evident on the scale in the plot shown. The second dimension reveals a genre effect as narrative texts are lower, speeches and treatises are higher, and highest of all are the major Pauline epistles.
Correspondence Analysis (CA) plots locations for the 30 criteria, as well as for the samples of text. This is one of the main reasons for preferring this method over its close relation, Principal Components Analysis. CA shows the location of the key function words and endings, either on the same plot as that showing the samples of text, or on a matching plot (see Figure D, shown later). So, for example, it is evident that the major Paulines appear high on the second contrast. It will become apparent later that high on that dimension in Figure D are the Greek words ἀλλά, οὐ̑ν, γάρ, ɛἰ, μή. These words are characteristic of speech and treatises, but especially so for argumentative epistles.

Plot showing criteria for the plot of large samples
So far this article has focused on the major contrasts, as these account for the major part of the variation identified by the statistical method. CA checks the counts for each of the words in each of the samples, it identifies the two main contrasts and puts the first on the horizontal (left-right) scale, the other on the vertical scale. Texts that are closer together differ much less in style, and so the two scales measure which texts are most distant and which most similar in the light of the stylometric evidence. The plot does not show every stylistic feature of the texts, as it is a stylometric not a stylistic view of the texts, though it is broadly based. It uses the evidence derived from the 23 samples, and the counts of 30 varied words (or word–endings) in each of those samples. The method could be adapted to explore other aspects of style if they can be counted sufficiently frequently, but some, perhaps more than some, aspects of style will rightly remain the proper area for qualitative appraisal. Stylometry has focused on function words, as Authorship Attribution studies have shown the use of function words and syntactic features to be much more reliable than many other criteria (see Tweedie et al. 1998: 78). Where longer texts are explored, the stylistic effects of lexical choice can be added to the repertoire, but that is not appropriate here.
Had all 178 samples and 30 criteria been used for this article, a densely populated scatter plot would have been presented. For this reason the plot shown was based on a set of larger combined samples. In all but one case these amalgamate 5 separate 1,000-word samples into samples of 5,000 words. Using larger samples of 5,000 words allows a careful check that the main conclusions drawn from the regular samples of 1,000 words also hold true when larger samples are available and vice versa, and that is a valuable corroboration. The first plot focuses on the distances between groups of samples belonging to the main authors. Not included here is a further plot, which partitions (sub-divides) the data more finely and reveals the extent of within-author variability. Adequate partitioning of the data is a crucial statistical requirement for exploring the extent of within-author variation, but in this case produces much more complex output.
For several groups there are two large samples: one of narrative, the other of speech. This applies to LXX texts on the left, and to Mark, Matthew and to the Johannine texts. Josephus supplied two large samples of narrative and one of speech, but the latter is not evident as it is located where Philo appears. In all five cases the speech sample is higher on the plot than the equivalent narrative sample. It is this which supports the second member of the first conclusion that the difference between higher and lower samples captures the contrast between speech and narrative. Douglas Biber has paid particular attention to the stylistic differences between speech and writing, but he has also, in two of his major works, noted how significant the differences are between narrative and speech (Biber 1988: 17-18; 1995: 226). Here that difference forms the second major contrast, but even more significant, in these texts, is the fact that the left-right contrast opposes translated texts to those freely composed in literary Hellenistic Greek. Figure C will now be examined in more detail, starting in the lower left of the plot and proceeding in a clockwise direction thereafter.
In the lower left corner of the plot there is one large sample from the LXX and one from Revelation. The first of these samples is from 4 Kingdoms. It is significant that Revelation is so close to it and also, on the more detailed plots, to Daniel and 1 Maccabees. Even when allowance is made for the quotations and allusions in the Revelation passages, this degree of closeness is striking. (Revelation was the main exception to the policy of removing quotations from samples due to its unusually rich mixture of quotation and allusion.) A careful study by Steve Moyise (1999) concludes that the author used both Hebrew and Greek biblical texts, and is commendably cautious in stating that it is not clear whether he preferred the former. The evidence in this plot simply points to a stylometric similarity to LXX texts that remained close to Hebrew. Above 4 Kingdoms is a sample of speech from the LXX. This large combined sample contains texts from Deuteronomy, 3 Kingdoms and Isaiah. This is the first instance of speech samples appearing higher on the plot than samples of narrative. (Had they been included here, Genesis and Proverbs would appear more centrally in the plot, as more polished Greek translations.) Another item in this corner of the plot is the large sample of narrative from Mark. At −.33 on the horizontal scale it is a relatively short distance of 17-20 points from 4 Kingdoms (−.53) and Revelation (−.50). This indicates that most Markan narrative shares some features of the Greek of these texts, but to a lesser degree. In this case the Semitic influence is more likely due to Aramaic (on this, see Maloney 1981; Casey 1998). In the more detailed plot, not shown here, two smaller samples from later in Mark appear slightly further to the right, and these tend to confirm the conclusion of Voelz that some later sections of Mark are somewhat ‘more hellenic’ (2005: 231-32, 246-48), though his careful qualifications should be noted. (For discussion of a heavier use of δέ in some later sections of Mark, see Mealand 1997: 241-42.)
The second conclusion is that the location of 4 Kingdoms gives stylometric support to the view that it represents a style of translation that stays much nearer to the underlying Hebrew text. Similarly, Revelation is a work in Greek stylometrically close to Daniel. The style of the prophets distressed Jerome, and the location of Isaiah gives stylometric support to the distinction between these works and the more polished parts of the LXX. These works are not identical in style to each other, but are all at a very significant distance some 80 to 90 points from writers such as Dionysius and those near him. A third conclusion can also be added here that much of Markan narrative shares some of these features, but to a lesser degree.
In the centre left of the plot are samples of speech from Mark and from Luke, and of speech and narrative from Matthew. Had more narratives from Luke been included here they would have been closer to the lower sample of Matthaean narratives, as is the case on more detailed plots. Had samples of narrative from Genesis been included they would have appeared between Markan narrative and Acts. Genesis is less distant from regular Hellenistic Greek, and probably represents an earlier somewhat more literary style of translation, later superseded by a passion to mirror the underlying Hebrew more exactly.
Further up the left hand side of the plot are the two large samples from the Johannine texts. The Johannine narratives do appear in the upper centre left, but noticeably more towards the centre of the plot. Further to the upper left is the sample combining material from the first Johannine epistle and from the discourses in the Fourth Gospel (Jn). When separate, the epistle is further to the left than the discourses, and this favours the conclusion that there is stylometric confirmation of the more Semitic character of some aspects of this work, while its place fairly high up the plot indicates its affinity with other epistles.
At the top centre of the plot are the samples from the major Pauline letters. There is a group of three large samples from Paul here, in which 1 Corinthians is more central and Romans slightly to the right. Below the samples from Paul comes the sample containing passages from Ignatius and 1 Clement (Ign). The major Pauline letters are in an extreme position on the second contrast due to heavy use of argumentative particles, but are quite central on the first. So Paul is central between the more Semitic texts on the left and the more Hellenic ones to the right. But, at 49 to 55 points above the centre of the plot, Paul represents the upper limit of a trajectory from narrative samples in the lower half of the plot, through samples of Synoptic sayings and treatises of Philo, beyond Hebrews (+.13) and Johannine discourse and epistle (+.31), and even beyond other epistles. The fifth conclusion is therefore that the major Pauline letters are the highest on the plot, and so on the upper end of the scale separating epistles and treatises from narrative.
The upper right corner of the plot is relatively uninhabited, though in more detailed plots one of the Greek technical writers does appear further to the upper right than Philo and Plutarch’s treatises. Also, had a sample from Epictetus been included here it would have appeared between Hebrews and Romans. Closer to the centre are Hebrews (Heb) in the upper centre right and Acts in the lower centre right. Hebrews is higher up the plot, closer to other letters and treatises, whereas Acts at −.19 is slightly below the centre of the plot, as it contains a mixture of narrative and speech (Mealand 1999: 488). To the right of Hebrews there are two samples which almost overlap. They are so close that the plot can only display one label for them. The label that is visible is that for the selection from Philo’s treatises, the other, which is hidden in the statistical output, is that for the speeches from the works of Josephus. There are limits to what can be displayed by the statistical software, which would prefer to use a single symbol where the centre of each name or abbreviation is shown. The need to display precise location and the desire to make the items clearly identifiable conflict. As the texts spread further to right on the horizontal scale Acts is at +.12, Hebrews at +.16, Philo at +.35 and Dionysius at +.36. The sixth conclusion is that the plot provides stylometric evidence that Acts and Hebrews are the works that come closer than other NT texts to Hellenistic writers such as Dionysius (DH), Plutarch and Polybius, who appear further to the right.
Below the samples from Philo and the speeches in Josephus are the large sample from Dionysius of Halicarnassus (DH), two samples of narrative from Josephus (Jos), and a mixed sample from Plutarch (Plut). In the lower right-hand corner, the large sample from the earlier historian Polybius (Polyb) is close to the right-hand edge of the plot, in fact the horizontal scale was extended by 20 points from 0.6 to 0.8 to ensure that Polybius was not out of range. These texts tend to make much more use of δέ, κατά, πɛρί, μέν and –ντων. Josephus is said to have needed assistance to improve his Greek. If this is the case then the assistance seems to have worked, at least as far as the criteria used here are concerned. This follows from the seventh conclusion that Philo and Josephus are close to Dionysius and Plutarch, something that is even more obvious in the more detailed plots.
It is now appropriate to return to the interpretation of the plot. The texts that appear to the right of the centre are those composed in standard literary Hellenistic Greek, while some of the more faithfully Hebraic texts from the LXX appear in the lower left corner of the plot along with NT texts directly or indirectly influenced by Hebrew or Aramaic. Speech, treatises and epistles appear higher up the plot, and this is especially the case for the major Pauline epistles.
The Johannine texts tend towards the upper left, and the Synoptic Gospels cluster loosely in the centre left, with Mark further to the left than Matthew and Luke. Acts and Hebrews are in the centre right, the centre being above the point 0.0 on the horizontal scale. Plots of the 1,000-word samples show Genesis to the left of Acts, Proverbs to its upper left, and 2 Maccabees to its right. The Greek of the LXX is diverse and Acts is closest to those LXX texts which are themselves not so far from standard literary Hellenistic Greek.
It should be observed that the statistical system simply identifies differences of usage of the selected function words in the various samples of text. The overall contrast that accounts for the largest amount of variation is shown left to right. 8 The interpretation also rests on the association between the samples and the criteria, namely the function words that characterize the style of the different authors and texts. This leads to further conclusions drawn from the evidence, which are obtained by inspecting the location of the function word criteria or variables. On the plot that has just been examined these are almost, but not quite, hidden, as they are represented by anonymous dots.
The Relation between the Texts and the Words they Use
In fact Correspondence Analysis could display the symbols for samples and for the criteria all on one plot. This is not done here in order to avoid overloading the display with overlapping labels. In the next scatter plot the dots are replaced by the labels that identify the criteria, and now it is the samples that are displayed only as dots. One can infer, from the location of the key word variables, which words are preferred or avoided by the texts. An initial rule of thumb is that words that appear in the same quadrant as a given set of texts are likely to be used more heavily by those texts.
It should be noted that the display of the criteria in Figure D is determined by the graphic capabilities of the statistical software. If the exploration of this plot begins by checking the lower left corner, it is possible to identify words that appear in the same quadrant as the more Hebraic of the LXX texts and Markan narrative. The connective καί duly appears here but also ἕωϛ and ἀπό. Some might expect to find ἐν here as well, but in fact this preposition is above the centre line of the chart, and this is almost certainly due to the prominence of this word also in the Johannine texts. Further function words also characterize the texts on the upper left of the plot. These are ὅπου, ὅταν, ἐάν and ἵνα (for the latter pair, see Table 3 below). So the inference can be made here that these variables are more characteristic of the Johannine and other texts that appear on the upper left of the previous plot, just as the variables in the lower left quadrant are more characteristic of the texts located there.
This plot needs to be seen in close relation to the previous one showing the texts. The Greek words used as variables tend to be used more heavily by the texts shown in the same quadrant of the plot as these words (on this, see Garson 2008). Similarly, words shown in more distant areas of the plot tend to be used less frequently by texts that are distant from them. 9
So when Figure C and Figure D are studied together, they present a stylistic profile of different texts. Each text tends to use some of the key words more, and others less, than the other texts. Texts that are close to one another tend to be similar in style in relation to their use of the 30 criteria selected for this study. In fact this proviso applies generally to the various conclusions reached here. In theory, different variables might produce a different result, though care has been taken to choose a variety of criteria so as to ensure that a representative set of frequent stylistic features was used.
Narrative sections of the Fourth Gospel are also distinctive in other ways. They make so much more use of οὐ̑ν and ὅπου that this feature actually forms a third contrast in which the large Johannine narrative sample is very distinct. This third contrast cannot be pursued here, but the conclusion that it highlights distinctive features of Johannine narrative that are statistically identifiable can simply be noted in passing. 10
The discussion so far has pointed towards the inference that the texts from the LXX and Revelation and from the Gospels not only generally make more use of ἐν and καί, but also a range of other function words on the left of Figure D. Now the focus of attention shifts to the Pauline epistles at the top of the plot, where the task is to find which criteria are associated with the major letters of Paul. The obvious candidates are ἀλλά, γάρ, οὐ̑ν, ɛἰ, οὐ and μή. These words appear in the area at the top centre of the present plot, an area occupied by Romans, Corinthians and Galatians in the previous plot. They are likely to be characteristic of the argumentative style of Paul. The role of words such as these for the interpretation of Paul was noted and explored by Kritzer and Arzt-Grabner (2006). Their focus was on words such as ὄντωϛ, παντω̑ϛ, δɩόπɛρ, ɛɩ πɛρ and οὐχί, their usage in Paul and in the papyri, and their meaning in the Pauline context. The focus of this work is more stylistic, and here a comparison of the usage of Paul, Philo and Mark confirms the interpretation of the output from Correspondence Analysis. Table 2 gives the totals for the five words listed, first in 5,000 words of Romans, and then in samples of 5,000 words from Philo, and from Markan narrative. In each case the number for Romans is highest, showing the preference for these words. This presents one set of data showing why the major Paulines and the words they favour are higher on the plot than Philo, and much higher than Markan narrative, which has the lowest scores for these words.
Word counts in samples of the same size from Paul, Philo, and Mark

A programme called Word Cluster identified a section of 1 Corinthians rich in such words:
1 Cor. 11.16–20
The conclusion can now be drawn that the extreme position of the major Pauline epistles reflects their heavier use, in the selected samples, of a set of argumentative particles consisting of connectives, conditionals and negatives, also high above the centre of the plot. 11
Now it is time to explore the right of the plot, where there are words and wordendings that are likely to be more characteristic of the Greek historical authors, and of Philo and Josephus, who also appeared on the right of the initial display. In the lower centre right a set of endings can be seen which largely denote genitive participles: –ντοϛ, –ντων, –μένου, –μένων. The last of these is beyond the right-hand edge of the plot, as is the particle μέν. Also prominent on the right of the plot are prepositions such as πɛρί and κατά. The statistical output clearly links these words and word-endings, characteristic of rhetorical contrasts and genitive absolutes, with Hellenistic Greek writers such as Polybius, Dionysius, Plutarch, Philo and even the more diffident Josephus. Once again a check with the table of data is needed. A comparison of the data for Polybius and Dionysius 12 against the data for Johannine narrative confirms the interpretation of Figure C and Figure D. Table 3 shows that these Johannine texts do prefer different words (though Jn 16 uses πɛρί a little more).
Word counts in samples of the same size from Johannine and other texts

It is reasonable to conclude that the authors on the right make greater use of rhetorical contrast, and of genitive participles, and also of these two prepositions. It is also appropriate to infer a lower use of the key words on the other side of the scatter plot, and the raw data support this.
There are also a number of function words that are located in the centre and the lower centre of the plot. The role of these is more difficult to determine, as items that appear in the centre of the plots tend to be those that are less distinctive. The main interpretative task is to establish the relation between the criteria that appear outside the central area, but within the area occupied by the bulk of the samples. Care is sometimes needed where an outlying variable is very distant, but represents only a few instances of the use of a word. The words that are used with higher frequency are normally the more significant indicators.
The results explored so far show that the set of 23 large samples is variously distributed across Figure C, and that the criteria or function word variables are also variously distributed across Figure D. Further analysis has explored the relationship between texts and variables where they occupy the same segment of the plot. Where this is the case the analysis has checked whether it is right to infer that the similarity of location on the plot points to an association of the samples and the variables. This inference should never be made too swiftly, as analysis of CA plots shows that such inferences may well be correct in most cases, but do need to be checked against the relevant table of data. The checks shown above have demonstrated how the interpretations offered can be shown to be supported by the data.
Other aspects of the statistical output
Although it might appear that the account given so far rests mainly on an analysis of the scatter plots shown, it is crucial to note that other information is taken into account. This further information is contained in large quantities of statistical data produced by Correspondence Analysis which provide the basis for the production of the plots. This information has been noted from time to time. 13
Judgments have been offered about the association between the texts and the 30 criteria. These judgments rest on inferences that texts located in the same direction from the centre as a given criterion make more use of that word, and that samples of text distant from a word make less use of it. Also it is normally right to infer that texts that are close to one another are more similar in style than those that are further apart. But the plots contain large numbers of samples and variables, and the locations of each depend on their multiple relations to all of the others. These tests are multivariate, i.e. they use a multiplicity of samples and criteria, and as a result the output is complex. As well as looking at the items just mentioned, some separate checks can also be made. Tables 2 and 3 show how direct use can be made of the raw data from the counts for each text. Another check involves plotting the raw data for each key word and for each text, and studying the resulting output. It is also possible to construct tables of means (averages) for each of the criteria in each group of texts. It is not appropriate in this context to give details for every instance of such additional tests, but one further example should be included here.
The next graph displays a much curtailed version of a check carried out on one connective. The check aims to discover if one of the inferences from the Correspondence Analysis plots is correct. Is it the case, for example, that δέ is more frequently used by writers on the right of the plots than it is by the writers on the left of the plots? It may not seem surprising that this is so, but it is possible to check if it is so, and indeed that should be done. In this case reliance is not being placed on impressionistic estimates of differences in style, nor on the pronouncements of experts who merely assert that it is so. The figures can be checked, and that check should be made. As well as looking at the raw numerical data, the reliability of the inferences was checked by making a table of means for several of the groups of authors or texts. Even better is to show both the mean and some measure of the extent of variation from the mean such as one standard deviation* or two standard errors*. 14
For the larger combined samples a slightly different approach was followed. Several of the samples were re-divided into their original 1,000-word constituents. This was necessary, as a mean for each group is required. Software packages vary slightly, and in this instance Figure E displays the mean and two standard errors. The resulting profile of each group gives an indication of variation in the use of δέ relative to group size.
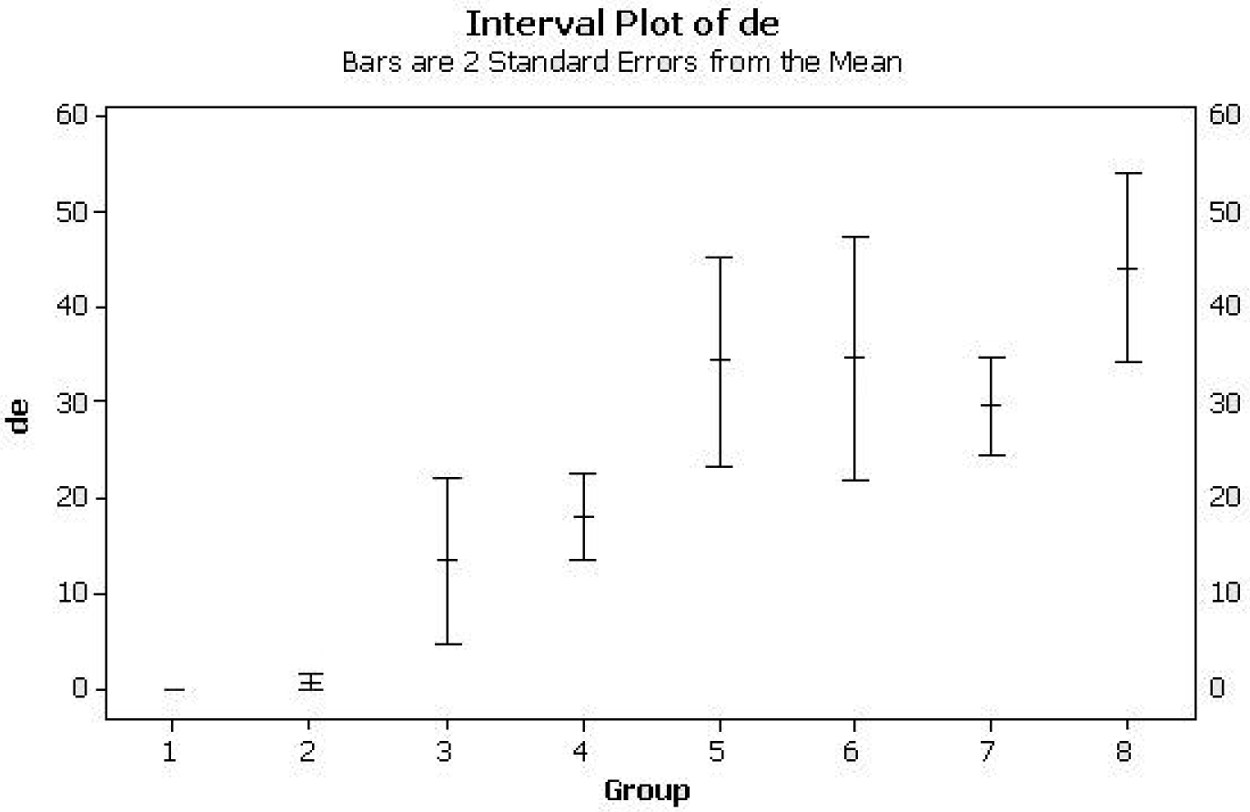
Plot showing the use of δέ in groups of samples from eight sources
The plot shown here displays means and two standard errors for the following groups, each containing a set of samples of 1,000 words (n signifies narrative samples): 4 Kingdoms (n), Revelation, Mark (n), Papyri, Genesis (n), Acts, Dionysius and Polybius. The groups are numbered 1-8.
The samples from 4 Kingdoms show a nil use of the particle, and so no standard error! The samples from Revelation are only slightly less wary of this particle. Mark and the selected papyri use the particle slightly more. There is a clear difference between the four groups on the left and the four on the right. The groups of texts more to the right do use the word at a higher rate, and this is evidently more characteristic of standard Hellenistic Greek prose. The samples from Genesis appear in the latter group, even though Genesis is just as much a translation from Hebrew as 4 Kingdoms, but into more polished Greek.
The difference between 4 Kingdoms and Genesis almost certainly reflects different translation strata, and different translators, and very probably different convictions about how closely a translation should preserve the structure and idioms of the original language. A translation that is closer to the Hebrew may not be older and cruder; it may be particularly motivated by a passion to preserve traits of the original text. When a large set of 1,000-word samples from more of the LXX is used they spread across a plot similar to Figure C at least as much as the New Testament texts do.
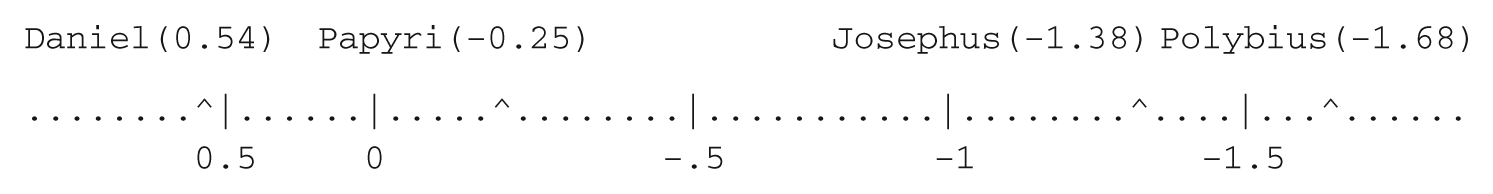
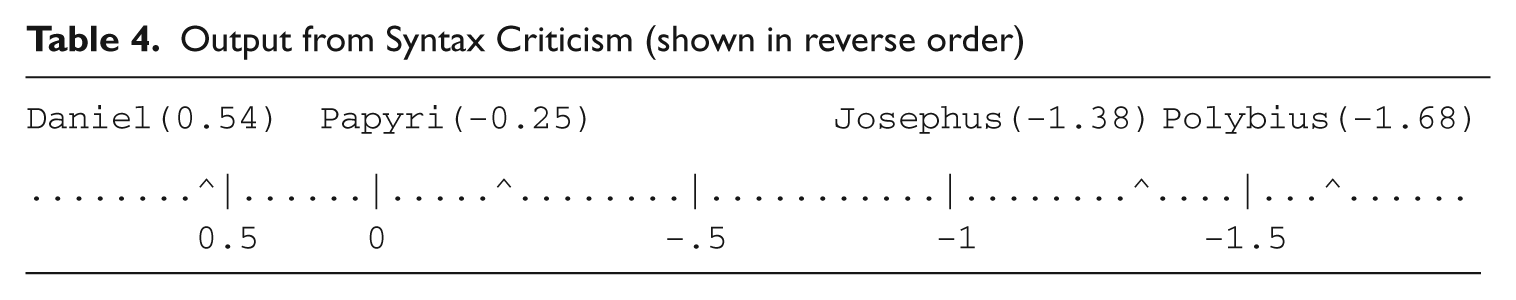
There is no one LXX style; the LXX translators vary at least as much in style as the writers of the NT. On this see Jobes 2003: 88, who makes very effective use of a numerical method developed by Martin (1987) described as Syntax Criticism. This lacks the more complex statistics offered by Correspondence Analysis or related methods, but does produce results that are sufficiently compatible with it for each to corroborate the other. A slight variant of her result is shown in Table 4; the line is reversed to put Daniel on the left.
Output from Syntax Criticism (shown in reverse order)
Checks such as the plot shown in Figure E can confirm or amend initial inferences about the output from Correspondence Analysis. They are needed as Correspondence Analysis is inevitably making a comparison of all the texts and all the variables at once, and a plot of the first two dimensions makes some compromises in displaying only the most salient comparisons and contrasts. It should be noted that in the case of the NT texts a high proportion of the entire text is used in these tests. In the case of much more voluminous authors, the samples represent a much smaller proportion of the entire work or set of works selected. It is possible that a greater degree of diversity might appear if a wider selection of these authors were to be sampled in a more ambitious set of tests. The inferences that are made here are, of course, dependent on the evidence of the chosen set of words and word-endings in the selected samples of text. Content words were included in a selection of lexical and other linguistic features used in an earlier study (Mealand 1991) along with some discussion of the over diagnosis of Semitisms. The divergent character of Hellenistic and Attic verb forms has also been discussed elsewhere, 15 so these have not been overlooked. To extract more complete information about the entire texts would require counts of the complete texts for everything in the texts that it would be appropriate to count. 16 Even if that could be done, some features of style will rightly remain the province of qualitative rather than quantitative appraisal.
Overall Conclusions
In one sense one could say that the statistical exploration gives some support to each of the main theories about the affinities of NT Greek. There are very observable similarities between various parts of the NT and more Hebraic LXX works, more polished translations, papyri, some of the technical writers, and also writers of standard Hellenistic Greek prose. It is, however, just a little more complicated than this in reality. There is considerable variety of style within the NT. (That might be even more apparent if the counts had been able to include verb forms or orthography.) Revelation is more like Daniel, 1 Maccabees and 4 Kingdoms. Mark is nearer these than the other Synoptics are. The papyri, when carefully selected for variety and closeness to the relevant period, are nearer to Acts and Hebrews than to Mark or Revelation. Only if a whole corpus of papyri of totally indiscriminate date and character is used do they appear further to the left, and even then they are to the right of the somewhat more polished translation of Genesis. On similar plots the translations and free compositions of the LXX are more varied on the left-right contrast even than the NT. So statements comparing the Greek of the NT with that of the LXX must always be read with the proviso that they are comparing one very varied collection with another such. The major Paulines are very distinctive, though some early Christian epistles and Epictetus are not too distant. Hebrews is close to Philo, but also not distant from some of the documentary papyri. Acts is 24 points left of Dionysius, but 27 points to the right of Genesis, closer still to Dioscorides on more detailed tests.
In terms of the first contrast, NT texts are either more like Mark, 1 John and Revelation, or more like Acts and Hebrews, or somewhere in between. In terms of register they are more like the narrative sections of Mark and Acts, or, at the other extreme, more like Paul, or again somewhere in between, like much of Matthew and Luke. In terms of relation to other texts, one can triangulate between 4 Kingdoms, Epictetus and Dionysius, and ascertain whether a given work, or section of a work is nearer to one of these than the others. That must be closer to reality than relying on counts of infrequent items of vocabulary that are far from statistically significant, or using terminology that suggests a single stylistic location for the Greek of the whole remarkable collection of texts given the evident internal stylistic variety.
Glossary
This glossary explains several technical terms used in literary statistics in simpler but therefore somewhat looser language.
Axis A plot or graph has a first axis running left to right along the base line, and a second axis running up and down the left side of the plot.
Character strings A series of letters such as ‘arliamen’ (perhaps also spaces and punctuation), usually sequences repeated several times in a text.
Contribution column Column of numbers showing which items contribute most to the spread of a set of texts contrasted with each other, and so explaining the contrast shown.
Correspondence Analysis (CA) A statistical method that shows both the relation between samples of text and also relations between the very common words each text uses most or least.
Dimension In the method being used the first ‘dimension’ displays the major contrast in the data running left to right. The second ‘dimension’ shows the next largest contrast running from lower down to higher up the page.
Function words Words (or word-endings) such as but, and, for, into, out of, so that, while, about, and genitive endings. They relate more to syntax than to content, and are widely used in stylometric studies.
Horizontal scale The line at the base of a plot, centred on zero in the method used.
Inertia Special term in the method used. It describes the amount of variability in the counts of words in the whole set of texts.
Multivariate tests Tests using counts of several criteria simultaneously, as opposed to more limited tests which use them one at a time.
Observation Count of the number of times a given word occurs in a given sample of text.
Partitioned data The use of several samples for each type of text so that the average use in a group of texts can be calculated, and the amount of variation from the average assessed.
Standard deviation A figure that shows the average variation from the average in a set of texts. A large result indicates a lot of variation, a small one more consistency.
Standard error This counts how much variation from the average there is in a set of texts, and then further adjusts the result in line with how many samples of text there are in the group.
Variable Something that varies. In this context each of the 30 words or word-endings counted as criteria.
Variance A measure of the extent of variation in a set of samples. Used in note 7 to refer to the variation in the entire set of texts.
Vertical scale The line running up and down the left side of the plot.
Footnotes
1.
The whole issue is very skilfully discussed in Alexander 2004 with reference to Luke–Acts. The article takes in issues such as Atticism, diglossia, social dialect, register, classicism, diachronic considerations, Fachprosa, imitation of the Septuagint, and code switching. Her careful discussion of Greg H.R. Horsley’s critique of the notion of ‘Jewish Greek’ (1989) is particularly relevant to the present topic. Chrys C. Caragounis (2004) gives fresh impetus to the study of the diachronic development of the Greek language, and its importance for these issues. The spread of texts to the left in ![]() in the present study matches different ways in which NT writers are influenced by texts or oral traditions which were originally in Hebrew or Aramaic. So Revelation is marked by significant amounts of quotation and allusion, Mark by linguistic interference, parts of Luke and Acts by imitation. As Horsley argues, there is not a consistent Jewish Greek syntax, morphology and phonology, but the statistics in this work do show a greater preference for some frequent words, and a more notable disinclination to use others, in some of these texts. This is most obvious in Revelation, somewhat less so in Mark, and a different situation again obtains in Acts, where the author is capable of switching codes to give a particular section a noticeably Septuagintal linguistic flavour, or even to flourish a very occasional Atticism. There is some discussion of lexical choice in the penultimate section of the present article, and the issue of variation between Hellenistic and Attic verb forms is touched on in n. 15 below.
in the present study matches different ways in which NT writers are influenced by texts or oral traditions which were originally in Hebrew or Aramaic. So Revelation is marked by significant amounts of quotation and allusion, Mark by linguistic interference, parts of Luke and Acts by imitation. As Horsley argues, there is not a consistent Jewish Greek syntax, morphology and phonology, but the statistics in this work do show a greater preference for some frequent words, and a more notable disinclination to use others, in some of these texts. This is most obvious in Revelation, somewhat less so in Mark, and a different situation again obtains in Acts, where the author is capable of switching codes to give a particular section a noticeably Septuagintal linguistic flavour, or even to flourish a very occasional Atticism. There is some discussion of lexical choice in the penultimate section of the present article, and the issue of variation between Hellenistic and Attic verb forms is touched on in n. 15 below.
2.
Function words are words such as connectives, conjunctions and prepositions, which are associated with syntax rather than content, and have proved effective in stylometric studies (![]() : 114). The criteria in the current work are the counts of divergent uses of some 30 function words in the different authors, and the distances between those authors on the resulting statistical output. If there is less theory and more numerical emphasis in this work, this is not because of any objection to linguistic theories. There is, however, a need to develop better observational methods, which may ultimately be refined, and help to decide between some of the rival theories.
: 114). The criteria in the current work are the counts of divergent uses of some 30 function words in the different authors, and the distances between those authors on the resulting statistical output. If there is less theory and more numerical emphasis in this work, this is not because of any objection to linguistic theories. There is, however, a need to develop better observational methods, which may ultimately be refined, and help to decide between some of the rival theories.
3.
He does not give a specific example, but presumably one would be the count of the average number of words (or letters) between successive instances of καί in Mark. The article by ![]() does offer a very informative report on work using data compression methods based on information theory. One line used PPM (prediction by partial match) checking successive sequences of characters (letters, spaces etc.) in a text, and in each case the probability of correctly predicting the next character. The researchers ran this on each NT text, and also on a sample of that text combined with a sample of one of the others. The difference in results enabled a ‘distance’ between books to be estimated. Another method (LZ77) used repetitions of sequences of characters (letters etc.), again comparing samples from one book with mixed samples from a pair of books. This produced a table of distances between pairs of books, and an affinity tree. A third method used the distances between repetitions of a word. These methods have as yet involved little pre-processing of texts so, presumably, quotations may not have been removed. They also do not, so far, take account of genre changes between and within texts. Despite these drawbacks, the figures in the table for the NT books most distant from, and closest to, each other are in the main generally comparable with results in this article and elsewhere, though they do not capture features that are clearer when other texts from the NT era are included, and when the data are further partitioned into samples of 1,000 words. It is also to be hoped that, as methods such as PPM are refined, it might be possible to identify which words are implicated in the strings of characters that contribute most to the outcome.
does offer a very informative report on work using data compression methods based on information theory. One line used PPM (prediction by partial match) checking successive sequences of characters (letters, spaces etc.) in a text, and in each case the probability of correctly predicting the next character. The researchers ran this on each NT text, and also on a sample of that text combined with a sample of one of the others. The difference in results enabled a ‘distance’ between books to be estimated. Another method (LZ77) used repetitions of sequences of characters (letters etc.), again comparing samples from one book with mixed samples from a pair of books. This produced a table of distances between pairs of books, and an affinity tree. A third method used the distances between repetitions of a word. These methods have as yet involved little pre-processing of texts so, presumably, quotations may not have been removed. They also do not, so far, take account of genre changes between and within texts. Despite these drawbacks, the figures in the table for the NT books most distant from, and closest to, each other are in the main generally comparable with results in this article and elsewhere, though they do not capture features that are clearer when other texts from the NT era are included, and when the data are further partitioned into samples of 1,000 words. It is also to be hoped that, as methods such as PPM are refined, it might be possible to identify which words are implicated in the strings of characters that contribute most to the outcome.
4.
The sample from Hebrews was slightly shorter at 4,000 words; the method can cope with this.
5.
The texts that contrast most with each other have the highest values in a column of numbers in the numerical output. This is located by searching for the column listed as showing the contribution* that each row of data makes to the first dimension, or first component, i.e. to the major contrast.
6.
There is a similar column of numbers showing which criteria score highly as contributing to the major contrast on the first dimension.
7
The figure (60.56%) is described more technically as the proportion of inertia* or variance* explained, i.e. the amount of variation in the use of the criteria in the texts explained by the method. (Johannine narrative accounts for a further tranche of the variation, see n. 10 below.)
8.
Different software can sometimes reverse this. This is not of importance as it is the interpretation of the contrast which is significant, not whether that is displayed left to right or right to left, though the interpreter may sometimes feel as if a journey has been taken through a mirror.
9.
With Correspondence Analysis one can compare the position of one text with that of another, and the position of one criterion with another. Comparing positions of texts and criteria needs more care. On this see Greenacre 1984: 65. His description implies that given the location of the texts a function word ‘tends. . .in the direction’ of the texts that use that word more heavily. A similar view (see ![]() ) starts by locating the centre of the plot, and then infers that texts and criteria lying in a similar direction from the centre are associated. Also, if a text lies in one direction, and other criteria in the opposite direction from the centre, then the text probably makes much less use of those words.
) starts by locating the centre of the plot, and then infers that texts and criteria lying in a similar direction from the centre are associated. Also, if a text lies in one direction, and other criteria in the opposite direction from the centre, then the text probably makes much less use of those words.
10.
This accounts for a further amount of the variation in the use of the criteria by the different texts, raising the amount identified here from 60.56% to 69.15%. Narrative from the Fourth Gospel makes little use of γάρ and kατά and is relatively low on ɛἰ, ἐν, and δɩά as well.
11.
12
Results are similar for Josephus and Philo, though use of πɛρί is less in speeches in Josephus.
13.
The additional data include tables giving the precise co-ordinates on the plot for each sample, and for each key word variable, and this information underpins the interpretation where samples from two authors overlap, as is the case with Philo and one of the Josephus samples. The output also includes plots of further contrasts, each accounting for successively smaller proportions of the variation in the way the texts use the words. For example, the way Johannine narrative forms a third contrast with the other texts was considered in n. 10 above. Also two of the columns of statistics show which texts and which criteria contribute most heavily to the two main contrasts discussed, as was seen in nn. 5 and 6 above.
14.
The first of these calculates the average for each group, and the average variation from average within the group. The second does that and then makes a further adjustment for the number of samples in the group. A large amount of output was produced for the 178 samples of 1,000 words giving means and standard deviations, and then producing plots of the means and one standard deviation for each variable in each set of samples of text. The resulting plots show clearly how groups of texts differ from each other in their use of each function word in turn. This kind of test has to be done on groups of 1,000 word samples, as a mean and standard deviation is required for each group of texts.
15.
The experiments discussed here did not include any specific data on Hellenistic or Attic usages. That issue is discussed in an article (![]() ) which examined some 20 non-Attic verb forms used in Luke–Acts. Of these 5 are found only in the LXX and/or the papyri, another 5 have some precedent in literary Greek from Herodotus to Diodorus Siculus, and 10 of the non-Attic forms are found in Dionysius or Plutarch. The conclusions of that study are compatible with the location of the samples from Luke and Acts in the plots shown in this study.
) which examined some 20 non-Attic verb forms used in Luke–Acts. Of these 5 are found only in the LXX and/or the papyri, another 5 have some precedent in literary Greek from Herodotus to Diodorus Siculus, and 10 of the non-Attic forms are found in Dionysius or Plutarch. The conclusions of that study are compatible with the location of the samples from Luke and Acts in the plots shown in this study.
16.
I am grateful to the readers of the article whose recommendations included the initial simplified diagrams, the explanation or removal of numerous technical terms, and the provision of a glossary. I also acknowledge the use of TLG (2000) and the tagged text of the New Testament by Barbara and Timothy Friberg (c.![]() ).
).