
Abstract
This study describes the importance of creativity in the identification of gifted elementary-aged children and presents the process of validating a scale for rating the creativity of the students through the teachers’ responses. The results show the instrument’s unifactorial structure, satisfactory levels of internal consistency, as well as convergent and discriminant validity. The results are discussed in terms of their implications for the work of school psychologists.
Keywords
The concept of giftedness has varied over time, depending on the degree to which intellectual ability has formed the basis of the definition, or whether it has been considered only one of many ways to define giftedness (Callahan, 2004). Current perspectives on the definition of giftedness highlight its multi-faceted nature, including both cognitive factors (e.g. intellectual and creative abilities) and non-intellectual and/or personality factors. Runco (2005) highlights that all the conceptions of giftedness share, as a fundamental characteristic, the potential to perform creative work; ‘the gifted child may have domain-specific knowledge and be motivated to invest in only one particular domain; but, whichever domain it is, the gifted individual will have the capacity for creative work’ (Runco, 2005, p. 295).
Thus, among the conceptual models that include creativity as a basic characteristic of giftedness, the proposals by Renzulli (1978), Gagné (2004), and Sternberg (2010) stand out. In the Three-Ring Model by Renzulli, in order for an individual to be able to display gifted behaviors, there is a need for the presence of above-average skill, creativity, and commitment to the task and it is the interaction among these three that leads to a creative production. In the Differentiated Model of Giftedness and Talent proposed by Gagné, creativity is included—together with other skills—as an ability that, through processes of developing talent and influenced by different motivators, will lead to the emergence of talents. Finally, in his WICS model of giftedness (2010) Sternberg stated a belief that the synthesis of wisdom, intelligence, and creativity is fundamental to the presence of giftedness.
Within this general framework, we have carried out this study in which creativity is considered a fundamental dimension of the giftedness construct. In this sense, we accept that giftedness is a multidimensional attribute, considering it as an interaction of systems composed of cognitive abilities, personal components like creativity and motivation, and characteristics of the individual’s immediate context (family andschool). More specifically, our identification model in elementary education (4C x 3C) evaluates four dimensions or abilities called Learning Capacity, Communication, Social Competence and Creativity (4C), based on three contexts (3C) or sources of ratings (teachers, parents, and peers). The instruments elaborated are adapted to the differential characteristics of the three rating sources, thus reflecting the different perspectives that people who interact with gifted children can have. Previous studies on the identification model have shown its effectiveness in the initial detection of gifted individuals (Pérez-González, 2006; Talaya, Pérez-González, & García-Ros, 2006).
Specifically, in this article we present the scale for rating creative behaviors directed toward elementary education teachers (Teacher Scale for Rating Students’ Creativity, TRSC). The evaluation of creativity by means of psychometric tests, although useful from our perspective, is limited to the measurement ofdivergent production in a very restricted way (Piirto, 2004). The main advantage of the rating scales, on the other hand, is the fact that they are able to synthesize a large number of observations of a student in a reliable and efficient way (Jarosewich, Pfeiffer, & Morris, 2002). In other words, they make it possible to rate a large number of characteristics contextualized in the school activity, and they are especially useful due to their simplicity and ease of application, and because it ispossible to involve the teachers from the initial moments of the identification process.
With regard to the characteristics of creativity contained in the TRSC, in the initial version of the scale we used the behavioral manifestations of creativity highlighted by Renzulli (1986, 1990) as a base: Fluidity, flexibility, and originality; openness to experiences; curious, speculative, adventurous, and ‘mentally playful’; and sensitive to details, aesthetic characteristics of ideas and things. The TRSC includes the majority of these manifestations, including items related to aspects like fluidity, originality, flexibility, curiosity, mental openness, sense of humor, and preference for complexity.
Objectives
The main objective of this article is to present the process of development and validation of a scale designed to evaluate the creative behaviors of 6- to 12-year-old elementary school students through teachers’ ratings, which is useful in the process of identifying gifted individuals in this educational stage. In a more detailed way, the study has four objectives:
to elaborate a Teacher Scale for Rating Students’ Creativity in Elementary School;
to determine the underlying factorial structure and obtain an initial validation of the TRSC (item-total correlations and internal consistency);
to analyse the factorial and convergent/divergent validity of the scale;
to analyse the scale’s functioning with regard to the gender and educational level of elementary education students.
Method
Participants
The participants in the study were 41 teachers and 350 Spanish elementary school students (6- to 12-years of age). Participants were selected from 13 different elementary schools in the Valencian Community, Spain. All of the participating teachers were classroom teachers of the students being evaluated, so that they would have broad and direct knowledge of them. The mean age of the students was 9.0 years with a Standard Deviation of 1.5. They were enrolled in the different levels of elementary school education (1st and 2nd grades = 55, 3rd and 4th grades = 61, 5th and 6th grades = 84), distributed in a balanced way according to gender (176 boys and 174 girls) and type of center (public schools = 225, subsidized semi-private schools = 125). The students presented with a middle to low-middle socio-economic level.
Procedure and instruments
The preliminary TRSC
We developed an initial scale based on a review of the relevant literature in the area of creativity and identification of gifted individuals, considering the available subscales on creativity proposed by various identification models (e.g. Gilliam, Carpenter, & Christensen, 1996; McCarney & Anderson, 1989; Renzulli et al., 2002). An initial pool of 12 items was generated, which was submitted to analysis and rating of three expert reviewers in the area of identification of gifted subjects. One item was eliminated, as it was considered redundant, and another item was rewritten to enhance comprehension and eliminate possible ambiguities. Finally, the version completed by teachers consisted of 11 items. The scale can be found in Appendix 1, and the procedure used for its administration is described below.
Factorial structure and initial validation
This initial version of the TRSC was evaluated by presenting it to teachers in order to obtain their rating of the level of creativity of an initial group of 150 students. The questionnaire was completed by teachers individually. They responded to items on the questionnaire using a five-point response scale: Never (1), Rarely (2), Sometimes (3), Often (4), and Always (5). Items were scored so that higher scores indicated a greater perceived creativity level.
Factorial and convergent validity
We applied the scale to the teachers of a second group of 200 students from the same educational levels. In this phase of the study, and with the objective of testing the convergent/divergent validity of the TRSC, we gave the students two additional psychometric tests commonly used in formal detection processes: (1) Raven Progressive Matrices Test (Raven, Court, & Raven, 1996)—we selected this test because it is considered one of the most valid tests in the process of identifying students’ general intellectual capacity (Tourón, Peralta, & Reparaz, 1998), and (2) Torrance Creativity Test—an adaptation of the graphic and verbal subtests of the TTCT was applied (Torrance, 1979) to evaluate the creativity of the students, as it is one of the most commonly used psychometric tests in formal procedures for detecting gifted individuals.
Analysis
First, an exploratory principal components factor analysis (EFA) with varimax rotation was carried out with the SPSS 12.0 for Windows, in order to test the dimensionality of the responses offered on the TRSC by the teachers of the first group of 150 students. Next, we analysed the descriptive statistics of the items, the item-total correlations, and the internal consistency reliability (alpha coefficient) of the scale.
Second, confirmatory factor analysis (CFA) using the robust maximum-likelihood (ML-robust) estimation method was carried out with the EQS 5.1 computer program (Bentler & Wu, 1995) based on the responses offered by the teachers about the second group of 200 students. By using the CFA, and based on the covariance matrix of the observed data, we examined two complimentary questions: (a) theglobal goodness of fit of the factorial model emerging from the EFA by using the most traditional indices in structural equation modeling (RMSEA, SRMR, NNFI-TLI, CFI, and GFI); and (b) the analytic goodness of fit indices for each of the items from the TRSC.
Finally, in order to analyse the convergent validity of the scale, we calculated the correlation between the scores on the TRSC and the scores obtained by the students on the Intelligence (Raven) and Creativity (TTCT) tests. We performed a 2 x 3 factorial ANOVA in order to test the functioning of the TRSC with regard to the variables gender and educational level of the students.
Results
Exploratory Factor Analysis (EFA) and item analysis
Item descriptive statistics, factorial saturation and communality
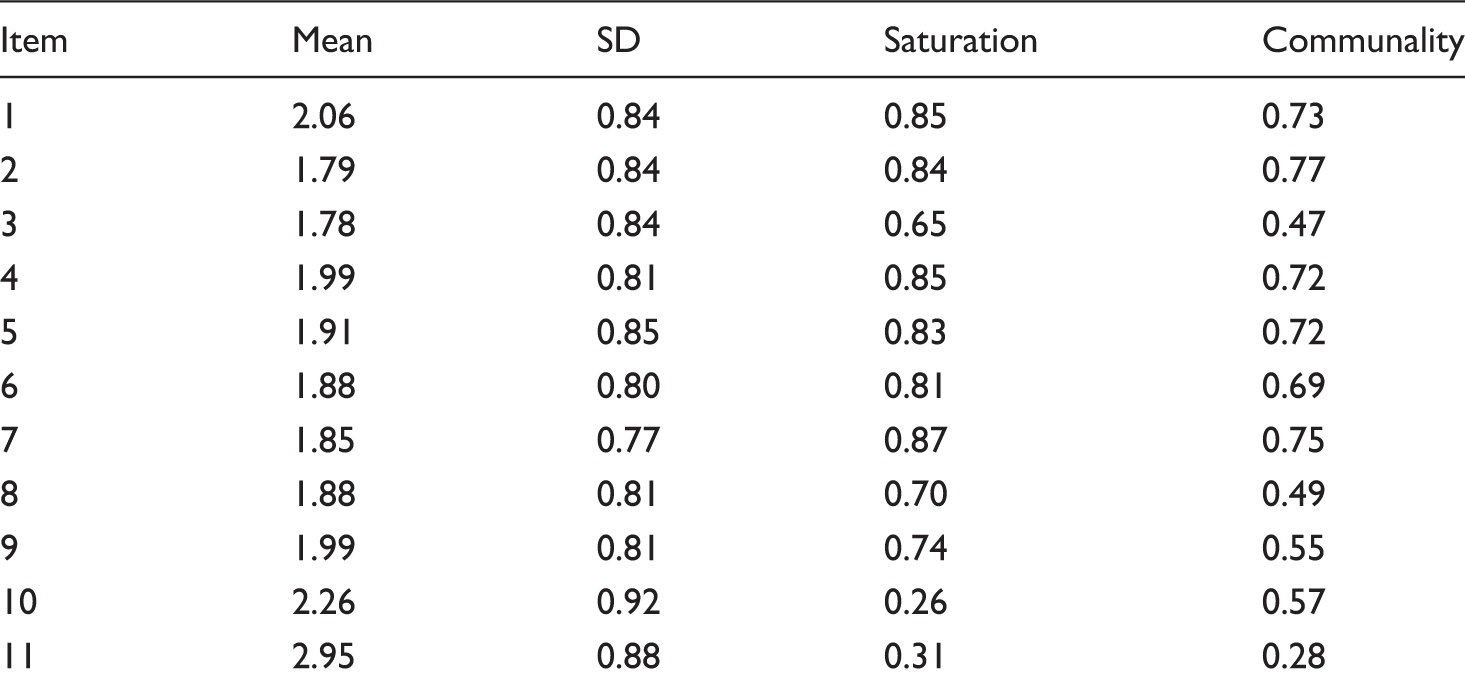
After the EFA, we carried out the following item analysis for the TRSC. The item-total correlations (mean correlation = 0.77; values of between 0.61–0.86), as well as the values if we eliminate the corresponding item from the scale, show that the discriminant capacity of the items is adequate. Finally, with regard to the reliability of the entire scale, it should be highlighted that the result is also satisfactory, given that an alpha coefficient of 0.94 was obtained.
Confirmatory Factor Analysis (CFA)
The purpose of this analysis is to test whether the unifactorial structure obtained is reproduced with a second group of 200 students from the same educational levels. The CFA was performed applying the robust maximum likelihood estimation method, given that the Mardia multivariate curtosis coefficient reached the value of 13.3 (with the normalized estimated value being 17.4), so that the data cannot be considered normal multivariates.
The results of the CFA show that the proposed model has sufficient explanatory power, given that all the goodness-of-fit indices reached adequate values (TLI-NNFI = 0.97; GFI = 0.95; CFI = 0.98; RMSEA = 0.07; SRMR = 0.04). Furthermore, the analytical fit indices for each of the items also present adequate results: Factorial saturations superior to 0.60 are obtained in all cases (mean saturation = 0.78; values of between 0.63–0.91), which confirms the previsions considered in the model with regard to the identification of the items.
Convergent/divergent validity
We used the TTCT and Raven to provide estimates of the convergent validity of the TRSC. When considering the sample as a whole, the correlation between the scores obtained on the TRSC and the TTCT was 0.72 (p < 0.001***), and the correlation between the TRSC scores and those of the Raven Test was 0.80 (p < 0.001***).
Next, we carried out a more detailed analysis, segmenting the total sample into two groups according to their intelligence scores (Superior Group percentile equal to or greater than 90 on the Raven; Inferior Group percentile lower than 90). Significant correlations were obtained in the Inferior Group between the TRSC and all the measures used (rTRSC-RAVEN = 0.73; p < 0.01**; rTRSC-TTCT = 0.66; p < 0.01**); however, in the Superior Group the correlation was only significant with the score on the TTCT (rTRSC-TTCT = 0.51, p < 0.01**), although not with the Raven Test, as the correlation reached a value of 0.24.
Gender and educational level
Finally, in order to test the possible existence of significant differences in the TRSC scores according to the variables gender and educational level of the students, we performed a 2 x 3 between-subjects factorial analysis of variance (gender/educational level). ANOVA results point out the inexistence of significant differences, both for the main effect of the variable ‘gender’ (F (1,194) = 0.22, p = 0.64), and for the variable ‘educational level’ (F (2,194) = 0.94, p = 0.39), as well as for the gender*educational level interaction (F (2,194) = 0.48, p = 0.62).
Discussion and conclusions
The main objective of this article was to present the construction and validation process of a scale for the rating of creative behaviors by teachers, which is useful inthe initial phases of detecting gifted subjects in elementary education (6- to 12-years-old). In the first place, the analyses performed were designed to determine thefactorial structure of the TRSC. The results have highlighted its unifactorial structure, both through an initial exploratory factorial analysis and through a later confirmatory factorial analysis, as the global fit indices and analyses considered show. Likewise, the TRSC showed a satisfactory level of internal consistency (0.94).
An analysis was also carried out of the level of association between the score obtained on the TRSC and the results of two of the traditional measures utilized in the identification of gifted individuals (Raven and TTCT). The results unfolded inan expected direction, showing a significant correlation of the TRSC score with the scores obtained on the two psychometric tests – r = 0.81 (p < 0.001***) with intelligence; r = 0.72 (p < 0.001***) with creativity. These results could cause one to suspect that the TRSC provides a rating that is more related to intelligence than to creativity, and that, therefore, it does not add significant information to what is provided by other rating scales used in evaluation processes designed to evaluate the intelligence and/or learning potential of students. However, Tannenbaum (1996) has already pointed out that a basic intelligence level is essential for creative production, and that, from this level on there is practically no relationship between creativity and intelligence. Therefore, given that in our theoretical perspective we highlighted the importance of considering both criteria in the identification of gifted subjects, it was necessary to test the relationship of the TRSC with intelligence and creativity according to the intellectual level of the students.
With this objective in mind, we divided the second group of subjects into two subgroups according to their intelligence scores (90th percentile). In the superior group, the TRSC score correlated significantly with the score on the TTCT (r = 0.51, p < 0.01**), while it did not do so with the score on the Raven Test (r = 0.24). These data support the convergent and discriminant validity of the TRSC, leading to the conclusion that the scale offers additional information in the identification processes to that provided by the measures designed to evaluate intelligence and/or learning capacity.
Finally, we carried out a 2 x 3 between-subjects ANOVA, in order to test whether the score on the TRSC differed significantly according to the gender and/or educational level of the subjects participating in the study. In this sense, the available literature shows the importance of this question, given that girls tend to be under-represented in intervention programs directed toward gifted individuals. In addition, and specifically in the identification processes, stereotypes can affect the nominations or ratings made by the teachers. As indicated by Davis and Rimm (2004), girls canbe or are expected to be more conforming, less aggressive, and less oriented toward success than boys, which, at the same time, may influence the nominations made by the teachers. The results obtained show that significant differences did not emerge with regard to gender or to the educational level of the students, in the ratings made by the teachers using the TRSC, which indicates that there is no bias related to these two variables.
In conclusion, the TRSC constitutes a valid and reliable scale for rating students’ creativity by elementary school teachers, showing a satisfactory convergent and discriminant validity, and not exhibiting any bias in the case of gender or educational level of the students. Consequently, we consider the TRSC to be a useful tool in theinitial phase of identifying gifted individuals in this stage of the educational system.
The approach and results obtained in this study have important implications forthe field of school psychology. On the one hand, the consideration of these type of tools allows school psychologists to save time and effort in the process of identifying subjects with high capacities. This question is especially relevant given the ratios of school psychologists to school-age children in countries around the world, as even in countries with a high level of economic development and a greater sensitivity toward promoting educational equity among students (Cook, Jimerson, & Begeny, 2010) the ratios are approximately 1: 2000 students (Jimerson, Stewart, Skokut, Cardenas, & Malone, 2009). In an effort to promote school psychological services that help students to succeed academically, socially and/or emotionally, this high ratio makes it necessary to consider using these type of evaluation tools, in addition to intervention proposals directed by school psychologists with the support of the teaching staff (Yeo & Choi, 2011).
On the other hand, as we pointed out in the introduction, creativity is an essential component of giftedness. However, in reality the identification of gifted students is usually based on the application of intelligence (IQ) and/or standardized performance tests, with the evaluation of non-intellectual dimensions being much less common (e.g. Boatman, Davis, & Benbow, 1995; Keogh & MacMillan, 1996). Thus, the outcome is that many students are not correctly identified, and, in our case, subjects with a high creative potential can be excluded from accessing programs and services that respond to their educational characteristics and needs. Along these lines, the TRSC is useful for school psychologists for improving and increasing thevalidity of the process of identifying gifted subjects, given that this tool facilitates the detection of students with a high creative potential while it fosters equity and equality of opportunities, due to the absence of bias related to the students’ gender.
The fact that the TRSC is directed toward teachers also has further implications from the point of view of the practice of school psychology. First, this scale makes it possible to obtain teachers’ ratings of the creativity of their students through a set of relatively simple sentences related to a broad range of typical school activities, and it considers the most relevant indicators of the creative process. This aspect aids the adoption of a collaborative approach between psychologists and teachers––and even with the students’ families, in order to improve educational attention to this type of subjects (Beeman, 1999). Second, the psychometric characteristics and properties of the TRSC allow it to overcome criticisms about the diagnostic value of different rating scales designed to assess intellectual and academic giftedness (Jarosewich et al., 2002; Siegel & Powell, 2004), making it possible to compare the capabilities of the children we are evaluating with classmates in the same grade level in school and offering interpretive norms for the different age groups considered.
Definitively, it provides the school psychologist with relevant information in the identification process and favors the connection between evaluation and later intervention, offering many indicators about the characteristics of the programs and services that can best meet the needs of the subjects. The consideration and use of these type of instruments also involves teachers from the initial phase of the identification process, which facilitates collaboration between school psychologists and teachers involved in developing appropriate educational programs and services.
Finally, we wish to point out that the process of developing and validating instruments like the TRSC highlights the unavoidable necessity of connecting the services provided by psychologists with research endeavors in the field of school psychology. Farrell, Jimerson, and Oakland (2007) point to an international concern that school psychologists are not very involved in research, due to lack of time and level of training or lack of resources, which means that adopting a collaborative approach between researchers and practitioners is imperative in developing ‘inquiry-based-practices’, which favor professional growth and impact improvement in the schools (Atkinson, 2009). This perspective increases our understanding of the complexity of the contextual factors involved in the problems addressed by school psychologists and the need to develop more effective intervention proposals.
In summary, we share the idea that the main objective of the school psychologist consists of improving the quality of life of all the subjects, with special emphasis onthose who present special needs (Cook et al., 2010). In this sense, we feel that this study can make a modest contribution to achieving this aim in subjects with high capabilities.