
Abstract
Keywords
Assistive technology (AT) is a vital tool for facilitating educational access and communication of information for students with visual impairments (i.e., those who are blind or have low vision). When implemented successfully, AT can promote students’ academic and vocational development (Smith & Kelly, 2014). Moreover, AT can foster independence and productivity for students with visual impairments (e.g., Farnsworth & Luckner, 2008). Specifically, the role of “high-tech” AT, such as electronic devices and computers, became a major focus in visual impairment research and practice in recent decades (e.g., Smith et al., 2009). The focus of this pilot study is on high-tech AT.
Despite policies supporting AT implementation, access cannot be automatically assumed for every student with visual impairment. For example, the National Assistive Technology Research Institute found that only one-third of students with disabilities who have an AT device receive AT services and that students rarely used AT devices in general education classrooms (Quinn et al., 2009). Studies of AT use of students with visual impairments are somewhat dated (e.g., Parker et al., 1990) or focused only on limited aspects of AT (e.g., Kelly, 2009).
Professionals in the field of visual impairment have long sought to improve AT services. A current portrait of AT usage for students with visual impairments is needed to inform this work. The purpose of this pilot study was to examine AT use of students with visual impairments through the following research questions: What are the characteristics of students with visual impairments who use AT? What are the attributes of the AT devices students use? How do students use these devices? What AT services do students with visual impairment receive? What district policies address AT use? What do teachers of students with visual impairments perceive are the effects of and barriers to AT?
Method
Recruitment
After obtaining institutional review board approval from Vanderbilt University, we recruited teachers of students with visual impairments (TVIs) who had at least one student who used AT. We defined high-tech AT as any computing device or software used by students with visual impairments (e.g., iPhones, talking calculators, laptops, and JAWs or ZoomText software). Devices, such as slant boards, telescopes, and canes were excluded from this definition. We first reached out to special education directors or lead TVIs (n = 72) to gain district approval and obtain TVIs’ contact information. We then contacted TVIs (n = 27) in the 21 interested districts to inform them of the study and its compensation (i.e., $10 gift card for each student for whom they provided information). Twelve TVIs provided data for 51 students.
Participants
The 12 TVIs worked in 9 rural and suburban counties in Tennessee. The sample was entirely female and predominantly white (91.7%). One TVI chose not to report race or ethnicity. All TVIs had a master's (83.3%) or doctoral (17.7%) degree. Educational experience ranged from 4 to 48 years (M = 21.1 years). Teachers averaged 8.8 years of experience in providing AT instruction (range, 2 to 20 years). Their average caseload size was 10.5 students (range, 2 to 25 students).
Students
The TVIs who participated in our survey worked with 51 students who used AT devices (see Table 1 for demographics). The average number of students with AT on TVIs’ caseloads was 4.25 students (range, 1 to 16 students). The average age of students was 11.5 years (SD = 3.8). Two-thirds (66.7%) of students had additional disabilities. Many (43.1%) students attended inclusive classes all day, 21.6% for most of the day (3 blocks/5-6 periods), 2.0% for half of the day (2 blocks/3-4 periods), 21.6% for some of the day (1 block/1-2 periods), and 19.6% spent no part of their school day in inclusive classes.
Demographics of the Students.
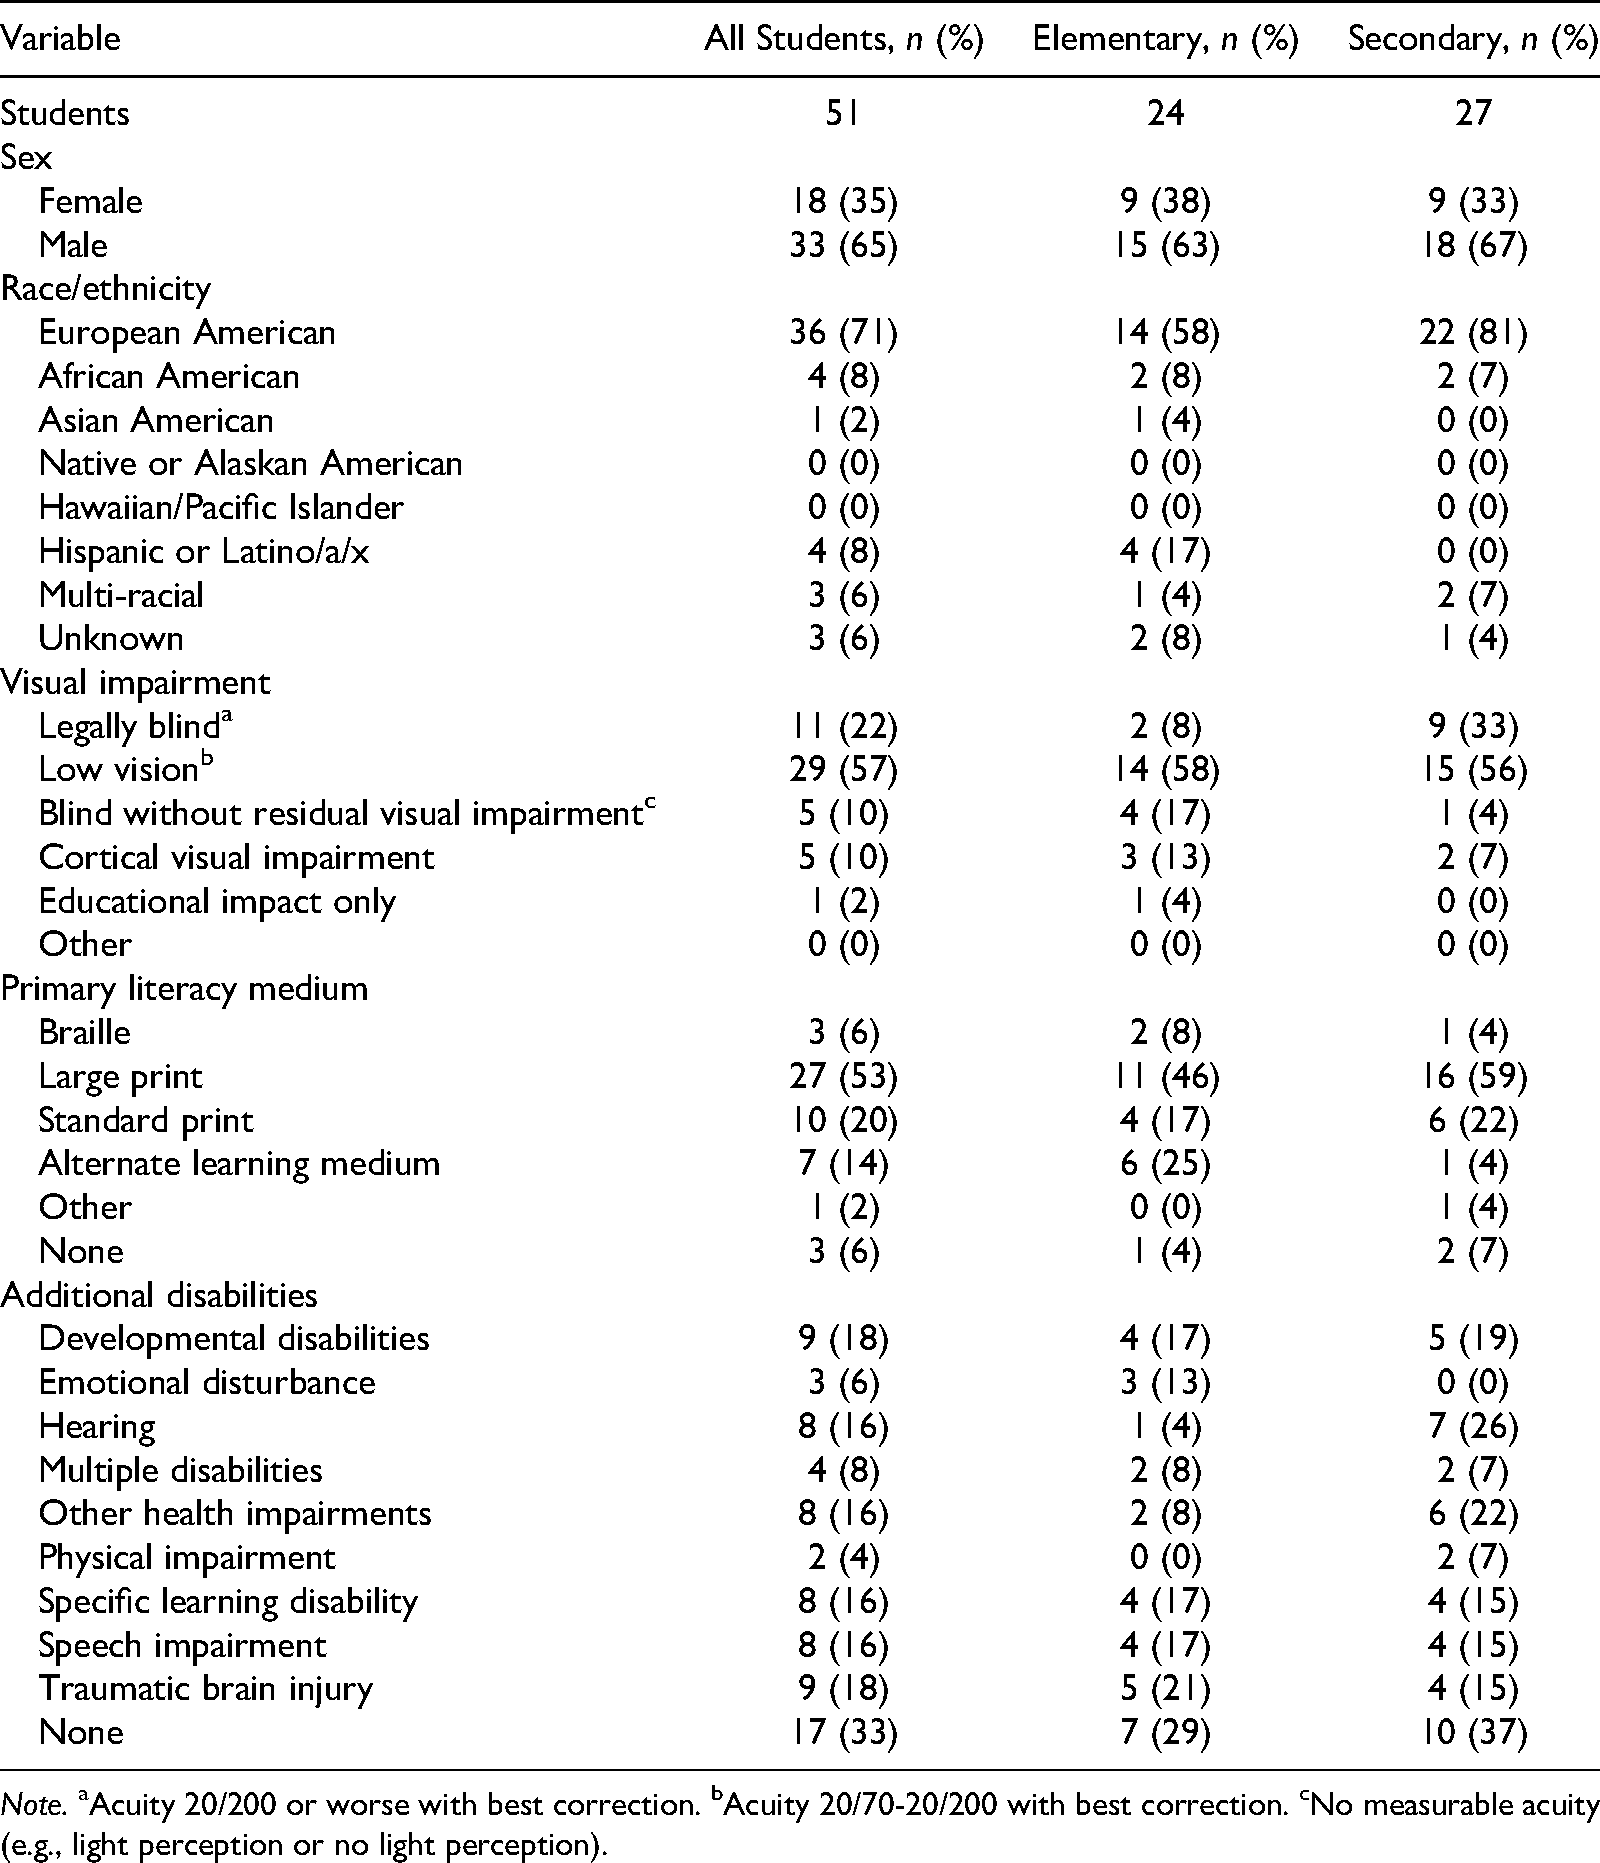
Note. aAcuity 20/200 or worse with best correction. bAcuity 20/70-20/200 with best correction. cNo measurable acuity (e.g., light perception or no light perception).
Survey Instrument
Drawing upon prior research (Bausch et al., 2015), we developed a survey to examine AT use and services received by students with visual impairments. The research team included a doctoral student with expertise and experience in AT and visual impairments, and a faculty member with expertise in survey design. We reviewed the available literature on AT use (e.g., Abner & Lahm, 2002; Bausch et al., 2015; Kapperman et al., 2002; Kelly, 2009; Kelly, 2011) and collaboratively developed an initial set of survey items. The survey went through multiple rounds of revision after being reviewed internally and by an initial group of educators. Revisions addressed the clarity, accessibility, length, and thoroughness of the survey. The final version included seven sections (see below) and was completed using a secure online survey system (REDCap; Harris et al., 2009).
Caseload Information
Teachers identified the number of students who used AT on their caseload. Then, teachers responded to demographic questions (see Table 1) for each student.
Device Attributes
TVIs provided information about each student's devices and software (e.g., screen enlargement or screen reader software, audiobook applications) by writing the number and names of each type of AT. See Table 2 for a list of characteristics teachers identified about devices.
Device Attributes.
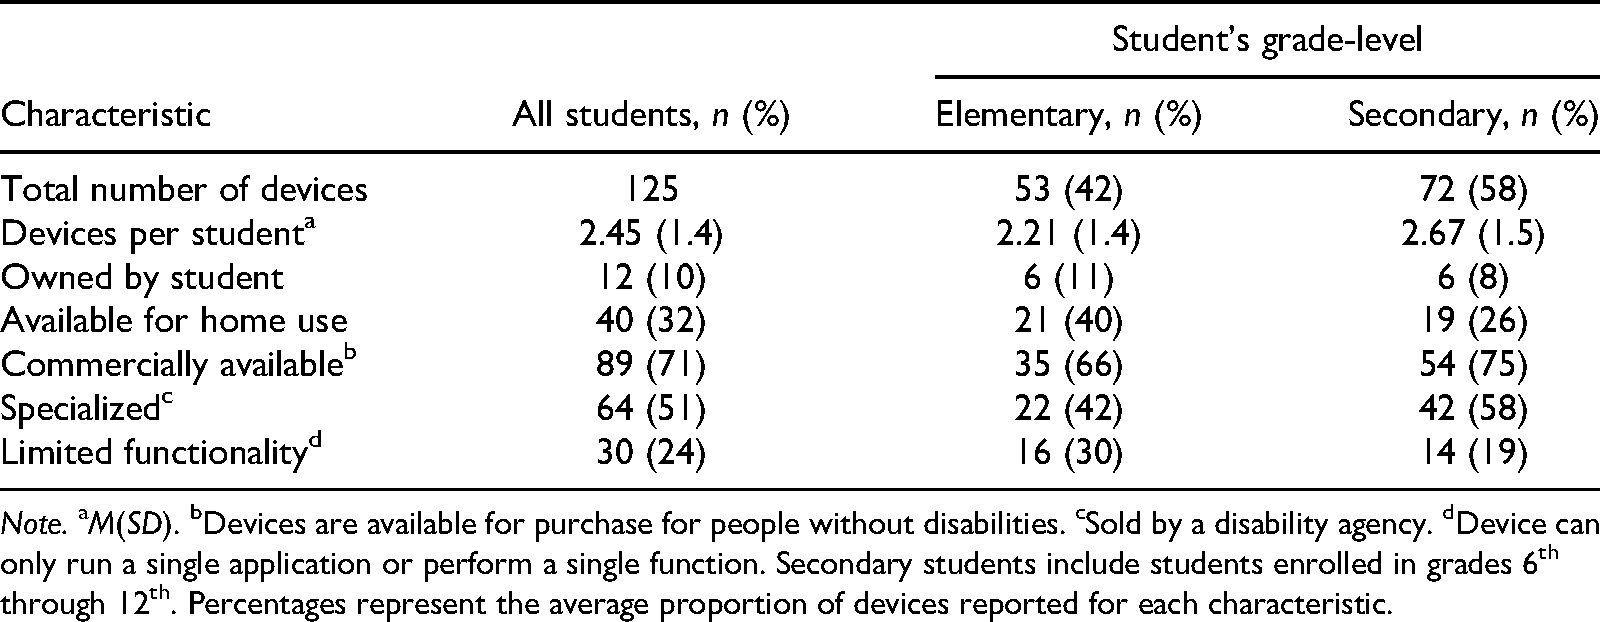
Note. aM(SD). bDevices are available for purchase for people without disabilities. cSold by a disability agency. dDevice can only run a single application or perform a single function. Secondary students include students enrolled in grades 6th through 12th. Percentages represent the average proportion of devices reported for each characteristic.
Device Usage
We asked seven questions about how and where students used their AT devices. First, TVIs indicated which of seven visual aid and screen- or print-access functions the student uses: accessible books (e.g., highlighting, enlarging, or playing audiobooks), contrast adjustment, document scanning (for enlargement or optical character recognition), lighting adjustment, refreshable braille, screen enlargement, and screen reader.
Second, they indicated which of nine instructional aid functions the student uses: access to general curriculum instruction (e.g., completing classroom assignments, participating in general technology use), calculation, custom activities (e.g., functional activities in a resource room or adapted class activities), instructional notes (e.g., audio recording or typed), Internet usage, presentations (e.g., PowerPoint or videos to present information to peers), task management (e.g., use of calendar or schedule or reminders), word processing, and word prediction or digital dictionary.
Third, they indicated which of four augmented skills the student uses: augmentative communication, distance viewing (to view a whiteboard or read a sign), eye gaze, and identification (e.g., identifying labels or colors of items).
Fourth, they indicated which of four recreation functions the student uses: games (outside of school), navigation (e.g., Global Positioning System), resource creation (e.g., printing pictures or 3D objects), and social applications (e.g., text messaging, Facebook, Twitter, etc.).
Fifth, teachers indicated the subjects for which students used AT: English and language arts, mathematics, social studies, science, related arts (e.g., art, physical education), electives (e.g., economics, media, computer class), resource classrooms (special education), or none.
Sixth, teachers estimated the percentage of classroom assignments each student could complete on their devices in 10 increments (e.g., 0–10%, 11–20%, 21–30%, … 91–100%). Finally, using these same response options, teachers indicated the percentage of classroom assignments that could not be adequately adapted for AT devices.
AT Assessment
We asked whether TVIs had an AT assessment on file for each student. If they indicated yes, we asked the age of each student's most current assessment. We also asked whether each student had a written implementation plan for their high-tech devices.
AT Instruction
We asked about the frequency, duration, and focus of AT instruction. Teachers estimated the frequency of instruction for each student: daily, extra-weekly (more than once a week), weekly, extra-monthly (more than once a month), monthly, consult (less than once a month), or none. Next, they estimated the duration of AT instruction: less than 30 min, 30–60 min, 60–90 min, 90–120 min, more than 120 min, or not applicable. Then, they indicated which topics were covered during instruction. Options included the seven visual aid and screen- or print-access functions, the nine instructional aid topics, the four augmented skills topics, and the four recreation topics listed in the prior section. Finally, TVIs indicated how often they implemented AT progress monitoring checks using the same frequency options as the frequency of instruction.
AT Policies
Teachers responded to eight questions about district AT policies and resources. Information in this section was provided once by each teacher. First, TVIs were asked whether their district had written AT guidelines or procedures: yes, no, or unknown. Second, they indicated if AT assessments were conducted to select student devices. When assessments were used, TVIs were asked to select the primary job title of the person who conducts AT assessments: local AT specialist, outreach AT specialist, orientation and mobility instructor, occupational therapist, special education teacher, speech-language pathologist, TVIs, teacher of students with hearing impairments, IT personnel, or other. Third, we asked TVIs to indicate all AT assessment protocols used in their district: American Foundation for the Blind AT Assessment (Presley & D'Andrea, 2009), SETT (Student, Environments, Tasks, and Tools) Assessment Model (Zabala, 2005), Wisconsin Assistive Technology Initiative (WATI; Gierach, 2009), Custom Checklist (e.g., made by the assessor), or other. Fourth, we asked TVIs if their district utilizes a written implementation plan to assign AT expectations of use and instructional responsibility (i.e., yes or no). Fifth, TVIs were asked to select the primary job title of the person who provides AT instruction using the same job title options as the primary AT assessor. Sixth, we asked teachers to select which curricula or sources they use to develop AT lessons: American Printing House for the Blind (e.g., Talking Typer, Verbal View), device manuals (e.g., teaching commands listed in device manual), EVALS (a milestone checklist; Texas School for the Blind and Visually Impaired, 2007), YouTube tutorials, other, or custom. Seventh, we asked teachers to indicate all the funding sources used to procure AT devices in their district: district funds, student's family or care givers, state vocational funding, disability agency grant (e.g., Lion's Club, Delta Gamma), Federal Quota funds, or donations. Finally, TVIs indicated who was responsible for setting up devices using the same job title options as the primary AT assessor.
AT Perspectives
We asked TVIs to provide their perspectives on the provision of AT services and instruction (4 items), the effect of AT (8 items), the barriers to acquiring AT services (19 items; see Table 4) using a 4-point Likert-type scale: 1 = strongly disagree, 2 = disagree, 3 = agree, 4 = strongly disagree. An option to indicate I don’t know was also available.
Perspectives of Assistive Technology of Teachers of Students With Visual Impairments.
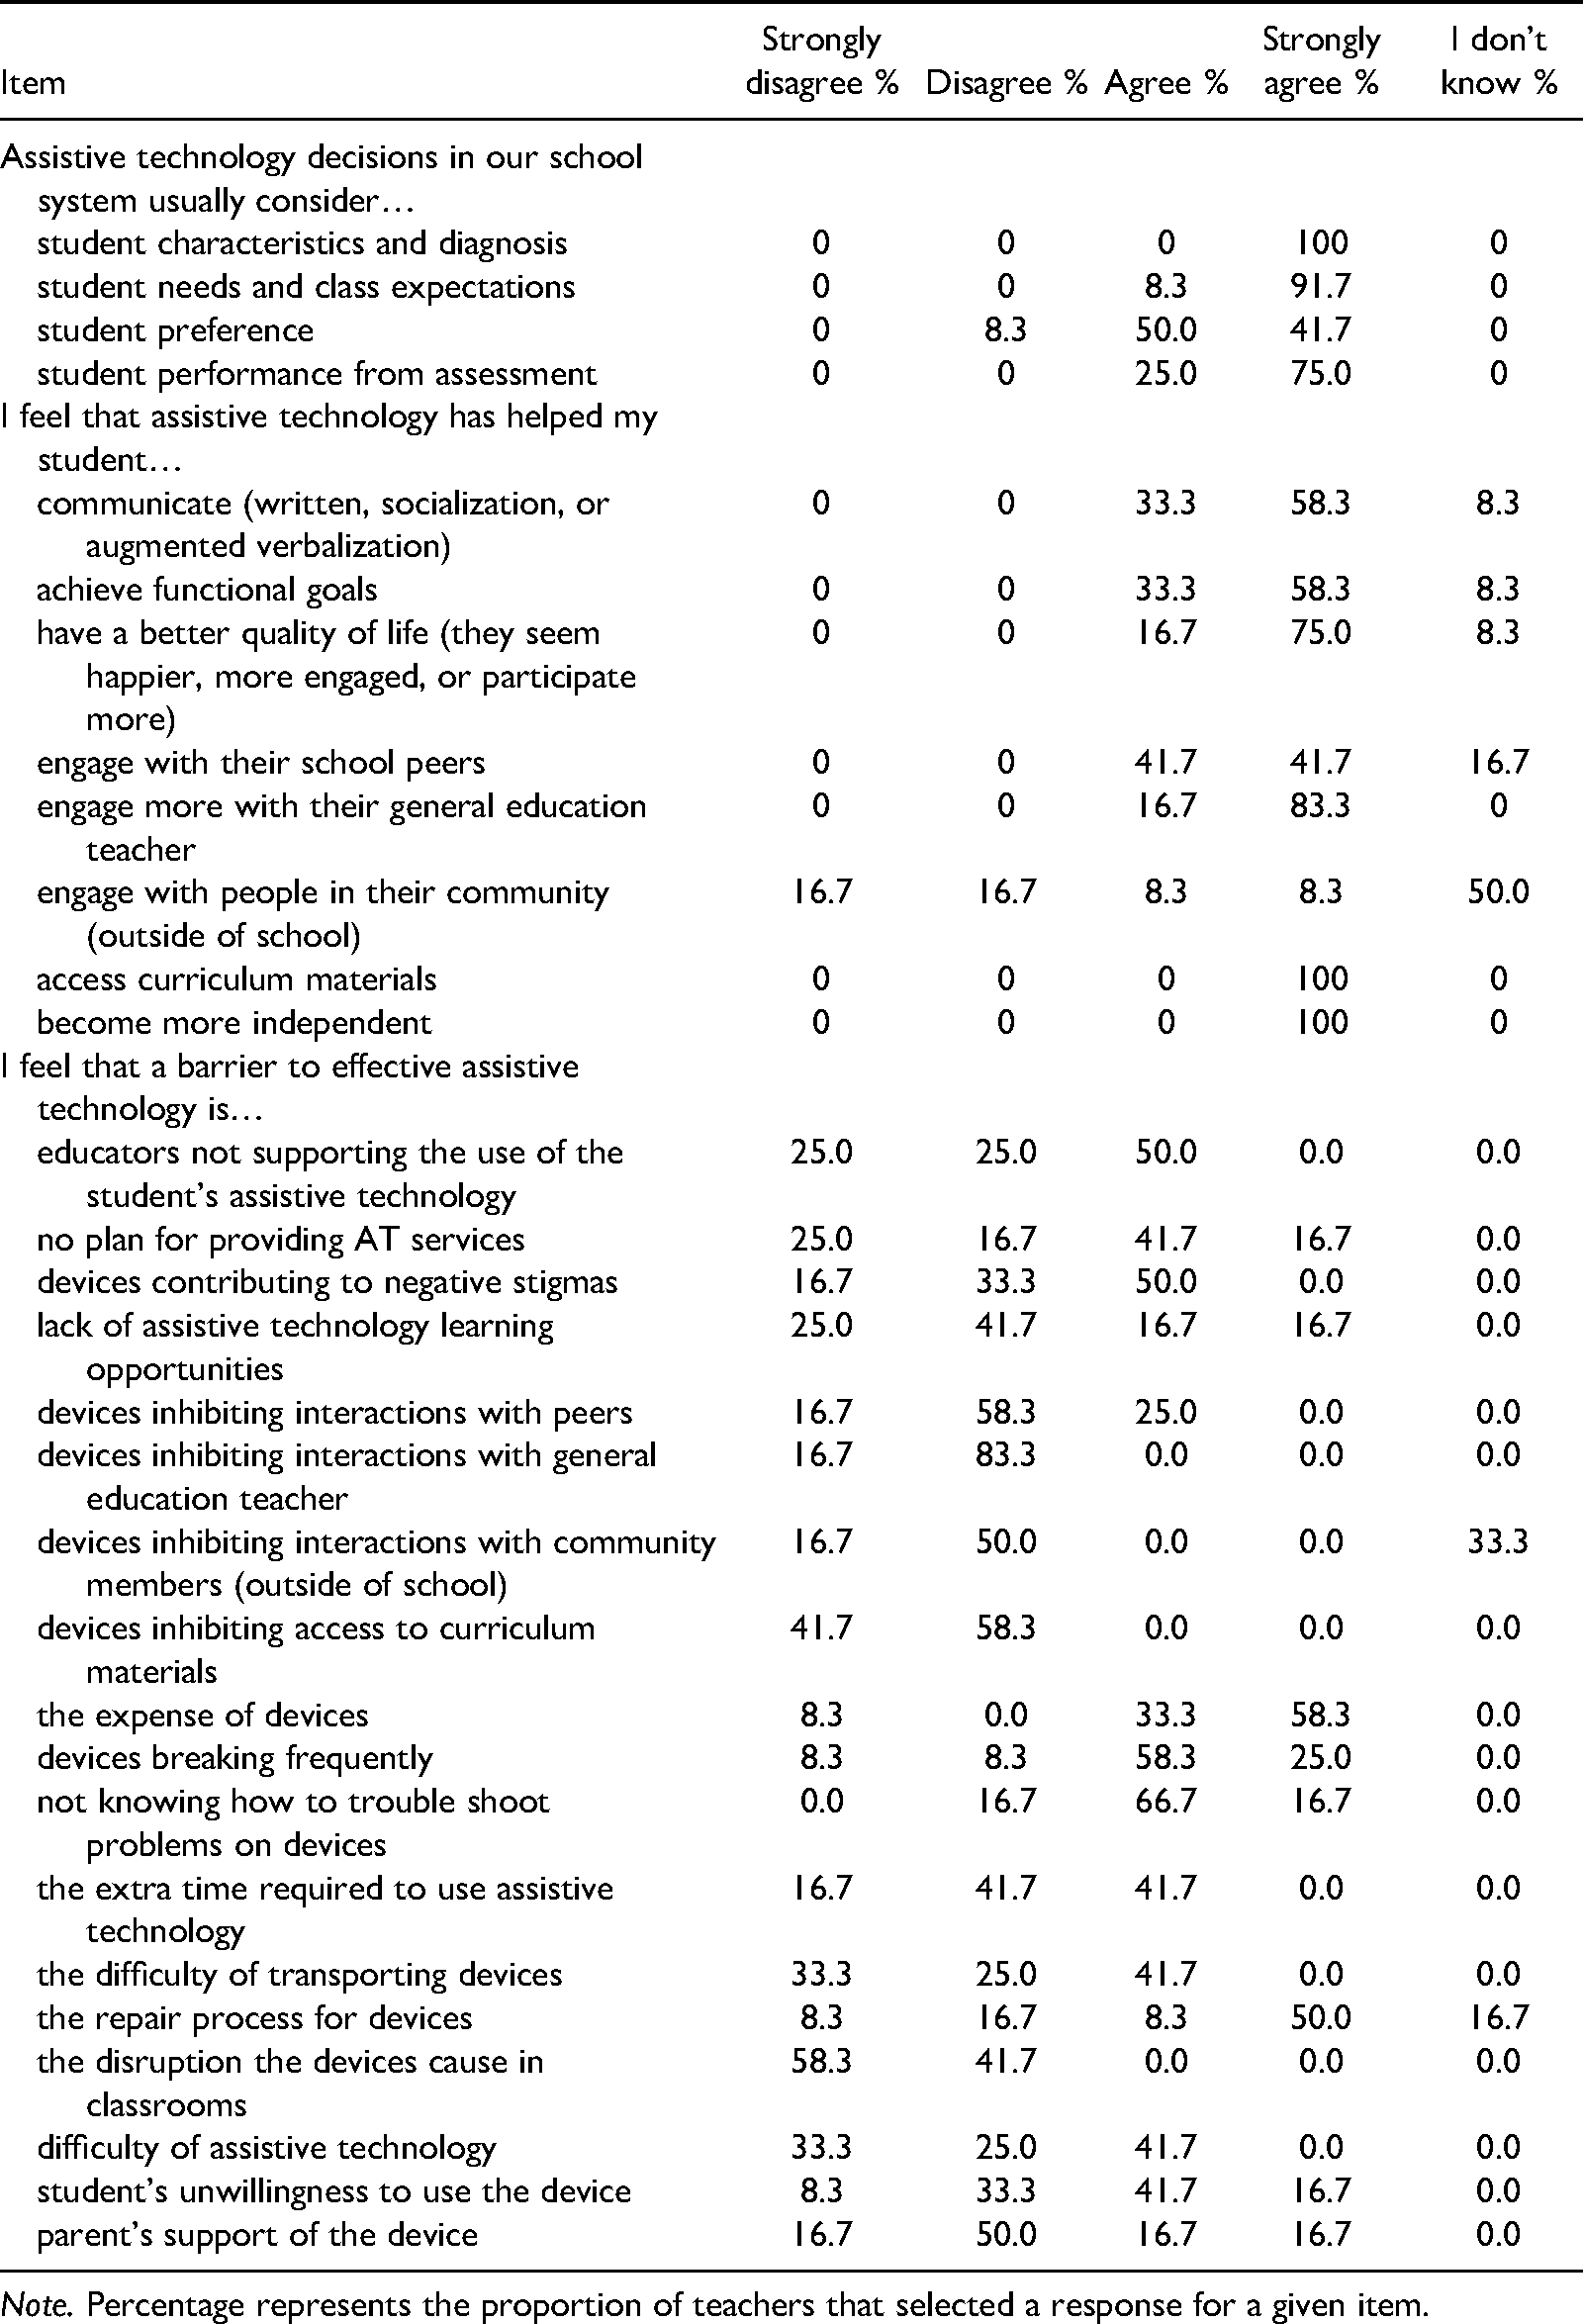
Note. Percentage represents the proportion of teachers that selected a response for a given item.
Data Analysis
We analyzed responses to all questions using descriptive statistics. We also conducted exploratory analyses using chi-squared tests for device attributes, device usage, and AT instruction across elementary and secondary school levels. We used Fisher's exact test on three occasions when the frequency was less than five students in one cell of the chi-squared matrix. Our primary interest was in whether there were differences in the types of devices used, the ways students used devices, or topics of instruction students received across school levels.
Results
What Are the Attributes of the AT Devices Students Use?
Table 2 includes information about device attributes by grade level. The number of high-tech devices used by students was slightly more than two devices per student on average (M = 2.45; SD = 1.4). The most common devices were tablets (e.g., iPads, Android tablet; n = 27), video magnifiers or large computer screens (n = 25), laptops (n = 23), book readers (n = 7), refreshable braille displays (n = 6), talking or enlarged calculators (n = 4), and augmented or alternative communication devices (n = 4). The types of software listed for students included text-to-speech (n = 4), screen magnification or enlargement (n = 6), audiobook applications (n = 3), and games (n = 1). Most devices used by students were identified as being commercially available (i.e., could be purchased by someone without a disability; 71.2% of devices). Interestingly, almost half of the devices were labeled as specialized devices (i.e., devices sold by a disability agency; 51.2%). Some confusion with the definitions of commercially available and specialized devices may account for the overlap in labeling devices, despite the fact that definitions and examples of the terms were provided within the survey. Only 9.6% of devices were owned by students. Few devices (32.0%) could be taken home by students. Almost one-quarter of devices (24%) performed only a single function (e.g., calculating, magnifying, or accessing books).
How Do Students Use These Devices?
Students’ use of high-tech devices most frequently focused on print access and instructional aids (see Table 3). The three most common forms of print access were screen enlargement, lighting adjustment, and contrast adjustment. Usage related to print access was relatively consistent across grade levels. For instructional aids, the most common uses of devices included access to general curriculum instruction, word processors, and custom activities. Internet use and word processing were specified slightly more for secondary students than elementary students. In contrast, notetaking and word prediction use were specified slightly more for elementary students than secondary students. However, these differences were not statistically significant. TVIs reported that students rarely used devices for recreational use or to augment visual or communication skills (e.g., distance viewing and augmented or alternative communication). The only significant difference in usage topic was augmented communication, which was used more frequently by elementary students than secondary students (χ2 = 4.86; p = .028). For recreation, games and social applications were most common and were primarily used by secondary students. Moreover, devices were used mainly in core-content classes. Secondary students were significantly more likely to use devices in mathematics classes (χ2 = 5.89; p = .015) and elective classes (χ2 = 10.85; p < .001).
Device Usage Assistive Technology Instruction and Topics.
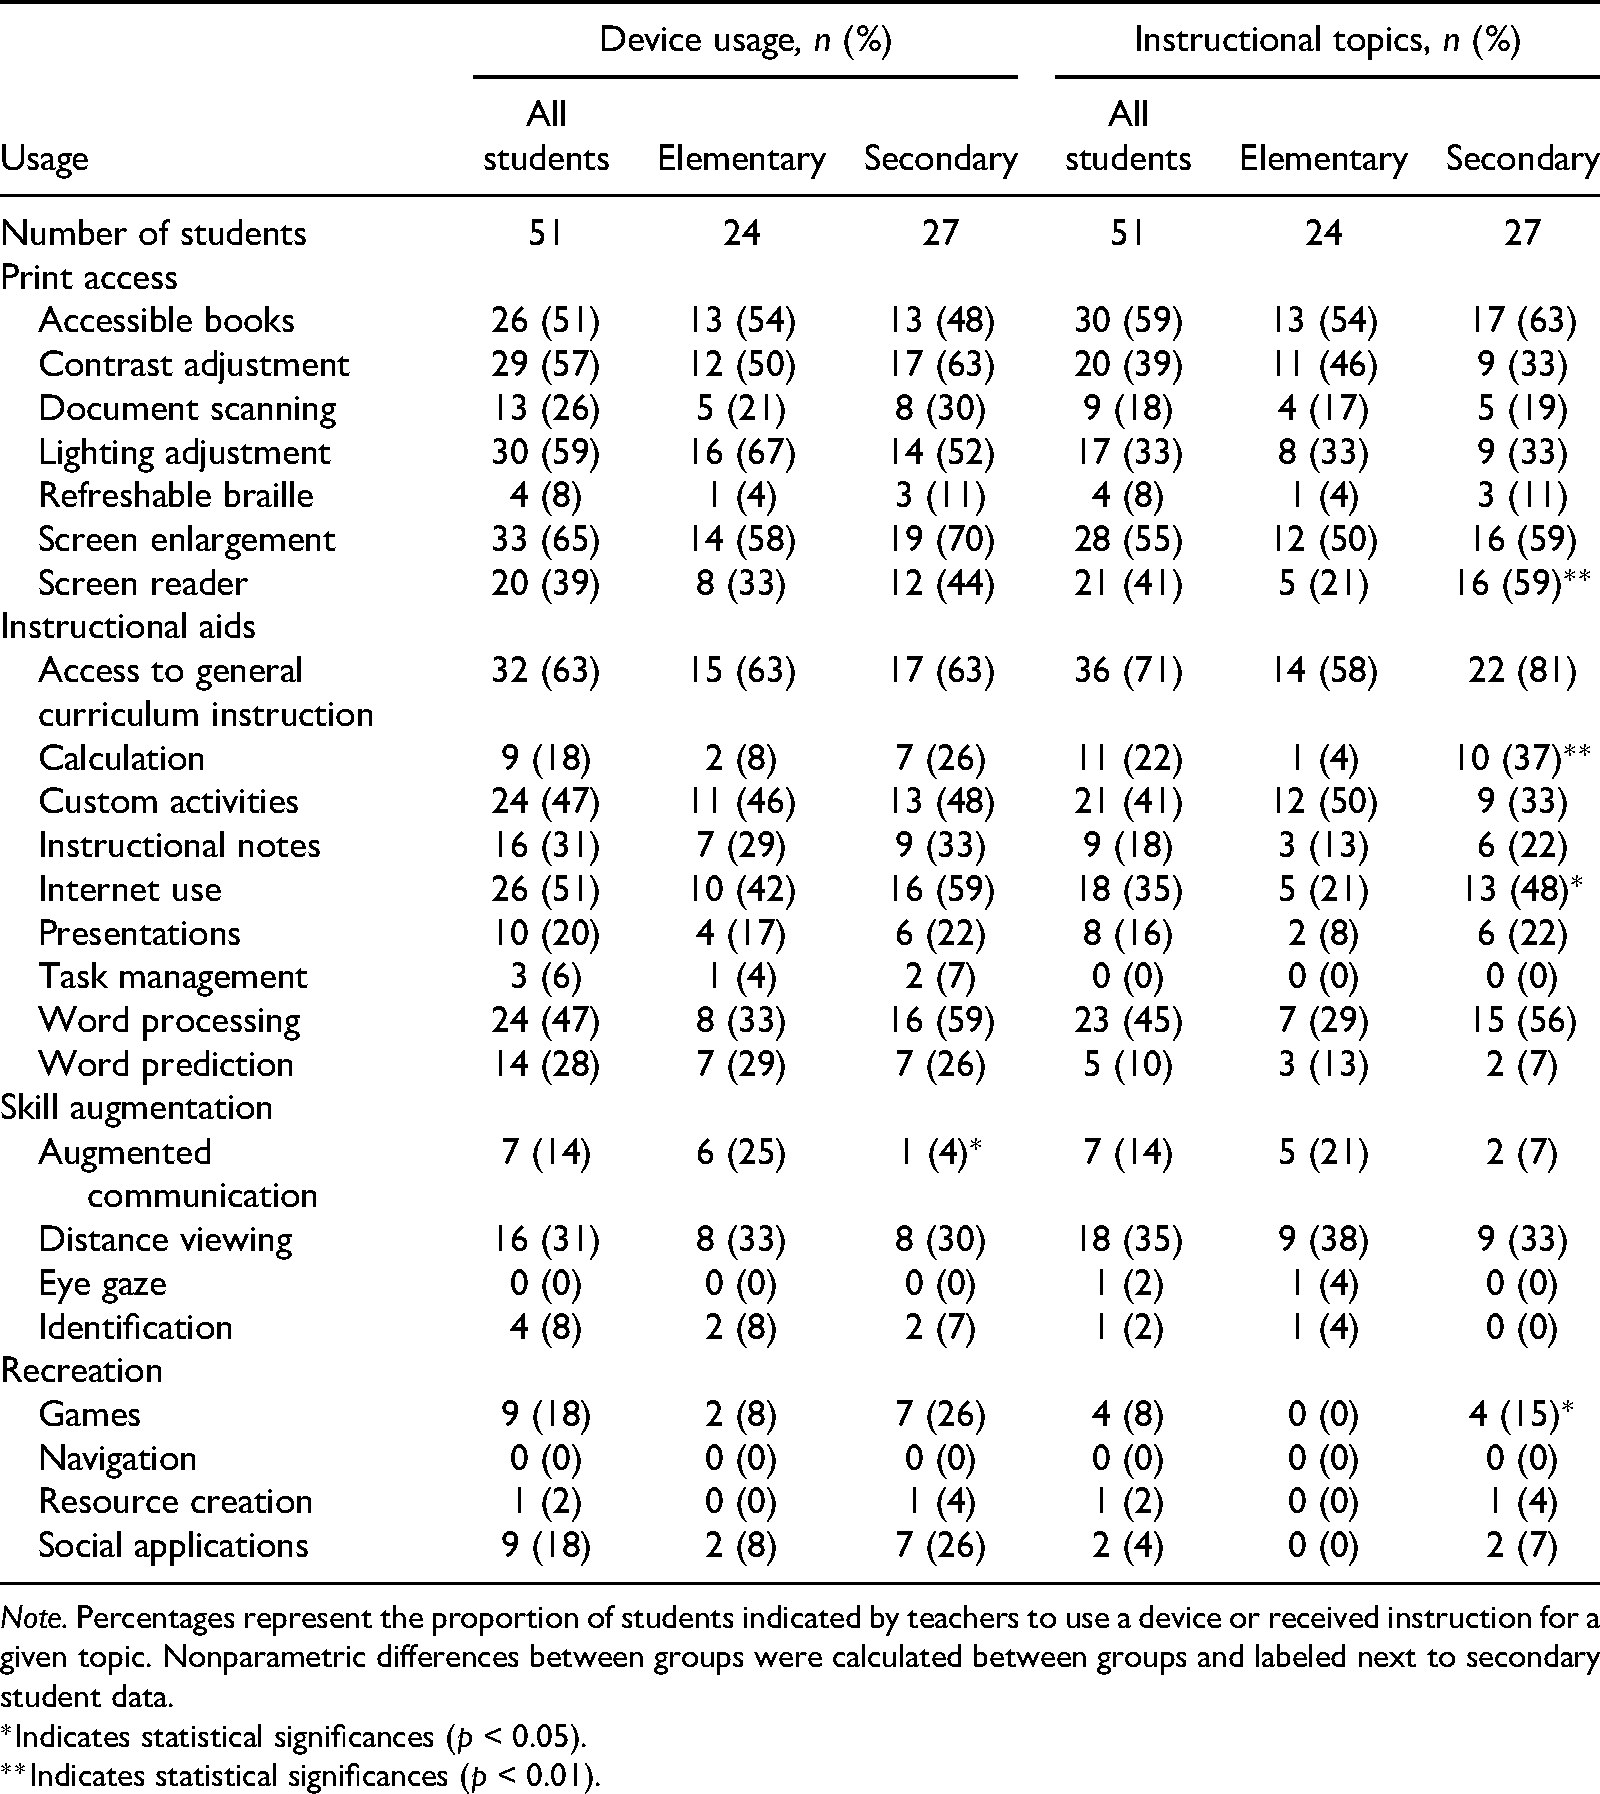
Note. Percentages represent the proportion of students indicated by teachers to use a device or received instruction for a given topic. Nonparametric differences between groups were calculated between groups and labeled next to secondary student data.
*Indicates statistical significances (p < 0.05).
**Indicates statistical significances (p < 0.01).
Most teachers did not know the percentage of assignments that could not be adapted for high-tech devices (58.9% indicated unknown). Teachers reported that half or fewer assignments could not be adapted for 71.4% of students. In contrast, educators could estimate the proportion of assignments that could be completed for 43 students (84.3%). These teachers reported that 61.9% of students could complete more than 30% of their work on their devices. Moreover, 37.0% of secondary students could complete 61% or more of their assignments on devices.
AT Assessment
Half or fewer students (47.1%) had a written implementation plan related to their device. However, most students (74.5%) did have an AT assessment on file. Such assessments tended to be fairly recent (M = 1.4 years old).
What AT Services Do Students with Visual Impairments Receive?
The amount of instruction students received varied widely. The frequency and duration of instruction were consistent across grade levels. For frequency of instruction, 2 students received daily instruction (3.9%), 8 received instruction multiple times weekly (15.7%), 17 received instruction weekly (33.3%), 7 received instruction multiple times monthly (13.7%), 4 received instruction monthly (7.8%), and 11 received instruction on a consult basis (22.2%). Only 2 received no AT instruction. Instructional sessions were often short sessions lasting less than 30 min (57% of students). For the remaining students, instructional sessions lasted 30 to 60 min (29.4%) for 15 students, 60 to 90 min for 3 students (5.9%), and 90 to 120 min for 4 students (7.8%). Progress monitoring checks usually only occurred multiple times a month (39.2%) or on a consult basis (33.3%). The remaining students were checked daily (2.0%), multiple times a week (3.9%), weekly (15.7%), monthly (3.9%), or never (2.0%).
In general, the focus of AT instruction aligned with how students used their devices (see Table 3). For example, instruction had a stronger focus on print access and instructional aid topics than skill augmentation and recreation topics. Some differences between AT use and instruction were apparent for both elementary students (e.g., instructional notes, the Internet, word prediction) and secondary students (e.g., screen readers, accessing the general curriculum). Secondary students were more likely to receive instruction on screen readers (χ2 = 7.74; p = .005), calculation (χ2 = 8.11; p = .004), Internet use (χ2 = 4.15; p = .034), and games (χ2 = 3.86; p = .050).
What Policies Address AT Use?
Responses to questions related to district AT policies varied widely. Only five TVIs indicated that written guidelines or policies for AT were used in their district, four reported none existed, and three did not know. Three-quarters of TVIs (n = 9) indicated that AT assessments were used in their district to select devices. Within these districts, the primary assessor for AT was a TVI (n = 6) or an AT specialist (n = 3). The majority of TVIs (n = 9) used a teacher-made checklist to assess AT needs. Two TVIs used the WATI Assessment, one TVI was unsure about assessment protocols, and one TVI indicated AT assessments were not conducted. Five TVIs indicated their district used implementation plans, five said it did not, and two were uncertain.
Nine TVIs were the primary AT instructor for most students with visual impairment. They also indicated that the most common sources for developing AT instruction were device manuals (n = 9), YouTube tutorials (n = 8), and teacher-made activities (n = 5). The two most common funding sources for AT indicated by TVIs were district funds (n = 9) and federal quota funds (n = 9). Devices were primarily set up (e.g., installing software, programing device features) and fixed by TVIs (n = 5), the district information technology department (n = 4), and AT specialists (n = 2).
What Do TVIs Perceive are the Effects and Barriers of AT?
TVI views are reported in Table 4. With one exception, everyone agreed that AT decisions usually considered characteristics and diagnosis, needs and class expectations, preferences, and assessment performance. Second, teachers also agreed that AT positively affected students’ academic, functional, social, and communication skills, but indicated they did not know or disagreed that devices helped students engage with people in their community. Finally, opinions on barriers to providing AT services varied widely. Financial and technical issues garnered the greatest consensus as barriers.
Discussion
This pilot study offers several important insights on the landscape of AT use and services. First, student demographics in this study illustrate that AT is being used with a wide range of students with visual impairments. For example, the span of visual impairments and additional disabilities of students reflected the diversity of students’ projected prevalence (U.S. Department of Education, 2018). This diversity affirms that AT can be adapted and utilized across a broad range of students and address diverse needs. However, fewer than half of students on caseloads of TVIs (40%) had access to high-tech AT. The limited proportion of students receiving AT suggests that some students may be missing out on the opportunity to use AT.
Second, most students were assigned multiple AT devices. Students used two or more devices on average, which indicates that educators are leveraging a combination of devices to meet different access and educational needs. Moreover, these devices had diverse characteristics, likely addressing heterogeneous student needs. For example, some devices may provide more flexibility for accessing assignments (e.g., video magnifier) while others offer more functionality for completing schoolwork (e.g., laptop).
Third, students used AT devices in a wide variety of ways. For example, eight different types of usage were identified for almost half of the students. Varied use suggests that AT can be utilized flexibly in classrooms. Findings also indicated that AT devices may be especially beneficial for accessing academic content in core-content classes. Moreover, TVIs indicated that devices helped students engage more with their general education teacher and allowed them to access curriculum materials. However, there were some variations in AT usage by school level. For example, increased usage inside core-content classes from elementary to secondary schools suggests that younger students’ use of AT devices is more restricted than their older peers. More research is needed to examine the differences in usage across grade levels, specifically, whether differences in use are related to fixed factors (e.g., elementary-age students may need more concrete instruction in mathematics) or lack of instructional opportunities.
Fourth, data addressing device instruction suggest that students’ AT instruction may be individualized and address multiple access needs. Moreover, the topics of instruction were highly aligned with device use. Topic alignment could indicate that there is a range of technology skills needed to address each topic. The development of curricula to support AT topics could benefit educators in this area. Moreover, fewer than half of the students had a written implementation plan. Given the numerous environments students used their devices, multiple educators likely interact with the students and their AT devices. Written implementation plans would clearly identify various educators’ responsibilities for promoting and supporting AT use across settings.
Fifth, teachers’ responses suggest that some districts lacked—or educators were unaware of—written AT policies. These responses mean educators may not be aware of essential procedures or resources for assessing or instructing students’ AT needs. For example, the limited use of written AT implementation plans for students may be due to a lack of, or knowledge of, guidelines for developing plans. Moreover, AT learning opportunities were listed as a perceived barrier to providing AT. This finding is consistent with earlier studies that addressed limited AT knowledge of TVIs (e.g., Abner & Lahm, 2002; Zhou et al., 2012; Zhou et al., 2011) and suggests professional development opportunities for AT remain a critical need.
Limitations
Several limitations should be considered when interpreting the results of this pilot study. First, a relatively small sample of compensated volunteers—drawn primarily from suburban and rural areas—affects the generalizability of these findings. Second, some terminology used in the study related to the attributes of AT may not be widely known by TVIs (e.g., commercially available and specialized devices). Thus, confusion of terminology may have occurred. Third, some information is tied to teachers’ estimations and first-hand knowledge. For example, actual use of device by students, instruction, or presence of district AT policies may be different than what the teachers reported.
Implications for Future Research
Several areas should be pursued in future research. First, the field of visual impairment would benefit from a more extensive examination of device use. A national survey of device use would provide a more generalizable illustration of AT use and services. Second, a closer inspection of device selection decisions and accessibility of assignments for students with visual impairments is still needed. For example, researchers could ask educators to rank a more detailed list of considerations for selecting devices, such as functionality, usability, flexibility, and familiarity. Surveys could also explore the types of activities TVIs have trouble adapting. Third, observational studies are needed to examine actual device use in classrooms. This information could identify whether students are provided appropriate instructional opportunities or environmental factors influence AT use.
Implications for Practice
This study also has several implications for practitioners. First, educators should consider AT broadly for students with visual impairments. However, TVIs’ selection decisions should be based on data collected through AT assessments rather than a priori student characteristics. Second, educators should seek ways to promote device use at home. AT could help engage parents or family members in their child's education or advocate for students’ AT needs after graduation. Third, teachers should consider increasing instruction on screen readers, talking calculators, Internet use, and games for elementary students. Elementary students received significantly less instruction on these topics compared to secondary students despite similar patterns in actual use. Moreover, more instruction in these areas would better prepare students for applying AT in their recreational, academic, and vocational careers. Fourth, administrators should foster AT professional development opportunities for TVIs. Many TVI participants likely did not benefit from recent changes to personnel preparation programs, given that the average work experience of the TVIs who participated in this study is 21.1 years. Administrators cannot rely on universities alone to address the AT needs of educators. Some ways administrators can provide or promote AT professional development opportunities are to (a) establish relationships with state AT programs and organizations, (b) identify web-based training resources, (c) advocate for statewide or regional training, and (d) provide TVIs with funding and release time to participate in state or national professional development opportunities (e.g., conferences, presentations, and meetings).
Footnotes
Declaration of Conflicting Interests
The author(s) declared no potential conflicts of interest with respect to the research, authorship, and/or publication of this article.
Funding
The author(s) disclosed receipt of the following financial support for the research, authorship, and/or publication of this article: This work was supported by the Office of Special Education Programs, U.S. Department of Education (grant number H325K140201).