



Abstract
This investigation tests whether the predictive power of the delay of gratification task (colloquially known as the “marshmallow test”) derives from its assessment of self-control or of theoretically unrelated traits. Among 56 school-age children in Study 1, delay time was associated with concurrent teacher ratings of self-control and Big Five conscientiousness—but not with other personality traits, intelligence, or reward-related impulses. Likewise, among 966 preschool children in Study 2, delay time was consistently associated with concurrent parent and caregiver ratings of self-control but not with reward-related impulses. While delay time in Study 2 was also related to concurrently measured intelligence, predictive relations with academic, health, and social outcomes in adolescence were more consistently explained by ratings of effortful control. Collectively, these findings suggest that delay task performance may be influenced by extraneous traits, but its predictive power derives primarily from its assessment of self-control.
Impulses to seek pleasure and avoid displeasure are essential to survival, but impulses to pursue here-and-now rewards are often at odds with countervailing, goal-directed processes. Freud (1920) speculated that the ability to exercise self-control in such dilemmas is critical to healthy psychological development: “[U]nder the influence of the instructress Necessity,” children must learn to “renounce immediate satisfaction, to postpone the obtaining of pleasure, to put up with a little unpleasure” (p. 444). Early attempts to measure individual differences in self-control used Rorschach and related projective tests (e.g., Singer, 1955), measures later found wanting in both face validity (Mischel, 2007) and predictive validity (Lilienfeld, Wood, & Garb, 2000). Subsequently, in a process entailing years of iterative prototyping and refinement, Mischel developed the delay of gratification task. Better known colloquially as the “marshmallow task,” this paradigm quantifies self-control as the ability to wait for a preferred treat (e.g., two marshmallows later) while forgoing a less preferred reward (e.g., one marshmallow right now).
The delay of gratification task appears face-valid and predicts an array of positive academic, social, and health outcomes later in life (Ayduk et al., 2000; Mischel, Shoda, & Peake, 1988; Shoda, Mischel, & Peake, 1990), but does it really assess self-control? Contrariwise, might delay time in this task reflect unrelated traits such as intelligence or attraction to rewards? If so, do such traits constitute third-variable confounds responsible for the delay task’s predictive power? Surprisingly, given the prominence of the delay task in both scholarly research and public debate (Lehrer, 2009; Mischel & Brooks, 2011; Public Broadcasting Service, 2011), straightforward questions clarifying its interpretation have not been directly addressed in prior research. In the current investigation, school-age children (in Study 1) and preschool children (in Study 2) completed the delay of gratification task. Separately, children in both studies completed standard tests of intelligence, and adult informants provided ratings of their personality and motivation. We examined these data for evidence of convergent validity with concurrent informant ratings of self-control, discriminant validity vis-à-vis intelligence and reward-related impulses, and incremental predictive validity over and beyond possible confounding variables for longitudinally measured outcomes.
Delay of Gratification and Intelligence
Direct evidence on how intelligence relates to performance in the delay of gratification task is lacking, but there is sufficient indirect evidence to warrant speculation about intelligence as a confound. Like self-control, intelligence predicts academic, social, health, and economic well-being later in life (Borghans, Duckworth, Heckman, & ter Weel, 2008), and at least some studies have found that more intelligent children are rated as more self-controlled by parents and other informants (e.g., Moffitt et al., 2011; Olson, Sameroff, Kerr, Lopez, & Wellman, 2005). More intelligent children express preferences for larger, later rewards over smaller, sooner rewards (Lesure, 1977; Mischel & Metzner, 1962) as do more intelligent adolescents (Block & Funder, 1989; Olson, Hooper, Collins, & Luciana, 2007), and adults (Shamosh et al., 2008; Shamosh & Gray, 2008), though preferring to delay gratification and sustaining this commitment in the face of temptation are distinct psychological processes (Mischel, 2007; Reynolds & Schiffbauer, 2005). Of more direct relevance, in a sample of 95 girls and boys at the Bing Nursery School, performance in the delay task at age four strongly predicted parent impressions of intellectual competence a decade later (Mischel et al., 1988). Specifically, of 100 items in the parent-report California Child Q-Set (CCQ), the two that demonstrated the strongest positive associations in adolescence with preschool delay time were “is verbally fluent, can express ideas well in language” and “uses and responds to reason,” rs = .48 and .47, respectively. Likewise, among 35 participants in the same sample whose parents reported their SAT scores, correlations between math and verbal SAT scores and delay time were large, rs = .42 and .57, respectively (Shoda et al., 1990). Separate research has established that associations between the SAT and tests of general intelligence are so high that some researchers use SAT scores as a proxy for IQ (Frey & Detterman, 2004).
There are at least two substantive reasons why intelligence might facilitate self-control in children and, hence, improve their performance in the delay of gratification task. First, more intelligent children may use more effective self-regulatory strategies (e.g., strategically distracting themselves) in the face of temptation (Rodriguez, Mischel, & Shoda, 1989). Put another way, it is possible that “learning to delay is intimately bound up with learning to think” (Mischel & Metzner, 1962, p. 425). Second, more intelligent individuals may be better at keeping necessarily abstract representations of distal goals in mind (Fujita & Carnevale, 2012; Shamosh et al., 2008). Consistent with this supposition, intelligence is strongly related to working memory capacity (Conway, Kane, & Engle, 2003), and deficits in working memory are related to impulsive behavior in children (Barkley, 1997) as well as preference for smaller, immediate rewards among adults (Shamosh & Gray, 2008).
Delay of Gratification and Reward-Related Impulses
Other than intelligence, reward-related impulses are the most obvious potential confound in the delay of gratification task. There is empirical evidence that processes supporting self-control capacity are distinct from those that give rise to involuntary reward-related impulses (Eisenberg, Spinrad, et al., 2004; Funder, Block, & Block, 1983; Heatherton & Wagner, 2011; Hofmann, Friese, & Strack, 2009). Individuals vary in their dispositional reactivity to rewards; some individuals are more easily excited by rewards than others (Blair, Peters, & Granger, 2004; Carver & White, 1994). But the distinction between impulses and their regulation is difficult if not impossible to ascertain from behavioral observation alone. For instance, if we see an individual resist temptation (e.g., pass on dessert), we cannot be sure whether they are exerting self-control over their impulses (e.g., to achieve a target weight) or, alternatively, are not very tempted in the first place (e.g., did not even want dessert). Likewise, the observation that a child waits longer than others in the delay paradigm is ambiguous as to whether they are exercising greater self-control or, contrariwise, are simply less tempted by the immediately available treat.
Eisenberg and colleagues have pointed out that while processes supporting voluntary self-control (e.g., strategic regulation of attention away from rewards) no doubt influence performance in the delay of gratification task, the reward also may activate impulsive reactive tendencies, such that children may be pulled toward the reward with little voluntary control. Therefore, children who cannot delay may be high in impulsive tendencies, whereas those who delay their gratification may be moderate or low in impulsive tendencies. (Eisenberg, Smith, Sadovsky, & Spinrad, 2004, p. 262, emphasis added)
This possibility—unexamined in prior research—muddies the interpretation of delay task performance and its predictive validity because the strength of the impulse to approach immediate reward (one marshmallow right away) is not measured separately.
Current Investigation
The current investigation uses data from two longitudinal studies to clarify the theoretical interpretation of the delay of gratification paradigm. Our results extend previous research in several ways. First, we directly test convergent associations between delay task behavior and concurrent questionnaire measures of self-control completed by adult informants. Second, we examine evidence of discriminant validity, in particular by examining associations between delay task behavior and concurrent measures of general intelligence, reward-related impulses, and other traits in omnibus taxonomies of personality (in Study 1) and temperament (in Study 2). Finally, we use statistical techniques developed for mediational analyses to test whether the predictive power of the delay task derives from self-control or potentially spurious associations with other traits (e.g., intelligence) that also forecast positive developmental outcomes.
Study 1
In Study 1, 56 fifth-grade children at a socioeconomically and ethnically diverse public magnet school completed the delay of gratification task at the start of school and were followed through the end of the academic year. We examined evidence for convergent validity with concurrent informant-report questionnaire measures of self-control and, by contrast, discriminant validity vis-à-vis theoretically unrelated constructs, including general intelligence and reward-related impulses. To situate delay task performance within an omnibus framework of personality, we also examined associations between wait time in the delay task and concurrent teacher ratings of Big Five personality, a taxonomy originally discovered to organize traits in adults but more recently found to be as relevant in school-age children (Shiner & DeYoung, 2013). We anticipated evidence of convergent validity between delay task performance and Big Five conscientiousness because of substantial conceptual overlap between self-control and this broad personality dimension, which encompasses “the propensity to follow socially prescribed norms for impulse control, to be goal directed, to plan, and to be able to delay gratification and follow norms and rules” (Roberts, Jackson, Fayard, Edmonds, & Meints, 2009, p. 369; also see Eisenberg, Duckworth, Spinrad, & Valiente, 2012; McCrae & Lockenhoff, 2010) and is used interchangeably by some authors with the term self-control (e.g., Moffitt et al., 2011). By contrast, we expected delay behavior to be relatively independent of the Big Five dimensions of agreeableness, extraversion, emotional stability, and openness to experience. Finally, we examined evidence for incremental predictive validity of the delay task for final report card grades over and beyond potential confounds.
Method
Participants
Participants were 56 fifth-grade children (mean age = 10.28 years, SD = .40) at a magnet public middle school in the Northeast. About 39% of participants were White, 31% were Black, 14% were Asian, 7% were Hispanic, and 9% were of other ethnic backgrounds; 55% were female. Fourteen percent of participants were eligible for free or reduced-price lunch based on reported household incomes lower than 185% of the national poverty level. Participants did not differ significantly from nonparticipants on age, ethnicity, gender, or lunch status, ps > 05.
Procedure and Measures
During one-on-one testing sessions conducted at their school, children completed the delay of gratification task. Separately, children completed questionnaires and intelligence tests in small groups during nonacademic periods, and homeroom teachers completed questionnaires with the children as targets. All measures were completed by the end of October 2008, and data from school records were received in July 2009.
Delay of gratification
We made two minor changes to the preschool delay of gratification paradigm (Mischel, Ebbesen, & Zeiss, 1972) to be appropriate for school-age children. First, we extended the maximum wait time to 30 min. Second, to provide a plausible context for older children, we introduced the delay task as part of “a study of food preferences.” Each child was excused individually from his or her classroom and escorted by a female experimenter to a nearby room cleared of distracting stimuli and containing a desk and a bell as well as a hidden camera. Once seated at the desk, the child was left alone to complete a brief survey presenting hypothetical choices between pairs of food items (e.g., “Would you rather have a bowl of Honey Nut Cheerios or a bowl of Lucky Charms?” and “Would you rather have a 12 oz. can of Coke or a 20 oz. bottle of Coke?”) and to indicate using a 7-point scale “How hungry are you right now?” Before leaving the room, the experimenter instructed the child to ring the bell to indicate that he or she had completed the survey.
Next, the experimenter showed the child a variety of snacks (e.g., cookies, chocolate candies, pretzels, grapes, chips) and asked which he or she liked best. The experimenter then asked, “Would you rather have [small amount of chosen snack] or [large amount of chosen snack]?” All of the participants preferred the larger amount. Explaining that she had to set up a task for another student, the experimenter said, If you wait without eating [the snack] and without getting out of your seat until I come back by myself, then you can have [large amount of snack]. If you don’t want to wait, you can ring the bell at any time, and I will come in right away. But then you can only have [small amount of snack].
Once the child understood the task contingency and clearly indicated a preference for waiting, the experimenter left the room, returning and ending the task if the child rang the bell or was observed through the hidden camera to leave his or her seat or begin to eat the snack. Otherwise, the experimenter returned after 30 min and gave the child the larger snack.
Teacher ratings of self-control
With their students as targets, homeroom teachers reported on the frequency of self-control lapses in the domains of schoolwork (e.g., “This student’s mind wandered when he or she should have been listening”) and interpersonal relationships (e.g., “This student lost his or her temper”). Specifically, teachers rated the frequency of eight different behaviors identified in a separate sample of middle school students and teachers as failures of self-control (Tsukayama, Duckworth, & Kim, 2012) using a 6-point frequency scale ranging from 0 of the last 5 school days to 5 of the last 5 school days. The observed internal reliability was .89. Items were coded and averaged such that higher scores indicated higher self-control.
Reward-related impulses
Children completed three subscales from the Behavioral Inhibition System (BIS) and Behavioral Activation System (BAS) Questionnaire (Carver & White, 1994), identified by Eisenberg and Morris (2002) as appropriate for assessing reward-related impulses. These included the BAS Reward Responsiveness (e.g., “When I get something I want, I feel excited and energized”) and BAS Drive (e.g., “When I want something, I usually go all-out to get it”) subscales. We omitted the BAS Fun Seeking subscale because, unlike the other two BAS subscales, it does not reliably predict “positive affective responses to the signals of impending reward” (Carver & White, 1994, p. 330). While individual differences in sensitivity to punishment have a less obvious relationship with delay of gratification, we also included the Behavioral Inhibition subscale (e.g., “Criticism or scolding hurts me quite a bit”). All BIS/BAS items were endorsed using a 5-point Likert-type scale where 5 = agree strongly and 1 = disagree strongly. The internal reliability coefficients were .65, .75, and .54 for the Reward Responsiveness, Drive, and Behavioral Inhibition subscales, respectively.
Intelligence
Children completed the Raven’s Progressive Matrices and the Junior version of the Mill Hill Vocabulary Scale (Raven, Raven, & Court, 1988), widely used, untimed tests of nonverbal and verbal intelligence, respectively. Because standardized scores by age group are not published for either test, we included age as a covariate in all analyses involving nonverbal and verbal intelligence raw scores.
Big Five personality
With their students as targets, teachers completed the Big Five Inventory (BFI; John & Srivastava, 1999), which measures the personality dimensions of conscientiousness (e.g., “Does a thorough job”), openness to experience (e.g., “Is curious about many different things”), emotional stability (e.g., “Is relaxed, handles stress well”), agreeableness (e.g., “Is considerate and kind to almost everyone”), and extraversion (e.g., “Is outgoing, sociable”) using a 5-point Likert-type response scale ranging from 5 = agree strongly to 1 = disagree strongly. Internal reliability coefficients ranged from .87 to .95 (avg. = .91).
Results and Discussion
The 10-year-old children in Study 1 waited an average of 24.50 min (SD = 8.52). About 41% of children ended the task early in exchange for the smaller reward. Because data for the remaining 59% of participants were censored (i.e., the task was ended by the experimenter at 30 min before the child voluntarily terminated), we used the Cox proportional hazards regression models. To facilitate interpretation and comparison of hazard ratios, we standardized continuous variables prior to entry as predictors in Cox models. The effect size estimates produced in these Cox models are hazard ratios, interpreted as the proportional change in the hazard (i.e., probability of ending the delay task early) associated with a one-unit change in the predictor. Consequently, hazard ratios less than one indicate a greater ability to delay, whereas hazard ratios greater than one indicate less ability to delay. As shown in Table 1, in separate Cox models, delay time was unrelated to age, gender, or free lunch status. To preserve degrees of freedom given the modest sample size, we therefore excluded these variables from subsequent analyses. However, results were virtually identical when these covariates were included (results available upon request). Because teacher ratings of students were not always independent (i.e., one teacher might rate several students), we controlled for rater in analyses with teacher ratings.
Summary Statistics and Bivariate Associations With Delay Time in Study 1.
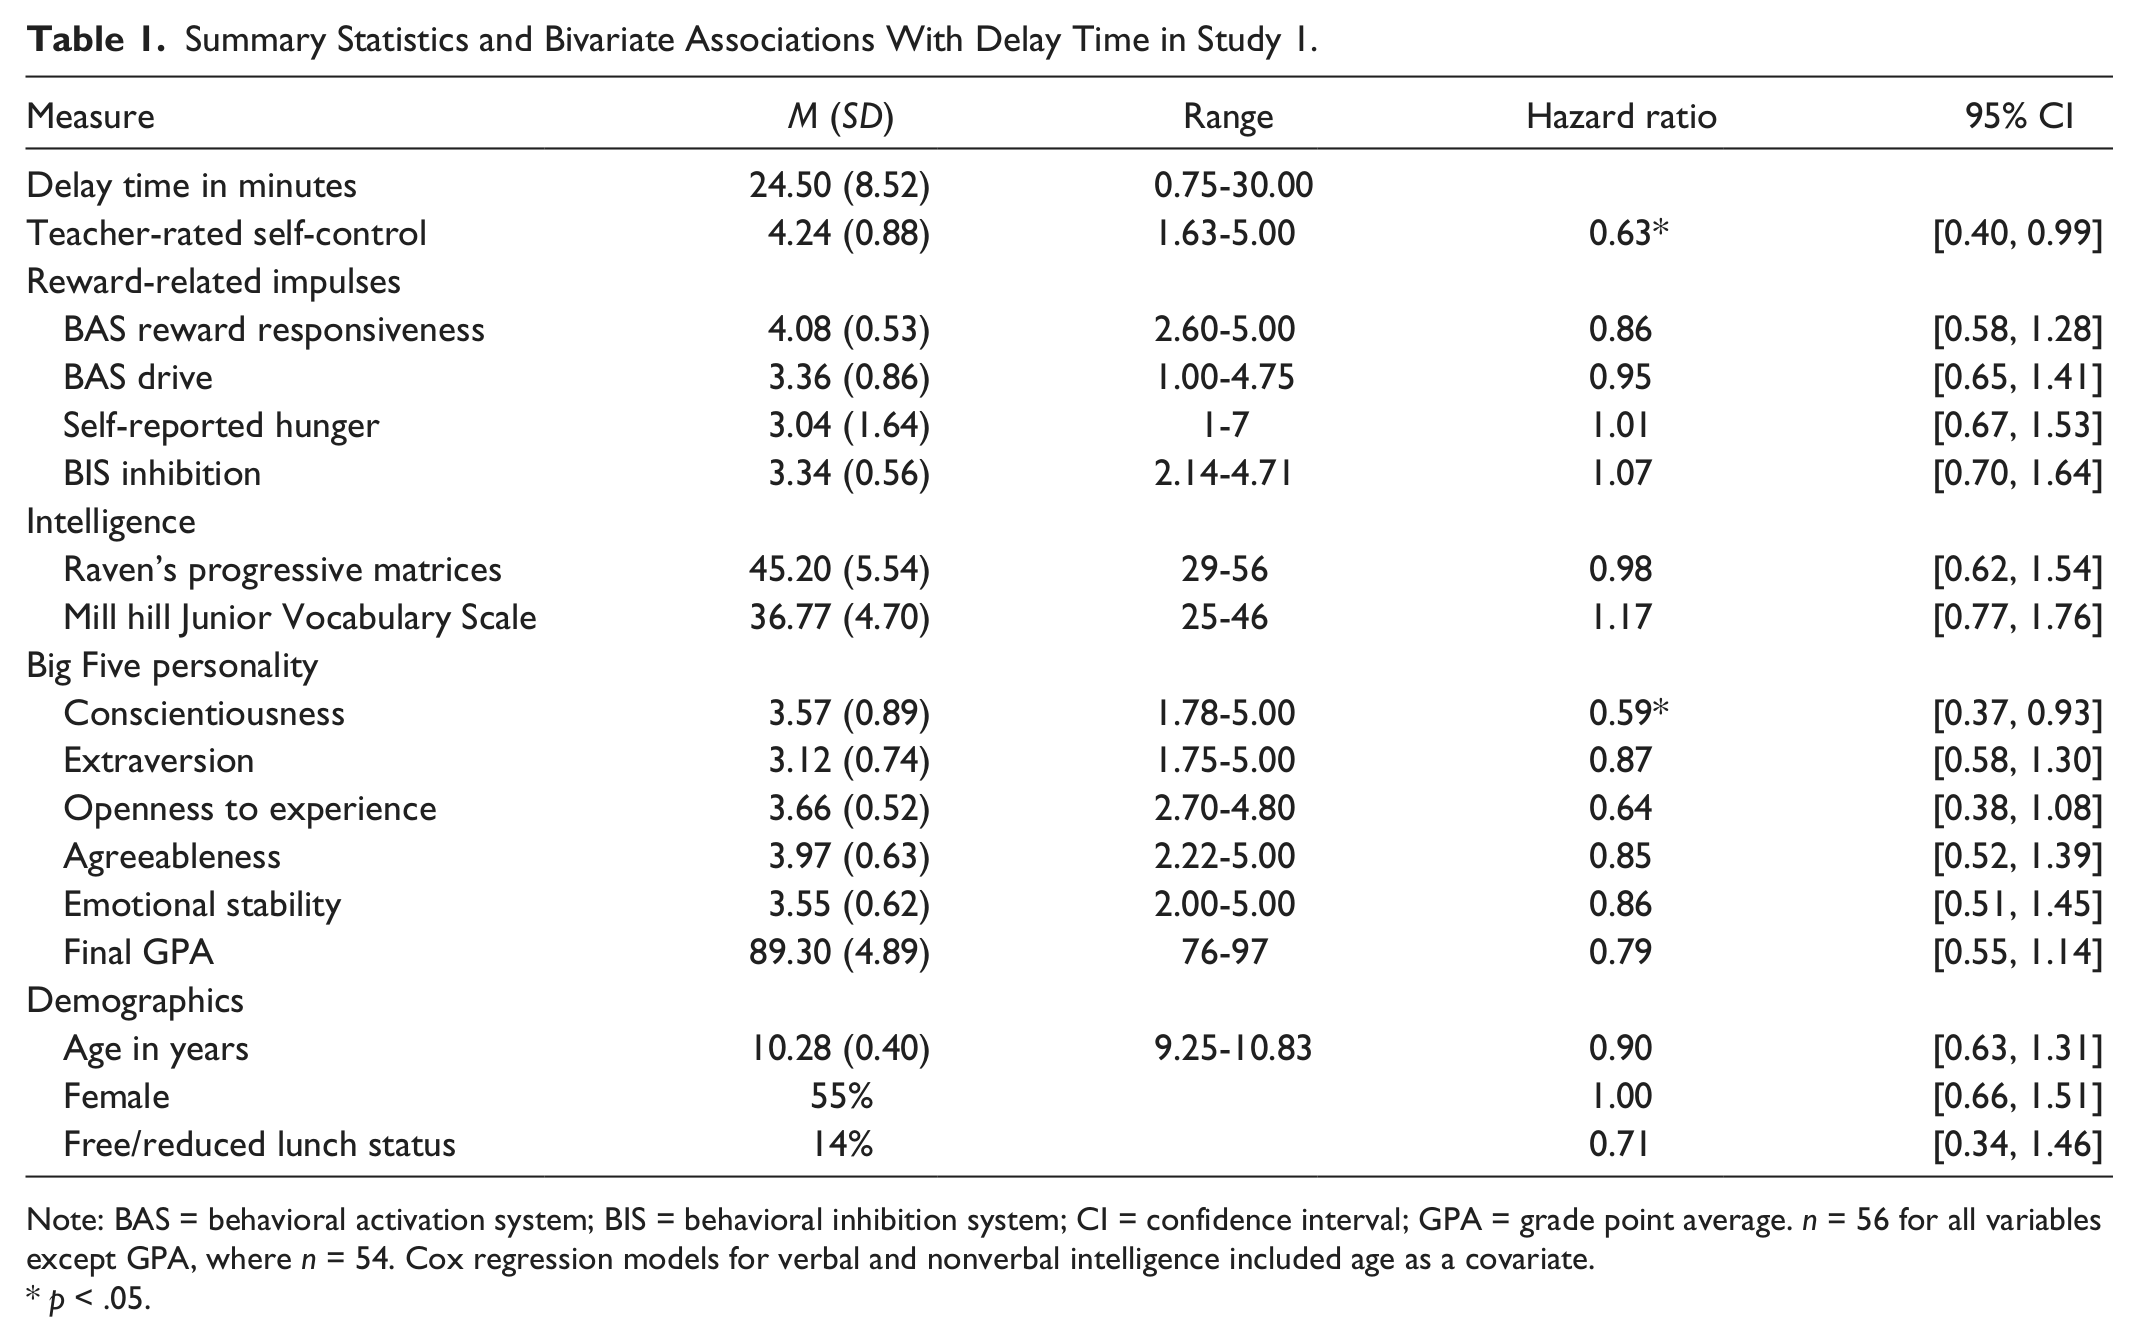
Note: BAS = behavioral activation system; BIS = behavioral inhibition system; CI = confidence interval; GPA = grade point average. n = 56 for all variables except GPA, where n = 54. Cox regression models for verbal and nonverbal intelligence included age as a covariate.
p < .05.
As shown in Table 1, children who were more self-controlled according to teacher ratings waited longer in the delay of gratification task, rh = 0.63, 95% confidence interval (CI) = [0.40, 0.98], p = .043. Specifically, children one standard deviation higher than average in self-control were about a third less likely to terminate the delay task as a function of time. In contrast, delay time was not associated with self-reported reward-related impulses, including reward responsiveness (rh = 0.86, 95% CI = [0.58, 1.28], p = .45) and drive, (rh = 0.95, 95% CI = [0.65, 1.41], p = .81), or hunger at the start of the task (rh = 1.01, 95% CI = [0.67, 1.53], p = .97) nor to behavioral inhibition, rh = 1.07, 95% CI = [0.70, 1.64], p = .75. Likewise, when controlling for age, delay time was unrelated to either nonverbal (rh = 0.98, 95% CI = [0.62, 1.54], p = .91) or verbal intelligence (rh = 1.17, 95% CI = [0.77, 1.76], p = .46). However, comparing means and standard deviations for the nonverbal and verbal intelligence test with published percentile norms for U.S. children taking the same tests in the mid-1980s (see Table 8 in Raven, 2000; see Table SPM9 in Raven, Raven, & Court, 2000) clearly suggested a restriction on range in our convenience sample, even when considering secular trends toward increasing intelligence scores (Raven, 2000). Thus, we did not interpret the absence of evidence for relations between intelligence and delay performance as evidence of absence in the general population.
Among Big Five personality factors, only Big Five conscientiousness was associated significantly with delay time (rh = 0.59, 95% CI = [0.37, 0.93], p = .023). Because Big Five factors were related (e.g., conscientiousness and agreeableness ratings were associated, r = .51, p < .001), we entered all Big Five factors into a simultaneous Cox regression model. Consistent with bivariate analyses, only conscientiousness predicted significant variance over and beyond other Big Five factors, rh = 0.55, 95% CI = [0.30, 0.99], p =.047.
Delay time measured at the start of the school year was positively associated with final grade point average (GPA) measured at the end of the school year in bivariate analyses, but this relationship failed to reach significance, rh = 0.79, 95% CI = [0.55, 1.14], p = .21. However, because nonverbal and verbal intelligence each predicted GPA (r = .36 and .38, ps < .01, respectively), we included these covariates in the same model to reduce error and found that the relationship between delay time and GPA was marginally significant, rh = 0.65, 95% CI = [0.41, 1.03], p = .067. Thus, although not quite significant, the inclusion of measures of intelligence increased (in magnitude) rather than diminished the predictive validity of the delay task for academic achievement.
Study 2
In Study 1, school-age children who waited longer in the delay of gratification paradigm were considered more self-controlled and conscientious by their teachers but no different in other dimensions of personality nor in their attraction to rewards. However, in this convenience sample, we documented restriction on range in intelligence. Moreover, the small sample size constrained statistical power; it is possible that with more participants, weaker associations between delay behavior and other variables would have reached statistical significance. Finally, while we could confirm that the delay task marginally predicted report card grades when controlling for intelligence, health and social outcomes were not available in Study 1, nor were any outcomes assessed later than a year after the delay task was administered.
In Study 2, we addressed these limitations by conducting secondary analysis of data from a national sample of 966 children who completed the delay of gratification task at age 4. In addition to concurrent ratings of temperament by teachers and caregivers and IQ scores, follow-up data collected a decade later were available, making possible prospective, longitudinal analyses with early adolescent outcomes, including objectively measured report card grades, standardized achievement test scores, body mass index (BMI), and self-reported risky behavior. To our knowledge, none of the analyses reported here have been conducted previously.
Method
Participants
The participants were 966 children from the National Institute of Child Health and Development (NICHD) Study of Early Child Care and Youth Development (SECCYD; https://secc.rti.org/) who completed the preschool delay of gratification task. Approximately 80% of participants were White, 11% were Black, 5% were Hispanic, 1% were Asian, and 3% were other ethnicities; 52% were female. The median household income-to-needs ratio (assessed in terms of income compared with the U.S. Census Bureau–defined poverty line) for this sample was 2.9, and on average, mothers in this sample had completed 14 years of education.
Procedure and Measures
Delay of gratification
When they were 4 years old, children participated in a laboratory task in which they first selected their favorite among several snacks (e.g., chocolate candies, cookies, pretzels). Next, the experimenter placed a plate with a small amount of snack and a plate with a larger amount of snack in front of the child and asked which the child preferred. Once it was established that the child preferred the larger amount, the child was told that she or he would be allowed to eat the larger amount if she or he waited until the experimenter returned, but if the child could not wait, then she or he could ring a bell, the experimenter would return, and the child would be given the smaller amount of snack. The child was also instructed to remain seated and not to eat the snack until the experimenter returned. Once the child understood the instructions, the experimenter left the room and watched the child from an observation booth. The experimenter returned and wait time was measured when the child rang the bell, left the seat, ate the snack, became distressed, or called for the experimenter or a parent. Otherwise, the experimenter returned after 7 min and gave the child the larger amount of snack.
Self-control, reward-related impulses, and other dimensions of temperament
When participants were 4 years old, their mothers and caregivers (e.g., preschool teachers) completed selected subscales of the Child Behavior Questionnaire (CBQ; Rothbart, Ahadi, & Hershey, 1994). Because effortful control—“the ability to inhibit a dominant response to perform a subdominant response” (Rothbart & Bates, 1998, p. 137)—corresponds to our definition of self-control, we used the Attention Focusing and Inhibitory Control subscales as measures of self-control. The Attention Focusing subscale reflects the capacity to maintain attentional focus (e.g., “Hard time concentrating on activity”), and Inhibitory Control reflects the capacity to plan and to suppress inappropriate responses (e.g., “Able to resist temptation”). Correlations between mother and caregiver ratings of Attention Focusing and Inhibitory Control were r = .32 and r = .34, respectively. These associations compare favorably to the meta-analytically derived average correlation of r = .28 between two different types of informant (e.g., parent/teacher) by Achenbach, McConaughy, and Howell (1987). Correlations among all indicators of self-control ranged from .24 to .68 (avg. = .40), and internal reliability coefficients ranged from .74 to .84 (avg. = .78).
We used mother ratings of Approach/Anticipation and Activity Level as measures of reward-related impulses. Caregivers did not complete these subscales. The Approach/Anticipation subscale reflects excitement and positive anticipation for expected pleasurable activities (e.g., “When she or he sees a toy she or he wants, gets very excited”), and Activity Level reflects gross motor activity (e.g., “Always in a bit of a hurry to get from one place to another”). The correlation between Approach/Anticipation and Activity Level was .46, and the internal reliability coefficients were .69 and .67, respectively.
To further assess discriminant validity, we also analyzed all other CBQ subscales completed by mothers and/or caregivers. The Anger/Frustration subscale reflects negative affect related to interruption of ongoing tasks or goal blocking (e.g., “Has temper tantrums when she or he does not get her or his way”); Fear reflects unease, worry, or nervousness related to anticipated pain or distress and/or potentially threatening situations (e.g., “Is afraid of the dark?”); Sadness reflects negative affect and lowered mood and energy related to exposure to suffering, disappointment, and object loss (e.g., “Sometimes appears downcast for no reason”); and Shyness reflects an inhibited approach in social situations involving novelty or uncertainty (e.g., “Acts shy around new people”). Internal reliability coefficients for these subscales ranged from .59 to .90 (avg. = .76). Intercorrelations between mother and caregiver ratings were .16, .12, and .43 for anger, sadness, and shyness, respectively.
Intelligence
At age 4, participants completed the Memory for Sentences, Incomplete Words, and Picture Vocabulary subscales of the Woodcock–Johnson Psycho-Educational Battery–Revised (WJ-R) Tests of Cognitive Abilities (WJ-R COG; Woodcock & Johnson, 1989). In a validity study (McGrew, Werder, & Woodcock, 1991), the WJ-R COG correlated highly (rs > .70) with similar tests of intelligence (e.g., Stanford-Binet, McCarthy, and Kaufman Assessment Battery for Children [ABC]). Correlations among these indicators of intelligence ranged from .38 to .49 (avg. = .44), and internal reliability coefficients ranged from .75 to .85 (avg. = .81).
Academic performance
Principals or their designated staff members reported final grades for math, English, science, and social studies for participants at the end of the eighth grade. Schools provided official student transcripts at the end of the ninth grade. Final grades for math, science, English, and social studies were converted to a numeric scale where A+ = 4.33 to F = 0.00. Eighth- and ninth-grade GPA were highly correlated (r = .72), so we averaged them to create a composite GPA.
In ninth grade, the children completed the Passage Comprehension and Applied Problems Achievement subscales of the Woodcock–Johnson Psycho-Educational Battery–Revised Tests of Achievement (WJ-R ACH). The WJ-R includes separate tests of cognitive ability and achievement, the latter of which are designed to assess academic skills and knowledge (Mather, 1991). Passage Comprehension and Applied Problems were highly correlated, r = .65, so we averaged these scales to create composite standardized achievement test scores.
BMI
BMI has been demonstrated as a reliable marker of overall physical health in adolescence (Swallen, Reither, Haas, & Meier, 2005). Height and weight were measured using standardized protocols at ninth grade, and these data were used to calculate an age- and sex-specific BMI z score for each participant. The average BMI z score was .56, indicating that the average adolescent in our sample was slightly overweight.
Risky behavior
In ninth grade, participants completed a questionnaire asking how many times in the past year they engaged in different risky behaviors, including substance use (e.g., “Used or smoked marijuana”), endangerment to their safety (e.g., “Ridden a motorcycle without wearing a helmet”), and social risks (e.g., “Stolen something”). This scale was adapted for the NICHD-SECCYD from work by Conger and Elder (1994) and Halpern-Felsher, Biehl, Kropp, and Rubinstein (2004). We coded items such that 0 = “never” and 1 = “once or twice and more than twice” before creating a summed score. On average, participants endorsed about 6 out of 53 risky behaviors. The observed internal reliability was .89.
Analytic Strategy
After assessing descriptive statistics and bivariate associations, we fit a series of structural equation models (SEMs) to estimate the extent to which the predictive validity of the preschool delay of gratification task can be explained by synchronous latent measures of temperament and intelligence. Our intent was not to conduct mediation analyses for the purpose of making causal inferences about the mechanisms by which delay ability translates into life outcomes. Rather, using SEM techniques originally developed to assess multiple mediators (MacKinnon, 2008), we aimed to disaggregate the longitudinal associations between delay time and later life outcomes in terms of variance shared with self-control versus theoretically unrelated traits. Because SEM procedures have not yet been developed for censored predictor variables, we treated delay of gratification behavior as a binary variable where 1 = “delayed until task conclusion” (7 min) and 0 = “ended task early.” We followed the recommendations of MacKinnon, Lockwood, Hoffman, West, and Sheets (2002) and, rather than conduct Sobel tests for significance, examined for each proposed mediator “the joint significance of the two effects comprising the intervening variable effect” (p. 83). Because children from higher-income households or with more educated mothers were more likely to delay gratification, as were White children, we included these and all other demographic covariates in all SEMs. Because income-to-needs and risky behavior were positively skewed, we log-transformed both to normalize their distributions (adding one to the latter before log-transforming to remove zeros). For bivariate associations with delay time in Table 2, we report hazard ratios from Cox regression models using the censored variable.
Summary Statistics and Bivariate Associations With Delay Time in Study 2.
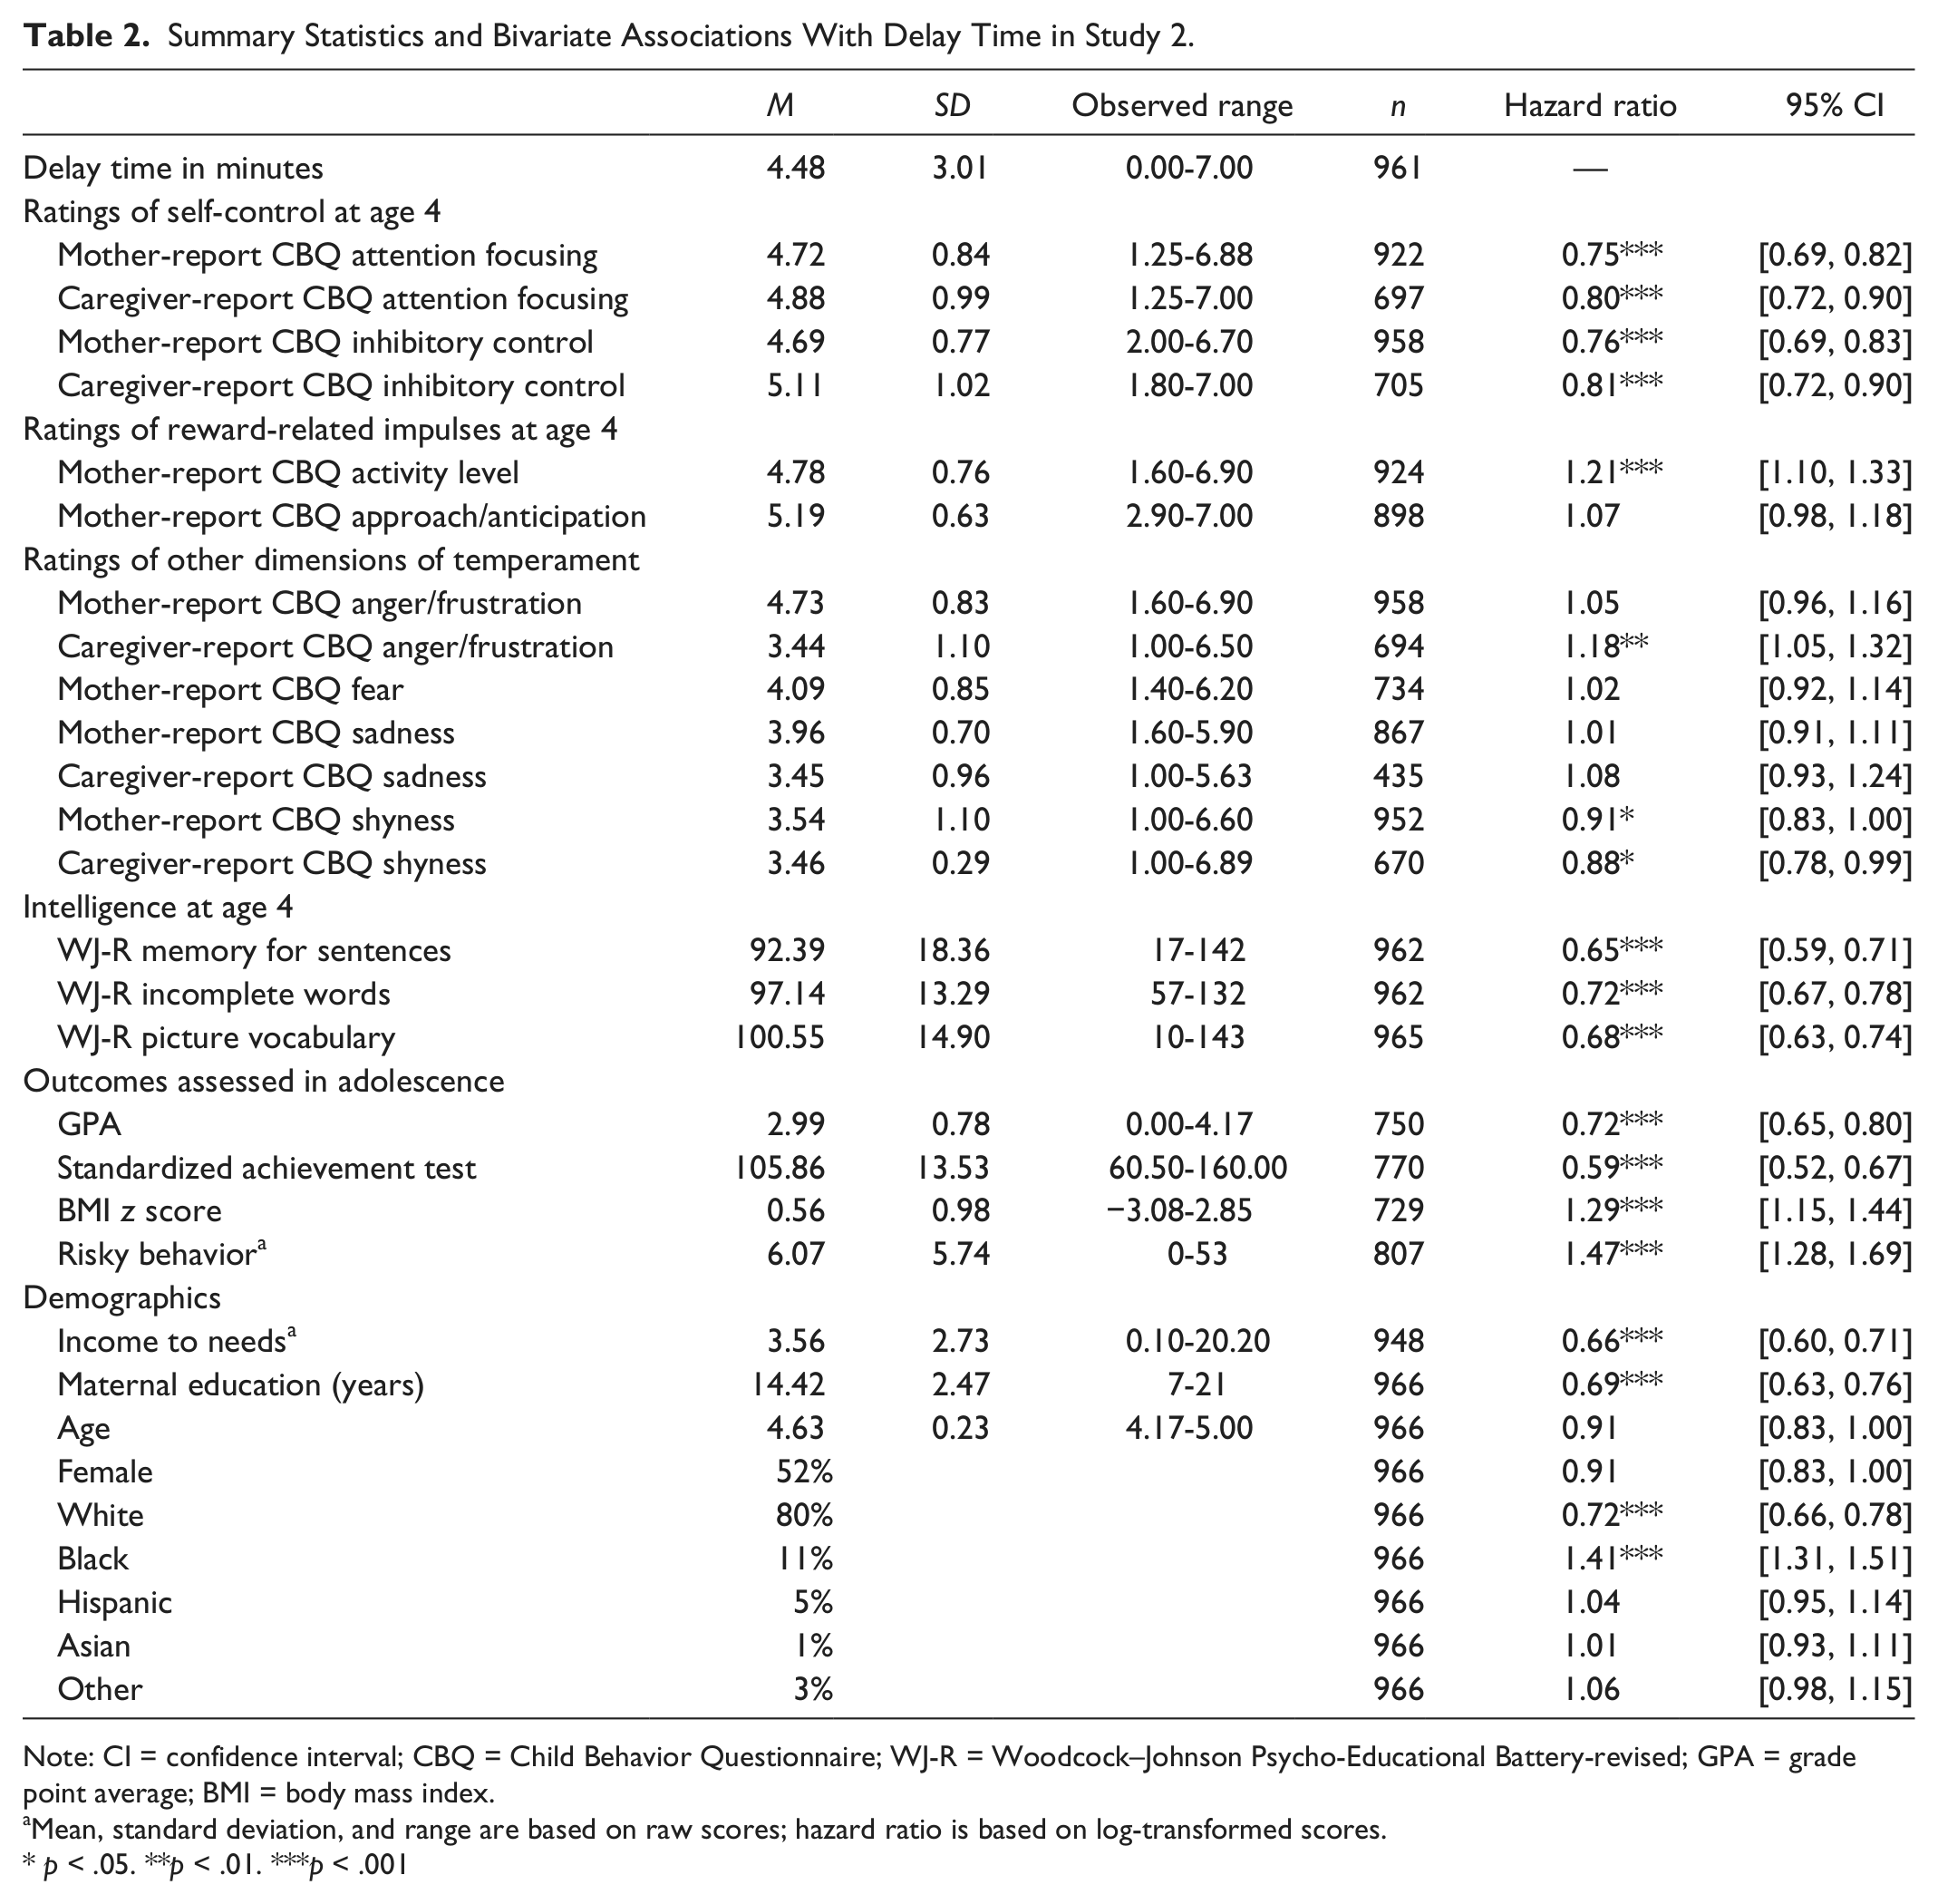
Note: CI = confidence interval; CBQ = Child Behavior Questionnaire; WJ-R = Woodcock–Johnson Psycho-Educational Battery-revised; GPA = grade point average; BMI = body mass index.
Mean, standard deviation, and range are based on raw scores; hazard ratio is based on log-transformed scores.
p < .05. **p < .01. ***p < .001
To correct for measurement error, we used latent variables for self-control, reward-related impulses, and intelligence, with their respective subscales as observed indicators. All other variables were treated as observed variables. GPA, standardized academic achievement, BMI z score, and risky behavior at age 15 were the outcome variables, and their disturbances were allowed to covary. For the self-control latent variable, the error variances for the same reporter (e.g., mother-report attention focusing and mother-report inhibitory control) and the same subscale (e.g., mother-report attention focusing and caregiver-report attention focusing) were allowed to covary. We used full information maximum likelihood (FIML) to handle missing data (about 7% of the data were missing; see Table 2). FIML is less biased and more efficient than traditional missing data techniques (Enders & Bandalos, 2001; Peters & Enders, 2002).
Results and Discussion
After declaring their intention to wait for a preferred treat in the delay of gratification paradigm, 4-year-olds in Study 2 waited an average of 4.5 min (SD = 3.0). About 47% of children terminated the task early (i.e., before 7 min had elapsed and the experimenter returned to the room). As summarized in Table 2, we fit separate Cox regression models to estimate bivariate associations between delay of gratification and other variables. Consistent with prior longitudinal studies, delay time at age 4 was related to each of the outcomes assessed in adolescence, ps < .001: Children who delayed longer later earned higher GPAs (rh = 0.72, 95% CI = [0.65, 0.80], p < .001) and standardized achievement test scores (rh = 0.59, 95% CI = [0.52, 0.67], p < .001) and had healthier (i.e., lower) BMI scores (rh = 1.29, 95% CI = [1.15, 1.44], p < .001) and engaged in fewer risky behaviors (rh = 1.47, 95% CI = [1.28, 1.69], p < .001).
Delay time was associated with concurrent ratings of self-control by mothers and caregivers. That is, children who were rated one standard deviation higher than average in attention focusing or inhibitory control by their mother or caregiver were 19% to 25% less likely to terminate the delay task as a function of time, rhs from 0.75 to 0.81, ps < .001. In contrast, delay time was less reliably related to reward-related impulses: Mother ratings of motor activity level predicted delay time (rh = 1.21, 95% CI = [1.10, 1.33], p < .001), but mother ratings of approach/anticipation tendencies did not, rh = 1.07, 95% CI = [0.98, 1.18], p = .15. Likewise, for other measured dimensions of temperament, including anger/frustration, fear, and sadness, associations with delay performance failed to reach significance for one or both raters.
Other than self-control, the only aspect of temperament that demonstrated reliable associations with delay performance was shyness. Children rated one standard deviation higher in shyness by their mother or caregiver were 9% and 12% less likely to terminate the delay task as a function of time, rh = 0.91, 95% CI = [0.83, 1.00] and 0.88, 95% CI = [0.78, 0.99], ps < .05. One post hoc explanation for this somewhat unexpected finding was that interacting with a novel adult (i.e., the female experimenter who conducted the delay task) precipitated some degree of fearfulness in shyer children, causing them to freeze up and, by default, to wait longer. Before fitting SEMs, we confirmed that mother ratings of shyness did not predict any adolescent outcomes, and caregiver ratings of shyness predicted only two of four outcomes: BMI (r = −.09, p = .04) and risk taking (r = −.11, p = .009). Given that only two of eight possible associations between shyness and outcomes reached significance, we did not include shyness in subsequent analyses. 1
In our first SEM, we confirmed that the direct effects of preschool delay of gratification on adolescent outcomes held when controlling for demographic covariates. When controlling for family income, maternal education, ethnicity, and age, delay of gratification at age 4 continued to predict higher standardized achievement test scores (β = .12, SEβ = .03, p < .001) and GPAs (β = .08, SEβ = .03, p = .016), as well as lower BMI scores (β = −.10, SEβ = .04, p = .01), and fewer risky behaviors (β = −.07, SEβ = .04, p = .037). Because this model was just-identified and only included observed variables, model fit statistics were not available.
In a second SEM, we added separate latent factors for self-control, reward-related impulses, and intelligence. Factor loadings for self-control ranged from .40 to .68 (avg. = .53), loadings for reward-related impulses ranged from .47 to .99 (avg. = .73), and loadings for intelligence ranged from .58 to .73 (avg. = .66), ps < .001. Model 2 fit the data well: χ2(98) = 249.38, p < .001; comparative fit index (CFI) = .96; root mean square error of approximation (RMSEA) = .04 (90% CI = [.03 to .05]). Children who delayed gratification were higher in self-control (β = .20, SEβ = .04, p < .001) and were more intelligent (β = .25, SEβ = .03, p < .001). In contrast, a weaker relationship was observed between delay behavior and reward-related impulses (β = −.09, SEβ = .03, p = .006). Moreover, reward-related impulses predicted none of the four adolescent outcomes, all ps > .15. Because reward-related impulses did not mediate any of the effects of delay behavior and were highly correlated with self-control (r = −.72), we reduced multicollinearity by excluding this construct in our final model. Path coefficients in this final model, described below, for self-control and intelligence were nearly identical but, as expected, standard errors were reduced.
Our final SEM, illustrated in Figure 1, fit the data well: χ2(74) = 162.08, p < .001; CFI = .97; RMSEA = .04 (90% CI = [.03 to .04]). Demographic covariates of gender, age, ethnicity, family income, and maternal education were included in this model but are not shown in the figure. Preschool delay performance was associated with concurrently measured self-control (β = .21, SEβ = .05, p < .001) and intelligence (β = .25, SEβ = .03, p < .001) in this model.
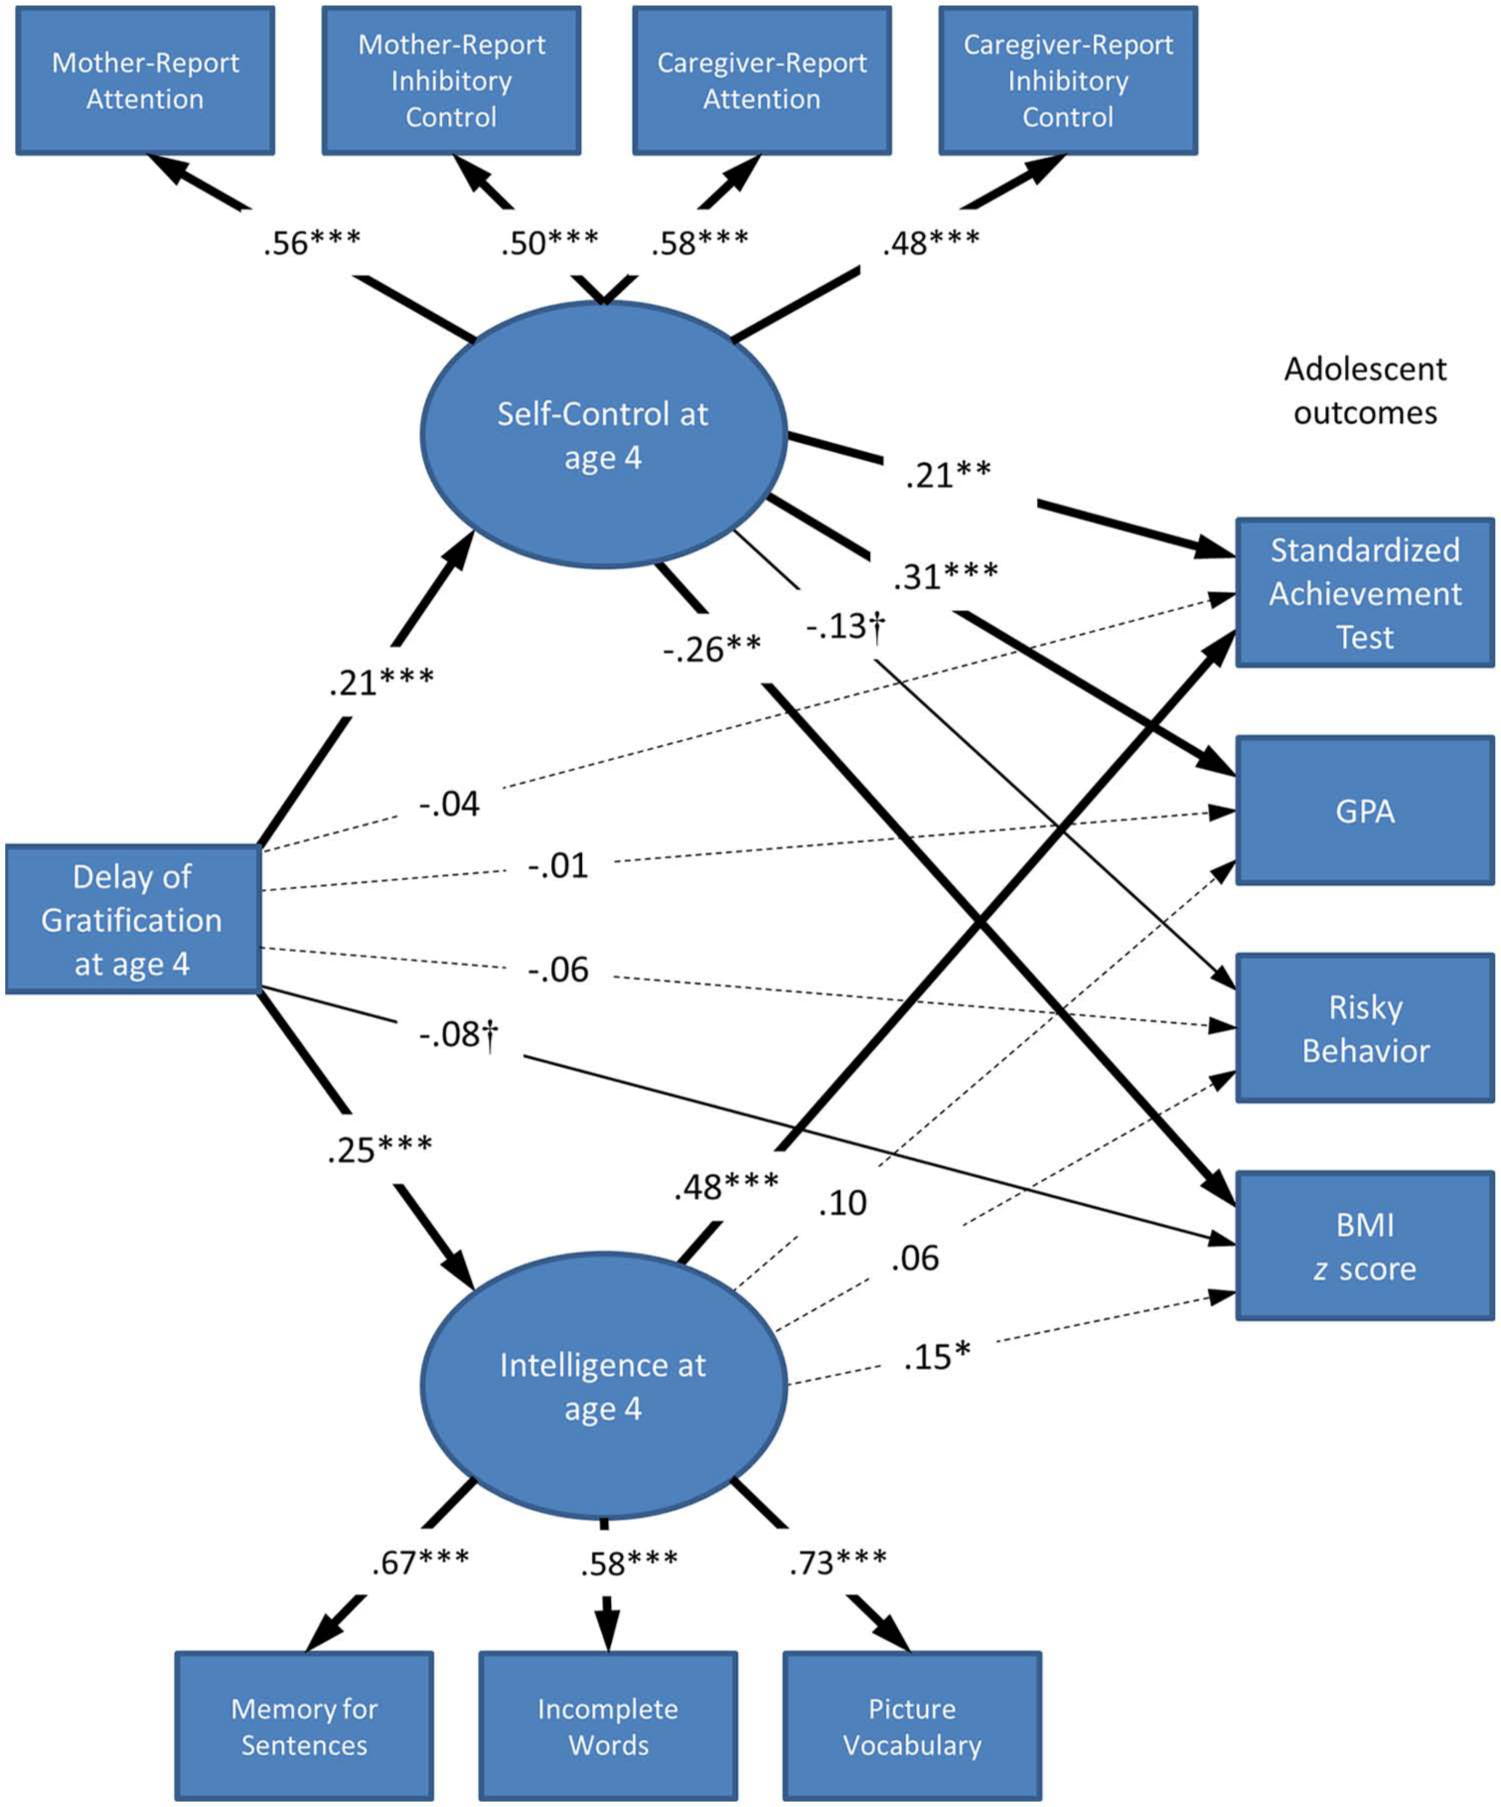
Structural equation model in Study 2.
As shown in Figure 1, for report card grades in eighth and ninth grade, the predictive power of the delay task was explained by self-control (β = .31, SEβ = .07, p < .001) but not intelligence, β = .10, SEβ = .06, p = .10. This finding adds to a growing literature demonstrating that self-control (more typically assessed using informant or self-report ratings) predicts report card grades better than does any other aspect of temperament or personality (Duckworth & Allred, 2012).
The prediction of higher standardized achievement test scores by delay performance was explained in part by self-control (β = .21, SEβ = .07, p = .001) as well as verbal intelligence (β = .48, SEβ = .06, p < .001). This finding comports with separate research suggesting that intelligence is a better predictor of standardized achievement test scores than self-control, whereas self-control is a better predictor of report card grades than intelligence (Duckworth, Quinn, & Tsukayama, 2012). One possible explanation for divergent associations with different measures of academic achievement is that report card grades differentially reward positive classroom behavior, studying, and homework, whereas achievement tests differentially tap the ability to solve novel problems without formal instruction.
For self-reported risky behavior in adolescence, self- control (β = −.13, SEβ = .08, p = .074), but not intelligence (β = .06, SEβ = .07, p = .34), was a marginal predictor. When accounting for these two factors, delay performance was no longer a significant predictor of risky behavior, β = −.06, SEβ = .04, p = .11. The association between self-control and risky behavior in adolescence has been well-documented in other studies (e.g., Romer, Duckworth, Sznitman, & Park, 2010). Current theory suggests that risky behaviors peak in adolescence because self-control processes are still maturing while reward-related impulses dramatically increase in strength during this developmental epoch (Steinberg, 2008). The current findings support the view that variance in risky behavior during adolescence is predicted by early emerging differences in self-control but not reward-related impulses.
As for physical health, preschool children rated higher in self-control maintained a healthier BMI in adolescence (β = −.26, SEβ = .08, p = .002), whereas more intelligent preschool children ended up slightly heavier (β = .15, SEβ = .07, p = .045). This finding corroborates separate longitudinal research showing that more self-controlled children maintain healthier bodyweights, particularly as they enter adolescence and more independently make choices about what and how much to eat (Duckworth, Tsukayama, & Geier, 2010; Tsukayama, Toomey, Faith, & Duckworth, 2010). Delay performance was a marginal predictor of BMI when controlling for self-control and intelligence (β = −.08, SEβ = .04, p = .054). The finding that more intelligent children ended up heavier was surprising given longitudinal research identifying intelligence as a protective factor against weight gain (Chandola, Deary, Blane, & Batty, 2006). Given the borderline p value of .045, this result may be due to chance and/or due to suppression effects from the other variables in the model. Nonetheless, this finding does not change our conclusion that self-control, rather than intelligence, is responsible for the protective relationship between delay of gratification and BMI.
General Discussion
Overall, our findings suggest the delay of gratification task predicts life outcomes because it measures self-control, rather than intelligence or reward-related impulses. Among school-age children in Study 1 and preschool children in Study 2, self-imposed wait time in this task converged with concurrent ratings of self-control by adult informants. These associations were small to medium in terms of effect size (Bedard, Krzyzanowska, Pintilie, & Tannock, 2007), comparing favorably to meta-analytic estimates of correlations between task and questionnaire measures in general (Meyer et al., 2001) and for self-control in particular (Duckworth & Kern, 2011). Moreover, wait time was less reliably related to reward-related impulses (in both studies) or to conceptually distinct traits in taxonomies of personality (in Study 1) or temperament (in Study 2). Finally, we confirmed that performance in the delay task provided incremental predictive validity over and beyond intelligence for GPA (in Studies 1 and 2), as well as standardized achievement test scores, BMI, and risky behavior (in Study 2). As expected, informant ratings of preschool self-control consistently explained the predictive validity of the delay task for adolescent outcomes, whereas informant ratings of preschool reward-related impulses did not.
Kelvin (1883) famously observed, when you can measure what you are speaking about and express it in numbers, you know something about it; but when you cannot measure it, when you cannot express it in numbers, your knowledge is of a meager and unsatisfactory kind; it may be the beginning of knowledge, but you have scarcely in your thoughts advanced to the state of Science, whatever the matter may be. (p. 73)
We can think of no better exemplar of Kelvin’s dictum than the delay of gratification paradigm. Long assumed central to successful development, self-control has only within the last half century become the object of productive scientific inquiry. While not the only valid measure of self-control available to researchers, the delay of gratification task has crucial advantages. Most notably, the delay task obviates the well-known limitations of questionnaire measures (e.g., faking, social desirability bias, acquiescence bias, and reference bias).
What makes the delay of gratification task so exquisitely sensitive to individual differences in self-control? We can only speculate, but several features of the paradigm seem worth highlighting. First, the child is presented with a range of treats from which they choose their favorite. Temptation is thus maximized by using a treat the child really likes, but the very trivial amount of snack likely precludes hunger impulses to swamp self-regulatory processes, as evidenced by a near-zero correlation between self-reported hunger ratings at the start of the task and delay time in Study 1. Second, the task is administered in a quiet, empty room in which the child is left alone to ponder, continuously, his or her choice—shall I continue to wait or shall I gobble up this smaller treat right now? In the absence of external distractions, with temptation lying within easy reach and in plain sight, children rely on self-regulatory strategies of varying effectiveness (Carlson & Beck, 2009). Third, before leaving, the experimenter emphasizes to the child that she doesn’t care much what the child ultimately decides to do. This minimizes the possibility that children wait to comply with authority, as seems to be the case in other tasks (e.g., the gift delay task in Funder et al., 1983). Finally, unlike more easily administered measures in which individuals make discreet (and irrevocable) choices between smaller, sooner and larger, later rewards, the delay task begins with the (universal) election for larger, later treats and then tests the ability to sustain the decision to wait.
Limitations
We see three important limitations of the present investigation. The first concerns the lack of adult outcomes for the children who completed the delay task in both Studies 1 and 2. While research using alternative measures suggests that self-control contributes to a wide range of outcomes in adulthood (e.g., Moffitt et al., 2011), it will be years before comparable outcome data is available for the participants in this investigation.
Second, our analyses were restricted to data that had been collected, particularly in Study 2, which relied upon a large, public data set. Thus, while in both studies we were able to situate the delay task within nomological networks established by omnibus measures of personality and temperament, there is no way to know for certain whether some unmeasured trait would have demonstrated the same pattern of results as self-control. Likewise, it is possible that better measures of reward-related impulses would have produced stronger associations with delay performance and outcomes. For school-age children, for instance, it is possible that reward-related impulses might be more accurately elicited using an implicit association task (Hofmann, Deutsch, Lancaster, & Banaji, 2010).
Finally, neither of our samples were nationally representative. Methodologists (e.g., Grace & Bollen, 2005) have argued that interpreting standardized coefficients in convenience samples is problematic because standardized coefficients are based on both unstandardized effects as well as (possibly truncated) sample standard deviations. The implication is that the relative strength of standardized coefficients in a sample may not reflect the population if there is restricted range on some variables but not others. While Study 1 had a small sample from a single school, this issue is less of a problem for Study 2, which included a socioeconomically, ethnically, and geographically diverse sample of children from across the United States. Furthermore, a significant unstandardized coefficient suggests a significant standardized coefficient (because the standardized coefficient is zero if the unstandardized coefficient is zero). Therefore, regardless of the relative strength of the predictors, the pattern of significant results supports our hypothesis that self-control, rather than intelligence or reward-related impulses, is responsible for the predictive power of the delay task.
Conclusion
Performance task measures of competencies other than mental ability are regrettably few in modern psychology research. Despite heroic attempts in this direction earlier in psychology’s history (e.g., Hartshorne & May, 1929), psychological research these days is dominated by “introspective self-reports, hypothetical scenarios, and questionnaire ratings” (Baumeister, Vohs, & Funder, 2007, p. 396). The current investigation affirms the value of directly measuring human behavior under standardized conditions explicitly designed to elicit theoretically interpretable responses and verifying, through systematic investigation of its correlates and consequences, that the task indeed assesses what it was intended to assess.
Footnotes
Declaration of Conflicting Interests
The author(s) declared no potential conflicts of interest with respect to the research, authorship, and/or publication of this article.
Funding
The author(s) disclosed receipt of the following financial support for the research, authorship, and/or publication of this article: The research reported here was supported by the John Templeton Foundation, Grant K01-AG033182 from the National Institute on Aging, and Grant R305B090015 from the Institute of Education Sciences, U.S. Department of Education. The opinions expressed are those of the authors and do not represent views of the U.S. Department of Education.