
Abstract
A vast amount of literature examined the relationship between retrospective affective evaluations and evaluations of affective experiences. This literature has focused on simple momentary experiences, and was based on a unidimensional concept of affect. The current article examines the relationships between evaluations of complex experiences, experiences involving both positive and negative feelings, and the retrospective evaluation of these experiences. Based on the idea that negative information is better remembered than positive information, we predict that in comparison with negative retrospective evaluations, positive evaluations have a stronger correlation with end affect and a weaker correlation with peak affect. These predictions are tested in two studies. We explore boundary conditions for these effects and demonstrate the implications of the asymmetry between positive and negative affect to various topics that are at the center of affect research: the dimensionality of affective experiences, the memory-experience gap, and the analysis of net affect.
People often make retrospective affective evaluations regarding past periods of time. Although the time frame for which these evaluations are made can vary from a few minutes to weeks and months, it is commonly assumed that the psychological processes by which they are formed involve integration of affective experiences of units of time. Depending on the time frame of the retrospective evaluations, these time units can be very short, reflecting momentary experiences (Kahneman, Wakker, & Sarin, 1997), as in the overall retrospective evaluation of a painful episode from indivisible feelings of pain (e.g., Redelmeier, Katz, & Kahneman, 2003). But they can be longer, reflecting extended experiences, as in the retrospective evaluation of a vacation from the evaluations of the days of the vacation (Kemp, Burt, & Furneaux, 2008). In the current article, we focus on the processes involving the retrospective evaluations of extended experiences by studying the relationship between daily and weekly affective evaluations.
Many extended experiences are complex experiences, experiences that involve both positive and negative affect. Thus, for example, an affective evaluation of a day is bound to include both pleasant and unpleasant feelings. As there is much evidence suggesting that positive and negative feelings are not the mere opposites of each other, but are to some extent different psychological constructs (e.g., Watson, Clark, & Carey, 1988), the study of the retrospective evaluation of extended experiences needs to examine the similarities and differences in the retrospective evaluation of negative and positive feelings. So far, most of the studies of retrospective evaluation focused on experiences that are naturally unidimensional, and particularly on negative experiences (such as the experiences of pain), and did not take into account that experiences, particularly complex real-life experiences, may involve both pleasant and unpleasant aspects. The current study examines the retrospective evaluations of complex experiences: We study the relationship between daily evaluations of positive and negative affect and weekly retrospective evaluations of these two affective dimensions.
The Processing of Negative and Positive Affective Information
There is an asymmetry between the formation of positive and negative affective evaluations, which is due to more intense processing of negative than positive information. The higher intensity of processing negative information is a truism in psychological research. Thus, for example, two recent reviews concluded that “bad is stronger than good” (Baumeister, Bratslavsky, Finkenauer, & Vohs, 2001, p. 323) and that “not all emotions are created equal . . . adults display a negativity bias, or the propensity to attend to, learn from, and use negative information far more than positive information” (Vaish, Grossmann, & Woodward, 2008, p. 383).
Of particular importance to the current article are differences in memory. First, consistent with the idea that attending to negative information has a greater evolutionary value than attending to positive information (Nesse, 1990), many studies demonstrate this asymmetry. People spend more time viewing photographs depicting negative than those depicting positive behaviors (Fiske, 1980); they look more at faces that express negative emotions than at those expressing positive emotions (Oehman, Lundqvist, & Esteves, 2001); they spend more time monitoring negative evaluations than monitoring positive evaluations (Graziano, Brothen, & Berscheid,1980); they take more time to form negative attributions than to form positive attributions (Claeys & Timmers, 1993); and, at the neurological level, negative information generates more neural responses than positive information (Bartholow, Fabiani, Gratton, & Bettencourt, 2001; Hajcak & Olvet, 2008; Smith, Cacioppo, Larsen, & Chartrand, 2003). As attention is directly associated with memory, all these studies suggest that attention processes lead to better memory of negative than positive feelings.
Second, there is much direct evidence that memory for negative information is better than memory for positive information. Thus, for example, Pratto and John (1991) found that people are twice as likely to remember bad traits as to remember good ones; Bless, Mackie, and Schwarz (1992) and Skowronski and Carlston (1987) found that people remember bad behavior better than good, and Hertenstein and Campos (2004) found that young children retain negative emotional information about novel toys over time better than positive emotional information. Neuroscience evidence also suggests that negative information is better remembered than positive information. For example, negative events were found to leave indelible memory traces in the brain (LeDoux, Romanski, & Xagoraris, 1989; Quirk, Repa, & LeDoux, 1995) and receive greater neural processing (as reflected in event-related brain potential) than do positive stimuli (Ito & Cacioppo, 2000).
In sum, differences in memory are likely to affect the way positive and negative affective experiences are integrated to form retrospective evaluations. In particular, negative experiences should be more memorable and more salient than positive experiences when making retrospective evaluations.
Heuristic Rules of Retrospective Evaluations and the Peak End Model
The normative model for retrospective evaluation is a weighted average model in which the units’ affect is weighted by their duration. However, people often rely on heuristic rules to form retrospective evaluations. In particular, a model of retrospective evaluations that received much attention in the literature is the peak end model. This model suggests that retrospective evaluations (e.g., evaluations of last week’s affect) deviate from the normative averaging model by assigning higher weight to the most recent affect, or end affect (e.g., the affect of the last day of the week), and to the most intense affect, or peak affect (e.g., the most intense daily affect of the week). This model was examined in many studies that involved negative affective experiences (e.g., Redelmeier et al., 2003; Schneider, Stone, Schwartz, & Broderick, 2011) and in some studies that involved positive affective experiences (e.g., Do, Rupert, & Wolford, 2008). To the best of our knowledge, however, only one study examined the peak end model in situations that involved complex experiences of both negative and positive affects (Miron-Shatz, 2009), finding that retrospective evaluations were positively associated with the lowest affect, but not by the highest or last affect. However, this study did not distinguish between the retrospective evaluations of positive and negative affect, but rather combined the positive and negative affective scales, treating them as two poles of a single dimension. As we show below, the separation between positive and negative affect is crucial for a meaningful modeling of the relationship between affective experiences and retrospective affective evaluation.
Hypotheses: The Peak End Model and the Positive–Negative Asymmetry
Central to our analysis of retrospective affective evaluation is the notion of evaluation by substitution—the tendency to substitute the required evaluation with a different, easier to make, evaluation (Kahneman & Frederick, 2002). Evaluation by substitution was offered as a general framework for various heuristics, such as representativeness, availability, and the affect heuristic, in which difficult probability judgments are replaced by easier judgments of similarity, memory availability, and affect, respectively. We suggest that substitution occurs also in retrospective affective evaluations. When asked to make a retrospective evaluation—a difficult task requiring the integration of fading memories about affective experiences (Robinson & Clore, 2002)—people may substitute the required evaluation with simpler evaluations. In particular, they may substitute the required evaluation with an evaluation of end affect and/or an evaluation of peak affect. In comparison to integrating multiple pieces of less-accessible affective information to arrive at a retrospective evaluation, these two evaluation heuristics are easier to make. The evaluation of end affect involves accessing recent information which is relatively available in memory, and the evaluation of peak affect involves accessing salient information.
We propose two rules that govern the tendency for evaluation by substitution in retrospective affective evaluation. The first rule is associated with the difficulty in the integration of the units’ affects into retrospective evaluation: The more difficult their integration into retrospective evaluation, the higher the tendency for substitution (e.g., the less accessible are the affective memories of the units, the more difficult their integration into a single retrospective evaluation; see Ganzach, 2000; Kahneman, 2003; Slovic, Finucane, Peters, & MacGregor, 2007, for a discussion about the link between task difficulty and evaluation by substitution). The second rule is associated with the difficulty in substitution: The easier it is to produce a substitute evaluation, the higher the tendency for evaluation by substitution (e.g., the more salient the peak affect, the higher the tendency for using it in retrospective evaluations). Because positive and negative information differ in accessibility, these two rules are likely to lead to differences in the patterns of evaluation by substitution, and as a result to an asymmetry between positive and negative retrospective evaluations.
In particular, these rules suggest two hypotheses. The first is that the relationship between retrospective evaluation and end affect will be stronger for positive than for negative affective evaluation (Hypothesis 1). Because memory for positive information is worse than memory for negative information, the reliance on the units’ affect is more difficult in positive retrospective evaluation (retrospective evaluation of positive affect) than in negative retrospective evaluation (retrospective evaluation of negative affect), which leads to a stronger tendency for substitution in positive retrospective evaluations. In this case, the end affect is the most likely candidate for substitution because it is more available in memory than the affects of the other units when retrospective evaluations are made. Thus, in positive retrospective evaluations, when memory of affective experiences is weak and difficulty in relying on the units’ affect is the major factor in the substitution process, we expect the end affect to have a particularly strong relationship with retrospective evaluation.
The second hypothesis is that the relationship between retrospective evaluation and peak affect is stronger for negative than for positive affective evaluations (Hypothesis 2). By and large, peaks are known to have excessive weight in judgment and decision making (Ganzach, 1996; Tversky & Kahneman, 1992; Weber & Kirsner, 1997), but for them to have such excessive weight in memory-based judgments, they need to be perceived as peaks. For that, both peak and nonpeak experiences have to be distinguished when retrospective evaluations are made. This is more likely in the more accessible negative experiences than in the less-accessible positive experiences: Peak negative experiences are more salient than peak positive experiences. To paraphrase Tolstoy on happy and unhappy families, “Positive experiences are all alike. Every negative experience is negative in its own way.”
Modeling
Studies that examined the peak end model tended to emphasize the influence of the peak and end affects, and ignored the influence of the average affect, perhaps because its influence is of “no surprise” (see Kahneman, 2000, p. 5). However, including the influence of the average affect in models of retrospective evaluations is important because a demonstration of peak or end effects should demonstrate an additional explained variance beyond the variance explained by the average affect (Cojuharenco & Ryvkin, 2008; Tully & Meyvis, 2016). Therefore, we use the following models to estimate the peak–end effects:


Where PA and NA refer to positive and negative affects, respectively, the subscript r refers to the retrospective evaluation and the subscripts average, peak, and end refer to the average, peak, and end affects of the units. Note that in this modeling approach, we take the position that positive and negative affects represent two independent affective dimension (Watson & Tellegen, 1985), rather than one dimension (Russell & Carroll, 1999). 1 Note that this model estimates how much the peak and the end effects explain retrospective evaluation beyond the “normative” additive model in which retrospective affect is the sum of the units’ affects. 2
Study 1
Data
Data were collected from 222 participants, 100 who participated for course credit and 122 who were recruited from a paid subject pool, composed mostly of students, receiving about US$12 plus the opportunity to participate in a lottery that will give two prizes of about US$55 each. Respondents’ average age was 23.8 and 54.5% were women. We collected momentary data, in which subjects were asked about their current feelings; end of day data, in which subjects provided retrospective evaluations of the day; and end of week data, in which subjects provided retrospective evaluations of the week.
Procedure
The experiment was conducted online over 5 consecutive days. At first, participants received a short description of the experiment and answered a short demographic questionnaire. 3 They then began to answer experience sampling questionnaires via a phone app (PACO), which were used to collect the momentary data. The questionnaires took place on regular weekdays, starting on Sunday mornings and ending Thursday evenings. These momentary questionnaires were sent to participants at 8 random times during the day between 08:00 a.m. and 18:00 p.m. with a minimum of 1 hr between them. Every evening at approximately 18:30, participants received by email the end of day questionnaire. Finally, on the last day of the experiment (Thursday evening), at approximately 19:30, participants received by email the end of week questionnaire. A follow-up email was sent to participants who did not answer the end of day questionnaire on the first day to emphasize the importance of answering this part of the survey.
Data quality considerations
We performed a quality check of the data and removed observations that appeared to be unreliable in all three levels.
Omitted momentary observations
Of the 222 participants, 21 were dropped from the analysis of the momentary questionnaires: Six subjects did not receive the momentary questionnaires because of technical problems (though they received the end of day and end of week questionnaires). Another 15 subjects were removed from the analysis of the momentary data because they responded to less than 25% of the momentary questionnaires. In addition, 445 responses were removed because of unreliability issues. 4 Thus, the analysis of the momentary data was based on 201 subjects who provided 5,515 responses (representing a response rate of 68.6%).
Omitted end of day questionnaire
Of the 222 participants, six had only unreliable daily responses and were dropped from the analysis. In addition, 95 end of day responses were deleted for unreliability. 5 Hence, 216 respondents with 950 daily responses were included in the analyses of the end of day questionnaire.
Omitted responses to the end of week questionnaire
There were 206 respondents who answered the end of week questionnaire. Twenty-one weekly responses were deleted for unreliability. 6 Hence, 185 respondents were included in the analyses of the end of week questionnaire.
Measures
In this experiment, we measured three positive emotions and three negative emotions (as we used a rather intrusive experience sampling technique, we relied on a relatively small number of emotions in our measurement to minimize interference with subjects’ daily activities). The positive emotions were active, enthusiastic, and proud. The negative emotions were upset, nervous, and distressed. The six emotions were taken from the widely used Positive and Negative Affect Schedule (PANAS) scale (Watson, Clark, & Tellegen, 1988). In the momentary questionnaires, subjects were asked about the intensity of these emotions, while in the end of day and end of week questionnaires, they were asked both about the intensity of these emotions and about the frequency of which they felt them.
In the momentary questionnaire, we asked about the current intensity of the three positive and the three negative emotions (e.g., to “what extent do you feel upset at this moment?”). Answers ranged from 1 (a very small extent or not at all) to 5 (a very large extent). Positive and negative items were averaged separately with higher values representing higher positive or negative affect. The Cronbach’s alpha reliabilities of the momentary measures is .702 for positive affect and .801 for negative affect.
Daily (weekly) affect intensity and affect frequency were measured in the end of day (end of week) questionnaires by the same emotions that were surveyed in the momentary questionnaires. For example, affect intensity was measured by asking “to what extent did you feel upset today [this week]?” with the same 1 to 5 response scale as in the momentary questionnaire, and affect frequency was measured by asking “how frequently did you feel upset today [this week]?” with answers ranging from 1 (very infrequently or not at all) to 5 (very frequently). The order in which the affect intensity and affect frequency questions were presented was randomized, either affect frequency first and affect intensity after or vice versa. Summary daily and weekly measures of positive and negative affect intensity and affect frequency were created by averaging the positive and negative items separately, with higher values representing higher positive or negative affect. The Cronbach’s alpha reliabilities of the daily measures is .690 for positive affect intensity, .674 for positive affect frequency, .778 for negative affect intensity, and .786 for negative affect frequency. The Cronbach’s alpha reliabilities of the weekly measures is .693 for positive affect intensity, .650 for positive affect frequency, .839 for negative affect intensity, and .835 for negative affect frequency.
From the end of day data, we derived 12 measures, six affect intensity measures and six affect frequency measures. Peak day positive intensity, peak day negative intensity, peak day positive frequency, and peak day negative frequency scores were assessed by selecting the highest of the daily positive and negative affect intensity and the highest of the daily positive and negative affect frequency scores, respectively. Daily average positive intensity, daily average negative intensity, daily average positive frequency, and daily average negative frequency scores were assessed by averaging the daily positive and negative affect intensity and daily positive and negative affect frequency scores, respectively. End day positive intensity, end day negative intensity, end day positive frequency, and end day negative frequency scores were assessed by selecting the daily positive and negative affect intensity and daily positive and negative affect frequency scores on the fifth day.
Results and Discussion
We first examined whether the intensity and frequency measures should be analyzed separately as different measures, or could be combined and treated as one measure, by testing their correlations. The correlations for positive intensity and frequency measures were r = .90, r = .91, and r = .94 for the peak end and average measures, respectively; all correlations were significant with p < .0001. The correlations for negative intensity and frequency measures were r = .90, r = .91, and r = .95 for the peak end and average measures, respectively; all correlations were significant with p < .0001. The correlations for the weekly intensity and frequency measures were r = .89 and r = .90 for the positive and negative measures, respectively, both significant with p < .0001. As these correlations were high, we inferred that the intensity and frequency measures essentially measure the same construct and hence averaged them to create a combined affect measure (for brevity, we refer to them as affect rather than combined affect). Thus, after combining the intensity and frequency measures, each subject had six overall affect measures that were used to model the daily affect: peak day positive affect, peak day negative affect, daily average positive affect, daily average negative affect, end day positive affect, and end day negative affect. Each subject also had two weekly measures: weekly positive affect and weekly negative affect.
Means, standard deviations, and intercorrelations of these six affect measures are presented in Table S1 of the supplementary material (the means, standard deviations, and intercorrelations of the intensity and frequency measures are presented, respectively, in Tables S2a and S2b of the supplementary material).
Tests of hypotheses
The results of daily to weekly models—models in which weekly affect is regressed on daily affects—are presented in Table 1. The table presents the results of two models: one for the positive affect and one for the negative affect. 7 Before moving to the analyses of the peak and end effects, we draw the attention of the reader to the powerful daily average effects. The standardized coefficients of the daily average, β = .686, t(158) = 6.52, p < .0001, and β = .506, t(158) = 4.49, p < .0001, for positive and negative affect, respectively, are much larger than the standardized coefficients of both the peak and end effects. This highlights the need to control for the average affect when estimating the effects of peak and end affects.
Peak–End Models of Daily to Weekly Positive and Negative Weekly Affect (Study 1; n = 162).
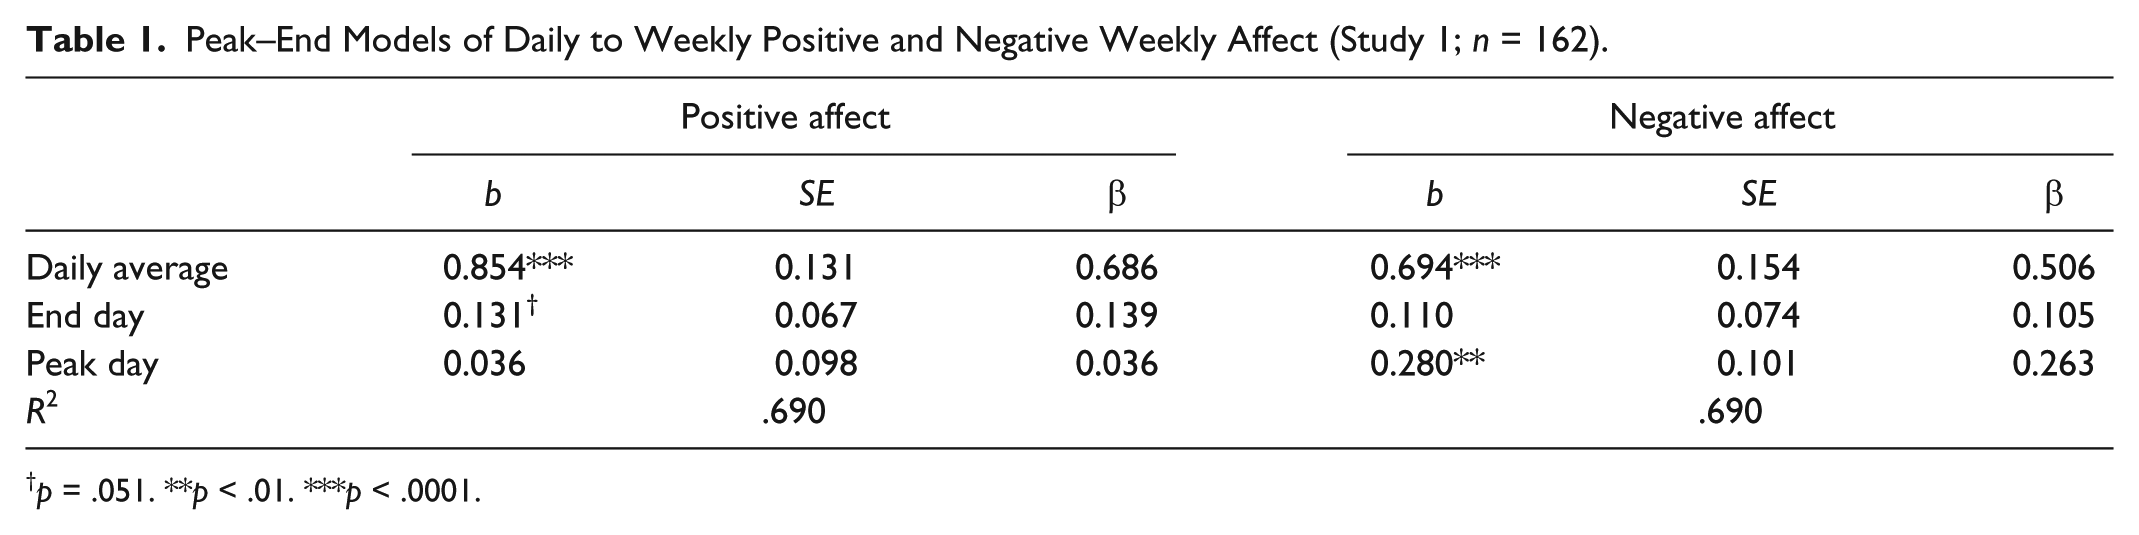
p = .051. **p < .01. ***p < .0001.
Hypothesis 1: The end effects
In line with Hypothesis 1, the end day effect is stronger for positive weekly affect than for negative weekly affect. It was significant for positive affect, β = .139, t(158) = 1.96, p = .051, and nonsignificant for negative affect, β = .105, t(158) = 1.50, p = .136.
To compare the positive end effect with the negative end effect, we used m-plus V-8 (Muthén & Muthén, 1998-2017) to estimate inclusive models composed of both the negative and positive models. Specifically, we estimated an inclusive model in which all the parameters were free, 8 and compared its fit to the fit of another inclusive model in which we restricted the positive and negative end effects to be equal. However, we found very little difference between the free model and the restricted model, χ2(1) = 0.002, p = .986. Thus, although the pattern of the difference in the end effects is consistent with Hypothesis 1, this difference is not significant. As we discuss below, this nonsignificant effect may be due to low power. This limitation is be addressed in Study 2.
Hypothesis 2: The peak effects
In line with Hypothesis 2, the peak day effect is stronger for negative weekly affect than for positive weekly affect. The peak day effect is significant for negative affect, β = .263, t(158) = 2.78, p = .006, and nonsignificant for positive affect, β = .036, t(158) = 0.37, p = .713.
To compare the two peak effects, we used the same method that we used to compare the end effects. Specifically, we compared an inclusive model in which all parameters were free with an inclusive model in which we restricted the positive and negative peak effects to be equal. We found that the difference between the models was marginal, χ2(1) = 2.446, p = .118. Hence, with regard to the peak effect, both the pattern of differences is in line with our hypothesis and there is stronger evidence for differences between the peak effects, yet these differences are not significant. 9
Additional analyses
Momentary to weekly models
As Study 1 included measures of momentary intensity, we could also model the relationship between momentary affect and weekly retrospective affect. As the concept of momentary frequency does not make theoretical sense, it was not measured and was not modeled; hence, we modeled momentary intensity with the corresponding weekly measures, namely weekly affect intensity. Table 2 presents the results of a regression in which weekly intensity is predicted from the average momentary intensity over the week, the end momentary intensity (the last momentary intensity reported on the fifth day), and the peak momentary intensity (i.e., the highest momentary intensity reported during the week). In line with our previous findings regarding the difference between negative and positive peak effect in the daily to weekly models, we found a significant peak effect in the negative momentary to weekly model, β = .371, t(160) = 4.09, p < .001, but not in the positive momentary to weekly model, β = .145, t(160) = 1.68, p = .09. Thus, it appears that peak negative momentary intensity is salient enough in memory to influence even the evaluation of weekly retrospective intensity, which is rather remote in time.
Peak–End Momentary to Weekly Models of Positive and Negative Weekly Intensity (Study 1; n = 164).
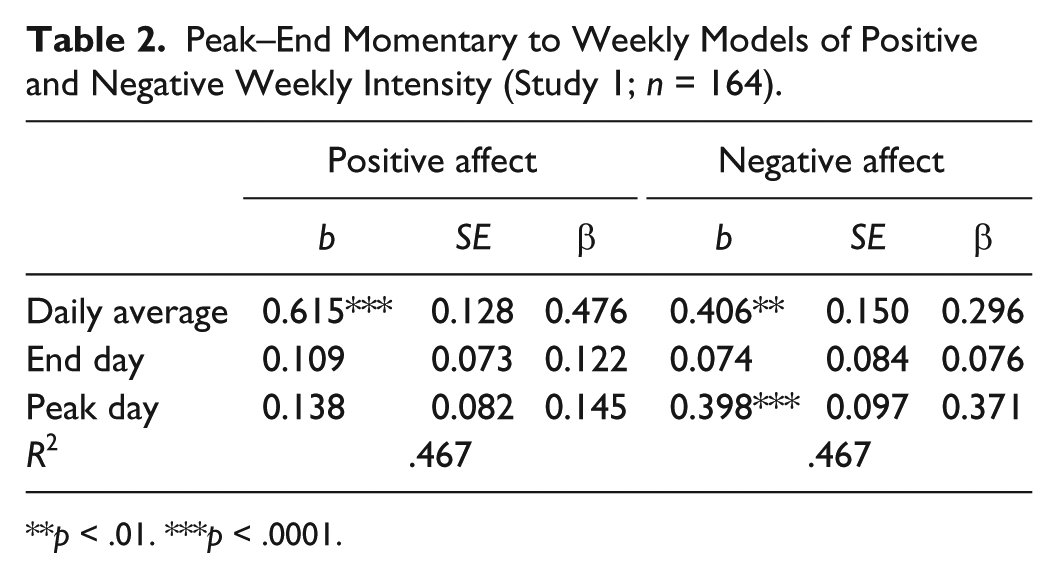
p < .01. ***p < .0001.
The findings regarding the end momentary intensity were somewhat different from our previous findings regarding the end day affect, as not only the end negative momentary intensity did not have a significant effect on weekly intensity, β = .076, t(160) = 0.88, p = .38, but also the end positive momentary intensity did not have a significant effect on weekly intensity, β = .122, t(160) = 1.50, p = .14. 10
Momentary to daily models
The data of Study 1 also allow the modeling of the relationship between daily intensity and momentary intensity. We conducted this analysis within the framework of a multi-level model in which each respondent had up to five daily intensity measures and up to five averages, peaks, and ends daily momentary intensity measures, one for each day of the study. We grouped mean-centered predictor variables (i.e., the average, peak-, and end- momentary measures) as recommended in these types of analyses (Hofmann & Gavin, 1998). The intraclass correlation was .52 and .47 for positive and negative daily evaluations, respectively.
In agreement with the daily to weekly negative models, peak—but not end—negative momentary intensity had a significant effect on daily negative intensity, b = .169, t(123) = 3.48, p = .0007, and b = .058, t(167) = 1.84, p = .068, for the negative peak and negative end affect intensity, respectively. However, in disagreement with the daily to weekly positive models, end momentary intensity did not have a significant effect on daily positive intensity, b = –.001, t(173) = −0.03, p = .972, but peak momentary intensity did have a significant effect on daily positive intensity, b = .104, t(121) = 1.98, p = .051. 11
Although this peak effect of positive momentary intensity is not strong (e.g., it appears to be weaker than the peak effect of negative momentary intensity), it may highlight the role of the time frame in retrospective affective evaluations. While positive peak affects may not be remembered when the retrospective evaluations are remote in time (as is the case of positive weekly evaluations), they may be remembered when the retrospective evaluations are closer in time (as is the case of positive daily evaluations), resulting in peak effects in short-term (daily) but not long-term (weekly) positive retrospective evaluations. For negative retrospective evaluations, this difference between short- and long-term retrospective evaluations is not as prominent, because of the relatively robust memory for peak negative affective experiences.
The peak effect and the memory-experience gap
Our results are relevant to understanding the memory-experience gap—the tendency of retrospective affective evaluations to be higher than the evaluations of the affective experiences of the units; that is, the tendency of positive negative retrospective evaluations to be more positive (more negative) than the evaluations of positive negative units’ experiences. Although a memory-experience gap has been documented in affective ratings of various experiences, such as vacations (Kemp et al., 2008), or episodes of pain (Peters et al., 2000; Stone et al., 2003; Stone, Schwartz, Broderick, & Shiffman, 2005), the mechanisms leading to this gap are unclear (Thomas & Diener, 1990; Wirtz, Kruger, Scollon, & Diener, 2003). One of the mechanisms that was suggested to explain this gap is a peak effect (Stone et al., 2005). If a peak experience influences retrospective evaluations more than other experiences, a memory-experience gap should emerge. However, as our models suggest a peak effect for negative, but not for positive, evaluations, a memory-experience gap is to be expected in our data only for negative, but not for positive, evaluations. This expectation is consistent with Miron-Shatz, Stone, and Kahneman (2009) who found a larger memory-experience gap for negative than for positive evaluations.
The memory-experience gap in our data is apparent by comparing the weekly affect with the daily average affect (see Table S1 in the supplementary material). For negative affect, the gap was 0.375 (2.594 − 2.219), and for positive affect, it was 0.146 (2.523 − 2.377). Both gaps were significantly different from zero, t(161) = 8.57, p < .0001, and t(161) = 4.14, p < .0001, for the negative and positive gaps, respectively. Consistent with a peak effect explanation for the memory-experience gap, and with our distinction between positive and negative retrospective evaluations, the gap was larger for negative than for positive evaluations, t(161) = 3.78, p = .0002, in a paired t test. The gap was about 2.5 times larger for the negative evaluations compared with the positive evaluations. Note, however, that not only the negative evaluations’ gap, but also the positive evaluations’ gap, was positive. A positive memory-experience gap in positive retrospective evaluations appears to be inconsistent with the lack of peak effect in the positive affect model (Table 1). One possible explanation for this apparent inconsistency is that the memory-experience gap in positive evaluations is driven by processes other than peak effect, perhaps by a general “rosy view” of the past (Hsee & Hastie, 2006; Mitchell, Thompson, Peterson, & Cronk, 1997; Sutton, 1992).
Unidimensional versus bidimensional affective scales
The difference between the positive and negative models highlights the importance of modeling complex experiences by the two affective dimensions separately rather than combining them to create a unidimensional scale, as commonly done in psychological research (see, for example, Kahneman & Krueger, 2006, who label this scale “net affect”). In particular, it is not completely clear how the peak–end rule should be applied to mixed experiences when modeling net affect. In our case, should the peak be taken from the peak pleasant day or from the “rough” unpleasant day, as either could be taken as the extreme of the experience? It appears, therefore, that to analyze net affect within the framework of the peak end model, one needs to consider four rather than three effects. Two of the effects are, as in the standard models we estimated above, the daily average affect and the end affect. However, as it is not a priori clear whether the affect of the most positive or the most negative day should represent the peak effect, it is necessary to introduce into the model two predictors to represent peak effects. The first predictor is the affect of the most negative day, or the low-peak. The second predictor is the affect of the most positive day, or the high-peak.
To estimate a net affect model in our data, we combined the positive and negative affect scales into a unidimensional negative–positive scale ranging from high negative affect to high positive affect by subtracting the negative affect from the positive affect, both for the daily measures and the weekly measures. Specifically, net daily affect, NETd, is defined as NETd = PAd – NAd, and weekly net affect, NETw, is defined as NETw = PAw – NAw, where PAd and NAd are the daily positive and negative affect, respectively, and PAw and NAw are the weekly positive and negative affect, respectively. We also defined the net daily average affect as the average of the five net daily affect measures (i.e., the average of NETd); the end day net affect as the net affect of the fifth day; the low day net affect as the net affect of the most negative day; and the high day net affect as the net affect of the most positive day.
Using these measures of net affect, the results of regressing our unidimensional weekly net affect on the average, end, low-peak, and high-peak net affects revealed beta weights of .414, .136, .292, and .071, respectively, t(161) = 2.37, p = .0189; t(161) = 2.0, p = .0471; t(161) = 2.66, p = .0086; and t(161) = 0.62, p = .537, respectively. It is evident that the results of this regression, which suggests a significant effect of the low-peak and a nonsignificant effect of the high-peak, could not be meaningfully interpreted without a bidimensional analysis of the data. In particular, the significant low-peak effect and the nonsignificant high-peak effect are the opposite of what is expected from a simplistic, unidimensional view of the role of peak in retrospective evaluations.
Study 2
A major problem in Study 1 is a lack of power. As the correlations between our independent variables are very high, even a sample size of 162 participants lacks in power (see Yoo et al., 2014, for a discussion about the effect of sample size and multicollinearity on power). Therefore, the major purpose of Study 2 is to replicate the results of Study 1 using a larger dataset. For the purpose of generalizability, we also used different emotions than the emotions used in Study 1.
Method
Data
The data were taken from the National Study of Daily Experiences (NSDE; see Ryff & Almeida, 2010). Participants in the NSDE were recruited after having completed the second wave of the Midlife in the United States Survey (MIDUS II), a nationally representative sample of adults ranging in age from 35 to 84 (Ryff et al., 2012). A random subsample of 3,600 MIDUS II respondents was recruited to participate in the NSDE and a total of 2,022 respondents completed the daily NSDE interviews, a response rate of 78%. The NSDE subsample had distributions similar to the MIDUS II for age as well as marital and parenting status. The participants of the NSDE subsample had slightly more females, were better educated, and had fewer minority respondents than the MIDUS II sample. Respondents’ average age was 56 and 57% were women.
Procedure
Respondents in the NSDE completed short telephone interviews about their daily experiences on each of seven consecutive evenings. On the final evening of interviewing, respondents also answered several questions about their previous week. The initial and final interview lasted approximately 15 to 20 min. The other six interviews lasted approximately 10 to 15 min. Respondents completed an average of 7.4 out of a possible eight interviews (92%) yielding 14,912 daily interviews.
Measures
The NSDE collected only frequency measures of affect, and in this respect, our data are different from most previous studies of retrospective affective evaluation that tended to rely on intensity as dependent variable. However, as the results of Study 1 indicate, affect frequency and affect intensity essentially measure the same construct. We also note that, if anything, the evaluation of affect intensity criticized as being an ambiguous task, sensitive to conversational norms and standards of comparison (Ariely & Loewenstein, 2000) as opposed to the evaluation of frequency, is a relatively non-ambiguous task that provides subjects with clear norms and standards (Warr, Barter, & Brownbridge, 1983). Furthermore, the focus of previous studies of retrospective evaluations was on the relationship between retrospective affect, or utility, and momentary experiences, and particularly on the question of whether people violate the normative model of utility by exhibiting duration neglect in their evaluation of retrospective utility. The focus of the current article is on the relationship between retrospective affect and extended experiences, comparing positive to negative affective evaluations with each other rather with normative standards of utility theory.
Daily measures of positive and negative affect frequency were assessed from the reports of the NSDE participants in 7 days of telephone interviews (see http://midus.wisc.edu/ for the instrument that was used to collect the affect frequency data). On each day, the participants reported how much time (since the last interview) they had felt various positive and negative feelings. The negative feelings that were assessed were restless, nervous, worthless, so sad nothing could cheer you up, everything was an effort, lonely, afraid, hopeless, jittery, irritable, ashamed, upset, angry, and frustrated. The positive feelings that were assessed were in good spirits, cheerful, extremely happy, calm and peaceful, satisfied, full of life, close to others, like you belong, enthusiastic, attentive, proud, active, and confident. Responses ranged from 0 (none of the time) to 4 (all of the time). To create measures of daily positive and negative affect frequencies (daily positive frequency and daily negative frequency, respectively), positive and negative items were averaged separately with higher values representing higher positive or negative affect (Mroczek & Almeida, 2004; Mroczek & Kolarz, 1998; Robinette, Charles, Mogle, & Almeida, 2013). The Cronbach’s alpha reliabilities of the daily affects measures were .96 and .89 for the positive and negative affect, respectively.
From the daily data, we derived six measures. Peak day positive and negative affect frequencies (peak day positive and peak day negative frequency, respectively) were assessed by selecting the highest of the 7 days’ positive and negative affect score. End day positive and negative affect frequencies (end day positive frequency and end day negative frequency, respectively) were assessed by selecting the 7th days’ positive and negative affect scores. Average of daily positive and negative affect frequencies (daily average positive frequency and daily average negative frequency) were assessed by averaging the seven positive and negative daily affect scores. The Cronbach’s alpha (across the daily measurements) of the daily average affects measures were .94 and .86 for the positive and negative affect, respectively.
The weekly retrospective positive and negative affect frequencies (weekly positive and negative frequency, respectively) were assessed at the conclusion of the final day of interviewing by asking respondents how often they felt “during the past week” each of the same positive and negative feelings that were assessed in the daily interviews. The Cronbach’s alpha reliabilities of the weekly individual affect measures were .95 and .87 for the positive and negative affect, respectively.
Results and Discussion
Means, standard deviations and intercorrelations of the variables in this model are presented in Table S5 in the supplementary material.
Tests of hypotheses
Table 3 presents the results of peak–end models for positive and negative weekly affect frequency. As in Study 1, the daily average affects are the most powerful in our models, β = .707, t(1808) = 21.8, p < .0001, and β = .628, t(1808) = 17.8, p < .0001, for positive and negative evaluations, respectively. Interestingly enough, the results regarding the daily average affects in this study are similar to the results of Study 1 in that the effect of the daily average positive affect appear to be stronger than the effect of the daily average negative affect.
Peak–End Models of Positive and Negative Daily to Weekly Frequency (Study 2; n = 1,812).
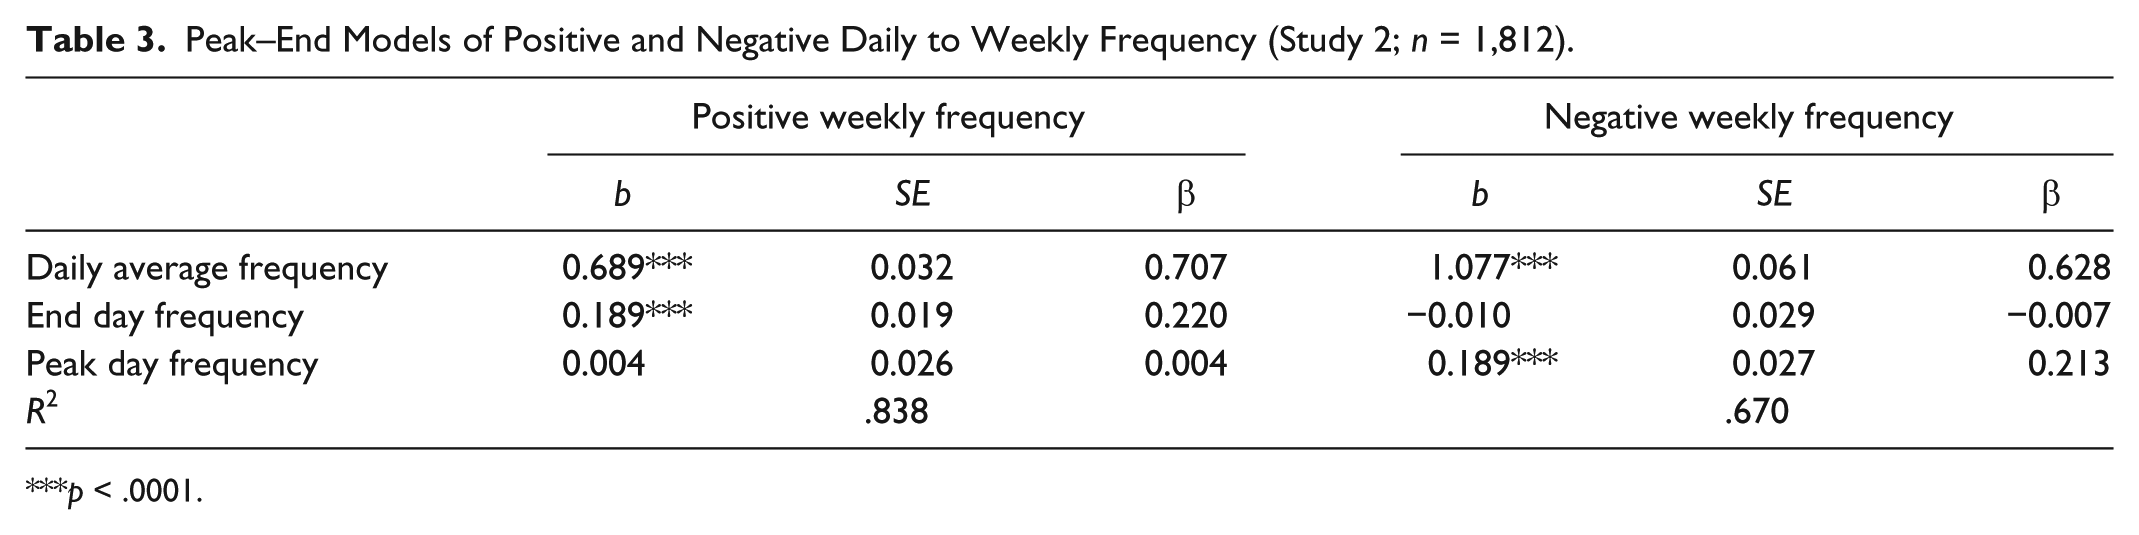
p < .0001.
Hypothesis 1: The end effects
Consistent with Hypothesis 1, the results of our models indicate that the end day effect is significant for positive retrospective evaluations, β = .220, t(1808) = 9.9, p < .0001, and nonsignificant for negative retrospective evaluations, β = –.007, t = 0.4, p = .18.
To compare the two end effects, we used the same method that we used in Study 1, comparing an inclusive model in which all parameters were free with an inclusive model in which we restricted the two end effects to be equal. Consistent with Hypothesis 1, we found that the difference between the models was highly significant, χ2(1) = 30.3, p < .0001.
Hypothesis 2: The peak effects
Consistent with Hypothesis 2, the results of our models indicate that the peak day effect is significant for negative evaluation, β = .213, t(1808) = 7.0, p < .0001, and nonsignificant for positive evaluation, β = .004, t(1808) = 0.2, p = .72.
Again, to compare the two peak effects, we contrasted an inclusive model in which all parameters were free with an inclusive model in which we restricted the two peak effects to be equal. Consistent with Hypothesis 2, we found that the difference between the models was highly significant, χ2(1) = 24.5, p < .0001. 12
Additional analysis
The peak effect and the memory-experience gap
As in Study 1, the memory-experience gap in our data is apparent by comparing the weekly frequency with the daily average frequencies (see Table S5 in the supplementary material). For negative evaluations, the gap was 0.17 (0.36 − 0.19), and for positive evaluations, it was 0.003 (2.77 − 2.74). Both gaps were significantly positive although the second only marginally so (t = 31.9, p < .0001, and t = 1.9, p = .06, for the negative and positive gaps, respectively). Consistent with a peak effect explanation for the memory-experience gap, and with our distinction between positive and negative retrospective evaluations, the gap was larger for negative than for positive evaluations (t = 18.3, p < .0001 in a paired t test)—it was about 8 times as large for the negative evaluations as for the positive evaluations.
Unidimensional versus bidimensional affective scales
To estimate a net affect model in our data, we combined the positive and negative frequency scales into a unidimensional negative–positive scale ranging from high negative frequency to high positive frequency by subtracting the negative frequency from the positive frequency, both for the daily measures and the weekly measures.
Using these measures of net affect, the results of regressing our unidimensional weekly net affect on the average, end, low-peak, and high-peak net affects revealed beta weights of .882, .157, –.093, and –.030, respectively (t = 15.7, p < .0001; t = 7.6, p < .0001; t = 2.8, p < .005; t = 1.0, p = .64, respectively). As in Study 1, the results of this regression, which suggest a significant negative effect of the low-peak and a nonsignificant effect of the high-peak, could not be meaningfully interpreted without a bidimensional analysis of the data. In particular, the significant low-peak effect and the nonsignificant high-peak effect are not consistent with what could be expected from a simplistic, unidimensional, view of the role of peak in retrospective evaluations.
General Discussion
Our two studies suggest that retrospective evaluations of positive affect are different from retrospective evaluations of negative affect. The latter is influenced primarily by the peak affect while the former is influenced primarily by the end affect. We trace these differences to the dissimilarity in memory processes that lead to differences in the tendency to substitute the required retrospective affective evaluations with easier to make evaluations, that is, evaluations of peak or end affect.
One implication of the current study concerns questions regarding how affect should be conceptualized and measured, whether in terms of a unidimensional concept measured on a positive–negative scale or in terms of a bidimensional concept comprising two scales ranging from negative to neutral and from positive to neutral. The current study is obviously more consistent with the second view than with the first.
Most studies in the area of retrospective affective evaluation bypassed questions regarding the measurement and conceptualization of affect as they focused on momentary experiences that were either pleasant or unpleasant. But such questions become important when we deal with complex experiences that involve both the pleasant and the unpleasant. Thus, for example, our results indicate that in studying how people retrospectively evaluate their affect, the conceptualization of affect in terms of net affect—the difference between positive and negative affect—is problematic. If the processes underlying positive and negative retrospective evaluation are different, combining positive and negative affective evaluations leads to results that cannot be interpreted. This issue may be particularly important as the conceptualization and measurement of affect, and the related concept of utility, as a unidimensional concept is usually necessary for an economic analysis of human experience.
One methodological aspect in studying the difference between positive and negative affect is that the reliability of their measurement may differ (often depending on the particular emotions that are used in the measurement). However, we do not think that this difference compromises the validity of our results. First, although in Study 1, the reliabilities of the positive affect were higher than the reliabilities of the negative affect, the pattern of results was similar. And second, differences in reliability are not a problem with regard to our main finding of the significant (nonsignificant) effect of end day (peak day) for positive affect, and the significant (nonsignificant) effect of peak day (end day) for negative affect, because the comparisons here are within similar measures. Within this context, we also note that the literature on affective evaluations often focuses on single-item evaluations rather than on aggregate positive/negative evaluations as the concept of interest (e.g., Kahneman & Deaton, 2010). This approach may not be a satisfactory solution to the reliability issue as the reliabilities of the positive single-item evaluations may very well be higher than the reliabilities of the negative single-items evaluations. Nevertheless, we examined the robustness of our results by conducting single-item analyses. The results of these analyses were similar to the results of the aggregate measures analyses.
The current work did not explore the possibility that substitution processes other than substitution by peak or end affect are involved in retrospective affective evaluations. In particular, triggered by the vagueness of the memories of the units’ experiences, top-down processes may lead to retrospective affective evaluations that are based on global tendencies, or perhaps even on general response strategies. For example, people may rely in their retrospective evaluations on a global optimistic–pessimistic attitude, or even on a predisposition toward social desirability, rather than on the actual units’ affect. Furthermore, because memories for positive affect are weaker than memories for negative affect, the effects of these substitution processes may be more pronounced for positive than for negative evaluations. Our incidental finding that the relationship between the daily average affect and retrospective evaluation is stronger for positive than for negative affective evaluations may reflect such processes. We believe that the study of these processes is an interesting subject for future research.
Finally, one potentially important aspect of the current study is that it links the judgment and decision-making literature in general, and in particular, the literature about memory-based affective judgments (i.e., remembered utility) and the literature about constructive processing (Payne, Bettman, & Johnson, 1992), to the literature about the dimensionality of affect. Specifically, it suggests that the findings about the differences between positive and negative affect could be viewed as resulting from the way retrospective affective judgments are constructed. When asked about the positive and negative aspects of their past affect, people focus on the compatible positive and negative experiences that arouse the affect. For example, retrospective evaluations of positive affect, which focus on the positive aspects of experience, and retrospective evaluations of negative affect, which focus on the negative aspects of experience, are comparable with acceptance judgments, which focus on the positive aspects of the target object, and rejection judgments, which focus on the negative aspects of the target object (Ganzach & Schul, 1995; Shafir, 1993). In this respect, the independence between positive and negative retrospective affective evaluations could be understood as an example of framing and constructive judgments.
Supplemental Material
RememberedUtility_Supplemental_Material5 – Supplemental material for The Retrospective Evaluation of Positive and Negative Affect
Supplemental material, RememberedUtility_Supplemental_Material5 for The Retrospective Evaluation of Positive and Negative Affect by Yoav Ganzach and Einat Yaor in Personality and Social Psychology Bulletin
Footnotes
Declaration of Conflicting Interests
The author(s) declared no potential conflicts of interest with respect to the research, authorship, and/or publication of this article.
Funding
The author(s) received no financial support for the research, authorship, and/or publication of this article.
Notes
Supplemental Material
Supplementary material is available online with this article.
References
Supplementary Material
Please find the following supplemental material available below.
For Open Access articles published under a Creative Commons License, all supplemental material carries the same license as the article it is associated with.
For non-Open Access articles published, all supplemental material carries a non-exclusive license, and permission requests for re-use of supplemental material or any part of supplemental material shall be sent directly to the copyright owner as specified in the copyright notice associated with the article.