



Abstract
Researchers have long argued that ingroup favoritism and outgroup derogation are separable phenomena that occur in different, meaningful combinations. Statistical methods for testing this thesis, however, have been underutilized. We address this oversight by using latent profile analysis (LPA) to investigate distinct profiles of group bias derived from ingroup and outgroup warmth ratings. Using a national probability sample of Māori (the indigenous people of New Zealand; N = 2,289) and Europeans (N = 13,647), we identify a distinct profile reflecting ingroup favoritism/outgroup derogation (Type III in Brewer’s typology of ingroup bias) in both groups (6.7% of Māori, 10.3% of Europeans). The factors associated with this type, however, differed between groups. Whereas ethnic identity centrality predicted membership for Type III for Māori, social dominance orientation predicted this type for Europeans. Thus, although both groups may express the same kind of bias pattern, the motivation underlying this bias varies by status.
Keywords
Ingroup bias—the tendency to evaluate the ingroup more favorably than the outgroup (Brewer, 2017)—has been a cornerstone of social psychological research for more than 60 years (Allport, 1954; Tajfel, 1970; Tajfel, Billig, Bundy, & Flament, 1971). Assessing different types of ingroup bias in the real world, however, can be difficult, as attitudes toward one’s own group and the outgroup fall on continuums, rather than into distinct categories. Indeed, traditional analytic methods including analysis of variance (ANOVA) and regression analyses investigate the relationship between variables rather than identifying unique response patterns that exist within subgroups of the population.
Here, we argue that latent profile analysis (LPA) is ideally suited to identify unique types of ingroup bias. LPA is a statistical method that tests whether distinct response patterns underlie participants’ responses to two or more continuous variables (e.g., reward allocations to “Group x” and “Group y” in a minimal group paradigm). For example, one response pattern may capture those who allocate rewards (or positive evaluations) to both the ingroup and the outgroup (no bias), whereas another pattern might reflect those who favor the ingroup over the outgroup (ingroup bias). A third pattern might even exist where the outgroup is favored over the ingroup (outgroup bias). In addition to identifying each of these qualitatively distinct response patterns and estimating people’s likelihood of displaying a given pattern, LPAs can answer critical theoretical questions about who will display these unique response patterns (e.g., does a preference for group-based hierarchy predict the likelihood of exhibiting ingroup bias?).
Traditionally, ingroup bias has been investigated using experiments. For example, Tajfel and colleagues (Tajfel, 1970; Tajfel et al., 1971) were notable for the development of the minimal group paradigm and allocation matrices. In this paradigm, participants are placed arbitrarily into groups, supposedly based on their preference for paintings by Wassily Kandinsky or Paul Klee. These randomly allocated groups are “minimal” based on the lack of history and connection to other members. Participants then allocate varying amounts of money to nonpresent, nonnamed, ingroup, and outgroup members (e.g., Klee vs. Kandinsky enthusiasts). Importantly, these allocation matrices maximize (a) equality, (b) joint gains, (c) relative gains, or (d) absolute gains (Brewer, 1979). Overwhelmingly, participants tend to defy rational economic models and select options that maximize relative gains for the ingroup, even over absolute gains (Brewer & Silver, 1978). Thus, the mere experience of being categorized as a group member is enough to elicit ingroup bias (i.e., allocating more money to the ingroup).
These unexpected results were formative in the development of social identity theory (SIT; Tajfel & Turner, 1979). The core of SIT focuses on social identity, people’s awareness that they belong to different social groups, which hold meaning and value to them (Tajfel, 1972). Notably, a positive social identity is contingent upon making favorable comparisons between a relevant ingroup and an outgroup to achieve “positive distinctiveness” (Brewer, 1999). Ingroup bias, therefore, originates from the desire to achieve a positive group-based identity.
Ingroup Favoritism and Outgroup Derogation
Ingroup bias has often been explained in terms of ingroup favoritism, whereby allocations of favorable treatment, attitude, or warmth are exclusively reserved for the ingroup (e.g., see Brewer, 1979; Tajfel et al., 1971). Ingroup bias can, however, also be driven by prejudice and outgroup derogation in which the outgroup is treated unfairly relative to the ingroup (Brewer, 1999). Accordingly, Brewer (2017) distinguished between ingroup favoritism and outgroup derogation when noting that “variations in [outcomes received by the ingroup relative to the outgroup] can be parsed (theoretically) into components due to variation in favorability toward the ingroup and variation due to negativity toward the outgroup” (p. 91). Brewer then described three different types of ingroup and outgroup evaluations. Type I involves ingroup favoritism without outgroup derogation, whereas Type II entails outgroup derogation without ingroup favoritism. Finally, Type III consists of both ingroup favoritism and outgroup derogation (i.e., ingroup favoritism/outgroup derogation).
Researchers typically differentiate between these types of ingroup bias by estimating the degree of relative bias in some sort of reward allocation task to the ingroup versus the outgroup (Brewer, 1979). One key limitation to this approach is that such measures only describe the sample mean level of bias. As such, we do not know whether the bias is equivalent or uniform across individuals within the population. For instance, measures of relative bias are unable to identify specific subgroups of the population who display different patterns of high versus low ingroup bias, or perhaps even outgroup favoritism. Indeed, Fischer and Derham (2016) performed a meta-analysis of 269 samples from 18 societies (N = 21,266) that used the minimal group paradigm or included a measure of group-based bias. Despite the size and diversity of these studies, only a few employed designs that could differentiate between ingroup favoritism and outgroup derogation. Therefore, there is room within the literature for a novel operationalization of ingroup bias that differentiates between Brewer’s (2017) different types of bias.
The ability to differentiate between the different types of ingroup bias has important implications for both highlighting and modifying discriminatory behavior. For example, ingroup favoritism is argued to lead to discrimination by reserving benefits and favors to the ingroup. As such, the motivation is focused on the ingroup, but is not related to negativity toward the outgroup (Brewer, 2017). In contrast, outgroup derogation focuses on negative evaluations of the outgroup, without implying positive evaluations of the ingroup. As such, outgroup derogation may be motivated by intentions to harm the outgroup, irrespective of the benefit to the ingroup. Because these two different forms of group-based bias have different motivations and outcomes, the ability to distinguish between these forms of bias can help to develop targeted interventions that directly address the roots of ingroup bias. LPA provides one way to accomplish this goal in the context of ingroup bias.
LPA
As noted earlier, LPA is an analytic approach that identifies categories (or profiles) of people based on their responses to two or more variables (see Osborne & Sibley, 2017). As such, it is commonly contrasted with variable-centered approaches that treat variables as the unit of analysis and assume that the associations between variables are consistent across the population (Collins & Lanza, 2010). Rather, LPAs help to identify distinct subgroups within the population that produce similar response patterns, as shared patterns of responding presumably reflect latent categories to which qualitatively distinct people belong. After identifying the number of distinct response patterns needed to summarize the data, LPAs estimate each participant’s likelihood of belonging to a given latent profile. Because LPAs also provide an estimate of model fit, models containing anywhere between two and 10 (or more) profiles can be statistically compared, with an eye toward parsimony (Nylund, Asparouhov, & Muthén, 2007).
Despite its potential utility, LPA remains underutilized within the social sciences (see Osborne & Sibley, 2017). There is, however, a small existing literature using LPA in social psychology. Such analyses have identified distinct response patterns based on political ideology (Weber & Federico, 2013), paranormal beliefs (Wilson, Bulbulia, & Sibley, 2014), and experiences of deprivation (Osborne, Sibley, Huo, & Smith, 2015). Osborne and Weiner (2015) also used LPA to identify distinct attribution patterns underlying people’s beliefs about the causes of poverty, revealing that those who explained poverty in terms of factors that are internal and personally controllable (yet, unstable and relatively uncontrollable by others) were the least sympathetic and most hesitant to help the poor. Finally, Sibley and Becker (2012) used an LPA to examine a central assumption of ambivalent sexism theory (namely, that benevolent and hostile sexism covary within the individual).
We argue that LPA can also be used to identify distinct patterns of ingroup/outgroup bias within a population using differences in warmth ratings toward the ingroup and outgroup. In the present article, we draw on majority and minority group ratings of warmth (using feeling thermometers) toward both ingroup and outgroup to identify and differentiate Brewer’s (2017) types of ingroup bias. Because people can give equal warmth ratings to both the ingroup and the outgroup, a deviation from equality demonstrates bias.
There are, however, qualitative differences between resource allocation matrices and feeling thermometers. Resource allocation matrices, through their forced choice paradigm, generate a zero-sum game, where any “gain” to one group requires a “loss” to the other group. Therefore, resource allocation matrices are inherently competitive. In contrast, there are no “gains” or “losses” when using feeling thermometers to rate groups—equally high (or low) levels of warmth can be allocated to both groups. Resource allocation matrices also represent a decision-based allocation process in which material benefits are selected for the ingroup and outgroup. Conversely, feeling thermometers are valance-based, emotionally driven ratings that are void of tangible resources. Despite these differences, we suggest that feeling thermometers (like resource allocation matrices) can be meaningfully used to operationalize ingroup bias. With each participant having the capacity to display warmth (or lack thereof) toward both the ingroup and outgroup, specific combinations will reflect different affect-based attitudinal constellations that may reflect pure “ingroup love” in the absence of “outgroup hate,” for example, or a combination of both ingroup warmth and denial of warmth to the outgroup. Consequently, the present article uses feeling thermometers to investigate different “types” of bias in a novel way by using LPA to examine variability in the expression of ingroup/outgroup warmth across the population.
Brewer’s (2017) three-part typology of ingroup and outgroup evaluations provides some tentative expectations about the separate response patterns that might exist. To these ends, Brewer’s Type I (i.e., ingroup favoritism in the absence of outgroup hostility) would be reflected in ingroup warmth ratings that are higher than outgroup warmth ratings (without explicitly low outgroup warmth ratings)—a pattern henceforth termed ingroup biased. In contrast, Brewer’s Type II profile of outgroup derogation would be captured by low outgroup warmth, in the absence of high ingroup warmth, ratings—a pattern henceforth termed low warmth. Furthermore, Brewer’s Type III (i.e., ingroup favoritism and outgroup derogation) would be reflected in high ingroup warmth and low outgroup warmth ratings—a pattern henceforth termed ingroup favoritism/outgroup derogation. Finally, a fourth profile might exist, whereby warmth rating for the ingroup and outgroup are relatively equal and moderate (i.e., no bias).
In addition to predicting possible response patterns, we can investigate the attitudinal roots of these response patterns and likely differences between groups that show similar forms of bias. Specifically, it is possible to examine the predictors of membership into a group-based profile of interest relative to other profiles. This method also allows us to distinguish groups who may have similar patterns of ingroup bias (i.e., ingroup favoritism/outgroup derogation) but have different attitudinal motivations, which predict this bias. Given this form of bias likely is the most challenging to address, as it includes both ingroup- and outgroup-driven motivations, we focus on this example, by looking at how this effect could occur in majority and minority groups within society.
Social Dominance Orientation and Ethnic Identity Centrality
Although identifying the distinct response patterns underlying warmth ratings toward the ingroup and outgroup helps to estimate the prevalence of types of bias in the population, it is also important to examine the origins of these profiles. Social dominance orientation (SDO), the preference for group-based hierarchy and inequality in society (Pratto, Sidanius, Stallworth, & Malle, 1994), is one likely candidate. SDO is strongly associated with the endorsement of legitimizing myths that validate the current positions of the dominant and minority groups in society (Pratto, Sidanius, & Levin, 2006), and is motivated by competitiveness over relative group dominance, status, and power (Sibley & Duckitt, 2008), and correlates positively with ethnic prejudice toward minorities across the United States, Canada, Mexico, Israel, Taiwan, the People’s Republic of China, and New Zealand (see Pratto et al., 2006). SDO then centers on the belief of group-based hierarchy being natural and good. Within the dominant or majority group, this would provide ideological support for the current hierarchy within society. Consequently, there is conceptual overlap between the ingroup favoritism/outgroup derogation profile (high ingroup and low outgroup warmth) and a general preference for propping up the status quo and maintaining group-based hierarchies. There is, of course, an important qualifier here—such an explanation would only hold if one personally belongs to the dominant group, and, consequently, is invested in maintaining the existing hierarchy. Thus, we hypothesize that if a person belongs to the advantaged majority group, SDO may be a key factor that predicts membership in an ingroup favoritism/outgroup derogation profile. This same effect would likely not occur in minorities, as SDO would manifest in higher warmth toward the majority as the holders of power within society (Sidanius & Pratto, 1999).
To understand why members of disadvantaged ethnic groups may produce an ingroup favoritism/outgroup derogation response pattern, alternative explanations must be examined. We propose that one answer might lie in ethnic identification. Ethnic identity is the sense of belonging that derives from membership to an ethnic group, which subsequently informs the perceptions and behavior of an individual (Phinney, 1990). Ethnic identity is a central aspect of the self-concept and has been shown to be crucial in identity formation across multiple ethnicities, especially among minority groups within society (Phinney, 1992). As both a minority and an indigenous group, Māori tend to show higher levels of ethnic identification than Europeans (Barlow, Sibley, & Hornsey, 2012; Liu, McCreanor, McIntosh, & Teaiwa, 2005). This may, in part, be explained by the importance of whakapapa (genealogy) to Māori culture in solidifying connections with other people (Walker, 1990).
Although it is clear that ethnic identification should be associated with high ingroup warmth, it is less obvious that ethnic identity should simultaneously predict low outgroup warmth. We suggest, however, that when it comes to disadvantaged minority group members, this is often the case. In New Zealand, for example, a strong Māori identity is linked to pride about Māori culture, history, and achievements, but is also inseparable in many ways from recognizing intergroup conflict, colonization at the hands of the advantaged group, and ongoing disadvantage faced by the ingroup (Barlow et al., 2012). Indeed, Māori continue to experience racism within New Zealand society (Houkamau, Stronge, & Sibley, 2017; Sibley & Osborne, 2016). Persistent inequities mean that Māori still have to protest unequal treatment and unite to ensure the continued survival and support for Māori language and culture. Consequently, we suggest that, while the potent combination of ingroup favoritism and outgroup derogation may be driven by a desire for group-based dominance in the advantaged majority group, the same attitudinal combination is likely to be strongly linked to a cohesive, central ethnic identification for disadvantaged minority groups.
At an exploratory level, we also opted to investigate how personality might be associated with membership in different bias profiles. The five-factor model, the most common measure of personality, identifies five core personality traits: extraversion (i.e., outgoingness and gregariousness), agreeableness (i.e., friendliness and compassion), conscientiousness (i.e., efficiency and organization), neuroticism (i.e., sensitivity and nervousness), and openness to experience (inventiveness and curiousity; Ashton & Lee, 2007; Costa & McCrae, 1992; Sibley & Duckitt, 2008). Although we do not make firm a priori hypotheses about the associations between ingroup bias and specific personality traits, the existing literature reveals associations between generalized prejudice and personality. Specifically, agreeableness and openness to experience typically correlate negatively with prejudice (Sibley & Duckitt, 2008) and neuroticism correlates positively with conservatism (Sibley & Duckitt, 2008). It is possible then that those people who fall into the ingroup favoritism/outgroup derogation category might be lower in agreeableness and openness to experience, and higher in neuroticism, relative to those with other bias profiles.
The New Zealand Context
New Zealand is a relatively small, albeit diverse, nation of 4.5 million people. As a former British colony, 74% of the population identifies as European, whereas about 15% identify as Māori (indigenous New Zealanders; Statistics New Zealand, 2013). The Treaty of Waitangi, signed in 1840, solidified a relationship between Māori iwi (tribes) and the Crown, which ultimately resulted in British domination of New Zealand. Today, systemic inequalities persist among the two groups, with Māori earning an average of more than NZ$3 less than Europeans per hour, and having a shorter life expectancy (Ministry of Social Development, 2016). Claims for reparations to Māori are often strongly contested by Europeans (Sibley, Liu, Duckitt, & Khan, 2008; Sibley & Osborne, 2016).
The Current Study
We advance LPA as a method of better understanding ingroup bias by comparing the ingroup and outgroup warmth ratings of European (the dominant majority) and Māori (the indigenous minority) New Zealanders. We suspect there will be groups of people who show different forms of ingroup bias, based on Brewer’s (2017) typology. Given the primacy of ingroup favoritism (Type I or ingroup bias), we expect there to be a large proportion who show high warmth generally with a slight ingroup bias. We also anticipate a moderate- and low-warmth group. Finally, we expect there to be a group that matches Brewer’s Type III, or ingroup favoritism/outgroup derogation, profile who report high warmth toward the ingroup and low warmth toward the outgroup. We test potential predictors for belonging to the Type III profile alongside demographic and personality covariates.
Among Māori, we expect ethnic identity centrality to predict membership in the ingroup favoritism/outgroup derogation profile based on the context of colonization and the renaissance of Māori identity and culture, whereas SDO should be positively associated with belonging to the ingroup favoritism/outgroup derogation profile among Europeans to reinforce the current group-based hierarchy, which privileges Europeans in New Zealand. We also include right-wing authoritarianism (RWA) as a covariate, as it is a powerful predictor of prejudice and ethnocentrism (Sibley & Duckitt, 2008). We further included extraversion, agreeableness, conscientiousness, neuroticism, and openness to see how personality traits may potentially predict profile membership. Finally, we included additional demographic covariates including gender, age, deprivation level, religious affiliation, parental status, relationship status, employment status, urban/rural location, education, and socioeconomic status.
Method
Sampling Procedure
Data come from Time 5 (2013) of the New Zealand Attitudes and Values Study (NZAVS), which contained responses from 18,264 participants (10,502 retained from one or more previous waves, 7,581 new additions from booster sampling, and 181 unmatched participants or unsolicited opt-ins). We opted for this wave of the study given that it had the largest sample of Māori, allowing the greatest statistical power possible for this ethnic group. All analyses were rerun at a different time point to ensure the effects were robust (refer to the supplemental material for more information).
Participants
Analyses were limited to 13,647 New Zealand European and 2,289 Māori participants who completed warmth ratings toward their own and each other’s group. Europeans and Māori formed 75.7% and 12.7% of the total Time 5 NZAVS sample, respectively. These percentages closely match population estimates based on the 2013 census (i.e., 14.9% and 74%, respectively; Statistics New Zealand, 2013).
The mean age for Europeans was 48.61 years, 62% of whom identified as female (N = 8,458). Two thirds (66%,N = 9,006) lived in an urban setting, and 76% were currently employed, with an estimated median household income of NZ$90,000 (before taxes). In contrast, the mean age of Māori participants was 45.47 years, 67.3% of whom identified as female (N = 1,540). In addition, 57.6% (N = 1,319) lived in an urban setting, and 71.1% were currently employed, with an estimated median household income of NZ$75,000 (before taxes).
Materials
Data were drawn from the NZAVS Time 5 questionnaire. Short-form scales of all variables of interest were used due to space limitations in the questionnaire. Warmth toward Europeans and Māori was assessed using a feeling thermometer scale with scores ranging from 1 (least warm) to 7 (most warm). These warmth ratings were nested within a larger survey battery of ratings toward other ethnic groups and social categories.
Ethnic identity was measured using the 3-item ethnic identity centrality subscale developed by Leach and colleagues (2008). Participants rated their agreement with these statements on a 1 (strongly disagree) to 7 (strongly agree) scale: “I often think about the fact that I am a member of my ethnic group,” “The fact that I am a member of my ethnic group is an important part of my identity,” and “Being a member of my ethnic group is an important part of how I see myself” (α = .79).
SDO was measured using six items from Sidanius and Pratto (1999). Participants ranked their response to each item from 1 (strongly disagree) to 7 (strongly agree). Scale items included “It is OK if some groups have more of a chance in life than others,” “Inferior groups should stay in their place,” “To get ahead in life, it is sometimes okay to step on other groups,” “We should have increased social equality” (reverse scored), “It would be good if groups could be equal” (reverse scored), and “We should do what we can to equalize conditions for different groups” (reverse scored; α = .69).
RWA was assessed using six items from Altemeyer (1996). Participants ranked their response to each item from 1 (strongly disagree) to 7 (strongly agree; α = .69). Example items included “It is always better to trust the judgment of the proper authorities in government and religion than to listen to the noisy rabble-rousers in our society who are trying to create doubt in people’s minds” and “Some of the best people in our country are those who are challenging our government, criticizing religion, and ignoring the ‘normal way’ things are supposed to be done” (reverse coded).
Deprivation was assessed using the New Zealand Index of Deprivation (Atkinson, Salmond, & Crampton, 2014). The deprivation index uses aggregate census information about the residents of each meshblock to assign a decile-rank score ranging from 1 (most affluent) to 10 (most impoverished) to each meshblock unit. Religiosity was assessed using the following question: “Do you identify with a religion and/or spiritual group?” Similarly, participants were asked to disclose their relationship and parental status. Employment status was assessed using the question, “are you currently employed?” One item was used to assess educational attainment. This item had participants state their highest level of education, and was coded into a 10-level ordinal variable based on the New Zealand Qualifications Authority (2012). Participants’ residential addresses were coded into a dichotomous variable indicating either an urban or rural location. Socioeconomic status was operationalized using the New Zealand socioeconomic index (Fahy, Lee, & Milne, 2017).
Personality traits were assessed using the Mini-IPIP scales adapted by Sibley and Pirie (2013) to form the Mini-IPIP6. Questions were rated on a scale of 1 (strongly disagree) to 7 (strongly agree). Questions include the following: extraversion: “Am the life of the party” and “Don’t talk a lot” (reverse coded, α = .71); agreeableness: “Sympathize with others’ feelings” and “Am not really interested in others” (reverse coded, α = .66); conscientiousness: “Get chores done right away” and “Often forget to put things back in their proper place” (reverse coded, α = .65); neuroticism: “Have frequent mood swings” and “Seldom feel blue” (reverse coded, α = .64); openness to experience: “Have a vivid imagination” and “Am not interested in abstract ideas” (reverse coded, α = .67).
Results
Model Estimation
We performed an LPA using Mplus 8.0 (Muthén & Muthén, 1998-2017) to investigate the distinct response patterns underlying measures of warmth toward Māori and Europeans. Gender, age, ethnic identity, SDO, RWA, deprivation, religiosity, relationship status, parental status, employment status, educational attainment, urban or rural living, socioeconomic status, extraversion, agreeableness, conscientiousness, neuroticism, and openness to experience were included as predictors of profile membership using the three-step estimation approach. This allowed us to estimate the relationships these correlates had on the likelihood of belonging to the ingroup bias response profile (using multinomial regression). Because we used a three-step approach, our covariates did not influence the estimation of the latent profiles.
Inspections of Tables 1 and 2 reveal a positive zero-order correlation between warmth toward Māori and warmth toward Europeans (r = .45, p < .001) among Māori participants. Likewise, warmth toward Māori and warmth toward Europeans (r = .42, p < .001) correlated positively for Europeans.
Correlation Matrix for Europeans for Variables of Interest.
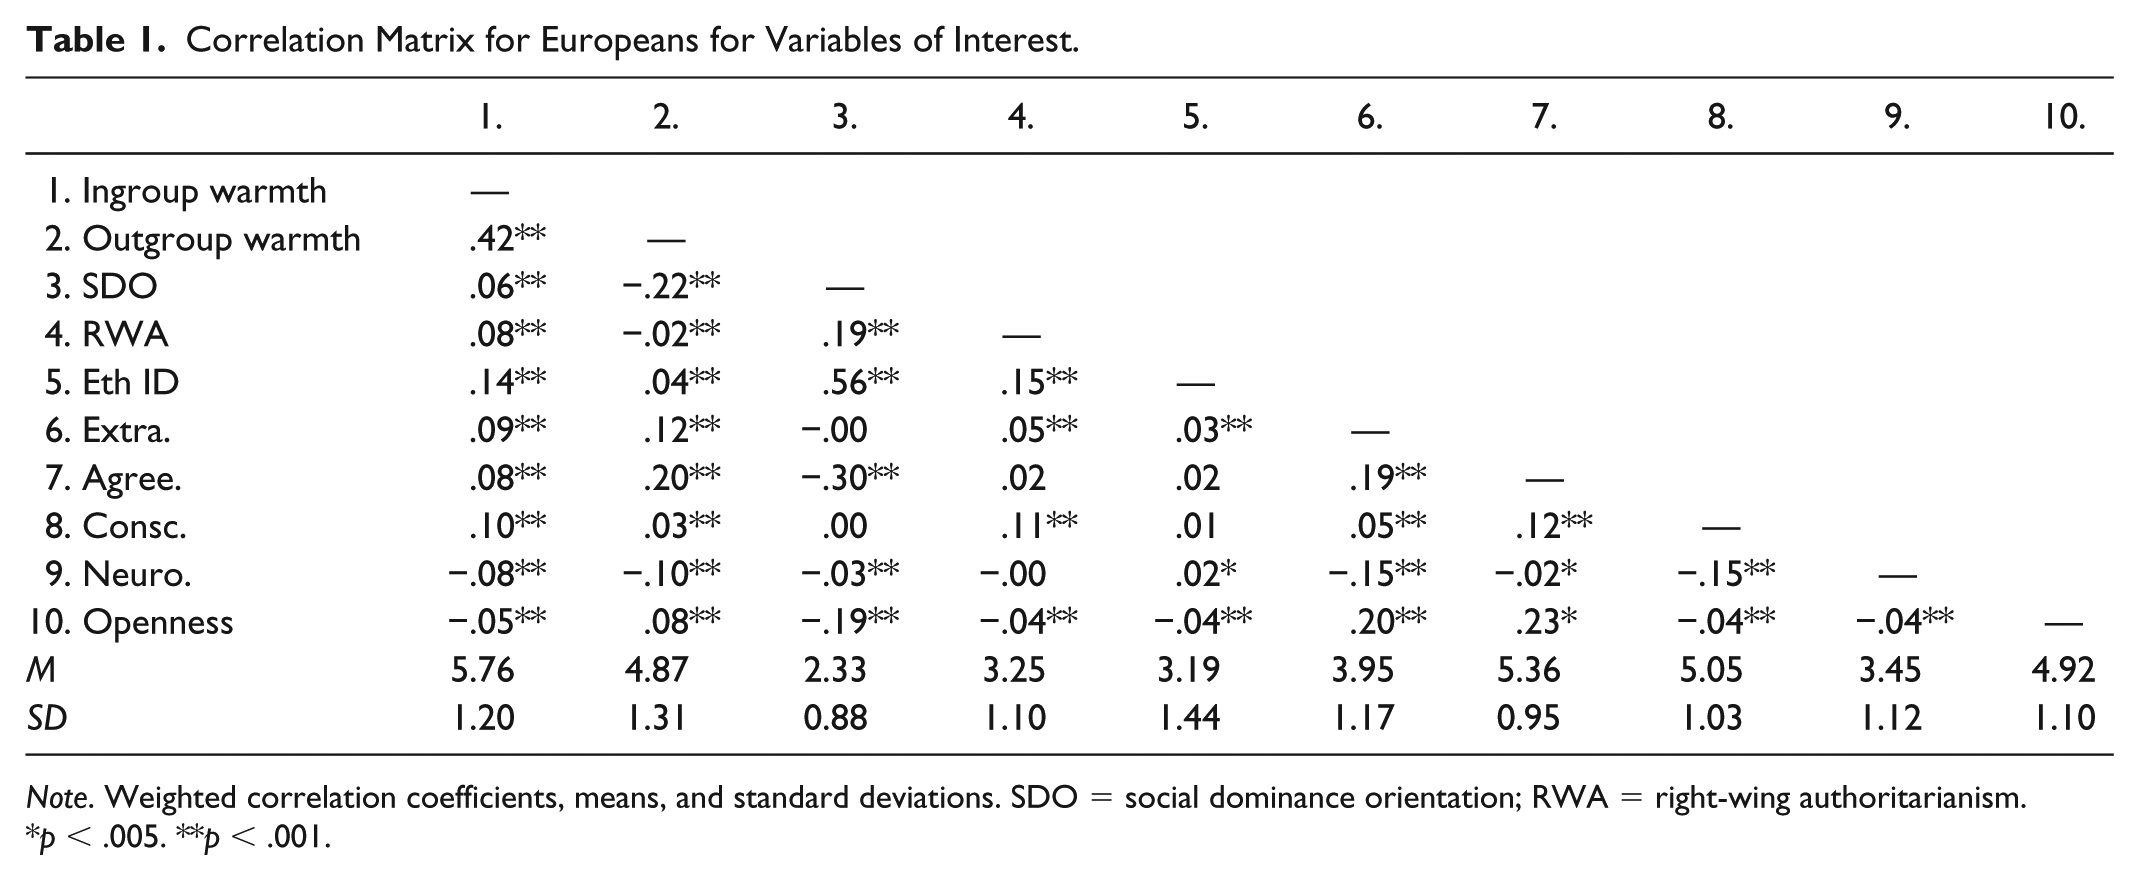
Note. Weighted correlation coefficients, means, and standard deviations. SDO = social dominance orientation; RWA = right-wing authoritarianism.
p < .005. **p < .001.
Correlation Matrix for Māori for Variables of Interest.

Note. Weighted correlation coefficients, means, and standard deviations. SDO = social dominance orientation; RWA = right-wing authoritarianism.
p < .005. **p < .001.
Model Selection
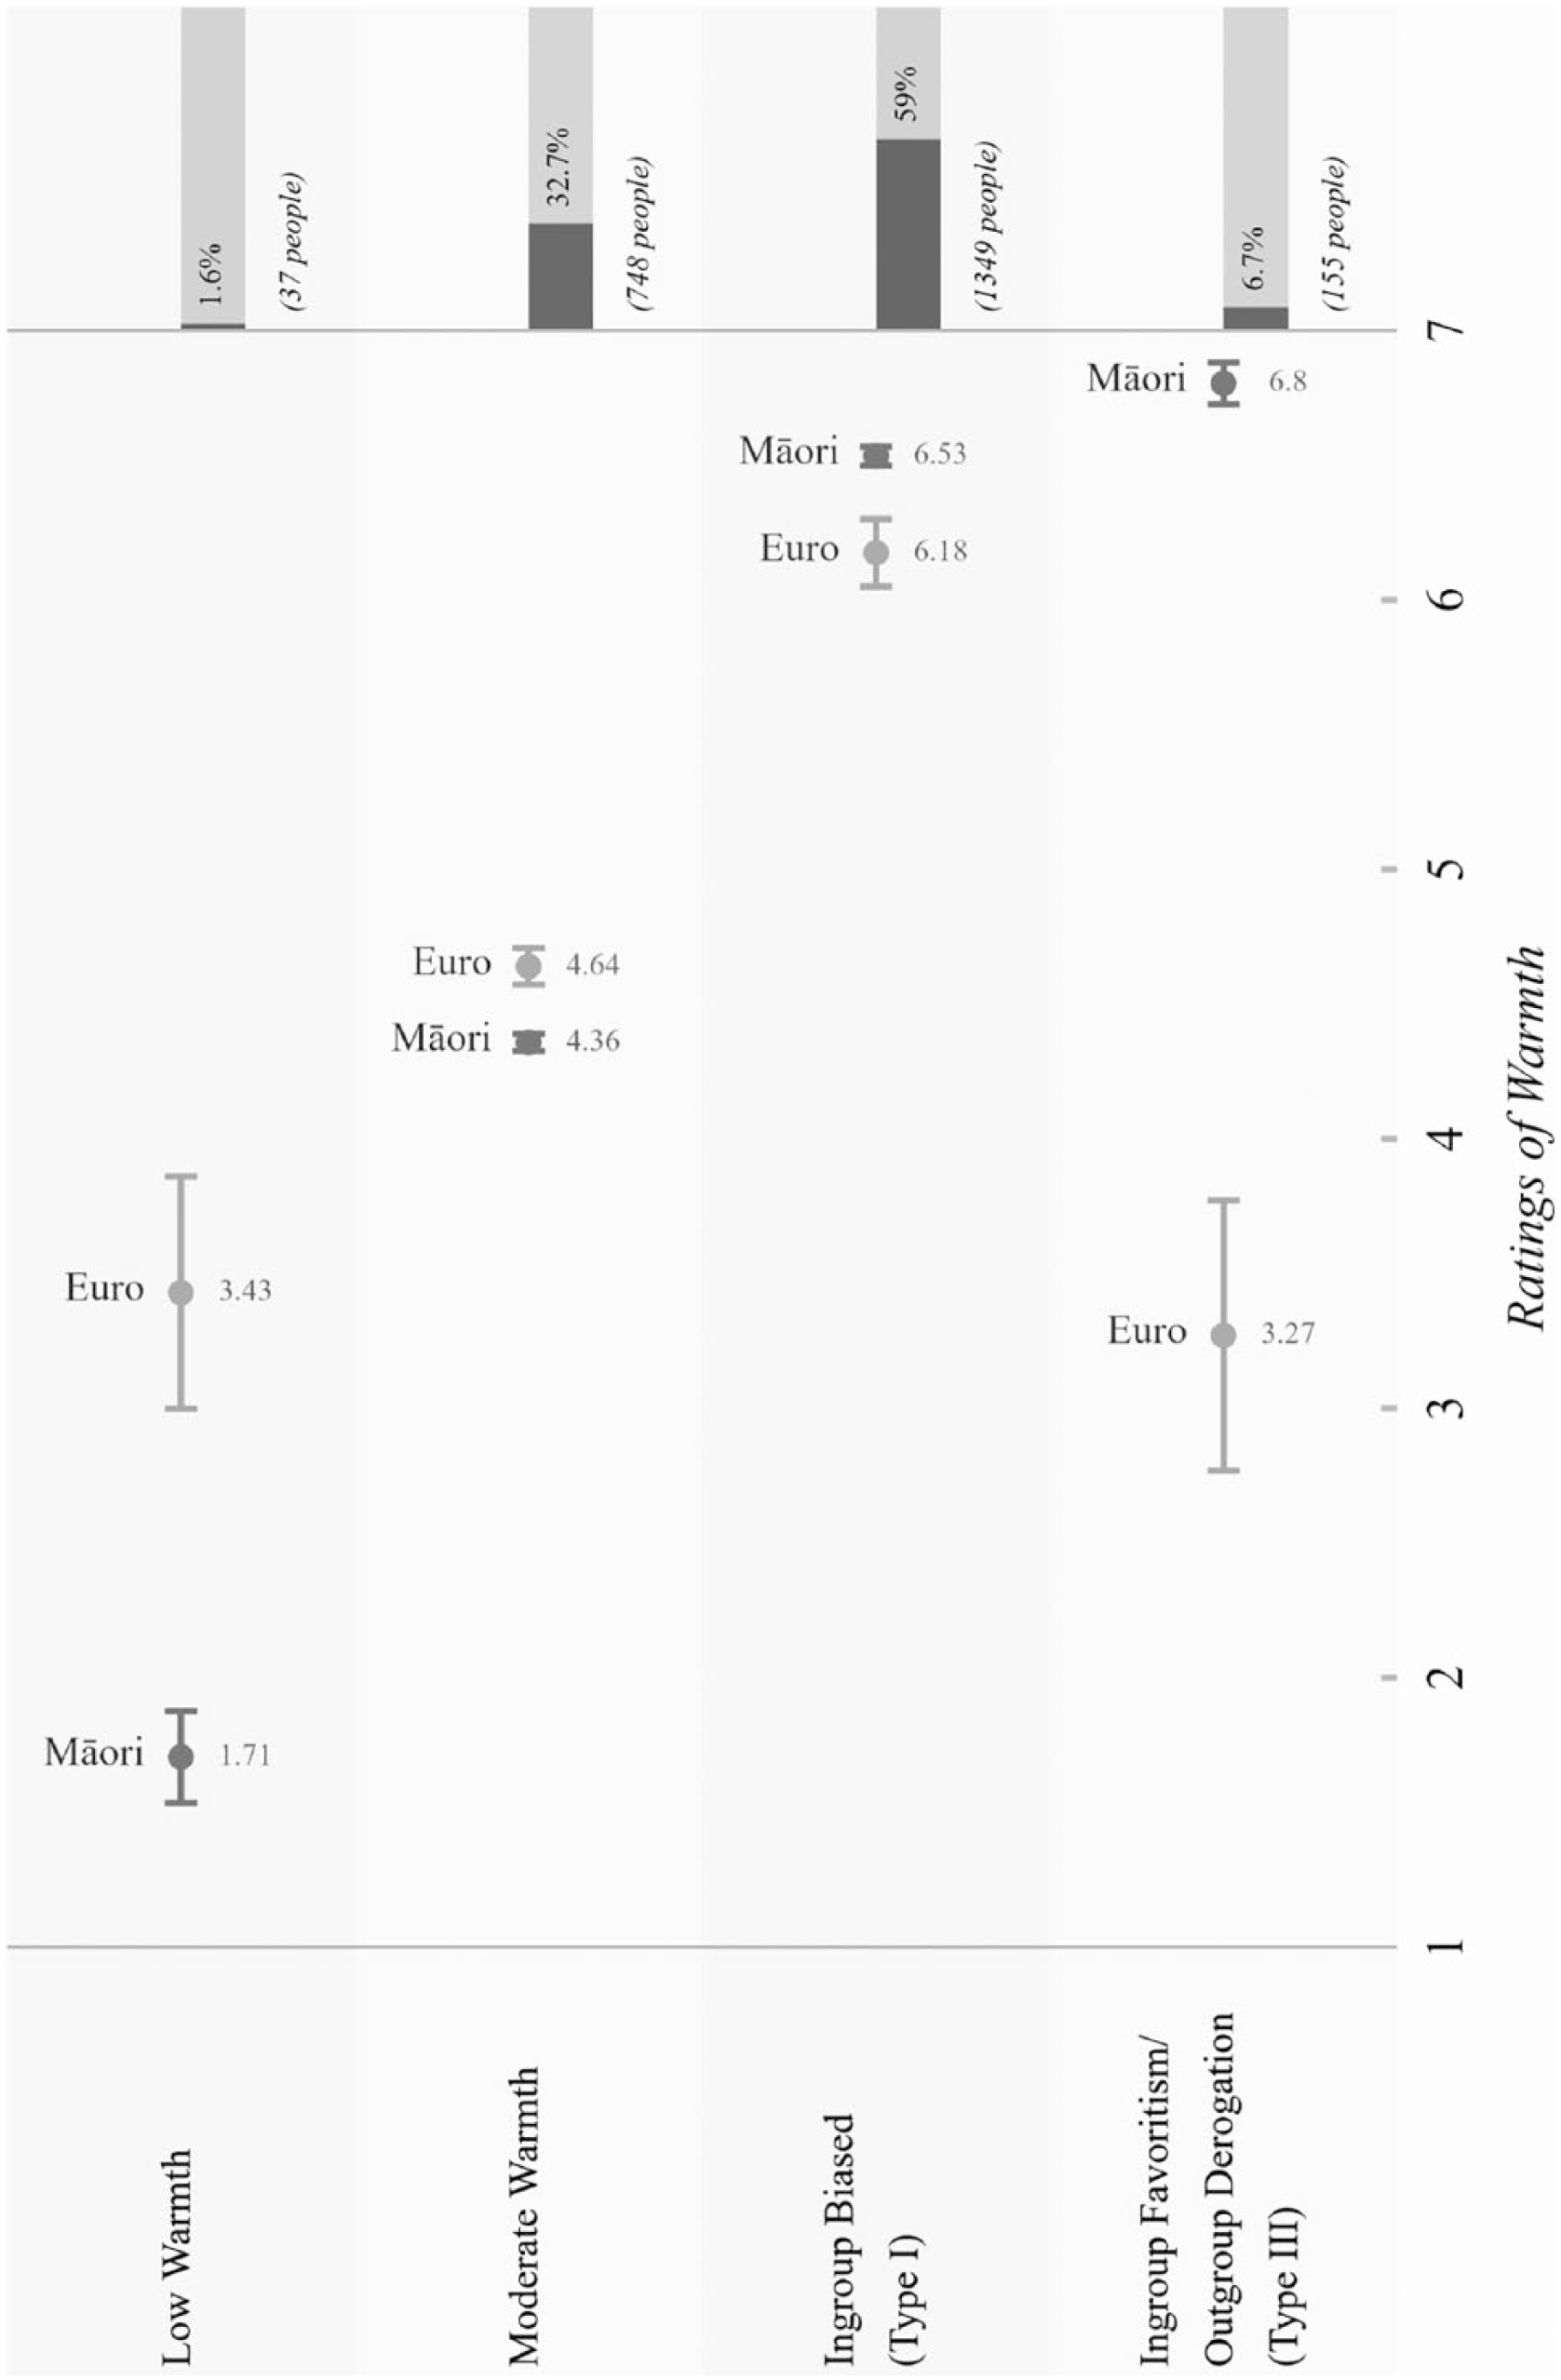
We considered solutions that ranged from two to seven profiles, given that we hypothesized at least three profiles. We opted for a four-profile model as our preferred solution for both ethnicities. This was based on Nylund and colleagues’ (2007) recommendations of using entropy, the Bayesian information criterion (BIC), and the Akaike information criterion (AIC) to inform the number of profiles. Moreover, this four-profile model balances model fit with model parsimony, showing an overall ingroup bias group, moderate-warmth group, and low-warmth group, as well as one group which demonstrates ingroup favoritism/outgroup derogation (see Figures 1 and 2). The estimation of additional profiles only separates these groups into finer distinctions (e.g., moderate vs. moderately high), without revealing a substantively distinct response pattern.

Mean ratings of warmth toward both ethnicities by Europeans for the four profiles identified by LPA.
Mean ratings of warmth toward both ethnicities by Māori for the four profiles identified by LPA.
Additional support for our four-profile solution is provided by the Vuong–Lo–Mendell–Rubin likelihood ratio test (LRT). Specifically, the LRT indicated that a four-profile solution performed significantly better than a three-profile solution (LRT = 297.136, p = .0465). However, the adjusted LRT was only marginally significant (adjusted LRT= 284.882, p = .0516). Nevertheless, we opted for a four-profile solution due to the high entropy and parsimony, and given that the adjusted LRT approached significance. Moreover, the LRT for Europeans indicated that a four-profile solution performed significantly better than a three-profile solution (LRT = 1,639.002, p < .001; adjusted LRT = 1,583.563, p < .001).
The preferred four-profile models for both Europeans and Māori had excellent fit, with entropy = .911 and entropy = .902, respectively. Entropy values range from 0 to 1.0, where a high value indicates a lower classification error. An entropy value of close to 1.0 (and typically above .70-.80) indicates less average error in the assignment of participants to profile membership (i.e., individuals are more likely to belong to the category in which they have been placed; for discussion). Entropy, alongside the BIC, and the AIC for different solutions are included in Table 3. The probability (averaged across participants) that a participant belonged to a given profile for our preferred four-profile solution ranged from .93 to .99 for Europeans and .73 to .98 for Māori. These values indicate that there was only a small average likelihood of misclassification. Table 4 displays the full classification likelihoods for the four profiles.
Model Fit for the Different Profile Solutions of the Latent Profile Analysis for Māori and Europeans.

Note. BIC = Bayesian information criterion; AIC = Akaike information criterion.
We expect these models were overextracting classes, as the standard errors for the means of some classes could not be estimated, hence the high entropy values.
Average Latent Profile Probabilities for Most Likely Latent Profile Membership (Row) by Latent Profile (Column) for Māori and Europeans.
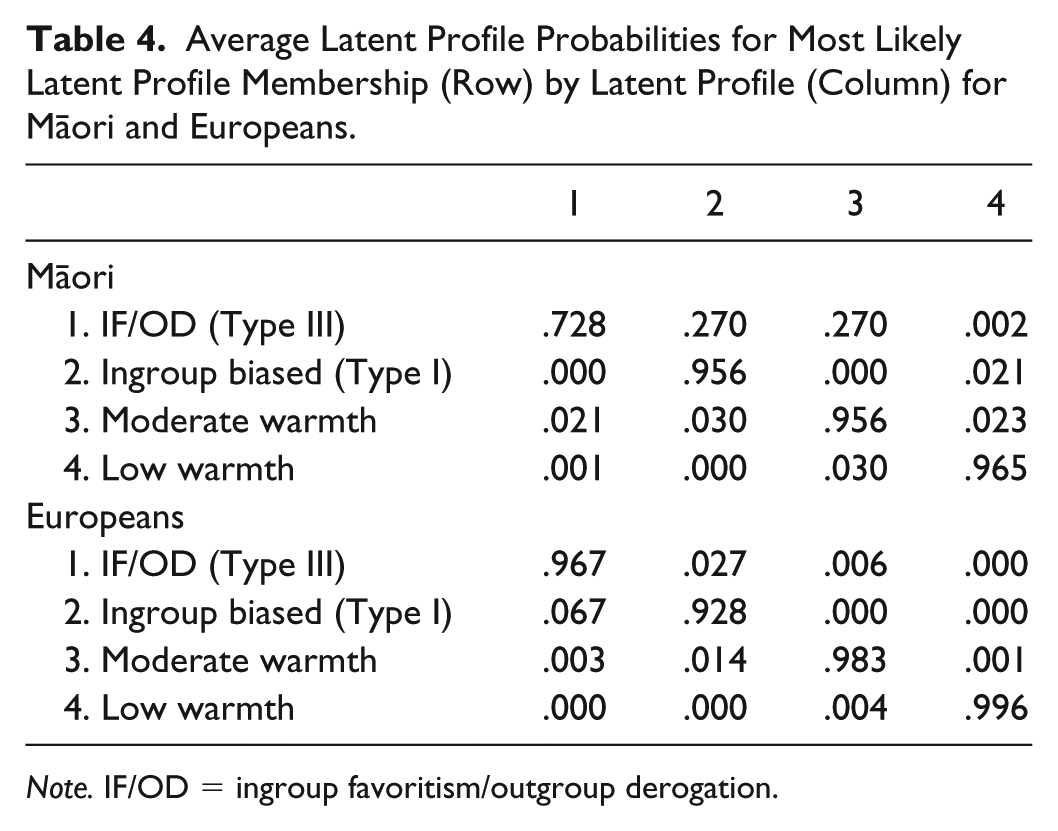
Note. IF/OD = ingroup favoritism/outgroup derogation.
Profiles
Estimated mean levels of warmth toward Māori and Europeans for each of the four profiles among Europeans are presented in Figure 1. The preferred solution identified three profiles where people report similar levels of warmth for both Māori and Europeans. This included a low-warmth profile (0.7%), a moderate-warmth profile (34.9%), and an ingroup biased profile (54.1%). However, the ingroup biased profile revealed higher warmth toward ingroup than outgroup. We also identified a clear profile of Europeans who expressed the least warmth toward Māori, but the most warmth toward Europeans. Our weighted sample estimate indicated that this profile represented 10.3% of Europeans. Given this profile’s clear ingroup preference, we labeled this profile ingroup favoritism/outgroup derogation.
Estimated mean levels of warmth toward Māori and Europeans for each of the four bias profiles among Māori are presented in Figure 2. The preferred solution identified three profiles where participants reported similar levels of warmth for both Māori and Europeans. These were labeled as a low-warmth profile (1.6%), a moderate-warmth profile (32.7%), and an ingroup favoritism/outgroup derogation profile (58.9%). We also identified a clear profile of Māori who expressed the least warmth toward Māori, but most warmth toward Europeans. Our weighted sample estimate indicated that this profile represented 6.7% of Māori. We labeled this profile ingroup favoritism/outgroup derogation.
These results suggest there are parallels between the bias profiles for Māori and Europeans. Both ethnicities had four bias profiles as the preferred solution. Moreover, both ethnicities had an ingroup biased profile that was well more than half of the entire ethnic group. Among both ethnicities, this profile showed a bias toward the ingroup. Equally, there were moderate-warmth profiles that made up roughly one third of the population in which there was much less bias toward the ingroup. Likewise, there was a small segment of Māori (1.6%) and Europeans (0.7%) who had a slight tendency to favor the outgroup in their warmth ratings. Notably, the ingroup favoritism/outgroup derogation group made up nearly 5% more of the population of Māori than it did of Europeans, whereas the ingroup favoritism/outgroup derogation profile constituted more than 10% of Europeans, but only 6.7% of Māori.
Demographic Differences
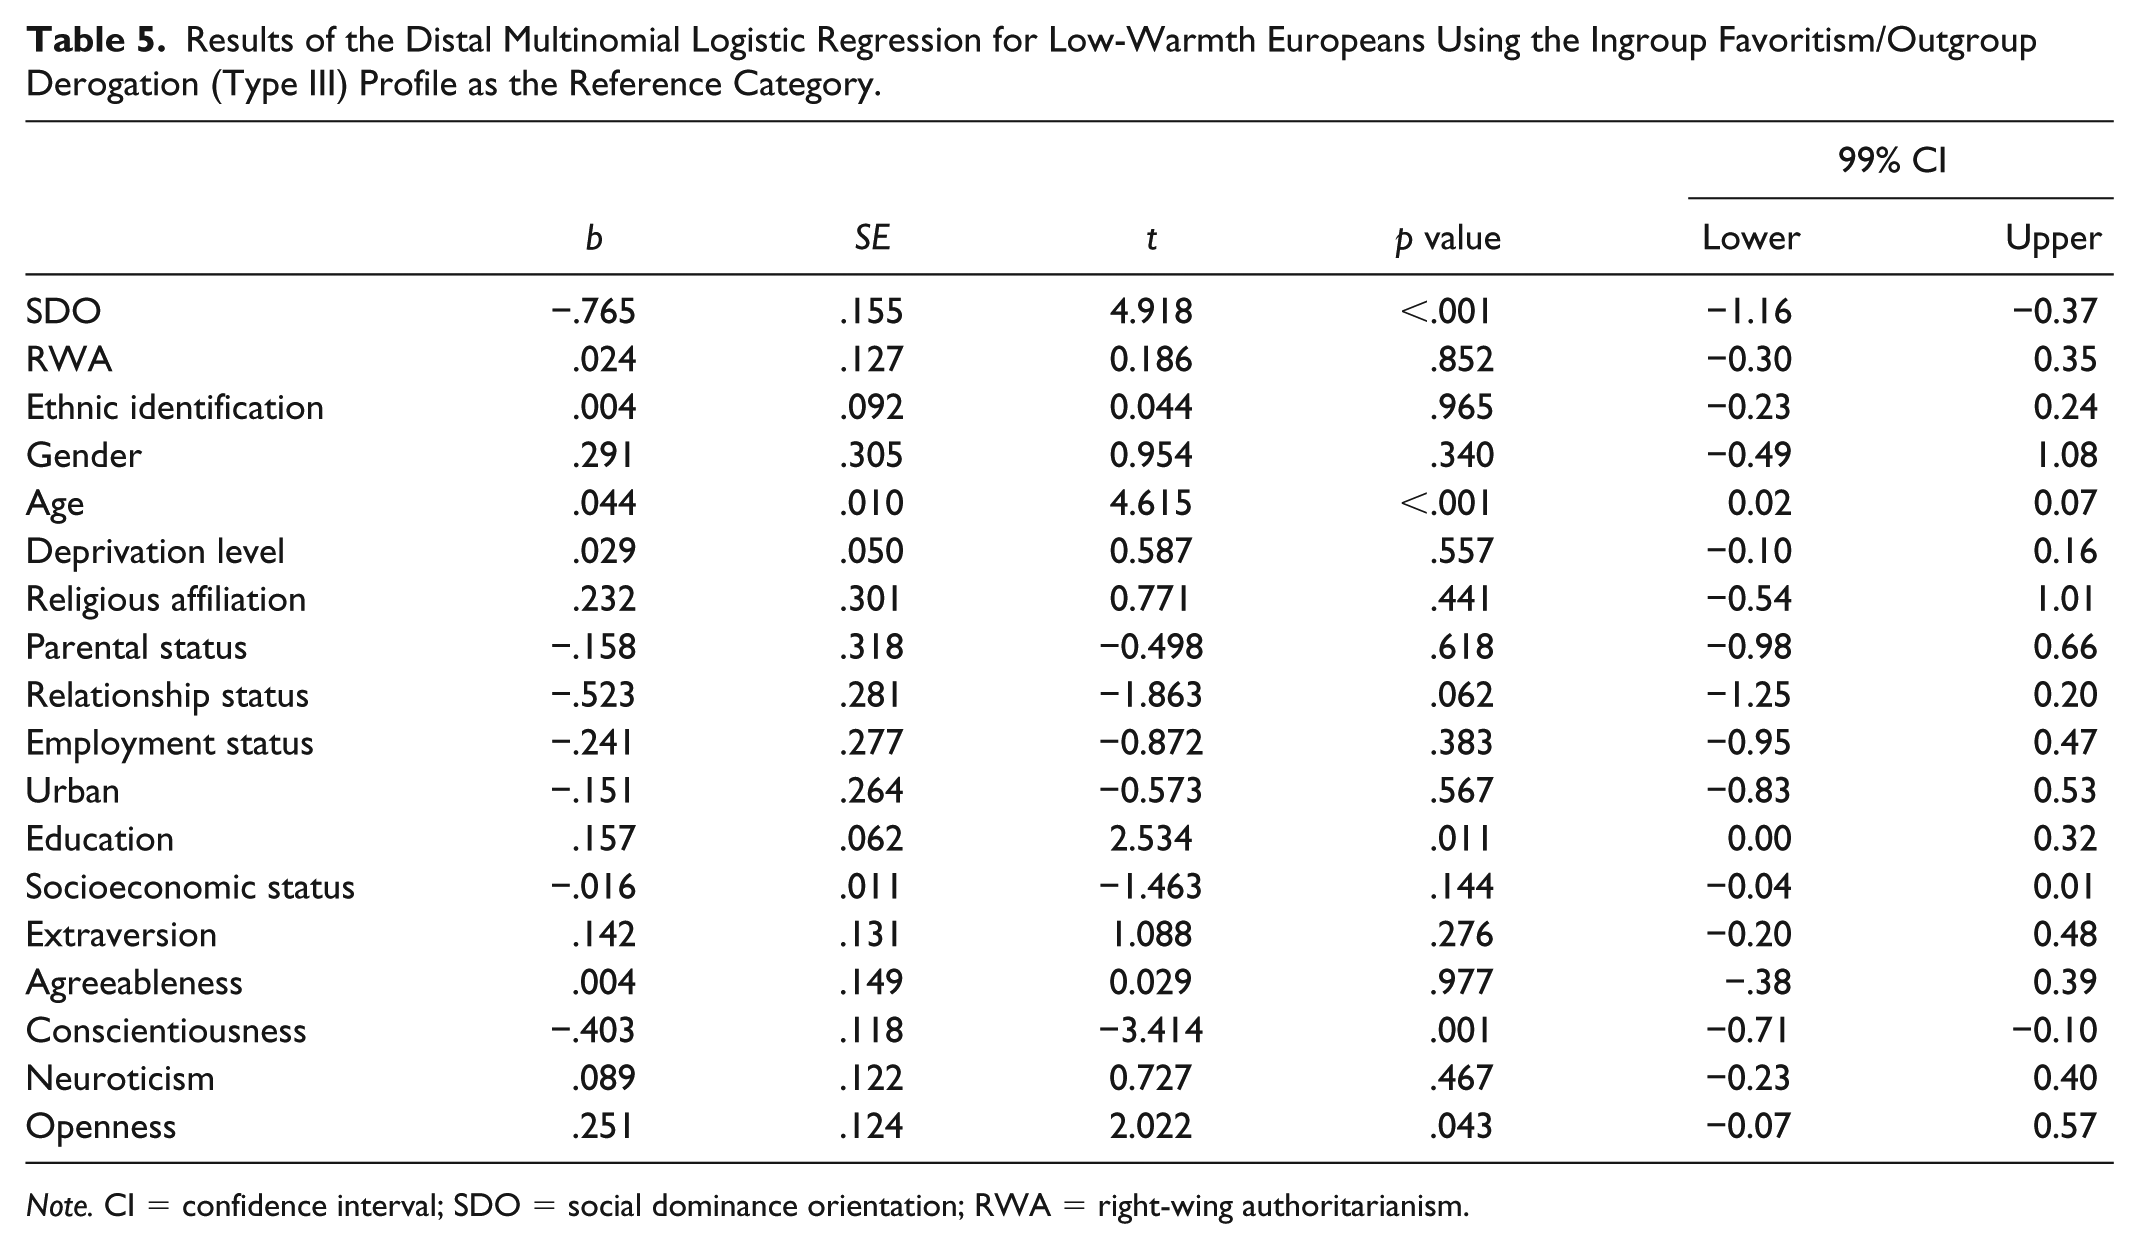
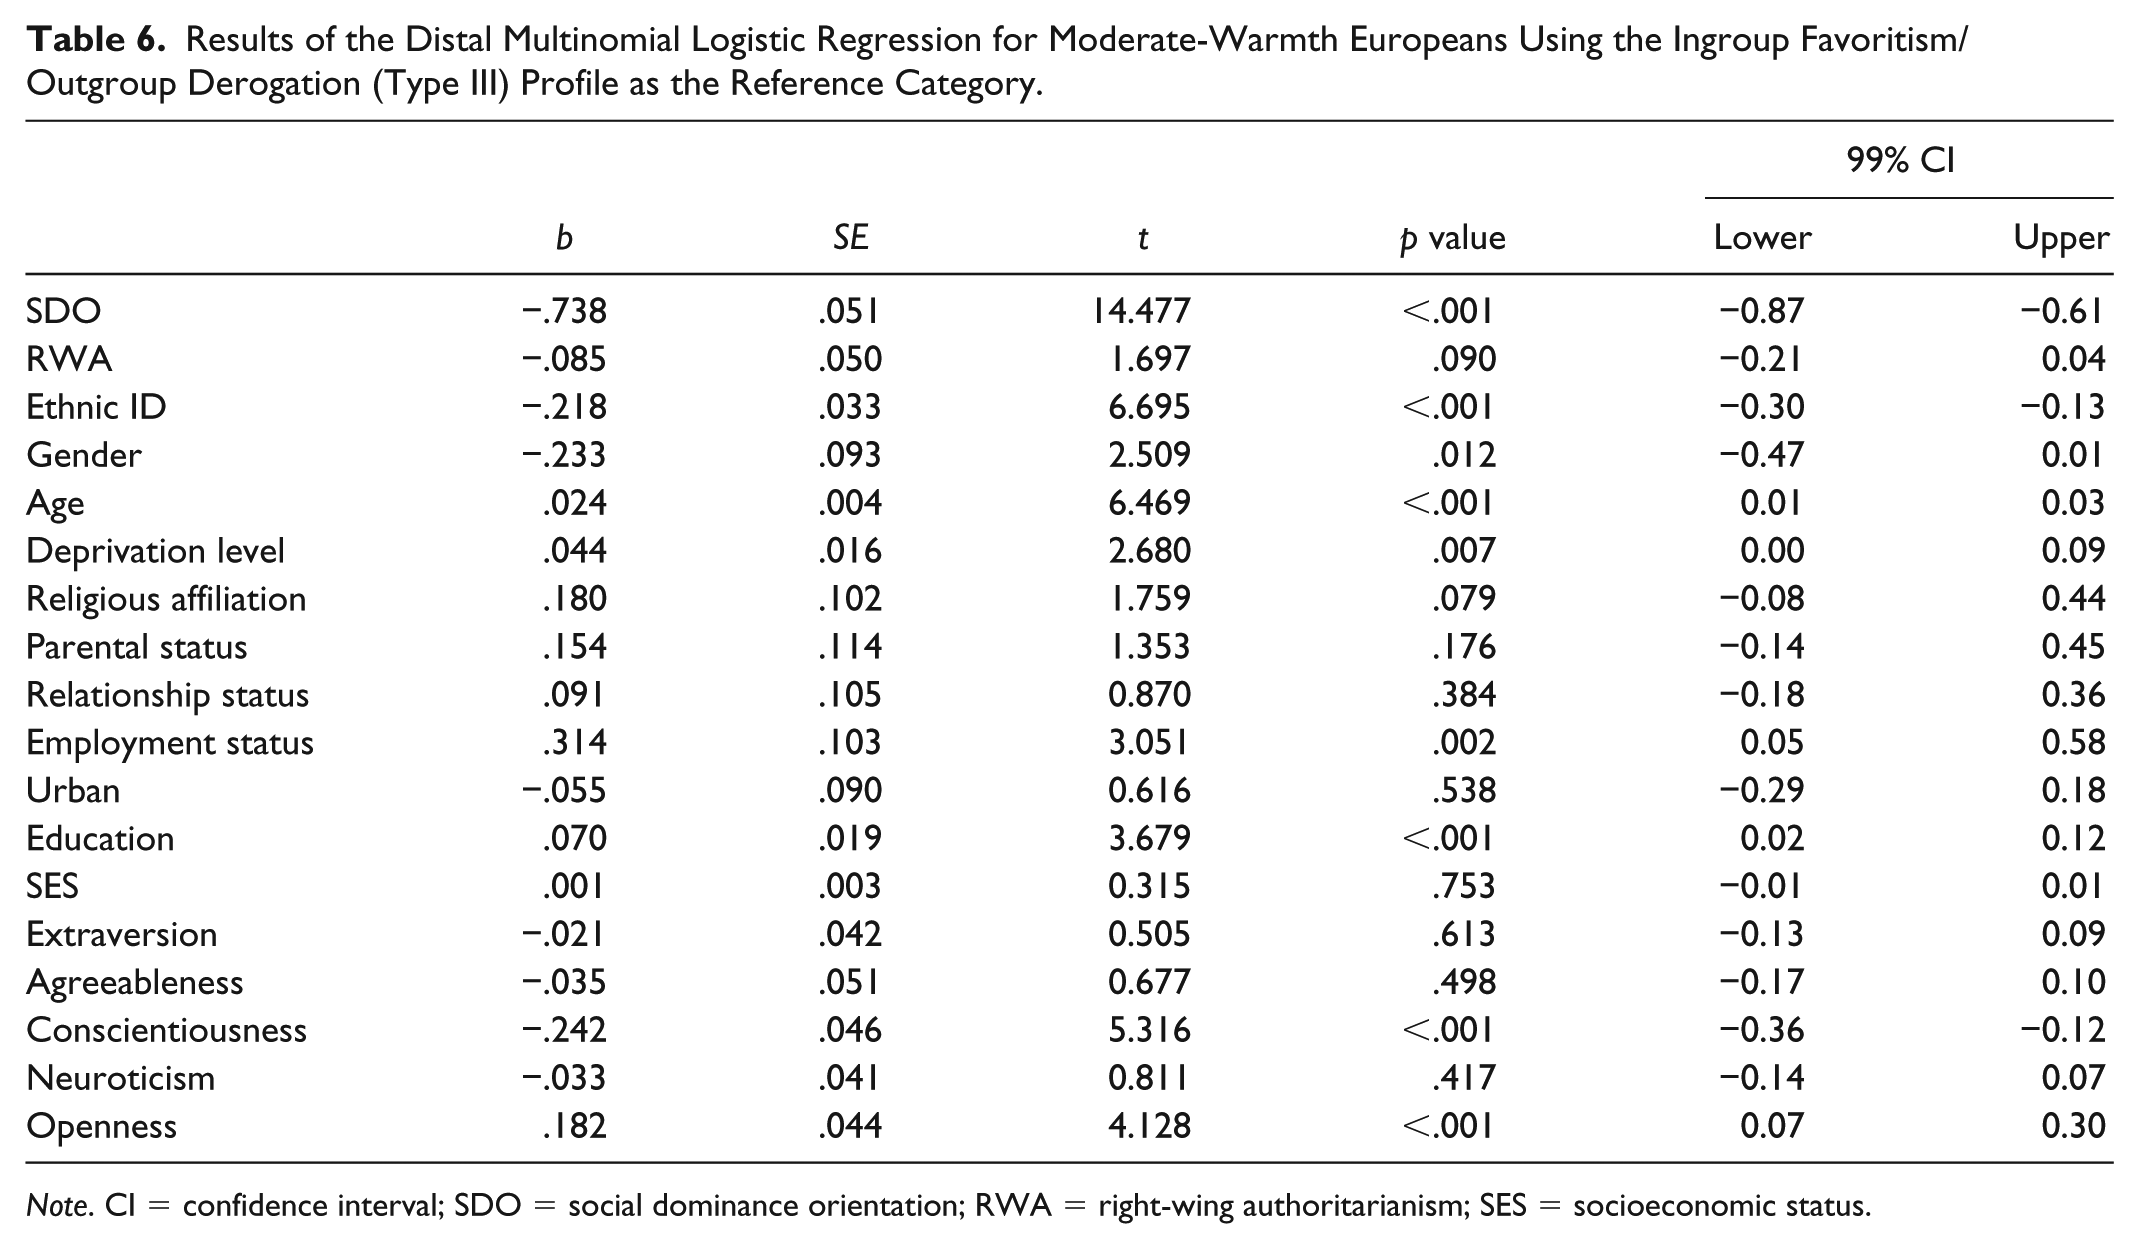
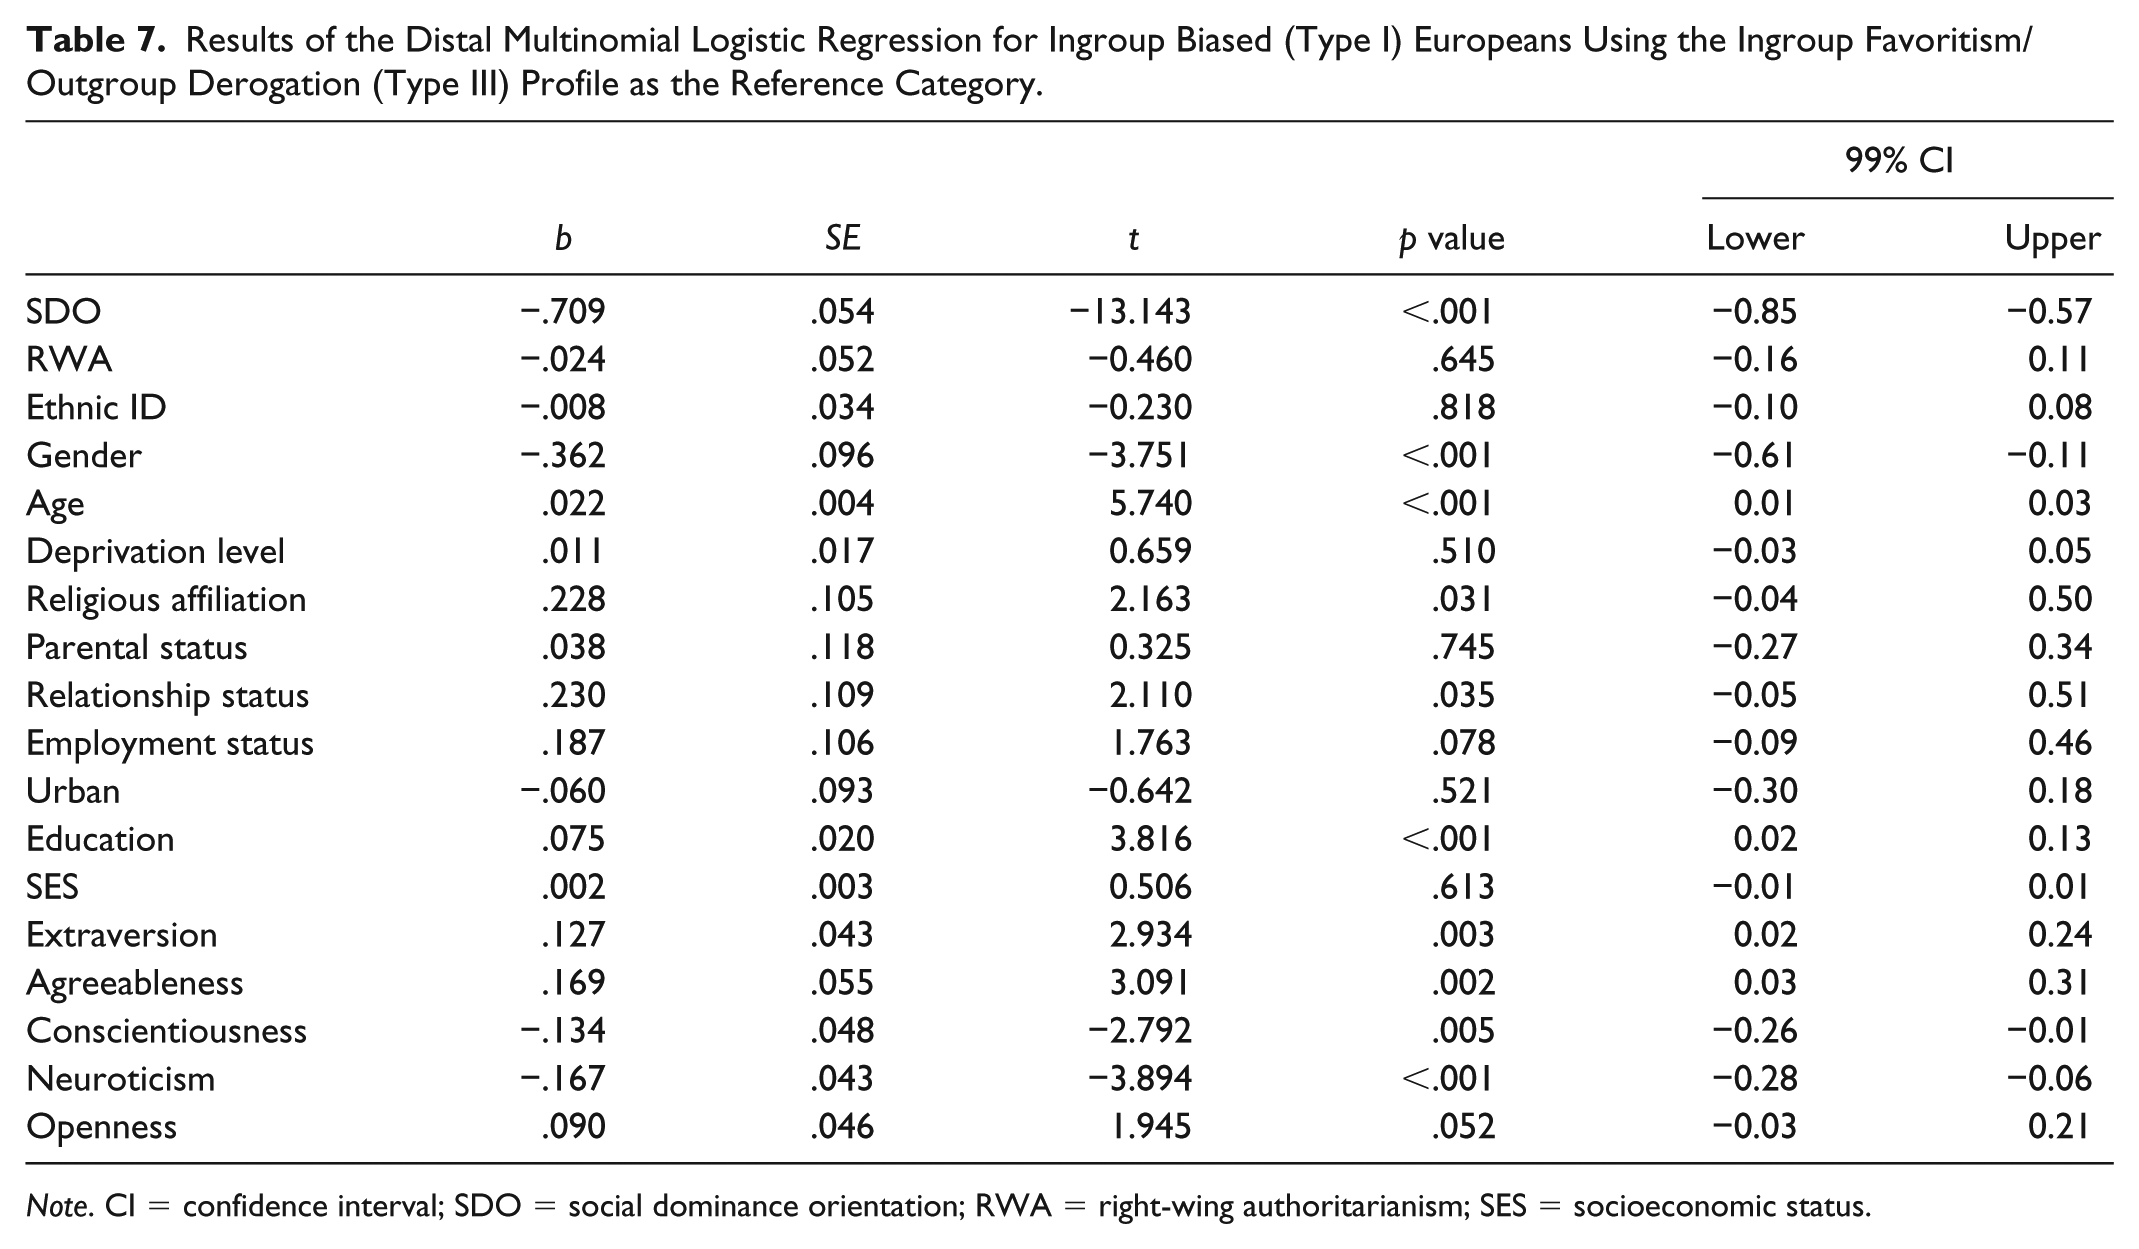
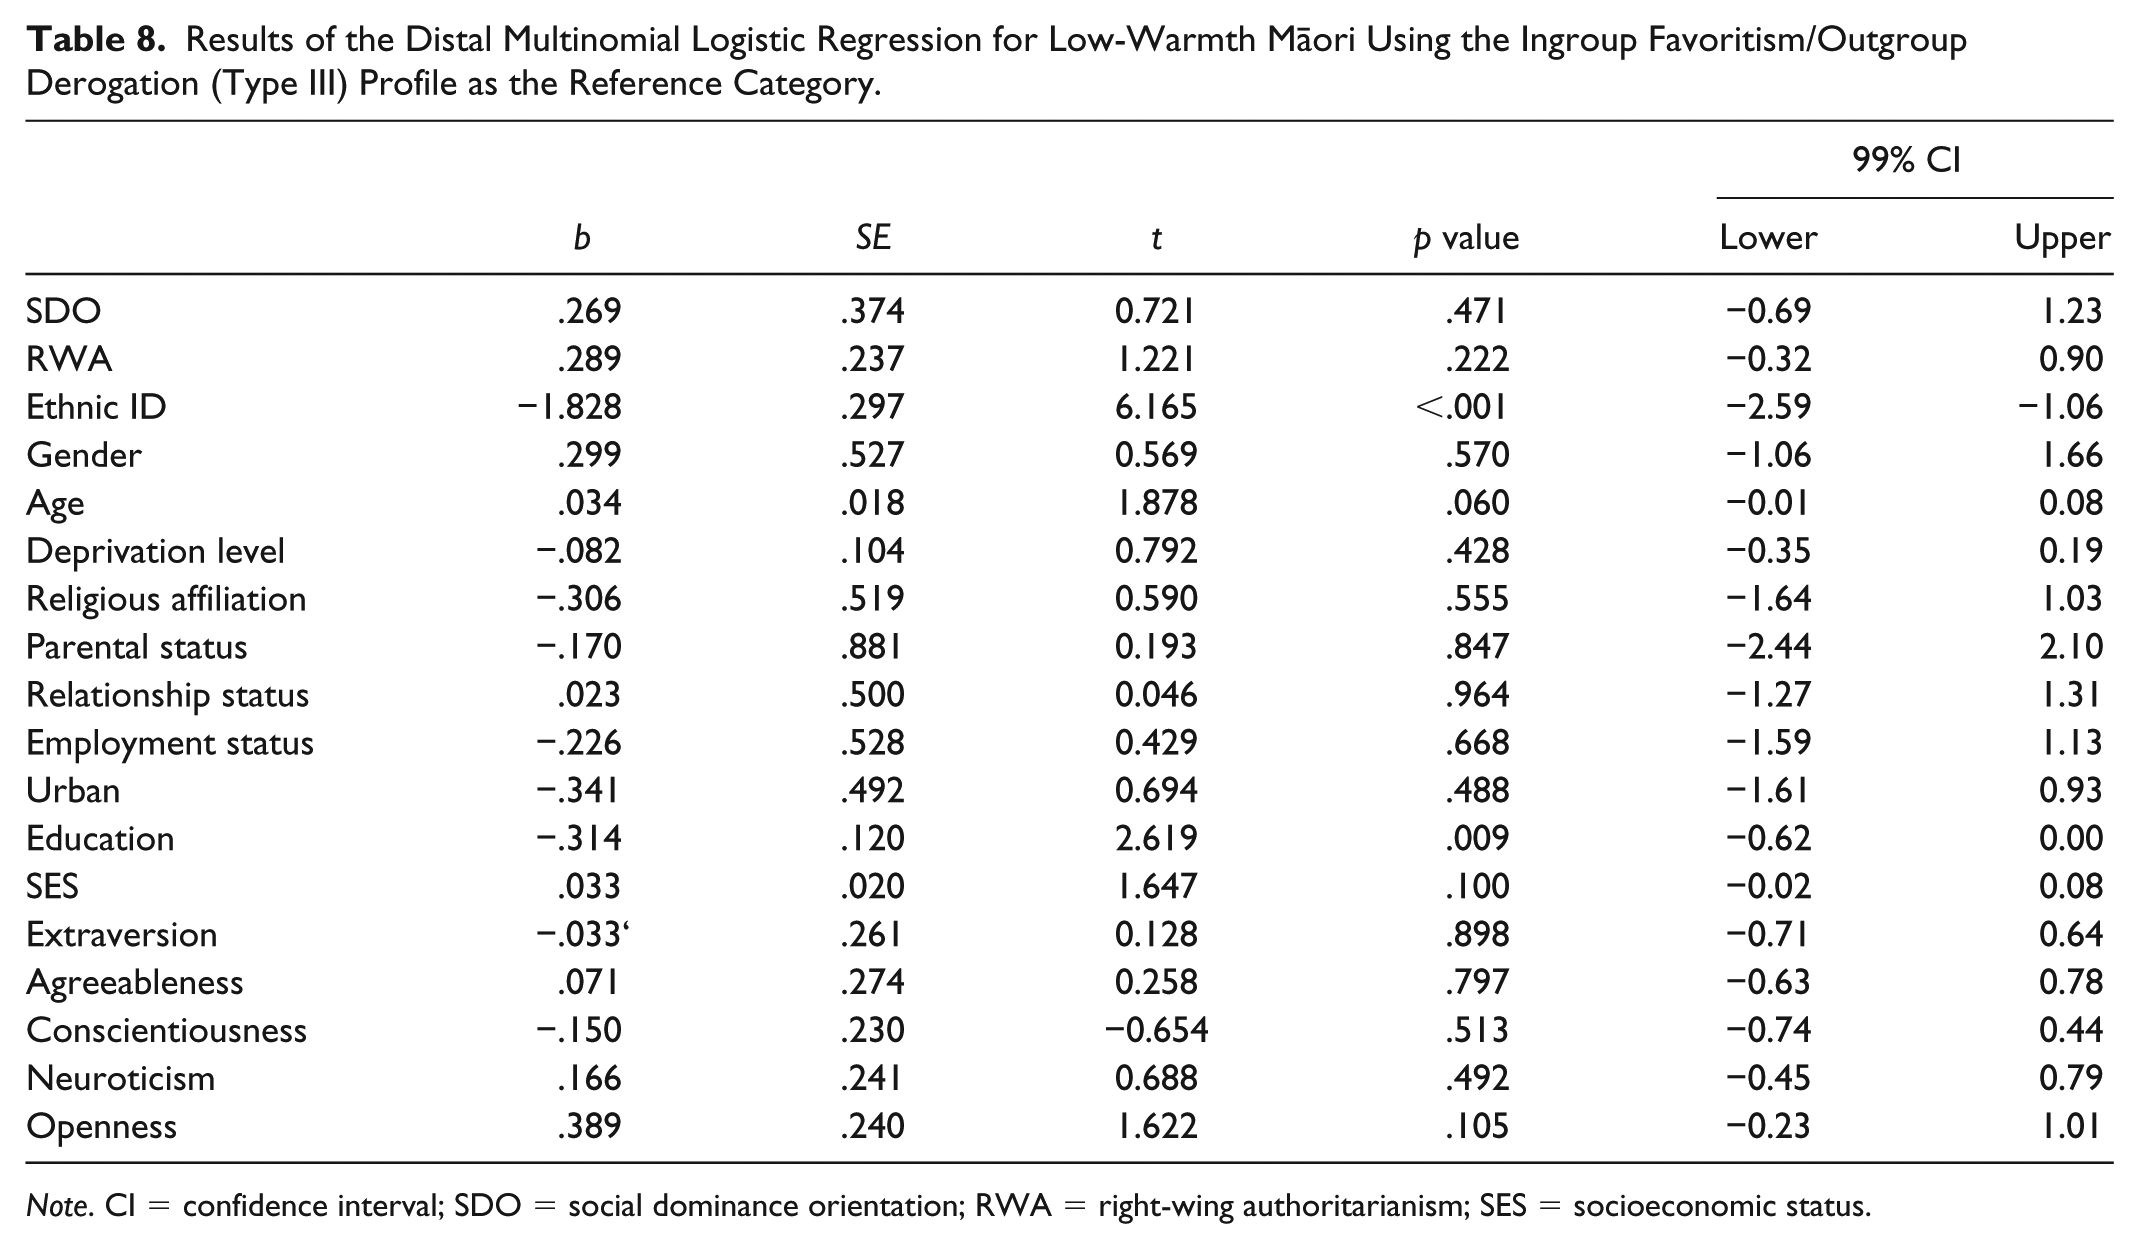
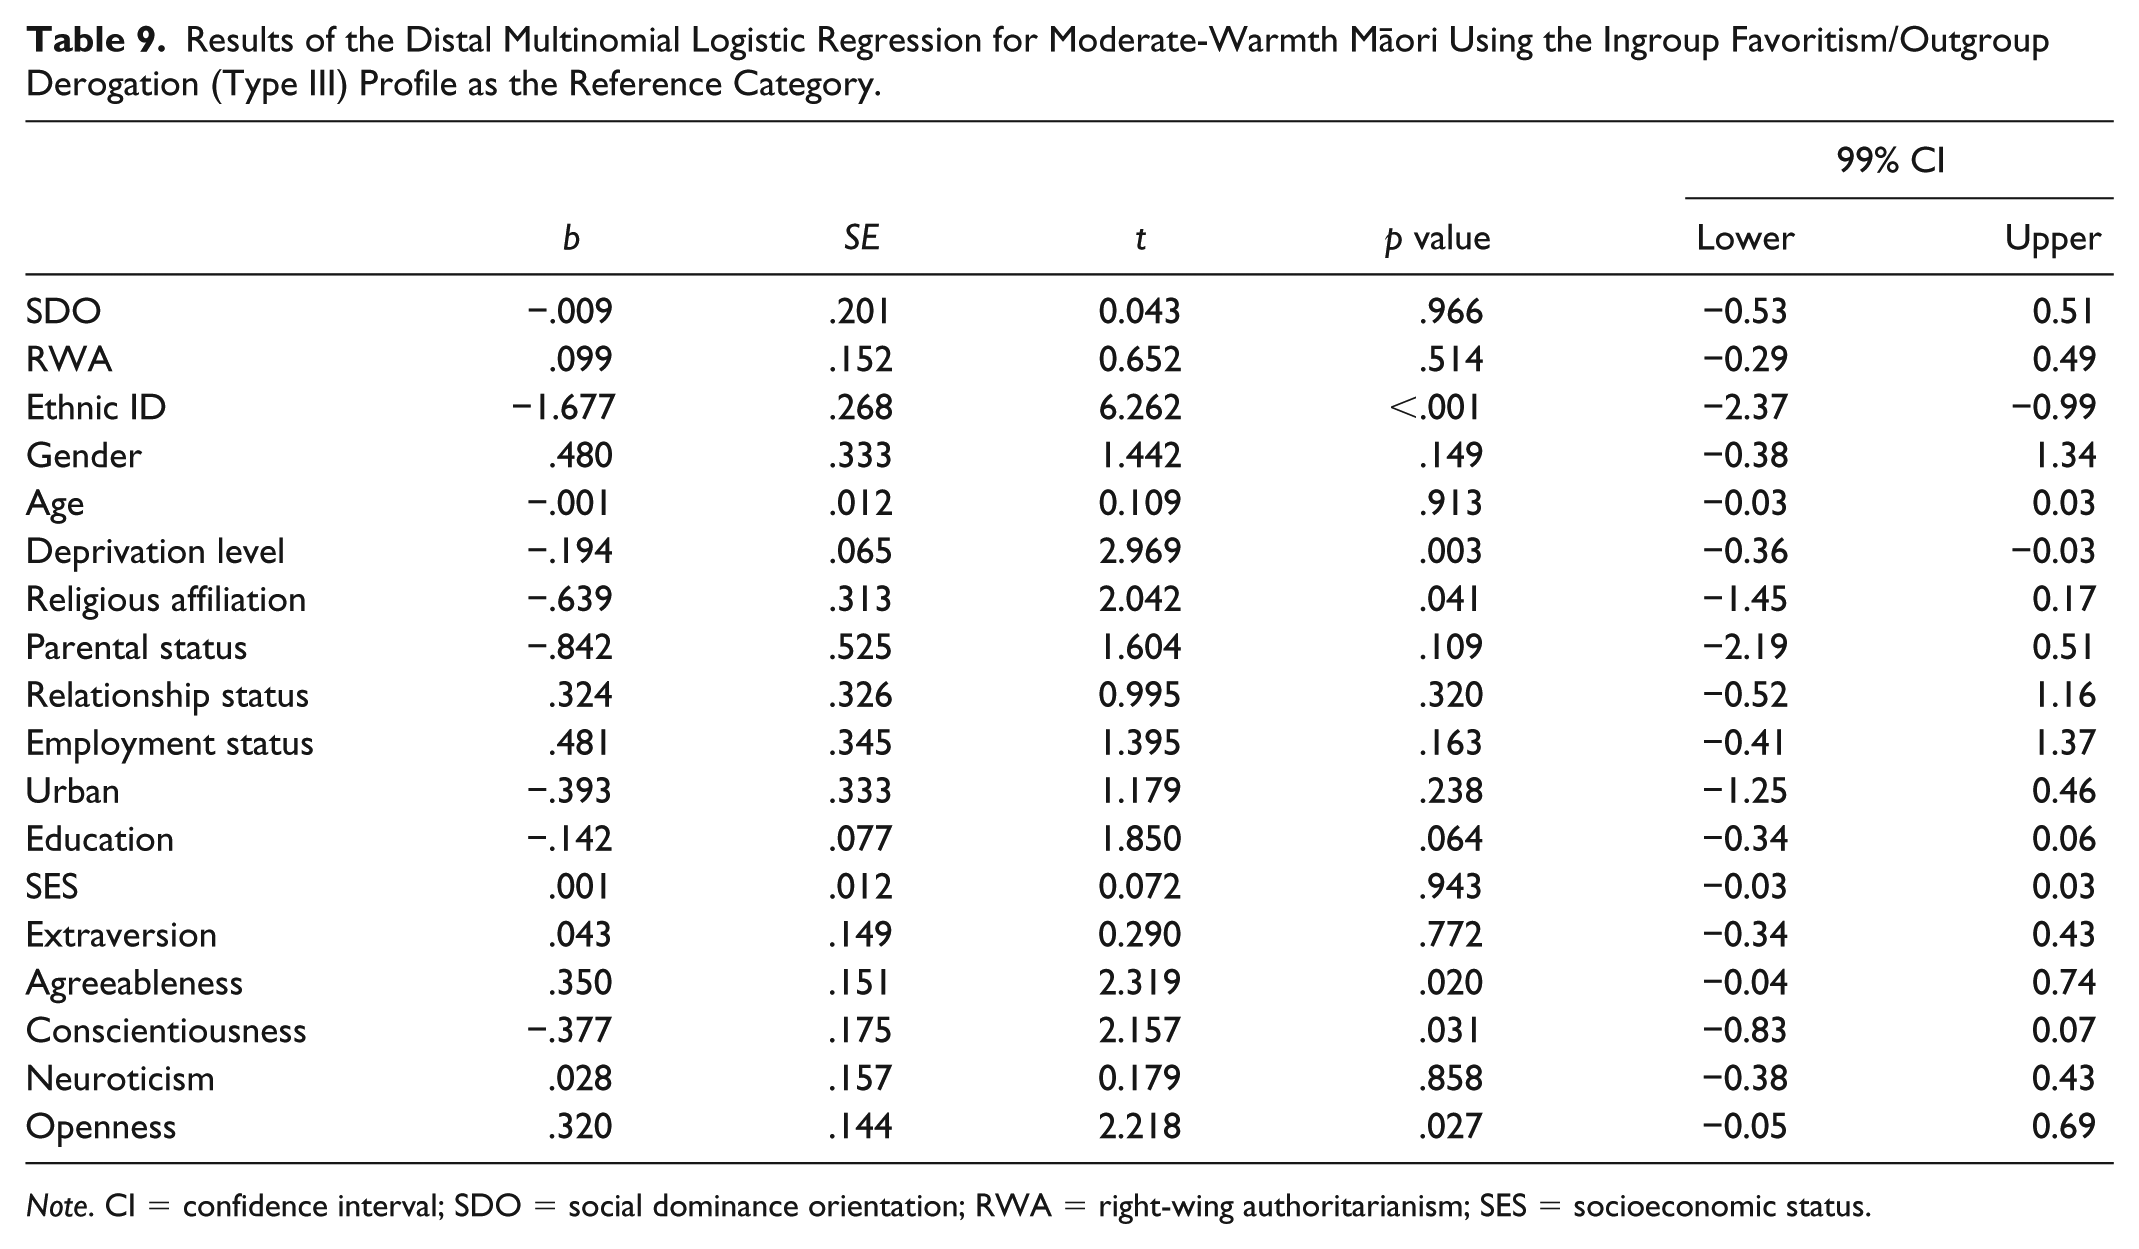
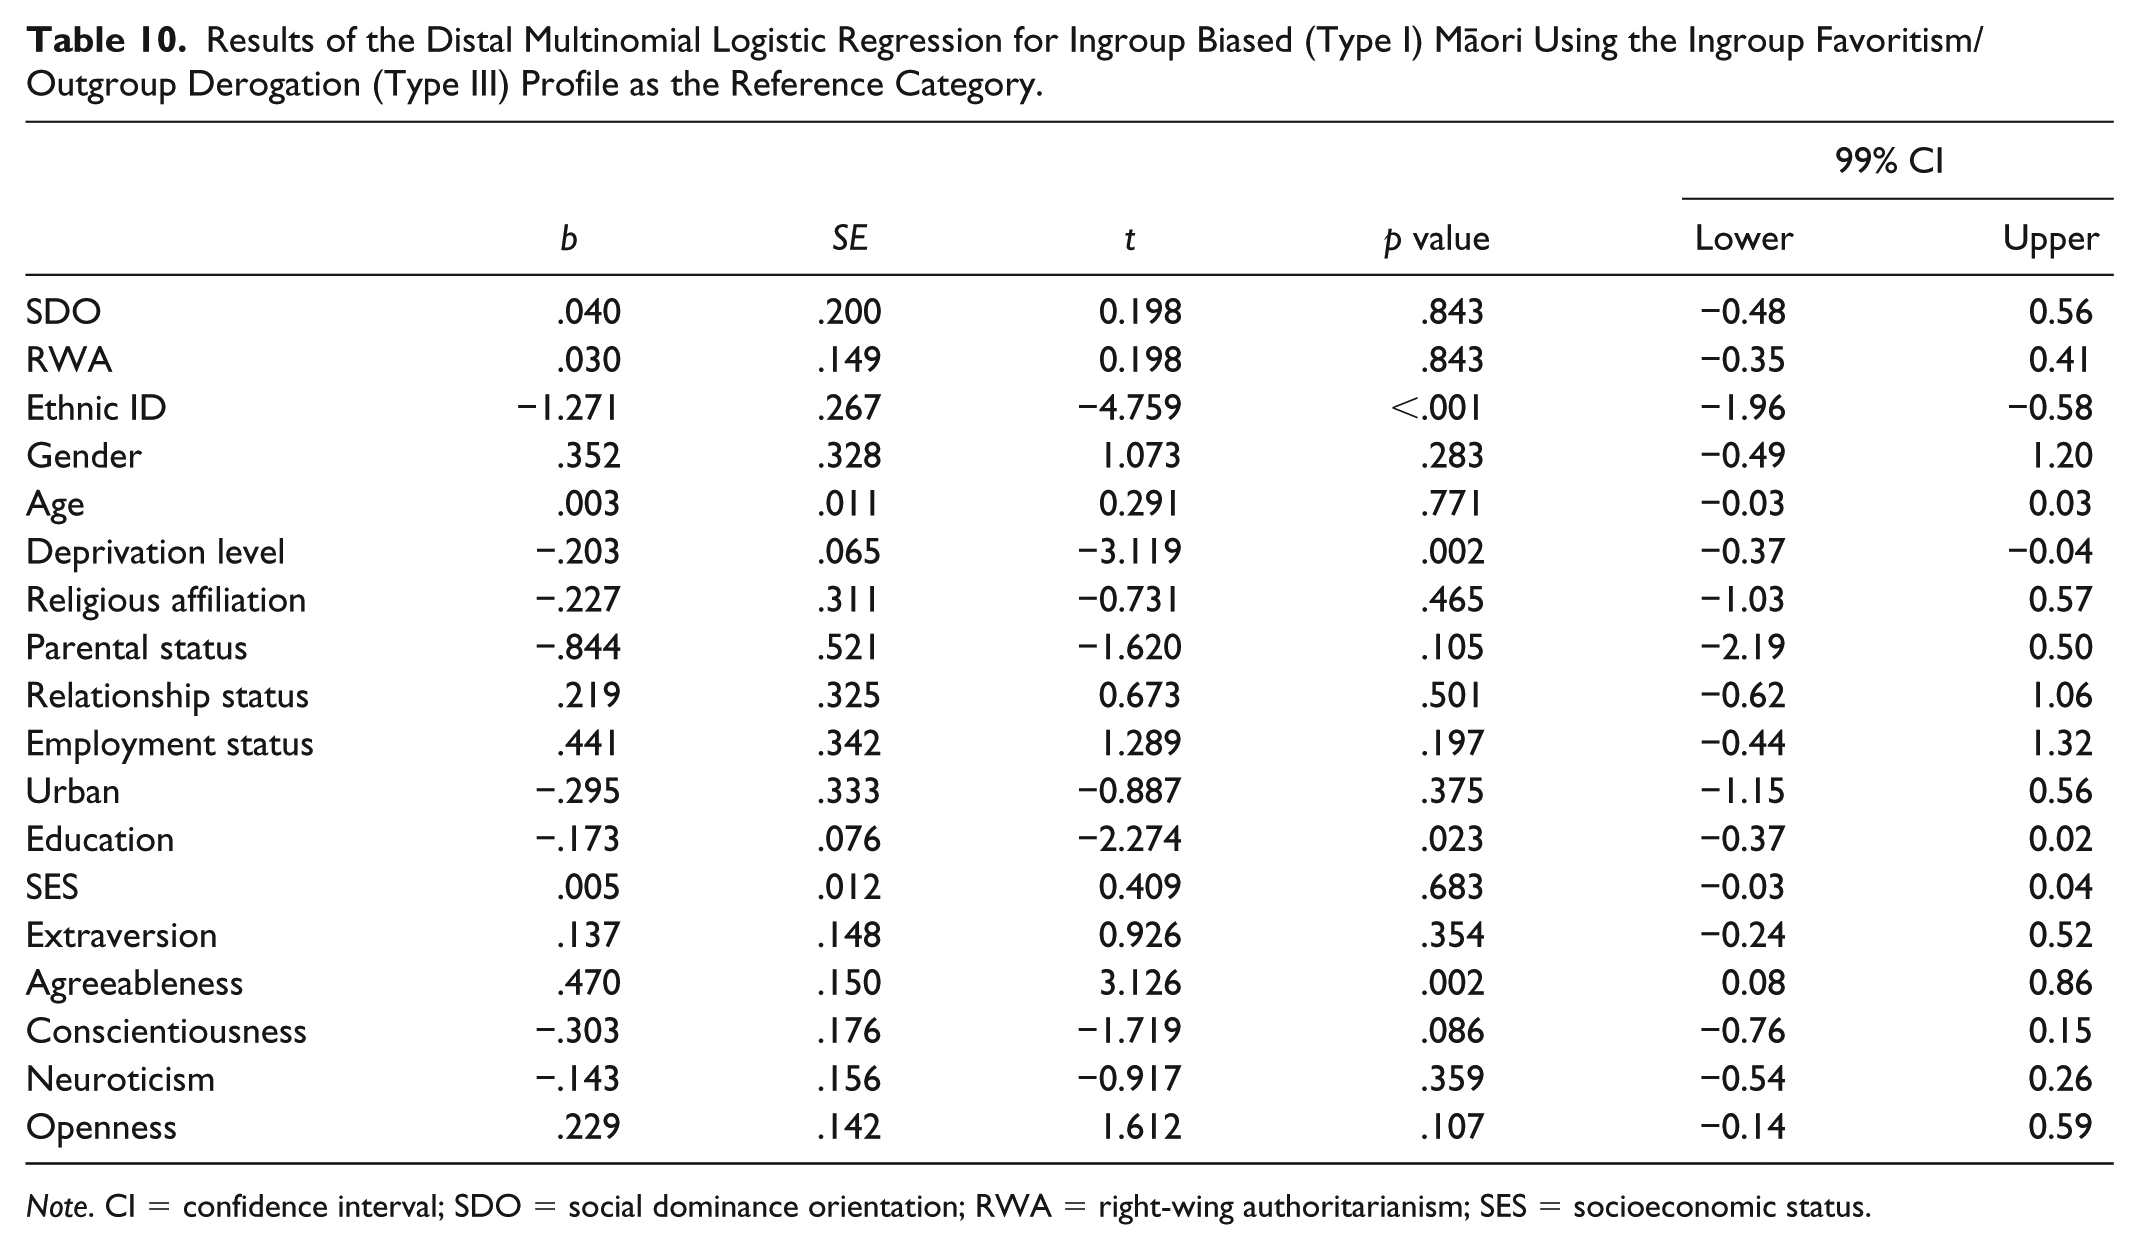
Results from the three-step weighted multinomial logistic regression model assessing gender, age, SDO, RWA, and ethnic identity centrality as independent predictors of profile membership for Europeans and Māori are presented in Tables 5 through 7 and Tables 8 through 10, respectively. The ingroup favoritism/outgroup derogation profile for each ethnicity was used as the reference profile in these analyses, as it is most relevant to our focal interest. Therefore, all results reflect the likelihood of belonging to the given profile relative to the ingroup favoritism/outgroup derogation profile.
Results of the Distal Multinomial Logistic Regression for Low-Warmth Europeans Using the Ingroup Favoritism/Outgroup Derogation (Type III) Profile as the Reference Category.
Note. CI = confidence interval; SDO = social dominance orientation; RWA = right-wing authoritarianism.
Results of the Distal Multinomial Logistic Regression for Moderate-Warmth Europeans Using the Ingroup Favoritism/Outgroup Derogation (Type III) Profile as the Reference Category.
Note. CI = confidence interval; SDO = social dominance orientation; RWA = right-wing authoritarianism; SES = socioeconomic status.
Results of the Distal Multinomial Logistic Regression for Ingroup Biased (Type I) Europeans Using the Ingroup Favoritism/Outgroup Derogation (Type III) Profile as the Reference Category.
Note. CI = confidence interval; SDO = social dominance orientation; RWA = right-wing authoritarianism; SES = socioeconomic status.
Results of the Distal Multinomial Logistic Regression for Low-Warmth Māori Using the Ingroup Favoritism/Outgroup Derogation (Type III) Profile as the Reference Category.
Note. CI = confidence interval; SDO = social dominance orientation; RWA = right-wing authoritarianism; SES = socioeconomic status.
Results of the Distal Multinomial Logistic Regression for Moderate-Warmth Māori Using the Ingroup Favoritism/Outgroup Derogation (Type III) Profile as the Reference Category.
Note. CI = confidence interval; SDO = social dominance orientation; RWA = right-wing authoritarianism; SES = socioeconomic status.
Results of the Distal Multinomial Logistic Regression for Ingroup Biased (Type I) Māori Using the Ingroup Favoritism/Outgroup Derogation (Type III) Profile as the Reference Category.
Note. CI = confidence interval; SDO = social dominance orientation; RWA = right-wing authoritarianism; SES = socioeconomic status.
The predictors of profile membership for Europeans are displayed in Tables 5 to 7. In terms of predicting membership in the ingroup biased profile (relative to the ingroup favoritism/outgroup derogation profile), results indicated that being younger, higher in conscientiousness, and having higher SDO predicted membership in the ingroup favoritism/outgroup derogation profile. Openness also correlated negatively with the likelihood of being in the ingroup favoritism/outgroup derogation profile relative to both the low- and moderate-warmth profiles. Women, those higher in agreeableness and extraversion, those who identified with a spiritual or religious group, and those who had a higher education were more likely to belong to the low-warmth profile relative to the ingroup favoritism/outgroup derogation profile. Overall, when considering the high-, moderate-, and low-warmth groups relative to the ingroup favoritism/outgroup derogation profile, those who are of younger age, higher in conscientiousness, and higher in SDO consistently predicted a greater likelihood of belonging to the ingroup favoritism/outgroup derogation profile. This is consistent with our hypothesis that ingroup bias is likely driven by SDO among Europeans, while also suggesting that age and conscientiousness correlate with ingroup bias among Europeans.
For Māori (see Tables 8-10), neither gender nor age predicted membership in the ingroup favoritism/outgroup derogation group relative to the ingroup biased, moderate-warmth, or low-warmth profile. Considering first the differences between the ingroup biased profile and the ingroup favoritism/outgroup derogation profile, results indicated that those who belonged to the ingroup favoritism/outgroup derogation profile were higher on the deprivation index, had less education, were less agreeable, and had higher ethnic identification. However, when compared with the moderate-warmth profile, being lower on agreeableness, conscientiousness, and openness, but higher in deprivation and ethnic identity centrality, predicted membership in the ingroup favoritism/outgroup derogation. Finally, only education and ethnic identity centrality correlated positively with the likelihood of belonging to the ingroup favoritism/outgroup derogation profile (relative to low warmth). Thus, only ethnic identity and education consistently predicted membership in the ingroup bias profile (relative to the other three profiles). This aligns with our hypothesis that ingroup bias among Māori may be rooted in higher ethnic identity centrality. These effects for SDO for Europeans and ethnic identification for Māori both replicated when we used data from Time 8, rather than Time 5 (refer to supplemental online material).
Discussion
Ingroup bias has been widely studied for more than 60 years (for a review, see Brewer, 2017; for meta-analyses, see Fischer & Derham, 2016; Mullen, Brown, & Smith, 1992). Although this research brought much insight into group-based bias, the common operationalization of ingroup bias in the literature suffers from some key limitations, given that only relative difference measures are typically used to assess ingroup bias. As these measures assess the relative differences in warmth toward the ingroup relative to the outgroup, scores have to be aggregated to mean levels of bias across all individuals in samples (Brewer, 1979; Tajfel, 1970; Tajfel et al., 1971). Consequently, few studies have been able to operationalize ingroup bias in a way that meaningfully distinguishes between combinations of ingroup favoritism and outgroup derogation, a key challenge for the area identified by Fischer and Derham (2016).
These (and other) limitations have often led researchers to focus on demonstrating the primacy of ingroup favoritism over outgroup hostility (see Brewer, 2017), or situations where explicit outgroup derogation may occur (Mummendey & Otten, 1998). Although such work is vital to understanding intergroup biases, these approaches have limited researchers’ ability to infer about the prevalence of attitudinal constellations at the population level and to examine whether advantaged and disadvantaged groups display distinct patterns of ingroup bias (or even differences in the proportions of members who show strong ingroup bias).
In the present article, we, therefore, used LPA to investigate the heterogeneity of ingroup bias within a population. Our results demonstrate that it is possible to differentiate between the three types of bias posited by Brewer (2017), while also identifying a fourth (previously unidentified) response pattern. By comparing between advantaged and disadvantaged groups, we further parsed out the distinct motivations underlying Brewer’s third type of ingroup bias. Whereas SDO predicted belonging to the ingroup favoritism/outgroup derogation profile for Europeans, ethnic identity centrality did so for Māori.
Modeling Ingroup Bias
The current study advanced a novel operationalization of group bias using LPA to uncover the prevalence of distinct profiles of ingroup bias underlying warmth ratings of the ingroup and outgroup. In addition to identifying the patterns outlined above, our results show that there is clear heterogeneity in people’s levels of ingroup bias or the combination of warmth that they feel toward ingroup and outgroup. This heterogeneity is masked by focusing on mean levels of relative difference—the standard approach in variable-centered analyses common in the literature. Thus, LPA represents a new and promising method of quantifying and examining this heterogeneity. LPAs also have the potential to validate (or challenge) other assumptions related to group-based bias (e.g., differences between implicit and explicit racism; see Osborne & Sibley, 2017).
Notably, our results revealed that ingroup favoritism was the most prevalent response pattern for both Europeans and Māori—results consistent with Brewer’s (1999) assertion that ingroup favoritism is the dominant form of bias in society. Approximately 55% of people reported high warmth toward the outgroup, but slightly higher warmth toward the ingroup. Although on the face of it, this result seems positive, it is important to recognize that even small differences in warmth toward the ingroup and outgroup can affect how the outgroup is differentially disadvantaged relative to the ingroup. As Brewer (2017) notes, ingroup favoritism has widespread implications for how benefits in society are preferentially given to the ingroup. This tendency can allow for persistent inequality between majority and minority groups, particularly if the majority group (which typically wields more political and financial power) shows ingroup favoritism. Furthermore, in our sample, Europeans displayed higher levels of ingroup favoritism than did Māori. This difference, although small, may have a large impact on efforts to reduce inequities in New Zealand.
The moderate-warmth group for each ethnicity may represent a fourth type of attitudinal constellation not included in Brewer (2017). People in this category did not show high or low levels of warmth toward either ethnicity, but rather displayed a sort of neutrality or ambivalence—lack of strong feeling toward either group. At first glance, this category may seem to represent Brewer’s (2017) egalitarian category, but it should be noted that both Europeans and Māori in this group displayed very slightly higher warmth toward Europeans. Finally, the small percentage of individuals within the low-warmth group may represent those who experience social isolation or have experienced predominantly negative experiences within their ingroup and with the outgroup. It is of note that members of these groups tended to have higher levels of outgroup warmth than ingroup warmth, which may reflect negative ingroup experiences in particular.
More broadly, feelings toward the ingroup and outgroup have often been viewed as inversely related—a position that implicitly assumes that warmth is a zero-sum game, whereby warmth toward the ingroup infers lack of warmth toward the outgroup (see Brewer, 1999, 2017). In line with this assumption, in past research, Gonsalkorale and von Hippel (2012) sought to identify a reciprocal relationship between ingroup positivity and outgroup negativity. Although there was generally little evidence for this pattern in the literature, the authors did find an inverse relationship between outgroup hostility and ingroup favoritism among an online neo-Nazi sample. Our ingroup favoritism/outgroup derogation profile, given the high entropy and difference in warmth ratings, may potentially represent a group for whom ingroup positivity and outgroup negativity are linked, as hypothesized by Brewer (1999, 2017).
Overall, however, our results speak firmly against the notion that in- and outgroup warmth are inversely related. Instead, our results demonstrate that ingroup warmth and outgroup warmth are distinct constructs (see also Cacioppo & Berntson, 1994), and we suggest that the way they are related may depend on the cultural context. In our sample, warmth toward the ingroup correlated positively with warmth toward the outgroup for both Māori and Europeans. Only approximately 10% displayed a pattern, whereby ingroup warmth inferred lack of warmth to the outgroup. Although the prevalence of those who display this inverse response pattern may be smaller than theorized, LPAs using samples from populations who have particularly divisive views may identify a more populous ingroup favoritism/outgroup derogation response pattern.
Differentiating Bias Across Groups
Although we identified similar response patterns across Māori and Europeans, further analyses revealed that attitudinal roots of these profiles differed across groups. Given that SDO captures people’s preference for group-based hierarchy and the valuation of advantaged groups over disadvantaged groups, we predicted that SDO would predict membership in the ingroup favoritism/outgroup derogation profile for Europeans. This was supported by our results. Conversely, ethnic group centrality allows minority groups to maintain a positive self-identity (Greene, Way, & Pahl, 2006) and to unify under a collective ingroup identity social change. Thus, we hypothesized that ethnic identity centrality would predict membership in the ingroup favoritism/outgroup derogation profile for Europeans. For Maori participants, membership in the ingroup favoritism/outgroup derogation profile relative to other profiles was predicted not by dominance, but rather by a strong ethnic identity.
Although our results revealed that SDO and ethnic group centrality were the most consistent predictors of profile membership for Europeans and Māori, respectively, a number of personality traits also independently predicted profile membership. Consistent with research showing that agreeableness correlates negatively with intergroup bias (see Sibley & Duckitt, 2008), agreeableness was inversely associated with the likelihood of belonging to the ingroup favoritism/outgroup derogation (for both Europeans and Māori), as well as the moderate-warmth (for Māori) profiles (relative to the ingroup favoritism/outgroup derogation profile). Likewise, conscientiousness correlated positively with the likelihood of belonging to the ingroup favoritism/outgroup derogation profile among Europeans, results consistent with the broader literature on the personality correlates of conservatism (see Sibley, Osborne, & Duckitt, 2012).
Ingroup Bias in the New Zealand Context
Within the New Zealand context, the modern drive for biculturalism and reparations for colonization may represent a threat to the legitimacy of Europeans as the dominant ethnic group in New Zealand (see Sibley & Osborne, 2016). In New Zealand, SDO in Europeans correlates negatively with support for minority rights (Milojev, Sengupta, & Sibley, 2014) and warmth toward Māori (Duckitt & Sibley, 2007). The ingroup favoritism/outgroup derogation pattern of bias among majority group members may represent a desire or attempt to reinforce inequity among Europeans and Māori shown in New Zealand today (Ministry of Social Development, 2016) and maintain the group-based hierarchy in New Zealand.
These insights obtained from the current study also extend the literature on the relationship between SDO and ingroup bias for both advantaged and disadvantaged groups. Our work suggests that SDO can significantly predict ingroup bias relative to simple ingroup favoritism among advantaged majority (Europeans), but not disadvantaged minority groups (Māori). We hypothesize that this tendency may hold cross-culturally, reflecting a broader tension of advantaged–disadvantaged relations.
As a collectivist culture, the Māori construct of the self is fostered through connections to the wider community in which an individual belongs (Walker, 1990). Māori with high ethnic identity centrality may strongly emphasize connections through whakapapa (being Māori in their interpersonal relationships as a reflection of their culture). However, Māori also live in a postcolonial society, which has marginalized Māori culture and ways of acting and being (Ministry of Social Development, 2016). Thus, ethnic identity may buffer Māori from the negative effects of being a minority group (Greene et al., 2006). Furthermore, it may help maintain a positive view of the group and self that is needed to establish a positive social identity, while leading to negative sentiment toward the majority, which has marginalized Māori within their indigenous land. As such, Māori may tend to feel more warmth toward the ingroup and less warmth toward Europeans. Thus, ethnic identity centrality likely reflects ingroup favoritism and outgroup derogation (i.e., Brewer, 2017; third type of ingroup bias). Thus, although some Europeans and Māori show ingroup bias, the motivations and loci of bias for Europeans and Māori appear to be different.
Potential Extensions to Intergroup Relations
As stated above, our results also demonstrated that the majority of people feel warmly toward both the ingroup and outgroup, but there was a slight tendency to favor the ingroup over the outgroup. This general pattern of results fits with the claim that ingroup favoritism is the dominant form of group-based bias (see Brewer, 2017) and also aligns with evolutionary theorizing about intergroup relations. From an evolutionary perspective, ethnicity is one of the primary units of information (alongside sex and age) humans encode when meeting others (see Cosmides, Tooby, & Kurzban, 2003; Gil-White, 2001). This primacy given to ethnicity has been likened to categorization of species within the animal world, as it is constructed as an essential quality that differentiates groups (Gil-White, 2001). Ethnic groups traditionally functioned as coalitional groups, as those within the same ethnic group were more likely to be allies within a band who could be relied upon during conflict (Cosmides et al., 2003). The dominance of bias in favor of the ingroup (whether displayed through pure ingroup favoritism or ingroup favoritism/outgroup derogation) suggests that ethnic coalitional behavior remains relatively normative. This phenomenon could be explored further through conducting similar studies cross-nationally, and longitudinally, to examine enduring patterns of favoritism based on coalitions over time.
Limitations and Future Research Directions
Our work focuses primarily on New Zealand and is restricted to intergroup relations between Europeans and Māori. As such, many of the results will have to be replicated with other groups in other societies before any definitive conclusions are made. Nevertheless, there is a rich body of research, which could address this hypothesis. In traditional measures of relative difference, group-based bias is driven by those in the sample who show ingroup favoritism/outgroup derogation. In their meta-analysis, Fischer and Derham (2016) included 269 samples which potentially have the data needed for an LPA, and a further 229 articles which could potentially be analyzed using LPA. Reanalyzing some of these data via LPA could help elucidate the generalizability of our results across a range of diverse samples and countries.
We also opted to use positive affective thermometers to measure ingroup/outgroup bias. However, there is some evidence that fear is also an important emotion driving group-based bias (Gaertner & Insko, 2000; Phelps et al., 2000). Furthermore, it is important to highlight that this warmth is a broad measure of sentiment toward the ingroup/outgroup. Future work should use LPAs to identify unique attitudinal constellations of ingroup love and outgroup derogation operationalized in diverse ways. For example, analyzing warmth and competence (aligned with the stereotype content model; Fiske, Cuddy, Glick, & Xu, 2002) could add more fine-grained insight into the reasoning behind bias among groups. Similarly, most research on ingroup bias has used a resource allocation paradigm rather than warmth ratings. Given the theoretical differences between these two different operationalizations of ingroup bias, it would be interesting to see how an LPA of a resource allocation paradigm would differ from our results. Potentially, given the propensity of people to favor the ingroup in these studies (see Brewer, 1999), we may see an amplification of ingroup bias.
Finally, key theoretical questions need to be investigated over time using latent transition analysis (LTA), a statistical procedure that adds a longitudinal component to LPA (Collins & Lanza, 2010). An LTA could test whether ingroup bias changes over time, as well as investigate the effectiveness of policies that aim to reduce ingroup bias. As Brewer (2017) notes, policies that fail to address the underlying cause of intergroup bias (i.e., ingroup love or outgroup hate) are unable to rectify group-based biased. If policies are successful, though, there should be a reduction in the proportion of the ingroup favoritism/outgroup derogation profile over time as people shift from biased profiles to unbiased profiles. Such investigations are increasingly important in diverse nations.
Conclusion
Research on ingroup bias has been a foundation of social psychology. However, the operationalization of ingroup bias emerging from the minimal group paradigm has primarily relied on relative difference measures. We advance a novel operationalization of group bias using LPA to demonstrate distinct group-based bias profiles based on ingroup/outgroup warmth ratings using a national probability dataset from New Zealand. Among Māori and Europeans, we identified four profiles of group-based bias. One profile for each ethnicity (i.e., 6.7% of Māori and 10.3% of Europeans) displayed both ingroup favoritism and outgroup derogation. Despite displaying similar response patterns, the predictors of membership in this key profile revealed important differences between groups. For Māori, ethnic identity centrality correlated positively with the likelihood of belonging to the ingroup bias profile, whereas SDO predicted membership in this profile among Europeans. For minorities, then, our analysis suggests that ingroup bias is driven by the view of ethnicity as core to the self-concept. Conversely, the desire for group-based dominance appears to motivate ingroup bias for the majority group. Thus, ingroup favoritism and outgroup derogation appear to have distinct origins for advantaged and disadvantaged groups in society. Only by appreciating the subtle nuances of ingroup favoritism and outgroup derogation can we fully address the problematic side of intergroup bias.
Supplemental Material
PSPB845919_Hamley_Online_Appendix – Supplemental material for Ingroup Love or Outgroup Hate(or Both)? Mapping Distinct Bias Profiles in the Population
Supplemental material, PSPB845919_Hamley_Online_Appendix for Ingroup Love or Outgroup Hate(or Both)? Mapping Distinct Bias Profiles in the Population by Logan Hamley, Carla A. Houkamau, Danny Osborne, Fiona Kate Barlow and Chris G. Sibley in Personality and Social Psychology Bulletin
Supplemental Material
PSPB845919_Supplementary_histograms – Supplemental material for Ingroup Love or Outgroup Hate(or Both)? Mapping Distinct Bias Profiles in the Population
Supplemental material, PSPB845919_Supplementary_histograms for Ingroup Love or Outgroup Hate(or Both)? Mapping Distinct Bias Profiles in the Population by Logan Hamley, Carla A. Houkamau, Danny Osborne, Fiona Kate Barlow and Chris G. Sibley in Personality and Social Psychology Bulletin
Supplemental Material
PSPB845919_Time_8_Supplementary_document_MS – Supplemental material for Ingroup Love or Outgroup Hate(or Both)? Mapping Distinct Bias Profiles in the Population
Supplemental material, PSPB845919_Time_8_Supplementary_document_MS for Ingroup Love or Outgroup Hate(or Both)? Mapping Distinct Bias Profiles in the Population by Logan Hamley, Carla A. Houkamau, Danny Osborne, Fiona Kate Barlow and Chris G. Sibley in Personality and Social Psychology Bulletin
Footnotes
Acknowledgements
This manuscript was based on Logan Hamley’s honors thesis, supervised by Chris Siblet.
Declaration of Conflicting Interests
The author(s) declared no potential conflicts of interest with respect to the research, authorship, and/or publication of this article.
Funding
The author(s) disclosed receipt of the following financial support for the research, authorship, and/or publication of this article: This research was supported by a grant from the Templeton Religion Trust (TRT0196).
Supplemental Material
Supplemental material is available online with this article.

References
Supplementary Material
Please find the following supplemental material available below.
For Open Access articles published under a Creative Commons License, all supplemental material carries the same license as the article it is associated with.
For non-Open Access articles published, all supplemental material carries a non-exclusive license, and permission requests for re-use of supplemental material or any part of supplemental material shall be sent directly to the copyright owner as specified in the copyright notice associated with the article.
