
Abstract
This research finds evidence for reliable individual differences in people’s perceived attitude stability that predict the actual stability of their attitudes over time. Study 1 examines the reliability and factor structure of an 11-item Personal Attitude Stability Scale (PASS). Study 2 establishes test–retest reliability for the PASS over a 5-week period. Studies 3a and 3b demonstrate the convergent and discriminant validity of the PASS in relation to relevant existing individual differences. Studies 4 and 5 show that the PASS predicts attitude stability following a delay period across several distinct topics. Across multiple attitude objects, for people with high (vs. low) scores on the PASS, Time 1 attitudes were more predictive of their Time 2 attitudes, indicative of greater attitudinal consistency over time. The final study also demonstrates that the PASS predicts attitude stability above and beyond other related scales.
Suppose an individual holds the most positive attitude in a group toward some issue or product today. Does holding that attitude predict whether he or she will still be the most favorable person 2 weeks, a month, or years from now? More generally, does a person’s attitude in the present predict what the attitude will be in the future? Does the answer to this question vary from person to person? Understanding whether an attitude changes over time—even if unchallenged—is an important but understudied phenomenon. Some have suggested that the dearth of research on this issue is a result of the difficulty of longitudinal designs, which are required to examine it (Luttrell et al., 2016). This research proposes that individual differences exist in attitude stability and seeks to develop and validate a scale to measure these differences.
Although little past work has focused on attitude stability, researchers have occasionally investigated this phenomenon under the purview of attitude strength: the extent to which an individual attitude is persistent, resistant to persuasion, and predictive of behavior (Petty & Krosnick, 1995). That is, attitude stability is viewed as one feature of a strong attitude. Research on attitude stability has typically examined associations between various properties of particular attitudes and that attitude’s ability to persist over time. For example, Prislin (1996) demonstrated that attitudes toward affirmative action, legalized abortion, and euthanasia were more stable over a 4-week period, and attitudes toward pizza were more stable over a 3- to 5-week period, to the extent that the individual attitudes were more extreme and held with certainty. Bassili (1996) showed that greater certainty and higher accessibility of attitudes toward pornography were associated with greater attitude stability over the course of 10 or more days. And, Luttrell and colleagues (2016) found that attitude certainty and ambivalence interacted to predict the stability of attitudes toward organic food, alcohol, and Mitt Romney over a period of 1 month to 1 year. Specifically, high certainty in a given attitude was associated with stability mostly when that attitude was univalent rather than ambivalent.
As these examples illustrate, existing work on attitude stability has primarily examined features of a specific attitude (e.g., Is the person certain of their attitude toward alcohol, or extreme in their attitude toward affirmative action?) (see Petty & Krosnick, 1995). These attitude properties vary on an object-by-object basis, such that one might be certain of one’s attitudes toward some targets (e.g., Donald Trump), but unsure of one’s attitudes toward others (e.g., exercise). However, are some individuals prone to exhibit greater stability across numerous attitude objects? For example, are some people likely to show greater natural persistence in attitudes that are largely unrelated to one another, such as their attitudes toward exercise as well as Donald Trump? With an emphasis on properties of specific attitude objects, prior research has not considered this possibility.
The primary goal of this article is to examine whether such general individual differences exist in attitude stability. If such individual differences exist, they could account for unique variance in attitude consistency across a diverse set of targets (Briñol et al., 2004; Saucier & Webster, 2010).
Attitude Stability: Relative Stability Versus Absolute Stability
Before diving into a review of past work relevant to identifying individual differences in attitude stability, it is useful to clearly define what we mean by attitude stability. As our review of the literature will attest, past work mostly examined the stability of individual attitudes under the purview of attitude strength and often as the consequence of persuasion attempts. However, people’s attitudes might sometimes change simply due to the passage of time, without direct persuasive attempts. This change could be due to a shift in societal norms (e.g., most people becoming less prejudiced over time) or it might be due to changes in personal preference (change in one’s own prejudice as a result of a personal experience). Our interest is in whether it is possible to predict individual differences in attitude change when no direct persuasive attempt occurs.
In addition, it is useful to distinguish between absolute and relative attitude stability, which have not been clearly differentiated in past research. Some researchers have construed stability in absolute terms (e.g., Bassili, 1996; Glasman & Albarracín, 2006), whereas others, like us, focus more on relative stability (e.g., Cunningham et al., 2001; Krosnick, 1988; Schaubroeck et al., 1996). Absolute stability refers to the amount of change in a person’s attitude from Time 1 to Time 2, regardless of direction. In contrast, relative stability refers to whether a person keeps his or her position within the overall distribution of attitudes in the sample. For example, it could be that everyone shows three points of change due to some environmental event, but the question of relative stability is whether a given person’s attitude, when compared with other people, would still line up in the same order as before (e.g., is the person who was most favorable in the original distribution still the most favorable at Time 2 regardless of whether there was a lot or a little amount of absolute change in the sample?).
This latter form is the kind of stability that we aimed to assess in this research: a stability in people’s underlying evaluation within the distribution of attitudes. We think this is how people generally perceive attitude stability. That is, people may not be as aware of changes in their specific attitude positions (Ross, 1989) as they are aware of changes in their relative standing in a group (e.g., I used to be the most liberal in my group, but I no longer am; see Ostrom & Upshaw, 1968). Of course, these two types of attitude stability would usually correlate with each other. However, there would be situations in which they are not perfectly aligned, as just illustrated. In this research, we consider attitudes at Time 1 that predict attitudes at Time 2 with a correlation of 1.0 to be highly stable even if, on average, the attitudes in the sample changed in absolute terms.
Individual Differences in Attitude Stability
Past attempts at identifying individual differences in attitude stability (whether absolute or relative) have fallen into three major categories. First, researchers have attempted to develop general measures of persuasibility to predict how difficult it would be to change people’s beliefs with a communication. Second, researchers aimed to understand individual differences in the occurrence of persuasion processes (e.g., counterarguing) as a means to understand persuasibility. Finally, researchers examined individual differences related to the message content people found most persuasive.
The present endeavor differs from these prior efforts in two ways. First, whereas all of these prior efforts focus on persuasion-relevant situations (i.e., when information is presented in an effort to change attitudes), we emphasize the relative stability of attitudes in the absence of persuasive efforts. Moreover, this research explores the idea that people possess insight into their own general attitude stability, and these naive theories can be measured and used to predict stability. To our knowledge, this is the first effort to measure general individual differences in attitude stability that does not directly tie that stability to persuasion contexts. Before turning to this research, we briefly discuss prior relevant efforts.
General Persuasibility Scales
Considerable research in the 1950s and 1960s studied different forms of cognitive rigidity—the malleability of individuals’ beliefs when challenged. This led to the development of two influential measures—the Dogmatism Scale (Rokeach, 1954) and the Right-Wing Authoritarianism Scale (Altemeyer, 1996). Common to both was the idea that certain individuals are more likely to maintain a given pattern of beliefs across situations and time (see also Gough’s Rigidity Scale; Gough, 1957). Nevertheless, reviewers of this work have argued that individual difference approaches to understanding cognitive rigidity have proven only partially successful (Abelson, 1968; Wicklund & Brehm, 1976), and studies of dogmatism and authoritarianism have not led to definitive conclusions regarding individual differences in attitude stability. More importantly, these studies largely examined attitude change in response to persuasive messages. Therefore, these studies cannot speak to attitude stability over time beyond the context of a specific persuasion attempt.
Individual Differences Relevant to Persuasion Processes
Co-occurring with efforts to find overall individual differences in persuasibility, some researchers examined individual differences related to persuasion processes. The Yale message learning approach (Hovland et al., 1953) held that attitude change depended on both learning and then yielding to the communication. Thus, individual differences such as self-esteem and intelligence could affect persuasibility by relating to one or both of these processes (McGuire, 1968).
Based on dual-process theories of persuasion such as the elaboration likelihood (Petty & Cacioppo, 1986) and heuristic-systematic (Chaiken et al., 1989) models, individual differences that related to the extent of message-relevant thinking (e.g., need for cognition; Cacioppo & Petty, 1982) were also proposed to be related to persuasibility. Moreover, individual differences in the motivation to defend one’s attitude (e.g., defensive confidence; Albarracín & Mitchell, 2004) were found to relate to persuasibility. Relatedly, people who score highly on the bolstering subscale of the Bolster–Counterargue Scale (Briñol et al., 2004) or are high in social vigilantism (Saucier & Webster, 2010) were especially likely to bolster their current attitudes or counterargue challenges and thus to maintain their attitudes in the face of persuasion attempts.
Beyond these attempts, efforts have been made to derive a persuasibility measure by adopting Cialdini’s (2004) six strategies of compliance. These efforts include the 12-item instrument developed by Kaptein and colleagues (2009) to study the likelihood of compliance to persuasive requests and a seven-item scale to study compliance in the health domain. Finally, in some situations, people might be persuaded because the attitude change helps reduce cognitive dissonance (e.g., Festinger & Carlsmith, 1959), and individual differences in preference for consistency (Cialdini et al., 1995) have been found to moderate people’s susceptibility to cognitive dissonance–based attitude change. As with the general persuasibility scales, each of these individual differences was used to predict attitude change in the face of a challenge.
Individual Differences in the Appeal of Specific Persuasion Content
Prior work also examined individual differences that predict the type of information that persuades people. For example, people are more persuaded when messages emphasize motivations that fit their personality (e.g., sociability for extraverts; Hirsh et al., 2012). For many individual differences (e.g., self-monitoring, M. Snyder & DeBono, 1985; introversion, Wheeler et al., 2005), matching message content to people’s personality enhances persuasion, though the process driving this effect can vary based on people’s overall motivation and ability to think about the message (see Briñol & Petty, 2019).
In short, research has attempted to (a) assess a global persuasibility dimension, (b) examine more specific characteristics associated with particular persuasion processes, and (c) find which kinds of messages are more persuasive for which people. Of most importance, none of the approaches and scales has been applied to addressing individual differences in the likelihood of having stable attitudes over time in the absence of a persuasive message.
Contemporary Examinations of Individual Differences in Attitude Stability
Only recently have researchers attempted to devise scales relevant to attitude stability that have focused on beliefs about the stability of people’s attitudes in general. However, these scales have not focused on the stability of a person’s own attitudes. Specifically, work on the Implicit Theories of Attitude Stability (ITAS) scale (Petrocelli et al., 2010) applies work on implicit theories of trait changeability (Dweck, 1999) to the attitudes domain, assessing people’s beliefs about the stability of attitudes, and the consequences of these beliefs (cf. Neel & Shapiro, 2012). The ITAS scale includes items such as “People can always change their attitudes” (cf. Chiu et al., 1997). Initial examinations of the ITAS scale demonstrated that it influenced attitude certainty and attitude–intention consistency (Petrocelli et al., 2010), but this scale has not been used to predict attitude stability. Although beliefs about the stability of people’s attitudes in general might predict one’s own stability, it is also reasonable to suspect that they would not because people tend to think that they are unique in various ways (Fromkin & Snyder, 1980; e.g., “Most people are changeable, but not me!”). Moreover, we will examine whether the ITAS scale shows reasonable distinction from the scale we develop.
Other research has attempted to manipulate people’s beliefs about attitude stability. In one study, Akhtar and Wheeler (2016) provided participants with false personality feedback that suggested that their own attitudes were stable, whereas others’ attitudes were malleable, or the reverse. Participants were then given a chance to advocate their attitude to others. Those led to believe that their own attitudes were fixed were more likely to advocate than those led to believe the reverse. This research was one of the first attempts to differentiate between beliefs about one’s own changeability versus the changeability of other people (cf. De Castella & Byrne, 2015). However, these researchers momentarily manipulated beliefs about one’s own versus others’ stability and did not assess chronic differences in these beliefs. Therefore, this research was not concerned with assessing people’s chronic beliefs about their own attitude stability, nor did it examine actual attitude stability over time.
Overview
In short, no prior research has focused on developing an assessment of the stability of one’s own attitudes. Most importantly, no prior research has examined whether an individual difference measure can predict actual stability over the passage of time.
The objectives of this research are twofold. First, we examine whether individual differences in people’s beliefs about their own attitude stability are detectable. Integral to this goal, we seek to provide a sound instrument for assessing these beliefs. Second, we examine if these beliefs can predict attitude stability over time across various domains. To the extent that people’s beliefs about their own stability can be used to predict actual stability, this would have practical and theoretical implications for research on attitudes, personality, psychological consistency, and beyond.
To accomplish our objectives, we first develop a scale to assess individual differences in people’s beliefs about their own attitude stability. We dub this scale the Personal Attitude Stability Scale (PASS). We then verify the scale’s factor structure, test–retest reliability, and uniqueness compared with existing constructs. Finally, we report two studies providing evidence that the PASS can predict people’s actual attitude stability for a variety of attitude objects over and above other related scales.
Study 1: Psychometric Properties of the PASS
In our first study, we constructed an 11-item scale to measure individuals’ beliefs about their attitude stability. Next, we administered this scale to undergraduates to examine its psychometric properties.
Method
Participants were 609 Ohio State University undergraduates who participated in exchange for partial course credit in their introductory psychology courses. All participants completed the scales on computers as part of a mass prescreening session at the beginning of the quarter. One participant was removed for failing to complete the scale, leaving a final sample of 608. The 11 scale items were designed to be associated with general, rather than situation-specific, assessments of individuals’ own degree of attitude stability (cf. Briñol et al., 2004). 1 For example, rather than asking participants whether it was hard for them to change their ideas in response to advertising, we asked the more general question of whether it was hard for them to change their ideas (see Table 1 for the list of items). Participants indicated how characteristic each statement was of them using a five-point scale where 1 = “extremely unlike me,” 2 = “somewhat unlike me,” 3 = “uncertain,” 4 = “somewhat like me,” and 5 = “extremely like me.” The sample was split into two halves, one for the purpose of exploratory factor analysis and the other for the purpose of confirmatory factor analysis (N = 304 per sample).
Scale Items and Scale Characteristics.

Note. Entries are factor loadings (FL), means and standard deviations, item-total correlations with the item omitted from the calculation of total scale scores (ITC), and data on sampling distributions (S = skewness; K = kurtosis). Scale items marked “R” were reverse-scored when computing item means, total scale scores, and Cronbach’s alpha. Items were not reverse-scored when performing the factor analysis itself; hence, loadings for Factor 1 may be positive or negative.
Results
Exploratory factor analysis
Exploratory factor analysis of the 304 participants in the first sample revealed a dominant first factor. The eigenvalues are presented in Figure 1. The scree plot of the eigenvalues indicated a strong drop after the first factor, followed by smaller drops after the second and third factors. The first factor accounted for 33.8% of the total scale variance. This can be contrasted with the second strongest factor that accounted for only 12.1% of the total variance. Given a single-factor solution, the factor loadings on each item were in the expected direction and were moderately strong, with absolute values ranging from 0.42 to 0.64.
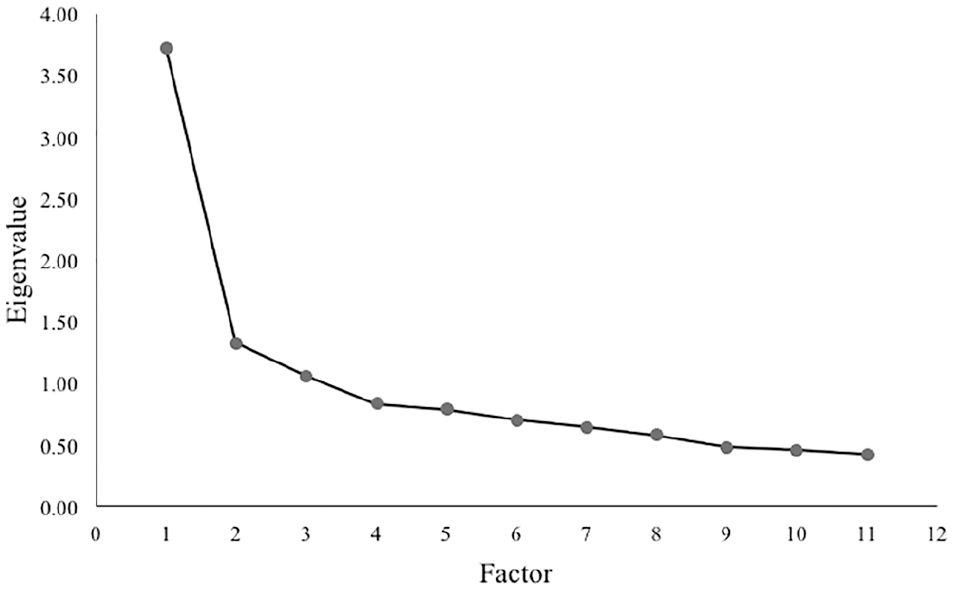
Scree plot of eigenvalues from exploratory factor analysis.
Although a single dominant factor accounted for the majority of variance in the scale items, a second factor nevertheless accounted for 12.1% of the shared variance. We thus conducted factor analysis using maximum likelihood extraction with oblimin rotation and constrained the analysis to extract two factors, to determine the loadings of the scale items on each factor. Six of the 11 items were reverse-scored items, so during factor rotation they tended to load on the same factor (see Online Appendix for detailed factor loadings of the one- and two-factor solutions). This suggested that this factor might be a methodological, as opposed to a conceptual, one. Indeed, a number of studies have shown that when participants are asked multiple questions on the same rating scale, the correlation between those items will frequently be artificially inflated in the positive direction due to correlated measurement error between scale items. With reverse-scored items, this can lead to a two-factor solution appearing to be more statistically viable than a one-factor solution simply because of correlated measurement error arising from the reverse scoring of items (e.g., see Jarvis & Petty, 1996). Because the second factor appeared methodological as opposed to conceptual, we retained a one-factor structure for the scale. See Table 1 for additional scale characteristics of this sample as well as the confirmatory sample, discussed next.
Confirmatory factor analyses
We conducted a confirmatory factor analysis with the second half of the sample. We employed a two-factor model allowing all items to load on a method factor with constant influence and another stability factor (see Online Appendix for the structural equation model standardized regression weights). This model fit the data reasonably well (root mean square error of approximation [RMSEA] = 0.065) with a chi-square value of 98.03 (p < .0001). The other fit indices also indicated an acceptable fit: Bentler–Bonett normed fit index (Bentler & Bonett, 1980) = 0.88, nonnormed fit index (Tucker & Lewis, 1973) = 0.91, and comparative fit index (Bentler, 1990) = 0.93. An item that had one of the two highest factor loadings in each sample set and thus represents the dimension fairly well is “I have often changed my opinions.”
In summary, a one-factor model with the constant influence of the method factor on all items offered the best fit to the data both conceptually and statistically. Having created a psychometrically sound measure to assess individuals’ perceptions of their own attitude stability (PASS), we next sought to examine the reliability and validity of this measure.
Study 2: Test–Retest Reliability of the PASS
To the extent that scores on the PASS represent a stable individual difference, a positive and strong correlation should be present between independent administrations. Thus, Study 2 assessed the test–retest correlation of the scale over a 5-week period.
Method
Participants and procedure
Participants were 125 Ohio State University undergraduates who participated in exchange for extra credit in their marketing courses. Participants completed the initial scale during a mass pretesting session at the beginning of the term. Five weeks later, participants returned and completed the same scale along with materials unrelated to this research. The scale was administered in different locations at Time 1 and Time 2. Five participants had incomplete data, leaving 120 participants available for the analysis.
Results and Discussion
The scale had acceptable levels of internal consistency at both the mass prescreening (α = .80) and the second administration (α = .80). Furthermore, the correlation between the first and second administrations was moderately high (r = .67, p < .001; Hinkle et al., 2003). The reasonable correlation between administrations of the scale over a 5-week period supports the reliability of the scale, consistent with the notion that the scale measures a stable individual difference.
Study 3a: Convergent and Discriminant Validity of the PASS
Our third study was designed to assess whether the PASS was distinct from other potentially relevant scales in the literature. As such, we took a number of scales that have been used in persuasion research, or seemed relevant to persuasion and attitude stability, and examined the degree of overlap of our new scale with the prior ones.
Method
Participants were 104 Ohio State University undergraduates who took part in partial fulfillment of a course requirement in their introductory psychology course. We examined the relationship of the PASS to 15 potentially related constructs that are described below. All scales were presented via MediaLab software (Jarvis, 2017).
Results
Correlations between the PASS and the other scales are presented in Table 2. Specific discussion of each scale and its relation with the PASS (α = .75) follows.
Correlations of Personal Attitude Stability Scale (PASS) With Other Psychological Constructs (N = 104).

Note. The table is structured in descending order of the magnitude of correlation with PASS.
Of note, the self-monitoring scale had very low reliability (α = .17) in Study 3a. In Study 5, we measured both PASS and self-monitoring in our sample. PASS shows a trending but not significant negative relationship with self-monitoring (r = −.15, p = .13).
p < .10. *p < .05. **p < .01.
Significantly correlated scales
Rigidity
Rigidity was assessed with the 22-item Gough and Sanford (1952) Rigidity Scale (reproduced by Rokeach, 1960; e.g., “I do not enjoy having to adapt myself to new and unusual situations”). A positive relationship (r = .29, p < .01) showed that the more rigid people considered themselves to be, the more stable they rated their attitudes.
Need to evaluate
Need to evaluate was measured with the 16-item Jarvis and Petty (1996) scale assessing the propensity to form and develop attitudes (e.g., “It is very important to me to hold strong opinions”). A significant positive relationship (r = .25, p = .01) was consistent with prior research showing that individuals higher in the need to evaluate also tend to have more accessible attitudes (Tormala & Petty, 2001), which is one contributor to attitude strength (Fazio, 1995).
Dogmatism
Dogmatism was assessed using the seven-item tolerance for ambiguity scale (Geller et al., 1993; e.g., “I don’t like to work on a problem unless there is a possibility of getting a clear-cut and unambiguous answer”). Dogmatic individuals are those whose beliefs are thought to be unlikely to change and who show a lack of tolerance for ambiguity. Consistent with this notion, the dogmatism scale showed a significant, though relatively small, positive relationship with the PASS (r = .21, p = .03).
Resistance to change
Resistance to change was assessed with a 16-item scale developed by Oreg (2003; e.g., “I’ll take a routine day over a day full of unexpected events any time”). Although this scale was designed primarily for addressing one’s likelihood of adapting to change in organizations, it could also be associated with attitude stability more generally. As expected, a positive correlation (r = .21, p = .03) was obtained.
Self-monitoring
Self-monitoring was assessed using a 25-item scale that examines individuals’ tendency to be consistent across situations (M. Snyder, 1979; “I am not always the person I appear to be”). A significant negative relationship (r = −.21, p = .03) was observed such that high self-monitors (who characteristically change to fit the situation) rated themselves as holding less stable attitudes.
Marginally correlated scales
Need for structure
The need for structure scale (Neuberg & Newsom, 1993; Thompson et al., 1989) contains 12 items designed to tap individuals’ propensity to structure and organize their social world (e.g., “I hate to be with people who are unpredictable”). This scale had a marginal positive correlation with the PASS (r = .19, p = .06). Individuals who prefer structure may be less willing to change their attitudes as doing so might disrupt that structure.
Preference for consistency
Preference for consistency was assessed using the 18-item scale developed by Cialdini et al. (1995; e.g., “I don’t like to appear as if I am inconsistent”). A marginal positive relationship (r = .18, p = .07) indicated that individuals who prefer consistency also perceive themselves as holding more stable attitudes.
Authoritarianism
Authoritarianism was assessed using the 34-item scale by Altemeyer (1996; e.g., “The real keys to the ‘good life’ are obedience, discipline, and sticking to the straight and narrow”). Results revealed a small positive relationship (r = .18, p = .07), indicating that individuals who exhibited an authoritarian personality also perceived themselves as holding more stable attitudes.
Self-doubt
Self-doubt was assessed with the eight-item subscale of the Subjective Overachievement Scale (Oleson et al., 2000; “I often wish that I felt more certain of my strengths and weaknesses”). Individuals who were high in self-doubt tended to report having marginally less stable attitudes (r = −.17, p = .08).
Noncorrelated scales
The 10-item Big 5 Personality Inventory (Gosling et al., 2003), the Experientiality Scale (Pacini & Epstein, 1999), need for closure (Webster & Kruglanski, 1994), need for cognition (Cacioppo & Petty, 1982), need for uniqueness (C. R. Snyder & Fromkin, 1977), and self-esteem (Rosenberg, 1965) did not show significant correlations with the PASS. The results are shown in Table 2.
Study 3b: Convergent and Discriminant Validity of the PASS
The PASS was not highly correlated with any of the potentially relevant scales examined in Study 3a as all correlations were below .3. However, at the time that study was conducted (i.e., in 2003), two other potentially relevant scales—the ITAS scale (Petrocelli et al., 2010) and the Defensive Confidence Scale (Albarracín & Mitchell, 2004)—were not yet published. As noted earlier, the ITAS scale taps into the general belief of the changeability of people’s attitudes. The Defensive Confidence Scale captures the chronic belief that one can successfully defend one’s attitudes from outside attack (e.g., “During discussions of issues I care about, I can successfully defend my ideas”). To examine the link between these scales and the PASS, a sample of 118 Amazon Mechanical Turk workers was recruited to complete all three scales.
The results showed that both of these scales had small positive correlations with the PASS. The correlation between the PASS and the ITAS scale was .25 (p = .01), indicating that those who believe that they have stable attitudes also tend to believe that people in general have more stable attitudes. In addition, the correlation between the PASS and the Defensive Confidence Scale was .27 (p = .003), indicating that those who believe that they have stable attitudes also tend to have more confidence that they can better defend their current positions.
Discussion
In sum, when the PASS correlated with other scales, the associations were in directions consistent with the nature of the scales, providing some degree of convergent validity, but correlations were not so high as to indicate redundancy. In addition, the PASS did not correlate with existing scales that seemed less directly relevant to personal attitude stability beliefs (e.g., self-esteem), providing some degree of discriminant validity.
Study 4: Relationship Between the PASS and Attitude Stability
Study 4 shifted to test the critical question of whether the PASS predicts actual attitude stability. Amazon Mechanical Turk workers completed the PASS and rated their attitudes toward an array of consumer brands during the Time 1 online session. After roughly 2 weeks, participants were contacted to complete the Time 2 online session, during which they rated their attitudes toward the same set of consumer brands. A hierarchical linear model was used to analyze the ability of the PASS to predict attitude stability.
Method
Participants were 239 Amazon Mechanical Turk workers who took part in the study in exchange for a payment of US$0.80 for two sessions. In the first session, 515 workers completed the survey and, after 14 to 16 days, all participants who had completed Part 1 of the study were contacted again with a request to complete the second part. In the second session, 239 finished the survey. 2 At Time 1, all participants completed the PASS and then provided their attitudes toward 12 consumer brands. At Time 2, participants were again asked to report their attitudes toward the 12 brands.
PASS
Participants responded to the PASS items (α = .88). The PASS score was calculated, standardized, and treated as a continuous variable in the analyses.
Attitude measures at Time 1 and Time 2
In the Time 1 and Time 2 sessions, we assessed attitudes toward 12 commonly known consumer brand names (e.g., McDonald’s, Toyota, Walmart, etc.; for a full list, see Online Appendix). Participants provided their opinions toward each of the brands on a seven-point scale ranging from 1 (extremely negative) to 7 (extremely positive). The brand names appeared in a random order for each participant. At Time 2, the same set of 12 brand names was used. However, to reduce the risk that participants would answer from memory, we rephrased the attitude questionnaires so that participants were asked to rate their attitudes on a different scale ranging from 1 (extremely unfavorable) to 7 (extremely favorable). Again, the brands appeared in random order for each participant.
Results and Discussion
Data were restructured such that each brand was crossed with each participant. These data were then submitted to a hierarchical linear mixed model with brand as the repeated measure to predict people’s attitudes toward each of the brands at Time 2 using their PASS scores and their attitudes toward the same set of brands at Time 1, a common technique for examining attitude stability (Cunningham et al., 2001; Krosnick, 1988; Schaubroeck et al., 1996). To demonstrate that the PASS can predict attitude stability between Time 1 and Time 2, we would expect an interaction between the PASS and Time 1 attitudes when predicting Time 2 attitudes. Unstructured covariance structure analysis was used.
There was a significant positive relationship between participants’ Time 1 attitudes and Time 2 attitudes, B = 0.65, t(2,353) = 47.76, p < .001, 95% confidence interval (CI) = [0.62, 0.68]. There was also a significant negative relationship between PASS scores and Time 2 attitudes, B = −0.13, t(1,069) = −1.99, p = .05, 95% CI = [−0.27, −0.002]. 3 Higher PASS scores were associated with more negative attitudes. Most importantly, a two-way interaction between Time 1 attitude and PASS scores was obtained on the measure of Time 2 attitudes, B = 0.03, t(2,088) = 2.19, p = .03, 95% CI = [0.003, 0.05]. For participants who scored 1 standard deviation above the mean on the PASS, B = 0.68, t(2,094) = 37.34, p < .001, their Time 1 attitudes toward brands were more predictive of their Time 2 attitudes compared with those who scored 1 standard deviation below the mean on the PASS, B = 0.62, t(2,229) = 34.18, p < .001. Therefore, we can conclude that people who scored higher on the PASS showed more attitude consistency over time. 4
Study 5: Replicating and Extending the Predictive Validity of the PASS
Even though Study 4 showed that the PASS was able to predict actual attitude stability over time, we did not demonstrate that the PASS was capable of doing so over and above other conceptually relevant scales. To address this issue, we conducted a final study using a procedure similar to Study 4. In addition to the PASS, in this study, we measured three conceptually related scales (i.e., rigidity, implicit theory of attitude stability, and self-monitoring) to examine if the PASS predicts attitude stability after controlling for these other scales. We selected these three due to their relatively high correlation with the PASS (r = .29, .25, −.21 respectively, ps < .05) as well as their theoretical association to related constructs. 5
Instead of assessing participants’ attitudes toward consumer brands, we assessed people’s attitudes toward five contemporary topics (e.g., guns). The topics were chosen because they were generally more controversial than those used in the prior study (e.g., people tend to have more diverse views on them). We sought to examine if the results from Study 4 would replicate when predicting attitude stability in more controversial domains.
Finally, we also recorded participants’ age and gender at Time 1. Past research suggests that demographics, like age and gender, can be associated with people’s susceptibility to attitude change (Visser & Krosnick, 1998). Therefore, we wanted to take the possible effects of these demographics into consideration when exploring the relationship between the PASS and attitude stability.
Method
Participants were Amazon Mechanical Turk workers who took part in the study in exchange for a payment of US$1.00 for two sessions. In the first session, 155 workers completed the survey and, after 12 days, all participants who had completed Part 1 of the study were contacted again with a request to complete the second part of the study. In the second session, 103 finished the survey. 6 At Time 1, all participants completed the PASS and the three associated scales and then provided their attitudes toward five attitude objects. Participants’ age and gender were also recorded at the end of the survey. At Time 2, participants were again asked to report their attitudes toward the same five objects.
PASS and other correlated scales
Participants responded to the PASS (α = .87), ITAS (α = .90), rigidity (α = .84), and self-monitoring (α = .77) scales. These scales were presented in random order. Each participant’s PASS, ITAS, rigidity, and self-monitoring scores were calculated, standardized, and treated as continuous variables.
Attitude measures at Time 1 and Time 2
In the Time 1 and Time 2 questionnaires, we assessed participants’ attitudes toward organic food, guns, large corporations, gambling, and alcohol. Participants provided their opinions toward each of the attitude objects on three scales anchored at 1 (extremely negative, unfavorable, and bad) and 7 (extremely positive, favorable, and good). The question type that was used to present these questions to the participants in Qualtrics was a bipolar matrix table. The order in which the five attitude objects and three attitude questions appeared was randomly determined for each participant. Using three attitude questions for each attitude object, we were able to take the average attitude rating for each and this helped with reducing noise in participants’ reporting of their attitudes. Average attitude scores were calculated for each attitude object to form the Time 1 attitude measures (α > .93).
At Time 2, the same set of attitude objects was used. However, to reduce the risk that participants would answer from memory, we phrased and presented the attitude questions in a slightly different way so that participants were asked to rate their attitudes toward each of the five categories in Qualtrics using a horizontal multiple-choice format. Three attitude questions with the same descriptors as at Time 1 were used for each attitude object. Again, the attitude objects and attitude items appeared in random order for each participant. Average attitude scores were calculated for each attitude object to form the Time 2 attitude measures (α > .95).
Results and Discussion
As in Study 4, the data were restructured such that attitude objects were crossed with participants. These data were submitted to a hierarchical linear mixed model with attitude object as the repeated measure to predict people’s Time 2 attitudes using their Time 1 attitudes, PASS, ITAS, rigidity, and self-monitoring scores, along with the two-way interactions between Time 1 attitudes and each of these four scales. Unstructured covariance structure was employed.
A significant positive relationship between participants’ Time 1 and Time 2 attitudes was observed, B = 0.72, t(389) = 27.61, p < .001, 95% CI = [0.67, 0.77]. A significant negative relationship between PASS scores and participants’ Time 2 attitudes was also found, B = −0.28, t(249) = −2.27, p = .02, 95% CI = [−0.53, −0.04]; higher PASS scores were associated with more negative attitudes. In addition, a marginally significant positive relationship between ITAS and Time 2 attitudes emerged, B = 0.24, t(279) = 1.89, p = .06, as well as a significant positive relationship between self-monitoring and Time 2 attitudes, B = 0.25, t(290) = 2.02, p = .04, 95% CI = [0.01, 0.50]. Of key interest, a significant two-way interaction between Time 1 attitudes and PASS predicting Time 2 attitudes, B = 0.07, t(326) = 2.62, p = .01, 95% CI = [0.02, 0.12], was observed. Participants’ Time 1 and Time 2 attitudes were less correlated at 1 standard deviation below the mean on the PASS, B = 0.67, t(354) = 18.94, p < .001, than at 1 standard deviation above the mean on the PASS, B = 0.79, t(370) = 22.45, p < .001. This indicated that Time 1 attitudes were more predictive of Time 2 attitudes among those with higher as compared with lower PASS scores.
Importantly, in the analysis just reported, the interaction between Time 1 attitudes and PASS scores was significant even after controlling for the interactions between Time 1 attitudes and the other scales. Also noteworthy, the two-way interaction between Time 1 attitudes and ITAS was significant, but in the opposite direction, B = −0.06, t(361) = −2.14, p = .03, 95% CI = [−0.11, −0.004], indicating that people who had higher ITAS scores showed lower attitude stability. This result seemed to be aligned with the conclusions of Akhtar and Wheeler (2016), suggesting that beliefs about one’s own attitude changeability versus the changeability of others’ attitudes might have different implications beyond their advocacy behaviors (i.e., shaping people’s actual attitude stability over time). In addition, the two-way interaction between Time 1 attitudes and rigidity was not significant, B = 0.01, t(342) = 0.37, p = .71, and the two-way interaction between Time 1 attitudes and self-monitoring was significant, B = −0.06, t(361) = −2.14, p = .03, 95% CI = [−0.11, −0.004]. People high in self-monitoring had less stable attitudes than those low in self-monitoring, as would be expected if high self-monitors change attitudes depending on the situation.
We also recorded participants’ age and gender at Time 1. The work by Visser and Krosnick (1998) explored the effect of demographics like age and gender on people’s susceptibility to attitude change. In our analysis, we took the possible effects of these demographic variables into consideration when exploring the relationship between the PASS and attitude stability. We performed a similar analysis to that described above, replacing the three correlated scales with age, age squared, and gender along with each of their interactions with Time 1 attitudes. Age squared was included because, according to the life-stage hypothesis, there is a curvilinear relationship between age and susceptibility to attitude change (Visser & Krosnick, 1998). We found that, controlling for the effect of age, age squared, and gender on attitude stability, the two-way interaction between Time 1 attitudes and PASS remained significant, B = 0.06, t(349) = 2.32, p = .02, 95% CI = [0.01, 0.11]. No other two-way interaction was significant (ps > .09). 7
In conclusion, we not only replicated the results of Study 4 using a different set of attitude objects, but also provided evidence that the PASS was able to predict attitude stability when controlling for other correlated scales, including ITAS, rigidity, and self-monitoring, and when controlling for age and gender. These findings suggest that the PASS is not only conceptually and empirically distinct from those other constructs, but also predicts attitude stability above and beyond them.
General Discussion
A direct individual difference measure capable of predicting people’s attitude stability has long eluded personality and social psychologists. In this research, we aimed to develop such a measure based on individuals’ beliefs about their own attitude stability. We constructed a scale to assess this individual difference, established the psychometric properties of the scale (Study 1), found that the scale was reliable across a 5-week period (Study 2), showed the scale to be related to, but also distinct from, relevant existing psychological constructs (Studies 3a and 3b), and provided evidence that the scale predicted people’s general attitude stability across both consumer brands (Study 4) and more controversial topics and did so even after controlling for other potentially relevant scales (Study 5). In sum, this research offers initial evidence for a reliable measure of individual differences in perceived personal attitude stability that predicts people’s actual attitude stability.
Origins of Beliefs About Attitude Stability
This research provides initial evidence that individual differences in people’s beliefs about their own attitude stability exist that also meaningfully predict actual stability. However, an open question concerns how individuals form and develop such beliefs across their lifespan. One possible source might be individuals’ own reflection on past attempts to change their attitudes. Consistent with self-perception theory (Bem, 1972), prior research suggests that individuals attend to how they deal with or handle others’ attempts to persuade them. For example, Tormala and Petty (2002) found that individuals could assess their own success in resisting persuasive messages and draw inferences from it about how strong their attitudes are (see also Rucker & Petty, 2004). Similarly, individuals might track their attitudes’ stability versus instability over time and observe the frequency with which they change their positions. These observations might, in turn, directly influence people’s perceptions of their attitude stability.
In addition, common attitude strength measures (e.g., accessibility, certainty) could potentially contribute to people’s perceptions that they have stable or unstable attitudes. For example, if a person is certain of his or her attitude and believes that the attitude is the correct one to have, this person might perceive that he or she has a stable attitude (see Petrocelli et al., 2010). In addition, the amount of thought or the perceived degree of elaboration in which people have engaged when people were forming their initial attitudes could potentially be informing them as to how stable their attitudes are (Barden & Petty, 2008).
We suspect that individuals’ beliefs about their own attitude stability could also stem from factors beyond self-observation. For example, individuals might be told by friends that they are pushovers, causing them to perceive themselves as holding unstable attitudes. Or, perhaps people who generally prefer stability deliberately choose to act in a way that aligns with that particular preference. In addition, as individuals acquire greater education, they might feel that they should be firm in their beliefs if they see this is a natural result of education. Alternatively, education may lead people to believe that there are often two sides to an issue, making them more flexible in their views. Future research should examine how the PASS relates to a variety of demographic variables. 8
It is also important to realize that there might be processes at play that would lead people to misperceive their previous attitudes, resulting in a false belief that they have been holding stable views (Goethals & Reckman, 1973; Ross, 1989). Thus, we can speculate that the PASS might be less predictive for attitude objects that are more important, morality based, and central to the core of the individual. That is, in these domains, people might be more motivated to engage in misperceiving attitude change to create the illusion that they are being consistent. On the other hand, it could be that people are particularly insightful about changes that occur in their most important attitudes. Future research on this topic would be worthwhile given these competing hypotheses.
Psychological Mechanisms Underlying the Effects of Perceived Attitude Stability
We demonstrated that individual differences in perceived attitude stability predict how consistent individuals’ attitudes actually are over time. But, what are the possible limitations on this effect? Does the effect depend on individuals not receiving any new information in the intervening period (i.e., no persuasive attacks on their original attitudes)? This would represent stability in its purest form. However, it is also possible that there were some attempts to influence people’s attitudes during the period (e.g., through advertisements, political campaigns, etc.). That is, it may have been the case that, despite having their attitudes challenged, some people resisted influence more than others, leading to more stable attitudes. If the latter is the case, then the PASS might also be useful in predicting persuasibility in addition to stability. Future research should address the utility of the PASS to predict attitude stability in contexts in which attitudes are more likely to be challenged.
Practical Implications
Identifying and establishing the means to measure individual differences in attitude stability has potential applications to information processing and persuasion practice. Within the marketing domain, for example, identifying one market segment as more likely to change may influence the messaging strategy one employs to reach that group. If a brand would like to encourage their customers through loyalty programs, then it could be wise to focus on consumers who hold less stable positive attitudes toward the company to provide more incentives.
Overall, we would expect that, in a variety of contexts ranging from consumer to social and political issues, the PASS would have implications for segmenting different types of audiences into those that are more versus less malleable. Furthermore, although the current PASS is framed to broadly measure the stability of beliefs and attitudes people hold, it might also be useful for identifying individuals for whom the stability of their other mental constructs is particularly high. For example, the PASS might have the potential to assess the stability of self-relevant dimensions, such as self-esteem (a self-attitude). Similar to previous approaches by researchers who examined moderators of individual-differences effects on behavior (e.g., Bem & Allen, 1974; Santos et al., 2019; Shoots-Reinhard et al., 2015), the PASS may allow researchers to better understand when personality traits remain stable over time. And more importantly, we would expect that, for people with more stable beliefs of their own personality traits, their individual difference ratings would be more likely to predict the corresponding behaviors. Thus, understanding individual differences in stability may help with predicting who will maintain their attitudes, and who will change, over the course of time without direct persuasive attempts.
Supplemental Material
Xu_Online_Appendix – Supplemental material for Individual Differences in Attitude Consistency Over Time: The Personal Attitude Stability Scale
Supplemental material, Xu_Online_Appendix for Individual Differences in Attitude Consistency Over Time: The Personal Attitude Stability Scale by Mengran Xu, Pablo Briñol, Jeremy D. Gretton, Zakary L. Tormala, Derek D. Rucker and Richard E. Petty in Personality and Social Psychology Bulletin
Footnotes
Declaration of Conflicting Interests
The author(s) declared no potential conflicts of interest with respect to the research, authorship, and/or publication of this article.
Funding
The author(s) received no financial support for the research, authorship, and/or publication of this article.
Notes
Supplemental Material
Supplemental material is available online with this article.
References
Supplementary Material
Please find the following supplemental material available below.
For Open Access articles published under a Creative Commons License, all supplemental material carries the same license as the article it is associated with.
For non-Open Access articles published, all supplemental material carries a non-exclusive license, and permission requests for re-use of supplemental material or any part of supplemental material shall be sent directly to the copyright owner as specified in the copyright notice associated with the article.