
Abstract
Participants in experience sampling method (ESM) studies are “beeped” several times per day to report on their momentary experiences—but participants do not always answer the beep. Knowing whether there are systematic predictors of missing a report is critical for understanding the extent to which missing data threatens the validity of inferences from ESM studies. Here, 228 university students completed up to four ESM reports per day while wearing the Electronically Activated Recorder (EAR)—an unobtrusive audio recording device—for a week. These audio recordings provided an alternative source of information about what participants were doing when they missed or completed reports (3,678 observations). We predicted missing ESM reports from 46 variables coded from the EAR recordings, and found very little evidence that missing an ESM report was correlated with constructs typically of interest to ESM researchers. These findings provide reassuring evidence for the validity of ESM research among relatively healthy university student samples.
The experience sampling method (ESM) aims to repeatedly capture people’s in-the-moment experiences within the context of their everyday lives (Scollon et al., 2003). In computerized ESM designs, participants are typically “beeped” (e.g., through a smartphone notification) several times per day for 1 or 2 weeks, and asked to complete questionnaires about their experiences in that moment or over a short time frame (e.g., the past hour). By capturing people’s subjective experiences, moods, and thoughts as they go about their everyday lives, the ESM allows behavioral scientists to conduct basic descriptive research about human lives, and to test the ecological validity of phenomena discovered through well-controlled laboratory experiments.
ESM data hold the promise of answering important questions about dynamic processes in everyday life. For example, the ESM has been widely used to answer questions about happiness and emotion dynamics (Csikszentmihalyi & Hunter, 2003; Dejonckheere et al., 2019), within-person variability in personality states (Conner et al., 2009), social interactions (Lucas et al., 2008), attention (McVay et al., 2009), situations (Sherman et al., 2015), and more. In addition, by assessing experiences as they happen—and thereby reducing recall biases—averaging across ESM reports could theoretically provide less biased measures of what a given person is typically like, compared to global self-reports (Conner & Barrett, 2012; cf. Finnigan & Vazire, 2018).
However, there are many potential threats to the validity of ESM reports, including measurement reactivity (i.e., when repeatedly measuring people’s experiences changes what you are trying to measure; Conner & Reid, 2012), response styles and biases (Baird et al., 2017; Finnigan & Vazire, 2018), and participants’ willingness and ability to accurately report on their momentary behavior (Sun & Vazire, 2019). Another potential threat that has been acknowledged but rarely studied is the possibility that participants miss ESM reports in a nonrandom manner (e.g., because of their momentary states on psychological constructs of interest to the researcher, such as mood). In this article, we examine the extent to which missing data threatens the validity of inferences from ESM studies.
When a participant is beeped as they are going about their everyday lives, researchers cannot control whether or not the participant completes the report. As a result, completion rates in ESM studies are far from perfect, with participants typically completing around 70% to 80% of all possible reports (Fleeson & Gallagher, 2009; Rintala et al., 2019). Missing data in ESM studies tends to be “beep-wise” (Silvia et al., 2013), in that participants tend to miss entire reports rather than individual items.
Missing data has two potential consequences: (a) decreased statistical power and (b) bias. Modern missing data methods (i.e., multiple imputation or full information maximum likelihood) can be used to mitigate the effects on statistical power (Graham, 2009; Schafer & Graham, 2002). However, when there are unmeasured causes of missingness, missing data can result in a more serious consequence—biased estimates. For example, if a researcher is interested in studying happiness, it would be concerning if participants are less likely (or more likely) to respond to the beep when they are in a bad mood. This pattern of missingness would not only result in overestimates or underestimates of average happiness but also restrict the range of happiness scores, which would attenuate the correlations between happiness and other variables. Similarly, it would clearly be problematic if a researcher was interested in studying the frequency and effects of alcohol use, but participants were less likely (or more likely) to respond when they had been drinking. Modern missing data methods can be used to minimize bias, but doing so requires that causes or correlates of missingness are measured (using some other method) and included in the analyses. For example, unbiasing the estimate of alcohol use would require having another (nonmissing) variable in the dataset that was also measured and was highly correlated with alcohol use during the same time point (Collins et al., 2001). Because of the beep-wise missing nature of ESM data, such nonmissing “auxiliary” variables are hard to come by.
Several studies have examined potential person-level predictors of missingness. Such studies have found, for example, that men are more likely to miss reports than women (Messiah et al., 2011; Rintala et al., 2019; Silvia et al., 2013; Sokolovsky et al., 2014; Vachon et al., 2019; cf. Courvoisier et al., 2012), and that missingness can be predicted by various clinical and substance use traits (Messiah et al., 2011; Rintala et al., 2019, 2020; Silvia et al., 2013; Sokolovsky et al., 2014; Vachon et al., 2019). Such studies provide insight into who is more likely to miss an ESM report, but do not address the question of when people are more likely to miss an ESM report. Because ESM research typically focuses on time-varying psychological constructs, these momentary behaviors and experiences are potentially the most problematic causes of missingness.
Studies of temporal predictors have generally found that missingness tends to increase across the course of a study (Courvoisier et al., 2012; McLean et al., 2017; Ono et al., 2019; Rintala et al., 2019, 2020; cf. Silvia et al., 2013; Sokolovsky et al., 2014), but have found few consistent effects of the time of the day (Courvoisier et al., 2012; Messiah et al., 2011; Rintala et al., 2019, 2020; Silvia et al., 2013) and day of the week (Courvoisier et al., 2012; Messiah et al., 2011; Rintala et al., 2019, 2020; Sokolovsky et al., 2014). These kinds of studies provide information on the times and days when participants might be more or less likely to respond, but do not answer the question of what people are doing when they miss an ESM report.
Getting closer to this question, a few studies have used lagged predictor models to examine whether experiences at a previous time point predict missingness at the next time point (Rintala et al., 2020; Silvia et al., 2013; Sokolovsky et al., 2014). These studies have found, for example, that participants were more likely to miss the next ESM report when they reported greater feelings of enthusiasm (Silvia et al., 2013) or reported being outside the home (Rintala et al., 2020; Sokolovsky et al., 2014). To the extent that experiences at a given time point persist to the next time point, these findings may provide some indirect information about what people are doing when they miss an ESM report. However, as Silvia and colleagues (2013) point out, “[l]agged effects are not ideal—in a perfect world, one would want to know people’s emotional states at the time of the beep they ignored, not the prior period—but those scores are obviously missing” (p. 478).
Although it is true that self-reported scores are “obviously missing” when participants miss a beep, there are other ways to find out what participants were doing during these moments. Recent methodological developments make it possible to ask ESM participants to concurrently wear devices that unobtrusively and continuously track their behavior (e.g., wearable cameras, Brown et al., 2017; audio recording devices, Mehl, 2017; smartphone sensors, Harari et al., 2016). Such devices provide an alternative source of information on what participants were doing differently when they missed or completed an ESM report. Making use of one such methodological development, McLean and colleagues (2017) found that participants were more likely to miss the beep when FitBit-recorded activity levels were higher during the 5 min leading up to the signal, and when the FitBit was set to the “asleep” mode. McLean and colleagues provided the first evidence that missingness is at least somewhat predictable by what participants are doing in the moment. However, it is unclear what the implications are for the validity of the emotion, behavior, and situational variables that are typically measured in ESM studies.
Our primary goal in this study is to examine the extent to which missing ESM beeps are predictable by participants’ behaviors and experiences during the period that the ESM report targeted. We aimed to examine a large set of potential predictors (described in the “Method” section), which included several measures that are closely related to the constructs typically of interest in ESM research (e.g., emotion, sociability, and situations). To do so, we equipped university student ESM participants with the Electronically Activated Recorder (EAR; Mehl, 2017), an unobtrusive audio recorder that recorded 30-s snippets of participants’ real-world behavior and surroundings every 9.5 min for 1 week. Humans later coded these audio recordings for behaviors and experiences that occurred during the hours that participants were supposed to report on in their ESM reports (“target hours”), essentially allowing us to eavesdrop on what they were doing when they missed or completed an ESM report.
Method
We used data from the first wave of the Personality and Interpersonal Roles Study (PAIRS). Other manuscripts have used this dataset (for a full list of citations, see https://osf.io/3uag4), but the analyses reported here have not been presented elsewhere. Below, we describe the measures and procedures relevant to the current article. Several parts of this description have been closely adapted from previous manuscripts that used variables from the same dataset (Sun et al., 2020; Sun & Vazire, 2019). Codebooks for all measures in the larger study are available at https://osf.io/akbfj/. Although ethical considerations prevent us from making the audio recordings publicly available, the quantitative data, R scripts, and Mplus input and output files required to reproduce the analyses reported in this article are available at https://osf.io/ryszf. We did not preregister any of these analyses, as the data were collected years ago and we were familiar with the dataset. Thus, all results are exploratory and any interesting patterns should be interpreted with caution.
Participants and Procedure Overview
The main study involved 434 students at Washington University in St. Louis, who were recruited in 2012 and 2013 via flyers and classroom announcements across the campus. The sample size of the original study was determined by the stopping rule of ending data collection when we reached the end of a semester and had recruited at least 400 participants. Participants completed a battery of questionnaires during an initial laboratory-based session (US$20 compensation). For the next 2 weeks, 413 of these participants completed ESM measures up to 4 times per day (with the opportunity to win US$100; odds of winning were 1 in 10 if all ESM reports were completed). Of the participants who completed ESM reports, 298 participants wore the EAR for the first week (US$20 compensation), providing audio recordings of their everyday lives that were later coded for behaviors and experiences that occurred during the hours that participants were supposed to report on in their ESM reports.
As shown in Figure 1, we excluded one participant who wore the EAR during the second week (instead of the first week). Because this participant began the EAR recording period having already provided one week’s worth of ESM data, we reasoned that their data had the potential to be systematically different from those of the rest of the sample. We also excluded ESM time points that were not matched with informative EAR data (i.e., when the participant was not wearing the EAR, the EAR malfunctioned, or the EAR coders coded the recordings as uninformative). Finally, we excluded 64 participants (387 time points) who had fewer than 10 matched time points (i.e., ESM time points that were matched with informative EAR data). We made this decision because we only wanted to include participants who were at least somewhat engaged with the ESM protocol (i.e., did not drop out after only 1 or 2 days), and we believed that including participants who had very few observations would add noise because it would limit the true amount of within-person variability in missingness (e.g., if a participant only had one time point, there could be no missing reports to predict, as time points after the last completed report were completely excluded from our analyses rather than being counted as missing; see below). To be sure that our results did not depend on this admittedly arbitrary cutoff, we also ran a robustness check that included all participants with at least one matched time point (summarized at the end of the “Results” section; for details, see Supplemental Material, Section 5).

Flowchart of data exclusions. ESM time points = time points in between participants’ first and last attempted ESM reports, excluding the time points in which participants indicated that they were asleep during the target hour. Matched time points = ESM time points that were matched with informative EAR data.
After these exclusions, 3,678 ESM time points (666 missing, 3,012 completed) from 228 participants remained. The final subset of participants (158 women, 69 men, 1 not reported) used in the current analyses ranged in age from 18 to 29 years (Mage = 19.09, SD = 1.61) and identified as Caucasian (n = 127), Asian (n = 55), Black (n = 20), American Indian or Alaska Native (n = 1), Other or Multiple (n = 19), or did not disclose their ethnicity (n = 6). Attrition analyses (see Table S1) showed that the participants who were excluded from the final analyses were slightly older than the participants who were included (mean difference = 0.78 years, 95% confidence interval [CI] = [0.30, 1.26]), but there was no evidence of selective attrition based on gender, ethnicity, or the Big Five traits. In other words, the final subset of participants was fairly representative of the full sample.
Data Collection Procedures
ESM data collection
Four times per day (at 12:00 p.m., 3:00 p.m., 6:00 p.m., and 9:00 p.m.) for 14 days, participants were emailed a link to an ESM report (available at https://osf.io/xueab/) and also received a text message notification to remind them to complete the survey. These reports measured variables such as emotions (e.g., “How much positive emotion did you experience?”), personality states (e.g., “How ‘outgoing, sociable’ were you?”), behaviors (e.g., “Went to class”), situations (e.g., “In this situation, were you free to behave however you wanted?”), and social interactions (e.g., “were you interacting with other people”) in the hour preceding each report (i.e., the four target hours were 11:00 a.m.–12:00 p.m., 2:00 p.m.–3:00 p.m., 5:00 p.m.–6:00 p.m., and 8:00 p.m.–9:00 p.m.). If participants indicated that they were asleep during the entire hour, they skipped to the end of the report without completing any further questions. Participants were given a 3-hr response window for each report (e.g., they could submit their report for the 11:00 a.m.–12:00 p.m. target hour any time between 12:00 p.m. and 3:00 p.m.); reports submitted after this 3-hr response window were considered late and recoded as being missing.
EAR data collection
During the first week of the 2-week ESM data collection period, 310 participants from the full sample also wore the EAR, an unobtrusive audio recorder. The EAR was implemented through the iEAR app using a locked iPod Touch device provided to participants, and was programmed to record 30-s audio snippets of participants’ ambient sounds every 9.5 min from 7:00 a.m. to 2:00 a.m. The iPod Touch was equipped with a small external microphone that was plugged into the headphone jack (i.e., not a lapel microphone). The EAR component of the study was optional and was only offered during the school year (i.e., nonsummer months) and when iPod Touch devices were available. Participants were asked to wear the EAR as much as possible, on the outside of their clothing (i.e., not in their pockets or a bag). Although there was no way for participants to tell when the device was recording, participants were told that they could decide to not wear the EAR at any time, for any reason.
After 3 to 4 days, participants returned to the laboratory to upload their EAR recordings (due to device memory limitations), continued wearing the device, and returned it after another 3 to 4 days. Upon returning the device, participants received a compact disk with their recordings, so that they could listen to the recordings and ask us to delete any recordings that they did not want the research team to hear. We deleted 99 recordings from 15 participants who requested deletions, recordings from six participants who withdrew, and recordings from one participant who only had silent recordings (suggesting that the microphone malfunctioned).
EAR coding
Coding EAR recordings from all 16 hours for each day for each participant on all variables was not feasible, due to resource constraints. Instead, our priority was to code the files that were recorded during the ESM target hours that participants were asked to report on (i.e., 11:00 a.m.–12:00 p.m., 2:00 p.m.–3:00 p.m., 5:00 p.m.–6:00 p.m., and 8:00 p.m.–9:00 p.m.). Knowing what participants were doing during these target hours is particularly important because the crux of whether missing ESM reports are a problem is whether participants’ data for their missing reports would likely have looked different than the data for their completed reports (e.g., if participants systematically missed reports because they did not want to report that they were acting disagreeable during the target hour).
Across three coding tasks, research assistants coded participants’ behaviors and experiences in the EAR recordings that were recorded during the ESM target hours. Coders who had coded a participant for a given task did not code the same participant in subsequent tasks. Because transcribing participants’ speech is relatively efficient, research assistants transcribed all EAR recordings for all hours, including the 3-hr response windows after the target hours (described below). In contrast, because coding several behaviors and experiences is slower and requires more coders per recording to achieve reliable measurement, we coded only the target hours for these more intensive measures. We split this more intensive coding into two coding tasks (described below), in which variables were coded either once for the entire target hour (“hour-level codings”; for example, a holistic judgment of how extraverted the participant was across all recordings captured during the target hour) or once for every 30-s recording within the target hour (“recording-level codings”; for example, coding whether the participant was socializing or not during each 30-s recording during the target hour).
Transcription
In the first coding task, coders transcribed the recordings. In the first round of transcription, coders listened to each 30-s recording and transcribed all utterances by their participant that were captured by the EAR. In the second round, a different coder checked and edited the transcripts for accuracy. The full transcription procedure is described in a previous article (Sun et al., 2020). Of these three tasks, this was the only coding task that was carried out for all recordings, regardless of whether the recording happened during the ESM target hours. Thus, the transcription data yielded information on participants’ talkativeness not only during the target hours but also during the 3-hr response windows after each of these target hours (which we use in supplemental analyses; see Supplemental Material, Section 6).
Hour-level codings
In the second coding task, for each of their assigned participants, coders listened to the six to seven recordings in each target hour, then rated participants’ personality states, situations, and behaviors using a survey that included observer versions of the items in the ESM report, as well as a few additional items not included in the ESM report. Most of the items in this coding task were coded using Likert-type scales, but a few involved a binary judgment of whether or not a behavior or situation occurred (see Table 1).
EAR Observer–Based Measures Included in This Article.

Note. For coding time frame, “Hour” means that coders listened to all 30-s EAR recordings within the target hour first and then completed a single rating for the hour and “Recording” means that coders listened to and coded each 30-s recording within the target hour separately. All checklist items were recoded to 0 = no, 1 = yes. All recording-level checklist items were preceded by “During this file, was the participant . . .” We used average word count instead of total word count to avoid conflating quantity of speech with the number of valid recordings obtained. EAR = Electronically Activated Recorder.
Only rated if EAR coders believed that the participant had interacted with others in the past hour. bThese four location categories were mutually exclusive.
Because this coding task took several years to complete and research assistants joined and left the lab at different times, each participant was coded by a different set of coders. Initially, we aimed to have each participant coded by three coders. However, as the interrater reliabilities based on three coders were low, we decided to add three more coders, so that each participant was coded by at least six coders (a decision that we made prior to running the analyses for this article). Between the two sets of codings, we made minor changes to the coding protocol (see Supplemental Material, Section 2), in hopes of increasing intercoder reliability. We also dropped some items from the second version of the coding task, such that some items were only coded by three coders on average (for details, see Supplemental Material, Section 2).
In our final analyses, we only included data from hours that at least three coders (i.e., at least half of the intended number of coders) rated as being informative (i.e., no technical problems, and participants appeared to be awake and wearing the EAR; for details, see Supplemental Material, Section 2). Based on these criteria, 807 of 5,222 hours (15.45%) were uninformative (and excluded from further analyses).
Recording-level codings
In the third coding task, coders used an adapted version of the Social Environment Coding of Sound Inventory (SECSI; Mehl & Pennebaker, 2003) coding scheme to code for concrete activities (e.g., on a computer), locations (e.g., indoors), and emotion expressions (e.g., laughing) in each 30-s recording (see Table 1). Like the second task, coders only listened to recordings in the target hours. However, unlike the second task, coders completed an individual survey for each of the six to seven recordings in each hour (instead of one report for the entire hour). For this task, with the exception of one participant who had two coders, all participants who were included in the final analyses were coded by three or more coders. For the final analyses, we only included codings of recordings that at least two coders (i.e., at least half of the intended number of coders) rated as being informative. Based on these criteria, 4,208 of 31,417 recordings (13.4%) were uninformative (and excluded from further analyses).
For each recording, we coded the behavior as not occurring (0) if the majority of coders said that it did not occur, and coded the behavior as occurring (1) if at least half of the coders said that it did occur. Then, we aggregated the recording-level scores to a continuous hour-level score, by taking the mean of all the informative recordings in that hour (up to seven recordings). This continuous variable could range between 0 (behavior did not occur in any of the recordings in that hour) and 1 (behavior occurred in all six or seven recordings in that hour).
Measures
Missingness
Because missing reports were not automatically logged in Qualtrics, we inserted blank rows that represented the ESM reports that each participant had missed between their first attempted ESM report and their last attempted ESM report (if participants opened the survey link, this was logged in Qualtrics and we considered it to be an “attempt”; this is distinct from how we operationalized missing and completed reports). For example, if a participant stopped completing reports 5 days into the study (i.e., effectively dropping out of the ESM protocol), we did not include time points beyond their last attempted report. In other words, instead of treating time points after dropout as being missing, we completely excluded these time points from analyses. This is because we were only interested in which behaviors and experiences predict missing reports during a period in which the participant is still at least somewhat engaged in the protocol. We also excluded time points in which participants used the ESM report to indicate that they were asleep during the target hour.
Of the remaining time points (“ESM time points” in Figure 1), we defined completed reports as ESM reports in which participants completed at least one item on the report, in a timely manner (i.e., within 3 hr of the report being sent). In other words, we recoded late ESM reports that were submitted more than 3 hr after the report was sent as a missing response, treating this as equivalent to a nonresponse (as we did in our past papers using these ESM data). If a participant opened the survey link but did not respond to any questions, we also recoded these reports as a nonresponse.
Time variables
We included three time-related variables: time of the day, day of the study (where 1 = the day on which the participant attempted their first ESM report), and whether it was a weekend (coded as 1) or weekday (coded as 0). We created three dummy variables to model the effects of the time of the day (with the first of the four daily reports of the day as the reference category). Day of the study was treated as a continuous variable ranging from 1 to 9 (although most participants only had up to 8 days of responses matched with EAR recordings because most participants only wore the EAR for 6–8 days), and we modeled its linear and quadratic effects.
EAR variables
Decisions about which EAR variables to code were based on a larger research team’s substantive research interests, rather than the aims of the current article. In Table 1, we list the variables that were included in the current analyses. We included variables from the three EAR coding tasks that were completed or were close to completion when we conceptualized this project. A few additional variables (available in the codebooks on the OSF) were coded as part of these three tasks, but we decided not to include them because of concerns about low reliability, validity, and base rates. We also did not include variables from a fourth task that involved coding additional interpersonal behaviors (reported in Sun, 2020) because these codings were in the early stages when the current project was conceptualized.
Data Analysis
The data had a multilevel structure, with observations (Level 1) nested within participants (Level 2). We used Mplus Version 8.3 (Muthén & Muthén, 2017) to compute within-person omega (ωWP) reliability estimates based on multilevel confirmatory factor analyses (Geldhof et al., 2014), in which each coder was treated as an indicator, with equal factor loadings and residuals (for details, see Supplemental Material, Section 3). For the key analyses, we used multilevel logistic regression, implemented using the R packages lme4 (Bates et al., 2015) and lmerTest (Kuznetsova et al., 2017), to examine the within-person predictors of missing ESM reports (1 = missing, 0 = completed). We used random intercepts models to account for between-person differences in average rates of missingness. All EAR predictors were centered around each person’s mean.
Overall predictive accuracy
First, we compared the overall predictive value of a model that included time predictors and all 46 EAR predictors (full model) with a model that only included time predictors (time-only model) or only included random intercepts (null model). We used two general approaches to compare these models: classification accuracy and several pseudo-R2 statistics (described below). For the full models, as there was some missingness among the EAR predictors, we used multiple imputation using predictive mean matching, implemented via the R package mice (van Buuren & van Groothuis-Oudshoorn, 2011), to generate five imputed datasets. Then, we computed the statistics below for each of the five imputed datasets, and report the mean estimates across the five datasets.
Classification accuracy
Classification accuracy describes the total proportion of ESM reports that the model correctly predicted as being missing or completed. We used a threshold of .50, such that time points with a predicted probability of >.50 were classified as being missing, and all other reports were classified as being completed. We report overall accuracy, as well as sensitivity (the proportion of missing reports that were correctly classified as being missing) and specificity (the proportion of completed reports that were correctly classified as being completed).
Pseudo-R2
There is no variance-explained measure for binary outcomes that has the same properties and interpretation as a conventional R2 measure in linear regression, but several pseudo-R2 measures have been proposed. Because there is no clear consensus on which metric is most appropriate, we used three different pseudo-R2 measures.
McFadden’s R2. McFadden’s (1974) R2 is defined as:

where log(Lc) denotes the log-likelihood of the current fitted model and log(Lnull) denotes the log-likelihood of the null model (which only contains the random intercepts).

Because

Tjur’s coefficient of discrimination. Tjur (2009) proposed an R2 measure for logistic regression models, which he called the coefficient of discrimination. This is defined as the difference between the mean model-predicted probability across missing reports (

Single-predictor models
To examine the effects of individual predictors, we computed 46 separate multilevel models (i.e., one for each predictor of interest). All models controlled for the time of the day, day of the study (linear and quadratic effects), and whether it was a weekend or weekday.
Between-person analyses
Although the focus of this investigation was on within-person effects, for interested readers, we also computed between-person correlations between each person’s mean on each predictor and their overall percentage of missing reports. We report these supplemental analyses in Supplemental Material (Section 7; see Table S6).
Results
Descriptive statistics are shown in Table 2. With a few exceptions (e.g., sighing, sounded tired, in a meeting), the within-person reliability coefficients suggested that EAR coders were generally able to reliably detect fluctuations in participants’ behaviors and experiences.
Descriptive Statistics.
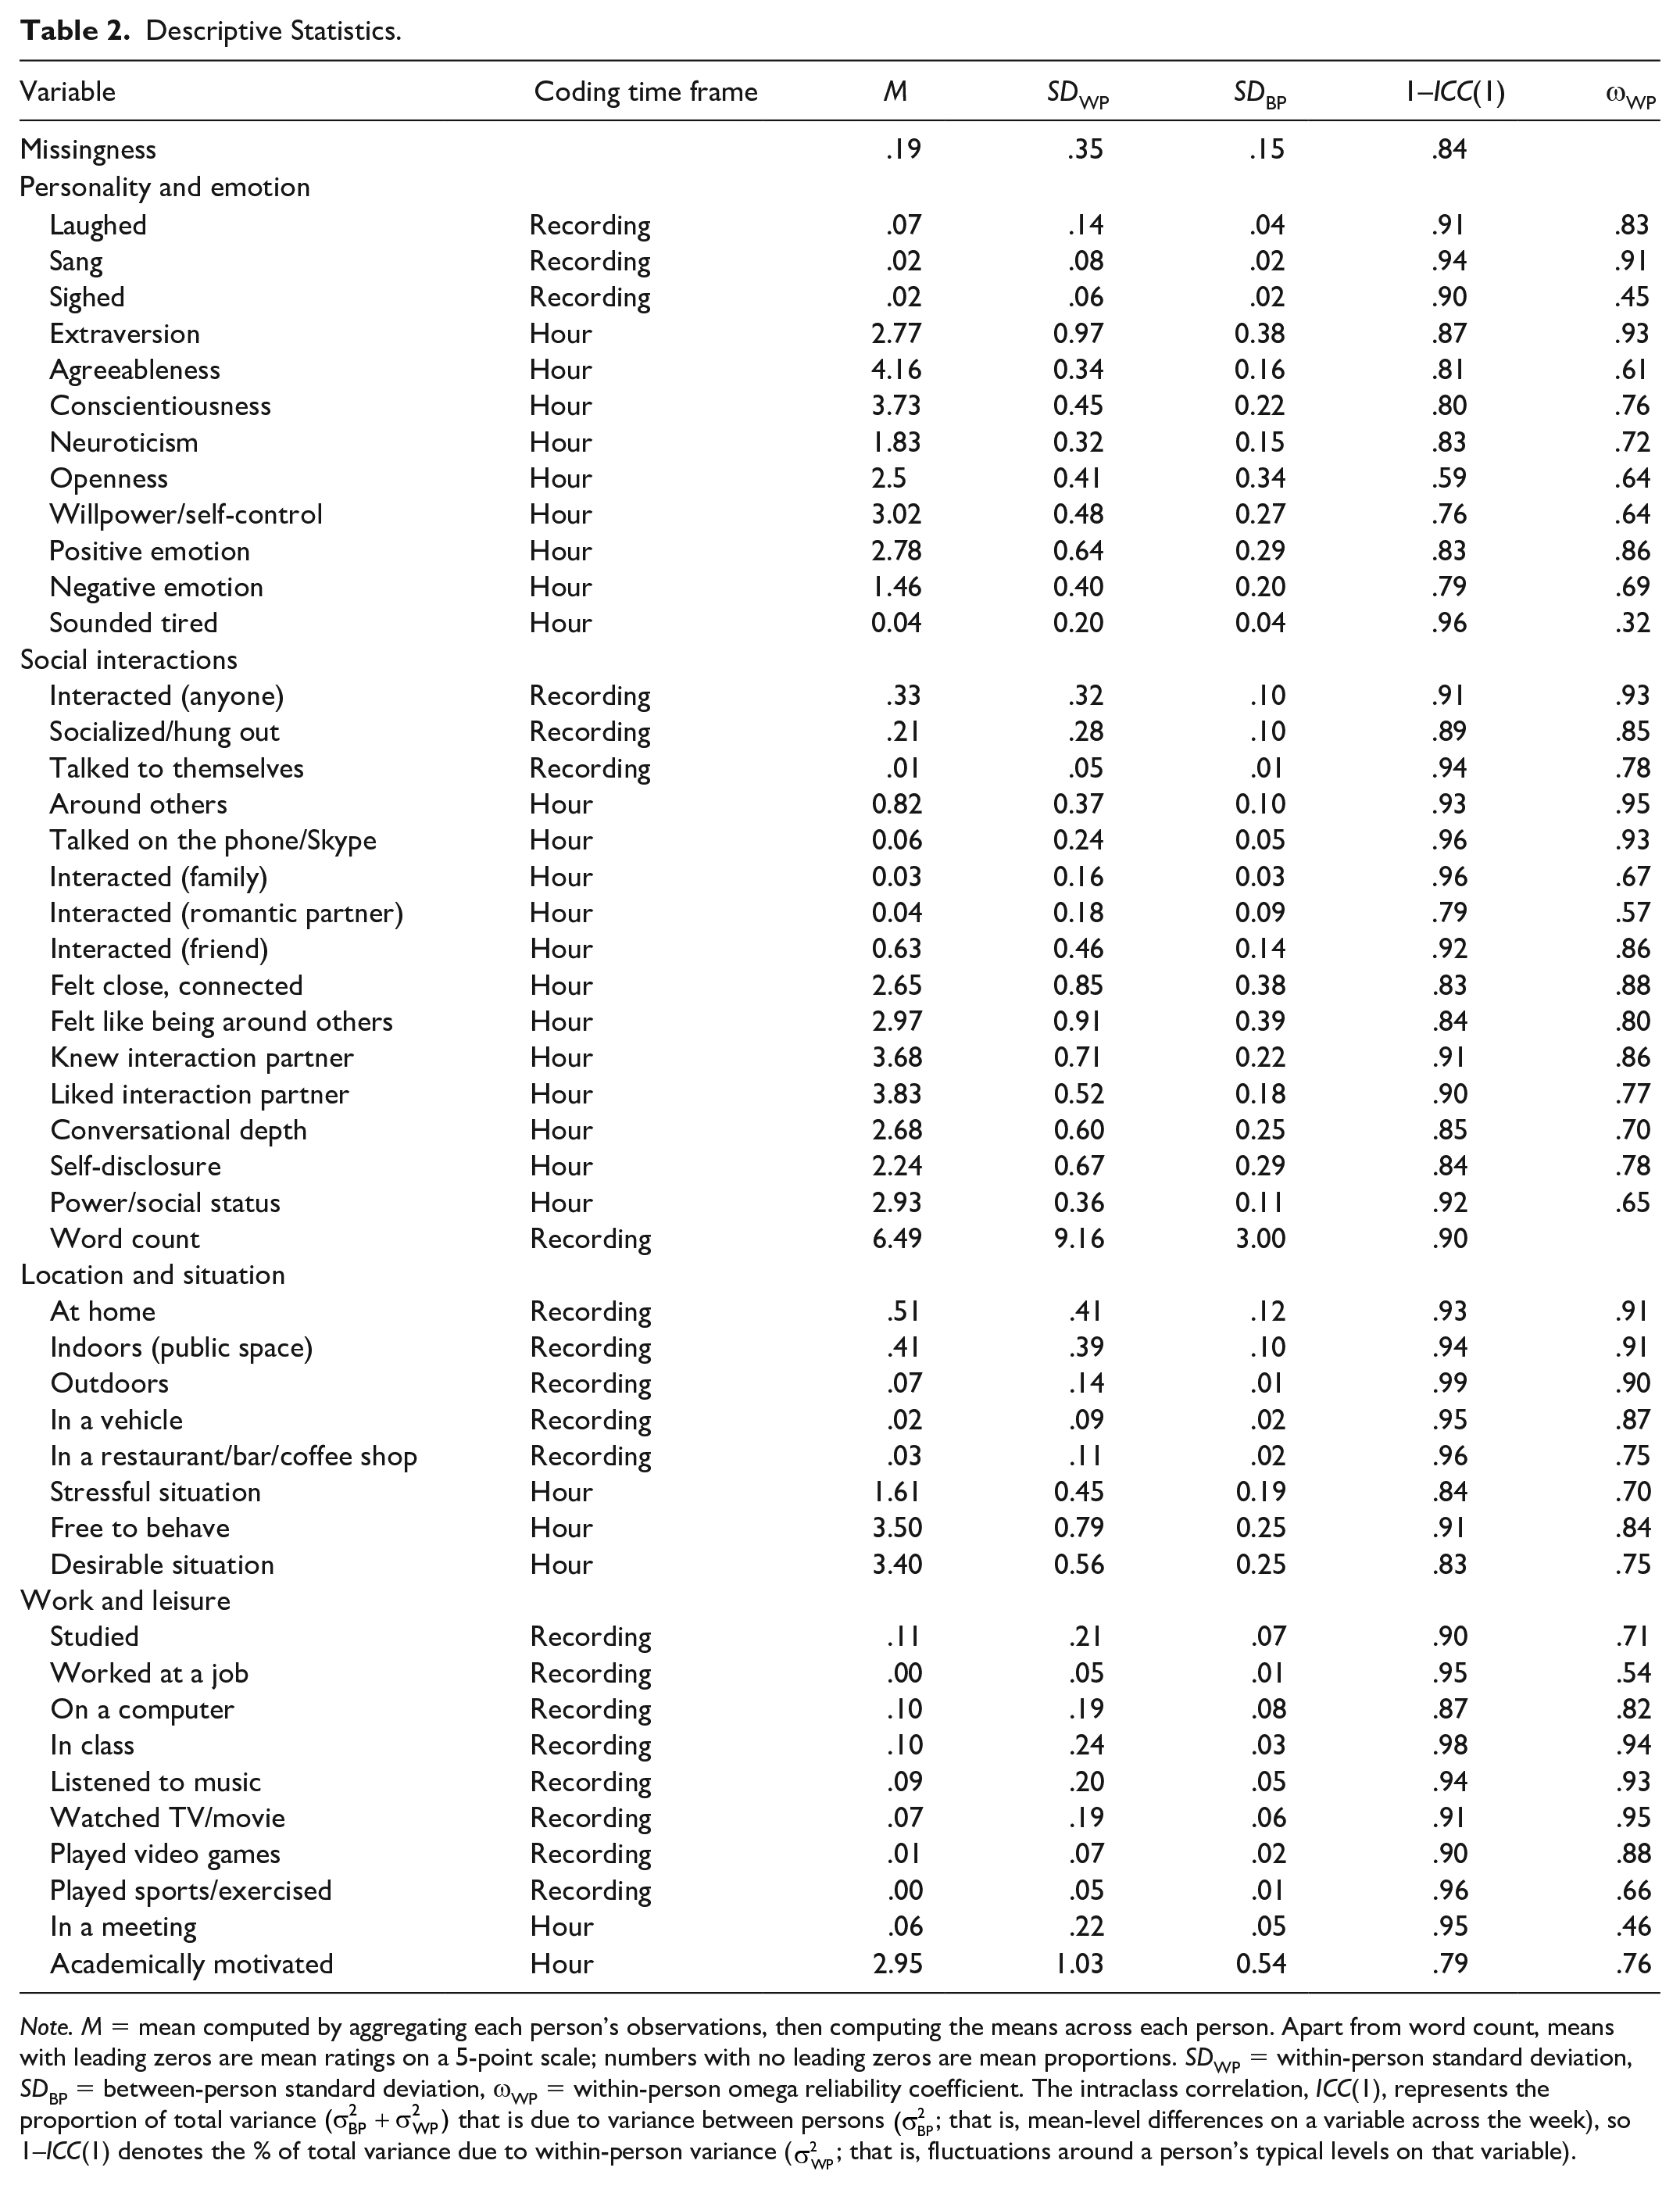
Note. M = mean computed by aggregating each person’s observations, then computing the means across each person. Apart from word count, means with leading zeros are mean ratings on a 5-point scale; numbers with no leading zeros are mean proportions. SDWP = within-person standard deviation, SDBP = between-person standard deviation, ωWP = within-person omega reliability coefficient. The intraclass correlation, ICC(1), represents the proportion of total variance
How Predictable is Missingness?
Our first aim was to assess the extent to which missingness was predictable by participants’ behaviors and experiences, as observed through the EAR recordings. We used two methods to do so. First, we examined the overall classification accuracy, sensitivity, and specificity of a null model (which only included information on the overall rate of missingness in the entire sample as well as random intercepts that captured how much each participant tended to miss reports on average), a time predictor model that added three time predictors (time of the day, day of the study, and weekday vs. weekend), and a full model that added all 46 EAR variables (in addition to the time predictors and random intercepts).
As shown in Table 3, a null model that only had information on sample-wide levels and between-person differences in missingness was able to correctly classify 82.7% of the reports as being missing or completed. In other words, knowing the overall rate of missingness and which participants generally tended to miss more or fewer reports provided quite a strong basis for predicting whether or not a given report was missing or completed. Adding time predictors only slightly improved the overall accuracy (by 0.7%). Finally, adding the set of 46 EAR predictors only increased the overall accuracy by a modest 0.5%.
Classification Accuracy and Pseudo R2s for Null, Time Predictor, and Full Models.
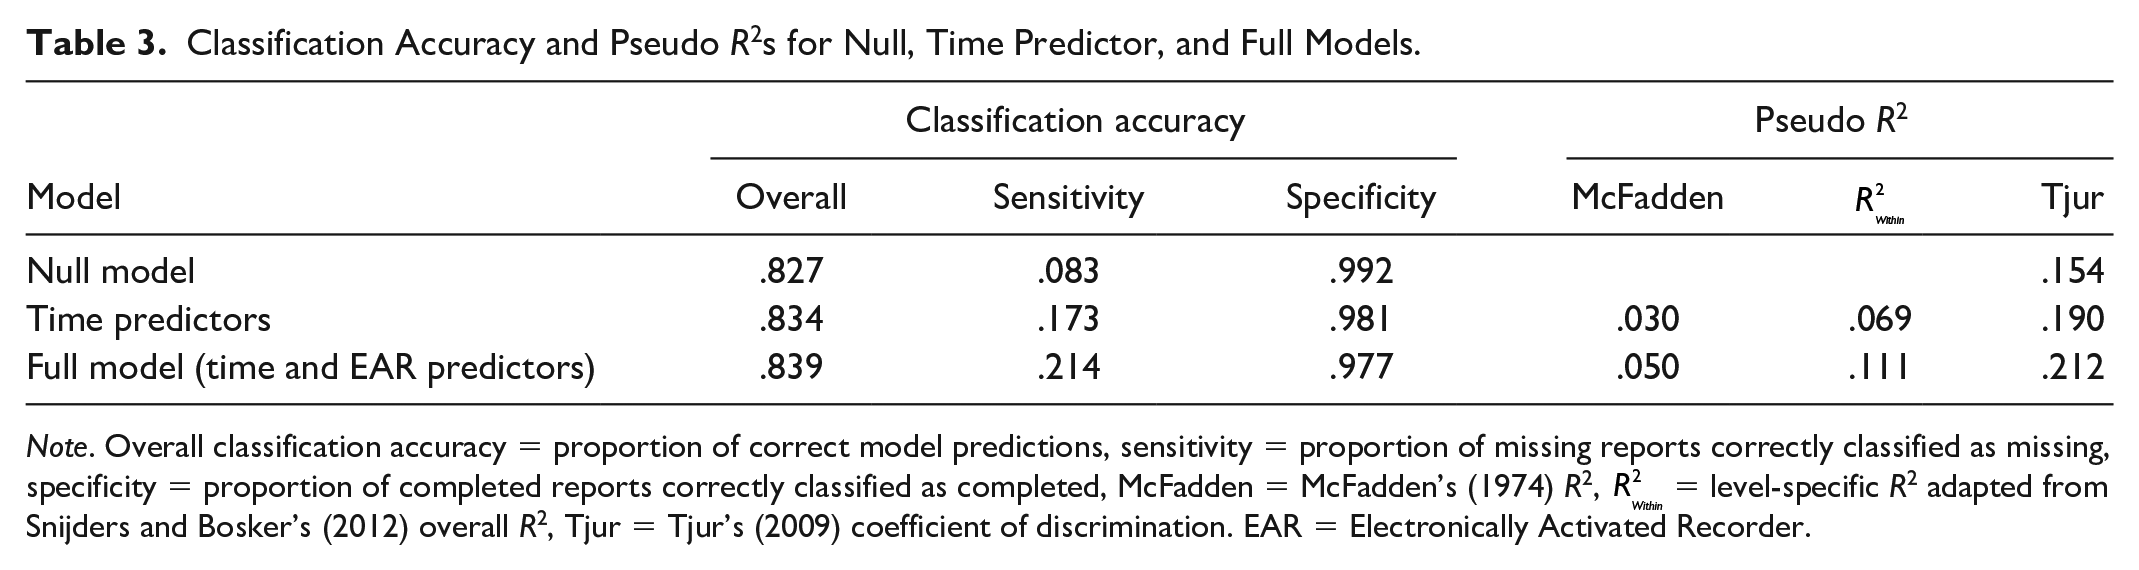
Note. Overall classification accuracy = proportion of correct model predictions, sensitivity = proportion of missing reports correctly classified as missing, specificity = proportion of completed reports correctly classified as completed, McFadden = McFadden’s (1974) R2,
The relatively high overall accuracy of these models was driven mainly by high specificity: The models almost always correctly classified completed reports as being completed. However, all three models had relatively low sensitivity, incorrectly classifying a large proportion of reports as being completed when they were actually missing. Compared to the time predictor model, the full model showed a 4.1% improvement in sensitivity, at a trade-off of a 0.4% decrease in specificity. However, even with this improvement in sensitivity, the full model was only able to correctly classify 21.4% of missing reports as being missing.
The pseudo R2 statistics (see Table 3) varied more in their absolute magnitudes, but converged on a similar conclusion: Adding the EAR variables increases the amount of variance explained, but only by a very modest amount (in the 2%–4.2% range) compared to a model that contains only time predictors. Therefore, overall, knowing something about the participants’ momentary behaviors and experiences did not add much more predictive value, compared to simply knowing the overall rate of missingness and which participants tended to miss more or fewer reports on average (null model), and the time of the day, day of the study, and whether it was a weekend or weekday (time-only model).
When Do University Students Miss More Reports?
Time and day predictors
Next, we examined whether participants were more likely to miss reports during specific times of the day, days of the study, and on weekends or weekdays, in three separate models. As shown in Figure 2 and Table 4, participants were more likely to miss reports during the latter two time points (5:00 p.m.–6:00 p.m. and 8:00 p.m.–9:00 p.m.), compared to the first two time points (11:00 a.m.–12:00 p.m. and 2:00 p.m.–3:00 p.m.). In addition, we replicated the well-established finding (Courvoisier et al., 2012; McLean et al., 2017; Ono et al., 2019; Rintala et al., 2019, 2020; cf. Silvia et al., 2013; Sokolovsky et al., 2014) that missingness increased over the course of the study (even though this analysis already excludes time points after participants completely stopped responding to the reports). Finally, there was no evidence that participants were more or less likely to miss reports on weekends compared to weekdays.

Proportion of missing reports across the days of the study, times of the day, and weekdays versus weekends. Only results up to Day 8 are depicted, as only 12 time points were on Day 9. Error bars depict 95% confidence intervals.
Multilevel Logistic Regression Predicting Missingness from Time and Day Variables.
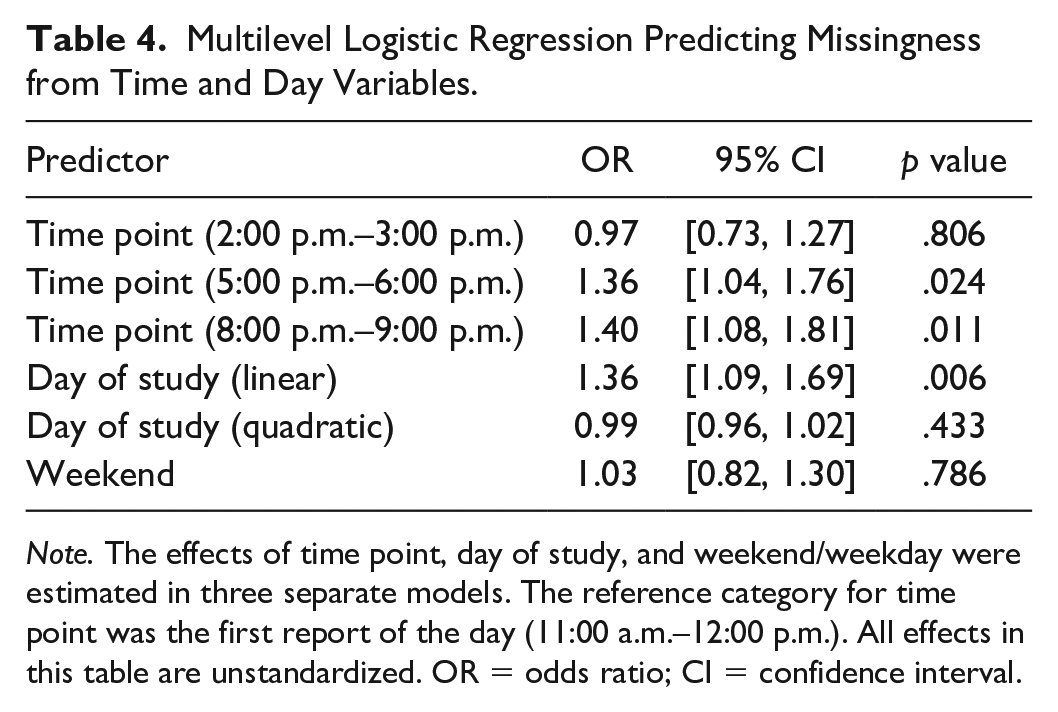
Note. The effects of time point, day of study, and weekend/weekday were estimated in three separate models. The reference category for time point was the first report of the day (11:00 a.m.–12:00 p.m.). All effects in this table are unstandardized. OR = odds ratio; CI = confidence interval.
EAR predictors
Although missingness was relatively unpredictable by the full set of EAR variables, examining the effects of individual predictors could shed light on the specific everyday behaviors and experiences that might predict missingness. Therefore, we examined the effects of each EAR predictor in a separate model, controlling for all time variables. Of the 46 analyses we ran (see Figure 3 and Table S2), only four predictors were significant under a conventional uncorrected p < .05 criterion, which we use as a heuristic for suggestive results. These suggestive results should be interpreted very cautiously because none of them survived a false discovery rate correction (Benjamini & Hochberg, 1995), nor were any of them significant at the stricter alpha level of .005 suggested by some for new discoveries (Benjamin et al., 2018). Nevertheless, these effects suggest that participants were more likely to miss a report when they were around others (vs. alone) during the ESM target hour and were less likely to miss a report when they spent more time on a computer, when they talked on the phone/Skype, and when they talked more during the ESM target hour.

Within-person odds ratios (ORs) for multilevel logistic regressions predicting missingness from single-predictor models (i.e., each predictor was tested in a separate model), controlling for time variables. ORs were computed by exponentiating the standardized β coefficients. Results are sorted by the standardized point estimates. Error bars depict 95% confidence intervals (not corrected for multiple comparisons). No estimates survived a false discovery rate correction. All numbers are reported in Table S2.
The finding that participants were less likely to miss ESM reports when they were on a computer seems reasonable, as participants were able to complete reports either on a computer or on their phone. At first, the association between being around others and greater missingness also seems to suggest that participants might be more likely to miss an ESM report when they are engaged in social activities. However, several other indicators of social activity were either negatively related, or did not have detectable associations with missingness. For example, participants were less likely to miss an ESM report when they talked more during the hour targeted by the ESM report. Moreover, other more obvious indicators of sociability (interacting with anyone, interacting with specific interaction partners, socializing/hanging out, and extraversion) were not consistently associated with missing an ESM report. Thus, this set of results provides mixed evidence about whether university students are more or less likely to miss ESM reports when they are being more sociable.
Notably, none of the indicators of momentary emotion (positive and negative emotion, neuroticism, laughing, singing, and sighing) seemed to be detectably related to missingness. This is quite reassuring, given that happiness and emotion are so frequently the constructs of interest in ESM studies (e.g., Dejonckheere et al., 2019; Quoidbach et al., 2019).
One important caveat is that the estimates were fairly imprecise; the 95% CIs indicate that we cannot rule out small to moderate effects in either direction. However, as a whole, we found very few meaningful individual predictors of missingness, even when using a fairly liberal threshold for suggestive results. This is consistent with the results of the overall predictive accuracy model, which showed that adding the full set of 46 variables barely improved the prediction of missingness.
Robustness Check
Finally, to ensure that our results did not depend on our arbitrary decision to exclude participants who had fewer than 10 matched time points, we reran these analyses using the larger subset of 292 participants who had at least one matched time point (4,065 time points in total). This robustness check produced very similar estimates and continued to provide little evidence that these 46 EAR variables predicted missing ESM reports (see Supplemental Material, Section 5).
Discussion
When participants are beeped and asked to complete ESM reports several times per day for many days, they do not always respond to each beep. To find out how worried ESM researchers should be about this, we eavesdropped on whether university student participants were doing anything different when they missed ESM reports, compared to when they completed them. We measured participants’ behaviors and experiences during the time window that the ESM report would have targeted, and attempted to measure constructs that are frequently of interest to ESM researchers (i.e., constructs that participants might have reported on if they had completed the ESM report). We found that missingness could barely be predicted by a broad set of 46 observer-based measures of psychologically relevant variables included in this study. We also found surprisingly few detectable effects of individual predictors, even when using a fairly liberal threshold for suggestive results.
Is this good news for ESM researchers? Although the relatively imprecise estimates do not allow us to rule out small to moderate effects, our results generally suggest that university students’ missing ESM reports were not obviously predictable by many variables of interest to ESM researchers (e.g., sociability and emotion). This is quite reassuring, given the large numbers of studies that rely on ESM in university student samples to draw conclusions about momentary happiness, emotion dynamics, personality states, social interactions, and situations in everyday life (e.g., Fleeson & Gallagher, 2009; Sherman et al., 2015; Sun et al., 2019; Weidman & Dunn, 2016).
However, these results are not the last word on the causes of missing ESM reports, and should be interpreted with the following limitations and constraints on generality in mind. The reasons for missingness might be quite different for populations that have lifestyles, demands, and traits that are substantially different than those of university students (e.g., working adults, parents, clinical populations, older adults). Compared to other ESM studies, we also had a fairly long response window (3 hr), and used a fixed timing schedule (i.e., participants were beeped at the same 4 times every day, and were asked about the same 4 target hours). Future studies should examine whether the predictability and predictors of missingness differ for ESM protocols that feature shorter response windows and variable or event-contingent timing.
Although we measured many everyday behaviors and experiences that are of interest to ESM researchers, the EAR only allowed us to capture acoustically detectable aspects of participants’ behaviors and experiences, and we did not code all audible variables that could possibly predict missing an ESM report. Just as previous research suggests that missingness can be predicted by higher activity levels leading up to the signal (McLean et al., 2017), future studies should use alternative unobtrusive methods to continue to test whether missing an ESM report can be predicted by behaviors beyond what can be captured by the EAR (e.g., using wearable cameras or smartphone sensing; Brown et al., 2017; Harari et al., 2016).
In this investigation, we focused on asking whether participants’ behaviors during the hours that were targeted by the ESM reports predicted whether or not they completed the report. We found little evidence for the concern that participants’ data for their missing reports would have looked different than the data for their completed reports. One possibility is that missingness might be better predicted by what participants were doing during the response window (i.e., the period in which they were supposed to complete the ESM report) than by what they were doing during the hour targeted by the ESM reports (i.e., the period about which they were reporting). Of the 46 variables, we only had data on one variable, participants’ talkativeness, during these 3-hr response windows (as opposed to the 1-hr window targeted by the ESM survey), and found no evidence that talkativeness during the response window predicted missingness (see Supplemental Material, Section 6). Future studies could more systematically examine this issue to further shed light on causes of missingness; importantly, however, such investigations would not tell us what participants would have reported about their behavior and experiences during the hour targeted by the missing ESM reports (and therefore the potential threat of bias due to nonrandom patterns of missing reports).
Finally, in the absence of definitive evidence that missing data is not a problem, the best way to eliminate its potential threat is for researchers to do whatever they can to prevent missing reports. To do so, researchers can implement technical solutions (e.g., additional reminders if participants do not respond to the first notification) and take steps to reduce participant burden and increase motivation. One promising strategy for reducing participant burden is to use planned missing data designs that reduce the number of items per report or the number of reports per day (Silvia et al., 2014). Future research on optimal sampling strategies could also improve the efficiency of ESM designs by establishing the number and frequency of assessments that are required for different constructs and research questions. Researchers should also aim to increase participant motivation, for example, by incentivising participants with detailed feedback based on their ESM responses (for more strategies, see Conner & Lehman, 2012). Such strategies would likely increase both the quantity and quality of ESM data.
Conclusion
Participants inevitably miss some ESM reports, but what are they doing differently when this happens? Our results suggest that the answer for university students might be “not that much,” at least across a set of 46 measures of acoustically detectable everyday behaviors and experiences. This provides some reassurance that university student participants might not be systematically missing ESM reports when they are, for example, in a bad mood or being disagreeable. Still, future research should continue to examine potential predictors of missingness across different populations and ESM protocols, and to actively prevent missing reports in the first place.
Supplemental Material
sj-docx-1-psp-10.1177_0146167220964639 – Supplemental material for Eavesdropping on Missing Data: What Are University Students Doing When They Miss Experience Sampling Reports?
Supplemental material, sj-docx-1-psp-10.1177_0146167220964639 for Eavesdropping on Missing Data: What Are University Students Doing When They Miss Experience Sampling Reports? by Jessie Sun, Mijke Rhemtulla and Simine Vazire in Personality and Social Psychology Bulletin
Supplemental Material
sj-docx-2-psp-10.1177_0146167220964639 – Supplemental material for Eavesdropping on Missing Data: What Are University Students Doing When They Miss Experience Sampling Reports?
Supplemental material, sj-docx-2-psp-10.1177_0146167220964639 for Eavesdropping on Missing Data: What Are University Students Doing When They Miss Experience Sampling Reports? by Jessie Sun, Mijke Rhemtulla and Simine Vazire in Personality and Social Psychology Bulletin
Footnotes
Acknowledgements
We are grateful to the many research assistants who helped run the study and code the Electronically Activated Recorder recordings, and to Brittany Solomon, Kathryn Bollich, Robert Wilson, Kelci Harris, and Katie Finnigan for supervising data collection and coding.
Author Contributions
S. V. acquired funding, designed, and supervised data collection for the broader Personality and Interpersonal Roles Study. J.S. conceptualized this project, supervised Electronically Activated Recorder coding, curated and analyzed the data, and drafted the article. M.R. and S.V. provided extensive feedback on analytic decisions and interpretations. All authors provided critical revisions to the article and approved the final article for submission.
Declaration of Conflicting Interests
The author(s) declared no potential conflicts of interest with respect to the research, authorship, and/or publication of this article.
Funding
The author(s) disclosed receipt of the following financial support for the research, authorship, and/or publication of this article: Data collection for this article was supported by a Grant from the National Science Foundation to Simine Vazire (BCS-1125553).
Supplemental Material
Supplemental material is available online with this article.
References
Supplementary Material
Please find the following supplemental material available below.
For Open Access articles published under a Creative Commons License, all supplemental material carries the same license as the article it is associated with.
For non-Open Access articles published, all supplemental material carries a non-exclusive license, and permission requests for re-use of supplemental material or any part of supplemental material shall be sent directly to the copyright owner as specified in the copyright notice associated with the article.