
Abstract
The use of the Implicit Association Test (IAT) as a measure of individual differences is stymied by insufficient test–retest reliability for assessing trait-level constructs. We assess the degree to which the IAT measures individual differences and test a method to improve its validity as a “trait” measure: aggregating across IATs. Across three studies, participants (total n = 960) completed multiple IATs in the same session or across multiple sessions. Using latent-variable models, we found that half of the variance in IAT scores reflects individual differences. Aggregating across multiple IATs approximately doubled the variance explained with explicit measures compared with a single IAT D-score. These findings show that IAT scores contain considerable noise and that a single IAT is inadequate to estimate trait bias. However, aggregation across multiple administrations can correct this and better estimate individual differences in implicit attitudes.
Few concepts in psychology have been as influential as implicit bias (Greenwald & Lai, 2020). The most popular method for measuring implicit bias has been the Implicit Association Test (IAT; Greenwald et al., 1998), a task designed to measure automatic evaluations of concepts by assessing how quickly people sort stimuli into categories. The IAT is used throughout psychology in areas such as prejudice (Kurdi et al., 2019), consumer preference (Friese et al., 2006), clinical psychology (Nock et al., 2010), and personality (Fatfouta & Schröder-Abé, 2018). However, the IAT has lower-than-desired test–retest correlations, suggesting that single IAT scores may contain considerable measurement error or that the underlying construct is unstable (test–retest r = .49, Lai & Wilson, 2021; see Connor & Evers, 2020; Gawronski et al., 2017; Lane et al., 2007; Payne et al., 2017). Consequently, a single IAT score is not a reliable measure of chronic individual differences in tendencies toward a particular implicit bias (i.e., ‘trait bias’ 1 ), for which test–retest correlations of .70+ are often considered desirable (Cicchetti, 1994; Matheson, 2019). We explore a potential solution to this unreliability, aggregating several IATs together within persons to estimate trait bias and better reveal relations with self-report measures. We further explore whether unreliability in IAT scores is better explained by measurement error within scores or instability in the mental processes themselves.
States, Traits, and Noise in the IAT
The IAT was developed as a measure of automatic evaluations (Greenwald et al., 1998). The meaning of the construct has been vigorously debated over the years (e.g., De Houwer, 2014; Gawronski & Bodenhausen, 2006, 2011; Schwarz, 2007; Strack & Deutsch, 2004, 2015; Wilson et al., 2000). Many theorists have described implicit “attitudes” in trait-like terms, emphasizing stability and durability (Petty et al., 2006; Wilson et al., 2000), origins in past/enduring experiences (Greenwald & Banaji, 1995; Rudman, 2004; Rudman et al., 2007), or representation in associative networks that change gradually (e.g., Strack & Deutsch, 2004, 2015). Researchers taking such an approach may therefore be interested in individual differences, presuming that IAT scores say something about participants’ stable/enduring dispositions. A common design is to administer a single IAT and predict individual differences in constructs such as self-reported attitudes (Hofmann et al., 2005), religiosity (e.g., Gervais et al., 2011), discrimination (Agerström & Rooth, 2011; Glover et al., 2017), mental health (Nock et al., 2010), smoking (Perugini, 2005), and environmental behavior (Brick & Lai, 2018). These associations are often interpreted as representing the degree to which individual differences in implicit attitudes contribute to these outcomes.
Unfortunately for researchers interested in individual differences, an individual IAT score appears to be an unreliable trait measure. We refer to individual differences in tendencies toward a particular implicit response as “trait bias” (a personal baseline); we differentiate that from meaningful, temporary departures from trait bias, which we refer to as “state bias.” With respect to trait bias, an individual IAT score is insufficiently reliable. IAT test–retest correlations are lower than for self-report measures and tend to be on the low end for an individual-difference measure (Brownstein et al., 2019; Connor & Evers, 2020; Cunningham et al., 2001; Gawronski et al., 2007, 2017). A meta-analysis by Lai and Wilson (2021) estimates that test–retest reliability of intergroup IAT scores is r = .49. Other studies have reported similar numbers (e.g., r = .54, Gawronski et al., 2017; r = .50, Lane et al., 2007). This implies that approximately 50% of the variability in IAT scores may not represent underlying individual differences (Connor & Evers, 2020; Greenwald et al., 2022). However, most of these studies are re-administrations of the same or similar IAT with no attempt to match methodological features such as block order (e.g., Connor & Evers, 2020; Lane et al., 2007). This raises questions as to the nature/degree of instability in the IAT.
What do low test–retest correlations imply? One interpretation is that single IAT scores contain extraneous variation (i.e., random noise and measurement error; Buttrick et al., 2020; Connor & Evers, 2020). Several authors have criticized a failure to account for measurement error within the IAT (e.g., Kurdi et al., 2019) and argued that measurement error accounts for low test–retest reliability and correlations with other constructs (Buttrick et al., 2020; Connor & Evers, 2020; Kurdi et al., 2019). Measurement error within the IAT may also account for the fact that group-level aggregates of IATs (e.g., county-level averages) tend to predict outcomes better than do individual scores (Connor & Evers, 2020; Hehman et al., 2019). According to this perspective, the IAT is a “noisy” trait measure. If so, then relationships between the IAT and self-report or behavioral measures would be underestimated (Forscher et al., 2019; Hofmann et al., 2005; Kurdi et al., 2019), as measurement error necessarily attenuates correlations (Spearman, 1904) and undermines attempts at statistical control (Cohen et al., 2003).
An alternate perspective is that IAT scores contain a considerable “state” component, assessing constructs that are akin to mental accessibility or emotions. The stability of implicit measures may depend on the mental representations activated when taking the test (Gawronski & Bodenhausen, 2011; Gawronski et al., 2017). For example, De Houwer (2001) demonstrated that foreigner-attitudes IAT scores could be swayed by either positive exemplars (e.g., Einstein) or negative exemplars (e.g., Hitler). A similar argument was made by Baron (2015) and Payne et al. (2017), who argued that IAT scores reflect local social environments (see Smith, 1996). From this perspective, low stability in IAT scores may reflect the contextual nature of implicit bias (e.g., Gawronski & Bodenhausen, 2017). In other words, a single IAT score may not be a reliable measure of trait bias because a considerable proportion of one’s score represents state bias.
Both accounts described earlier agree—a single IAT score is not a reliable measure of trait bias. If researchers seek individual differences in implicit bias, then both measurement error and state-based variation will interfere. Better estimates of trait bias are needed.
The Present Research
A potential solution is through aggregation. Research on region-level variation in implicit biases accomplishes this by aggregating across individuals (Hehman et al., 2019). However, aggregating across groups of people does not allow for the possibility of measuring individual differences. To aggregate for individual differences, researchers must aggregate across multiple administrations within individuals. This approach underlies the uses of multi-item scales—although a single item may be an unreliable trait measure, an aggregate of several items is often more reliable (Nunnally, 1967). A similar process is used in personality research to aggregate over states (e.g., Finnigan & Vazire, 2018). Thus, one solution may be to administer several IATs to participants and calculate an aggregate total, allowing trait bias to be studied.
One option is calculating a sum score from several IAT D-scores. For example, Greenwald et al. (2022) found that a sum over eight IATs was considerably more test–retest reliable (r = .89) than is common for the IAT. However, the number of IATs required via sum scores may be prohibitive, depending on the desired level of reliability. 2 An alternative method is to use confirmatory factor analysis (CFA; Brown, 2015), which extracts a latent trait factor from several repeatedly-administered IATs (Figure 1A). In this approach, IAT scores are modeled as a function of the latent trait and a residual. The latent variable estimates the component of IAT scores that is stable across administrations (i.e., individual differences), whereas residuals represent the component that is unstable (i.e., a combination of state fluctuations and measurement error; c.f., Brown, 2015; Geiser, 2012). We use this approach to assess how trait and non-trait components of variance in IAT scores behave and correlate with self-report measures.
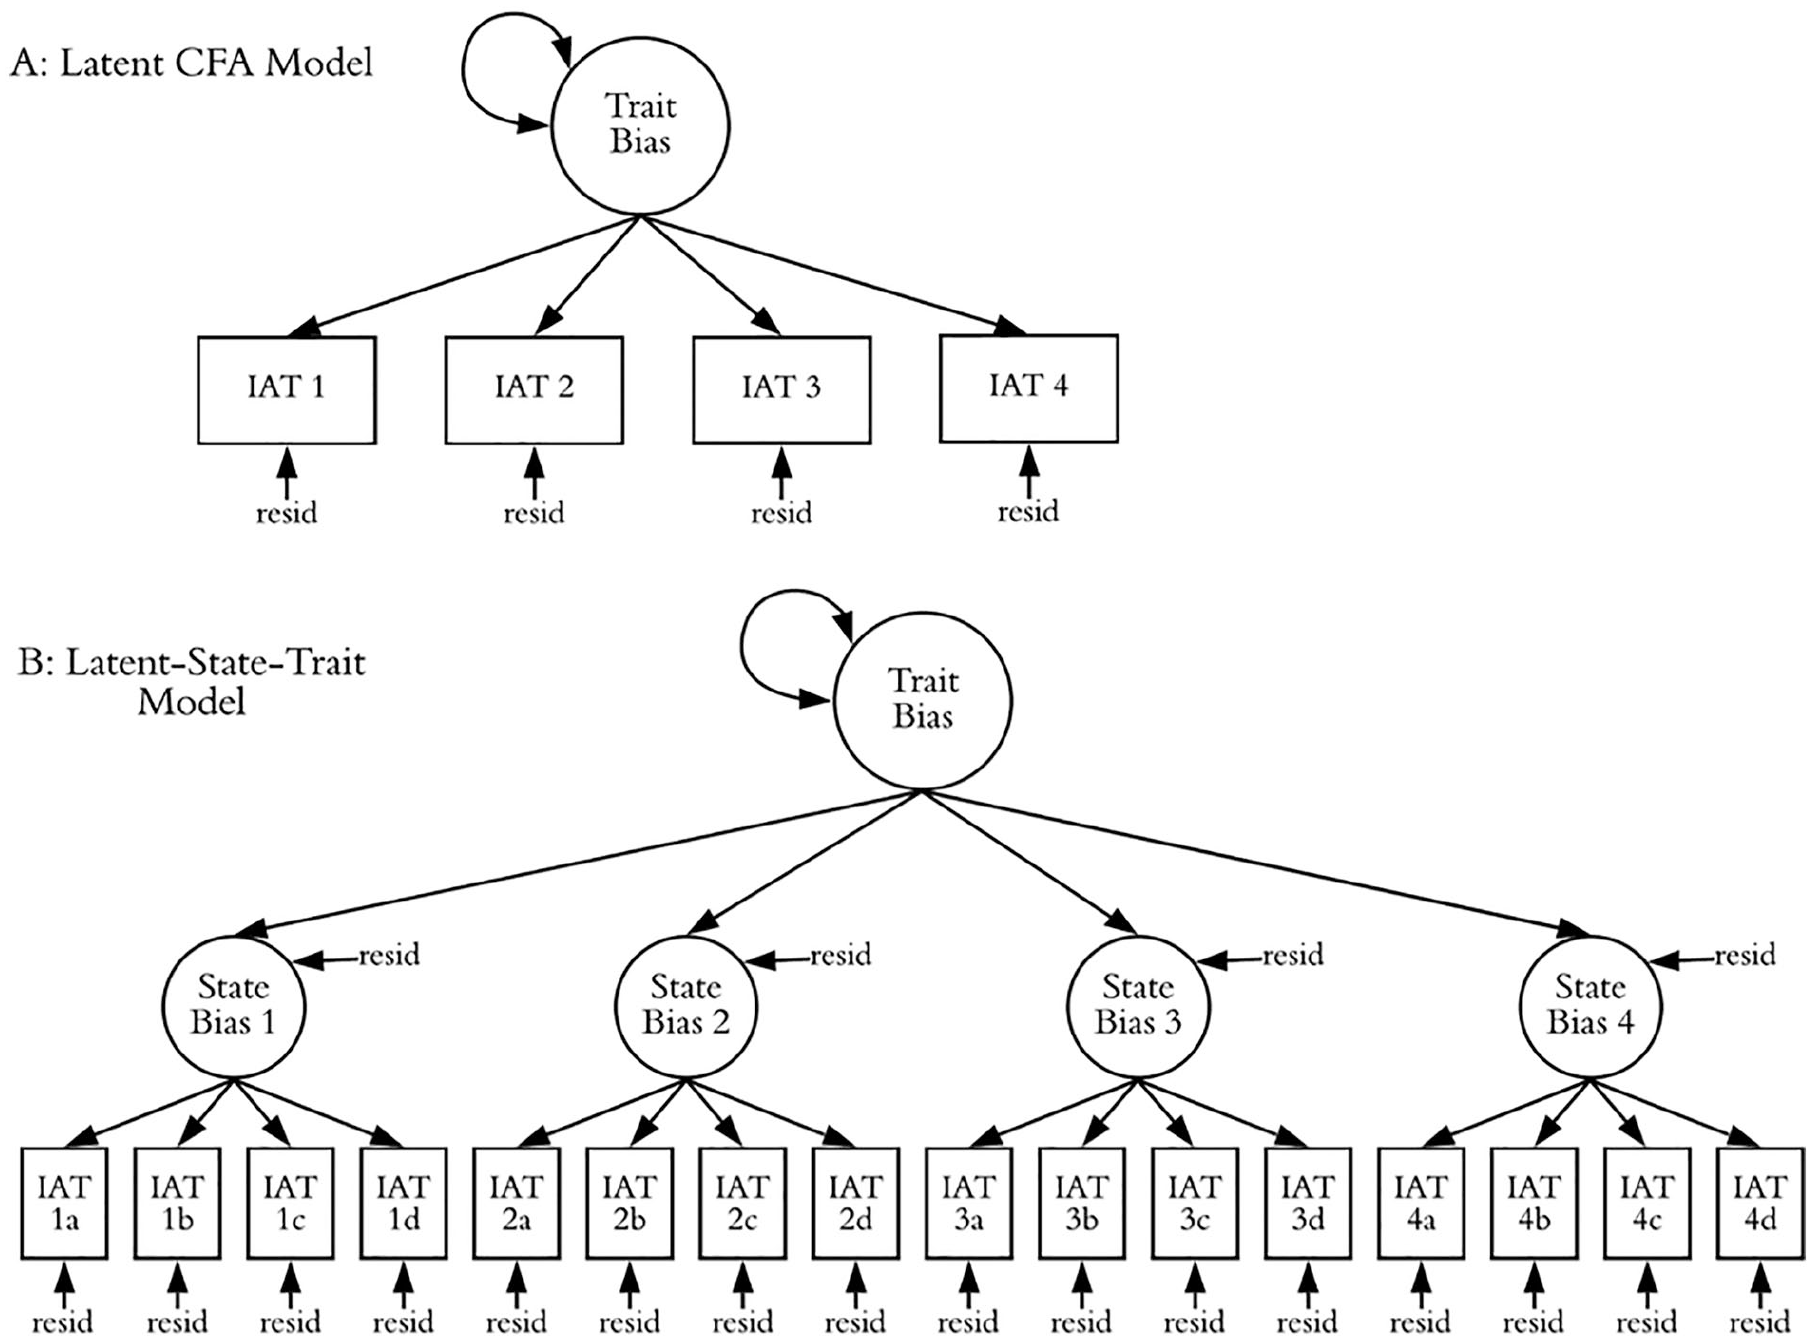
Estimating trait and state bias using latent variable modeling: (A) Latent CFA model (B) Latent-state-trait model.
A second aim was to examine how instability in IAT scores is explained by measurement error or instability in the biases themselves. Studies 1 and 2 consider IATs administered in a back-to-back format. If considerable nontrait variance exists when the setting has not changed, this makes a case for measurement error. Conversely, in Study 3, we administer IATs and self-report measures weekly for 4 weeks, allowing us to assess the presence of within-person fluctuations in IAT scores over time. We can also assess whether they correlate with similar fluctuations in self-report measures, consistent with some unstable state accounts.
A third aim is to probe the degree to which underlying biases themselves are stable or unstable by adopting a latent state-trait approach (Steyer et al., 1992, 1999). In this approach, we estimate a second-order CFA in which each IAT is represented by a latent factor, constructed from parcels of IAT trials (Buttrick et al., 2020; see Figure 1B). By setting aside measurement error within each IAT, we can better estimate whether the underlying states are stable or whether they fluctuate (Steyer et al., 1992, 1999).
Finally, we consider the impact of using more-reliable aggregates (vs. single IAT scores) on the predictive validity of the IAT for self-reported measures. As mentioned earlier, these relationships may be underestimated due to measurement error. Enhancing the measurement of implicit bias should yield stronger relations with related variables by minimizing random error and maximizing the ability to detect the true relationship between constructs (Axt, 2018; Nosek et al., 2014). We assess these relationships with single IATs and using the trait aggregates.
Study 1: Consumer Preference IATs
Study 1 was a re-analysis of data from Carpenter et al. (2019, Study 3), in which MTurk participants completed three identical IATs back-to-back, in addition to self-report preferences. This study examined implicit/explicit evaluations of ice cream brands (Häagen-Dazs vs. Ben & Jerry’s). We focus on the degree to which IATs correlate with corresponding self-report measures. Materials and original data are at https://osf.io/b26z3/. All analyses, data, and descriptive tables are at https://osf.io/k2t6p/. Study 1 was not preregistered.
Method
Procedures are given by Carpenter et al. (2019). Participants (n = 270, 61% male; ages 19–70, Mage = 33.40) were predominantly White (66%; 21% Black, 9% Asian, 6% Hispanic, 2% Native, 1% Islander and Other). They first completed a 3-item self-report measure of preference for Ben & Jerry’s vs. Häagen-Dazs (α = .96). Participants then completed three identical IATs assessing preference for the two brands. Stimuli consisted of flavor-matched photographs of pint-sized containers evaluated on a “good” versus “bad” dimension (e.g., best, excellent, worst, terrible). The first two IATs were conducted in a random order in Qualtrics and Inquisit; the third IAT was conducted entirely in Inquisit (Carpenter et al., 2019 demonstrated software equivalence). IATs were otherwise identical, including the left/right counterbalancing of targets and categories. IATs were built following a standard 7-block format (Carpenter et al., 2019; Lane et al., 2007), with 20- and 40-trial practice/critical combined blocks and a 40-trial reverse-practice block between combined blocks (Carpenter et al., 2019; Nosek et al., 2005). Unadjusted split-half correlations for IATs were: IAT1 r(205) = .70, IAT2 r(191) = .57, and IAT3 r(186) = .59 (all p < .001), consistent with typical values for the IAT (Greenwald et al., 2003).
Data Analytic Strategy
Latent-variable models were estimated in Mplus (v. 7.31; Muthén & Muthén, 1998); other analyses conducted in R. IATs were scored using the D-score algorithm (Greenwald et al., 2003; Lane et al., 2007). IATs were completed by most participants (n = 264 for IAT1, IAT2 = 254, IAT3 = 239). Following Greenwald et al. (2003), D-scores were not calculated for participants with > 10% of responses on combined trials <300 ms (n = 57 for IAT1, 53 for IAT2, 61 for IAT3), and individual trials >10,000 ms were deleted (<1% for all IATs). The error rate was 8% of combined trials for each IAT. This left a total of 586 scored IATs for analysis (n = 207 for IAT1, 193 for IAT2, 186 for IAT3).
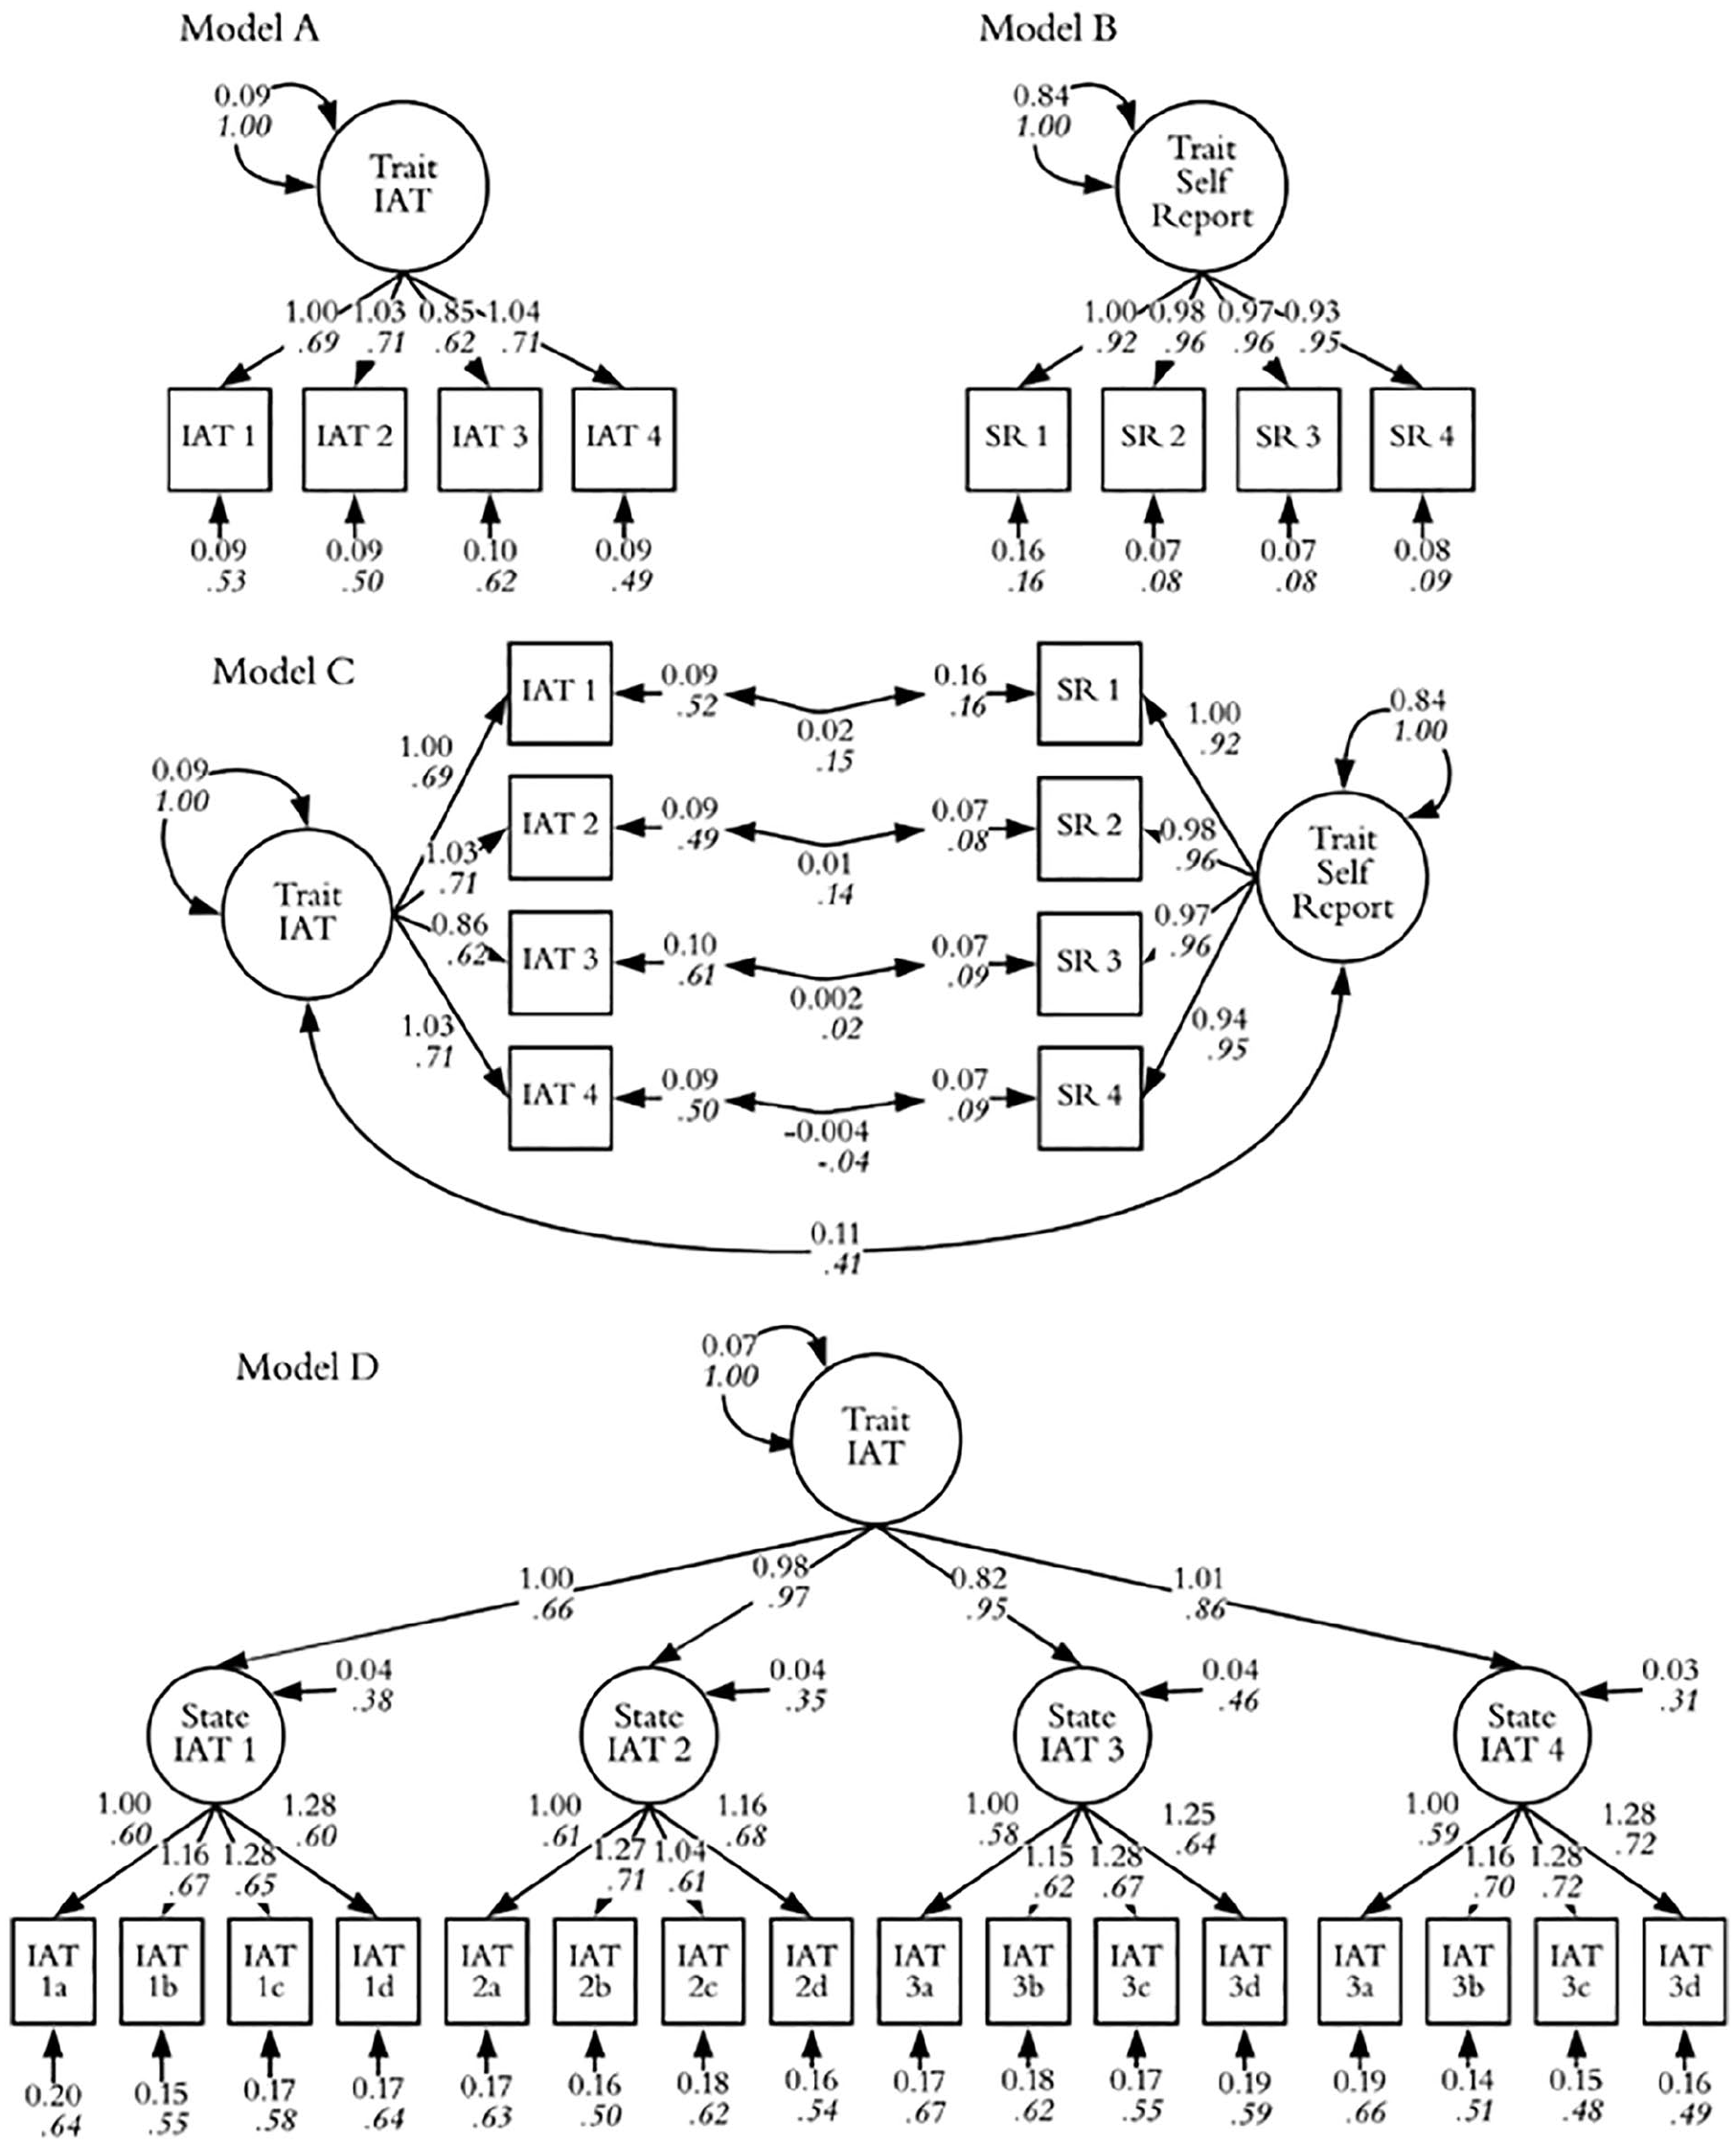
We first estimated a CFA (Figure 2, Model A), allowing us to assess the proportion of variance in IAT scores due to individual differences (i.e., trait variance; 1—standardized residuals, which represent a combination of states and random noise; Geiser, 2012). To assess the reliability of a three-IAT sum score, we estimated ω (McDonald, 1999) following Geldhof et al. (2014). 3 Models were analyzed with maximum likelihood with robust standard errors (Yuan & Bentler, 2000) 4 ; missing data were handled using full information maximum likelihood (FIML), which minimizes bias on parameter estimates (Enders & Bandalos, 2001). We then estimated correlations between the latent trait and self-reported preferences as both a scale total (Figure 2, Model B) and a latent factor (Figure 2, Model C). For comparison, we analyzed the same data using correlations between IAT scores and self-report totals.
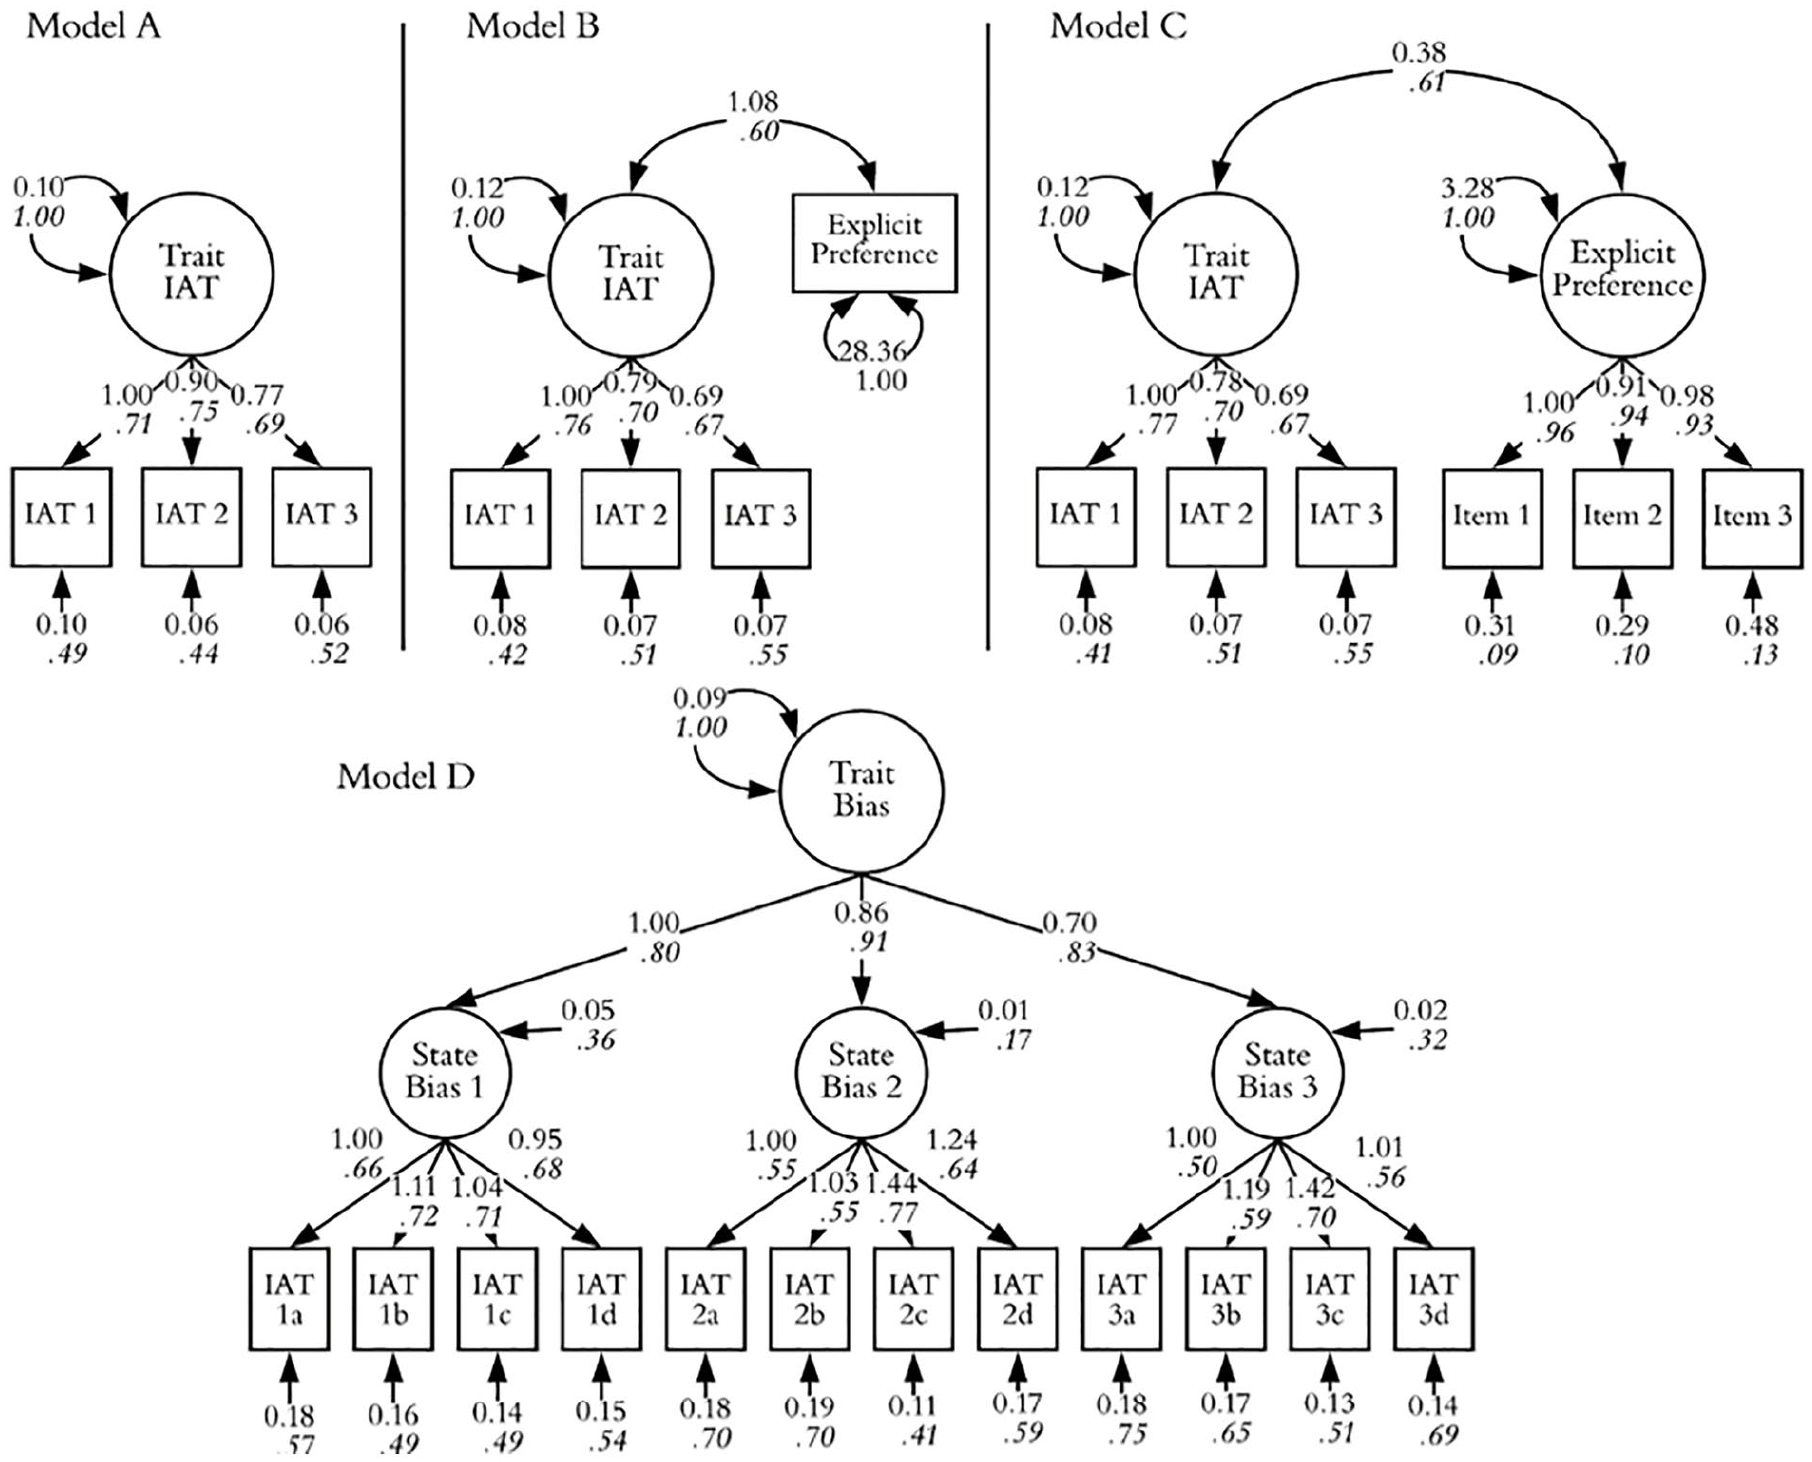
Models for Study 1.
We next estimated the underlying biases directly for each IAT using a latent state-trait model (LST; Steyer et al., 1992, 1999). This model sets aside measurement errors within each IAT by replacing them with latent factors (Model D). If error within IATs is the key driver of instability, then these latent states should be largely stable (i.e., trait-driven). To create these latent variables, we used the parceling approach of Buttrick et al. (2020, which decomposes each IAT into four parcels, with each parcel containing data from each of the four combined blocks 5 ).
Sample size adequacy was addressed by calculating confidence intervals around parameters of interest (Colegrave & Ruxton, 2003), as reported in our OSF repository, https://osf.io/k2t6p/. We also conducted an effect-size sensitivity power analysis (Cohen, 1988) and had 80% power to detect ρ ≥ .20, which is larger than is typical in this domain (Carpenter et al., 2019).
Results
Latent variable models are depicted in Figure 2. We first examined the CFA model (Model A). The individual-difference factor explained an average of 52% of the variance in IAT scores (IAT1 = 51%, IAT2 = 56%, IAT3 = 48%). The loadings yielded a modestly reliable three-IAT sum, ω = .76, 95% confidence interval (CI): [0.68, 0.82].
We next examined the relationship between implicit and self-report measures. When analyzed as single IATs via Pearson correlations, the average correlation was r = .43, IAT1 r(205) = .49, IAT2 r(191) = .39, and IAT3 r(184) = .40 (all p < .001). Figure 2 (Model B) shows the relationship between the latent trait and observed preferences, which yielded an acceptable fit, χ2(2) = 4.84, p = .09, standardized root mean square residual (SRMR) = 0.02, comparative fit index (CFI) = 0.98, root mean square error of approximation (RMSEA) = 0.07. The model yielded a strong latent correlation between implicit and self-report measures, φ = .60, 95% CI [0.48, 0.71]. Model C yielded similar results, χ2(8) = 15.33, p = .053, SRMR = 0.03, CFI = 0.99, RMSEA = 0.06, and returned a latent correlation of φ = .61, 95% CI [0.48, 0.71]. While a single IAT score explained only about 18% of variance in explicit measures, a latent measure of trait bias explained about 36%.
We next examined the LST model using IAT parcels (Model D). The model fit well, χ2 = 67.66, p = .06, SRMR = 0.04, CFI = 0.97, RMSEA = 0.04. As indicated by standardized residuals, the latent states were largely stable over repeated administrations. An average of 72% of the variance in states was explained by the latent trait (IAT1 = 64%, IAT2 = 84%, IAT3 = 68%).
Exploratory analyses
We explored the viability of a sum-score approach. We found this yielded relationships with self-report similar to the CFA, r(182) = .56, 95% CI [0.46, 0.66], p < .001. However, this required omitting a considerable portion of the data (usable n = 184 of 270), leading to a possible missing-data bias.
We next examined whether a single parceled IAT would be sufficient for assessing trait bias. We reestimated Model D without the trait factor and allowed the three latent states to correlate with the self-reported preference. This fit the data well, χ2(73) = 90.22, p = .08, SRMR = 0.05, CFI = 0.98, RMSEA = 0.03. However, this yielded lower correlation estimates than Model B: IAT1 φ = .55, IAT2 = .44, IAT3 = .46. We did not explore these states further.
Discussion
We found that aggregating multiple consumer preference IATs yielded reliable estimates of individual differences and stronger correlations with self-report measures than when analyzed as individual IAT scores. Although this increase in correlation is an implied property of unreliability and aggregation (Nunnally, 1967; Spearman, 1904), the degree change in r2 estimates was approximately twice as large when analyzing latent trait bias as when analyzing single IAT scores. This is notable, as IATs were administered back-to-back when, presumably, nothing else has changed for participants. Thus, we suspect that much of this instability represents measurement error. Consistent with this, LST models suggested that underlying states were largely stable/trait-driven (Models D). This could indicate a failure to fully remove measurement error from within IATs via parceling or minor fluctuations in underlying states. Regardless, aggregation provided a solution to both measurement error and instability in underlying states.
Study 1 examined two alternative approaches to aggregation. We found that using a sum score was computationally simpler and yielded a gain in correlation similar to the latent-variable model. However, this method contained considerable measurement error (estimate = 24% measurement error) and required a method for handling missing data. We also examined parceling a single IAT and found that this approach did not substantively improve estimates of predictive validity.
Study 2: Five Race IATs
Study 2 replicated Study 1 with a confirmatory sample using a different domain (Black-White race attitude IAT), a different population (German university students), and five IATs per session. Given the value of aggregating IATs demonstrated in Study 1, we used a procedure to efficiently group several IATs together originally used by Hahn et al. (2014). In this procedure, participants complete critical blocks from five IATs in one session with a modified practice block schedule. We administered this same procedure, but with five of the same IAT. This study was preregistered at https://osf.io/x84u3.
Method
Participants
Participants were 200 students from a college in Germany (76% female, 24% male; Mage = 28.89, range: 19–78) in Fall 2020. The sample identified as White (88%), Middle Eastern (10%), East Asian (3%), Black (2%), Latino/a (2%), and other identities (6%). Participants received €4.5 each.
We collected the largest sample possible within funding constraints. Sample size adequacy was tested prior to data collection via power simulation based on our focal model (an approximation of Study 1, Model B; 1000 reps). With n = 200, fit was adequate, χ2(10) = 10.42 ± 4.65 [CV = 18.31]; RMSEA = .02 ± .025; SRMR = .03 ± .01. Precision for residuals was adequate (estimate ± .06), as was the latent I/E correlation (estimate ± .07). Our preregistered plan was to collect n = 200 participants with at least 3 usable IATs with the intent to oversample. Due to changes in funding after preregistration, this was changed to n = 200 total, which yielded nearly the same result (n = 199 with 5 usable IATs). Effect-size sensitivity power analysis revealed this provided 80% power to detect ρ ≥ .20.
Procedure
Participants first completed 3 self-report items assessing self-reported racial attitudes from Nosek et al. (2005): a relative preference item for Black/White people and two feeling thermometers for “Black” and “White” people (0 = coldest feelings, 100 = warmest feelings). This was scored as a standardized difference between the thermometers, averaged with the standardized relative preference item (Nosek et al., 2005). The items correlated strongly, r(198) = .61, p < .001.
Participants next completed five IATs, based on the race-attitude IAT using the modified 4-block-IAT structure by Hahn et al. (2014). Participants first completed a sorting block for attributes (20 trials). Next, participants completed the same procedure 5 times: a face-sorting practice block (20 trials), a combined block (40 trials), a reverse face-sorting practice block (40 trials), and a reverse combined block (40 trials). Participants were randomly assigned to one permutation (e.g., initial left-right positioning for attributes/targets) which remained constant for all five IATs. Participants also completed a seriousness-check item (Aust et al., 2013).
Data analytic plan
As in Study 1, we estimated a basic CFA model (Model A), a model estimating correlations between trait IAT scores and self-report (Model B), and a LST model (Model C). 6 IAT scoring followed Study 1 (< 0.1% trial rejection for all IATs, error rate = 5%−6%). This left a total of 996 scored IATs for analysis (n = 200 for IAT1, n = 199 for IATs 2–5). All participants passed the seriousness check item. Internal consistencies were consistent with Greenwald et al. (2003): IAT1 r(198) = .73, IAT2 r(197) = .71, IAT3 r(197) = .69, IAT4 r(197) = .64, IAT4 r(197) = .48.
In addition to replicating the primary results from Study 1, we also considered scoring all five IATs together as “one large IAT.” If the increased reliability of aggregation comes from the additional data, then this strategy may obtain this benefit without the distinctions between “separate IATs.” Per preregistration, we estimate this with just the first two IATs, the first three IATs, the first four IATs, and all five IATs, plotting the effect of additional IATs on the estimated implicit/self-report correlation.
Results
Models are depicted in Figure 3. The basic CFA (Figure 3, Model A) fit the data well, χ2(5) = 4.02, p = .55, SRMR = 0.02, CFI = 1.00, RMSEA <.01. The individual difference factor explained an average of 47% of the variance in observed IAT scores (IAT1 = 29%, IAT2 = 60%, IAT3 = 60%, IAT4 = 47%, IAT5 = 36%). The scale yielded an internally consistent five-IAT sum, ω = .81, 95% CI [0.77, 0.85].
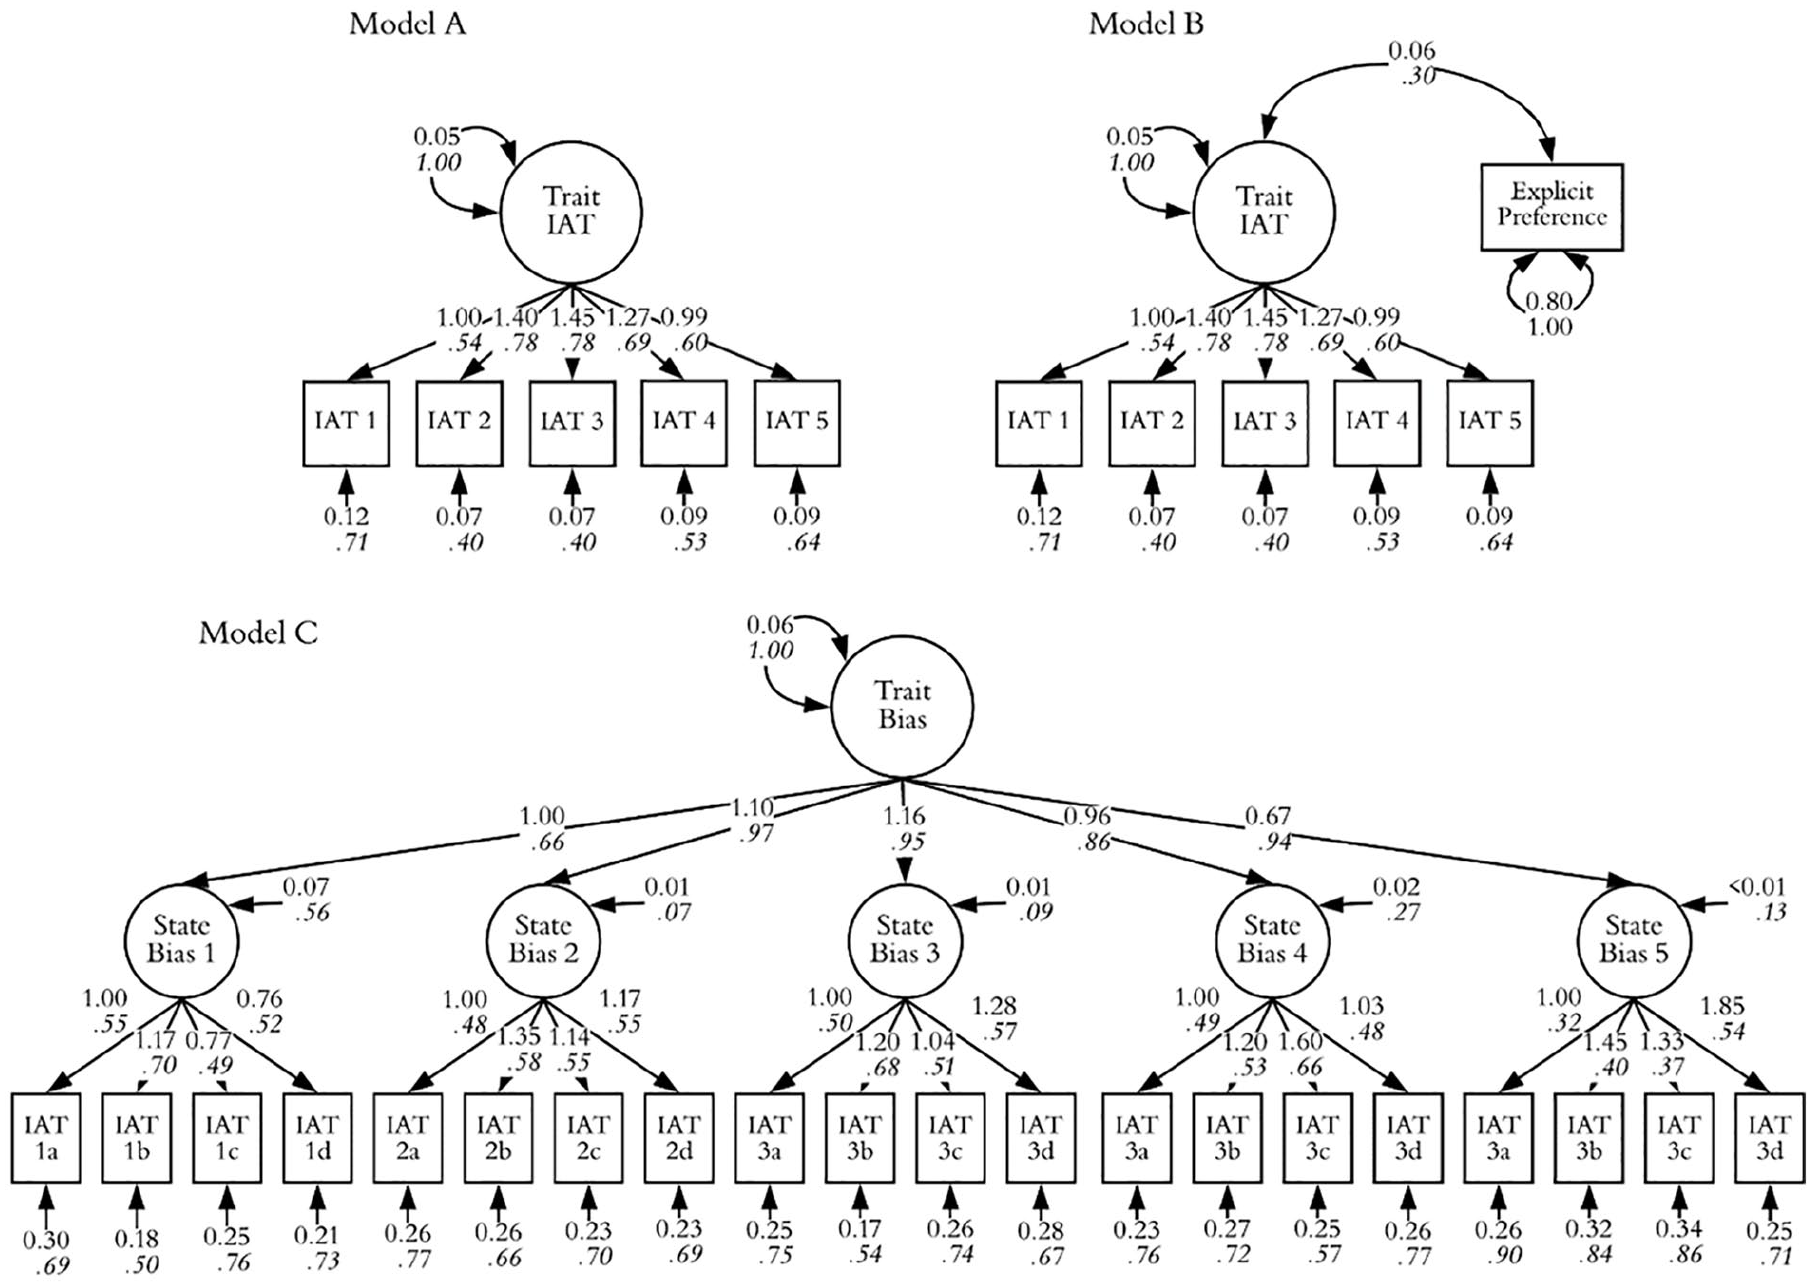
Models for Study 2.
We next examined the relationship between implicit and self-report measures. When analyzed as single IATs via Pearson correlations, the average correlation was r = .19, IAT1 r(198) = .18, IAT2 r(197) = .21, IAT3 r(197) = .22, IAT4 r(197) = .19, IAT5 r(197) = .17, 95% (all p ≤ .01). When the correlation was estimated between the latent IAT and self-reported racial preference (Model B), the model fit well, χ2(9) = 5.13, p = .82, SRMR = 0.02, CFI = 1.00, RMSEA < .01. The estimate for the relationship between latent IAT scores and self-reported preference was φ = .30, 95% CI [0.16, 0.43], which explained more than twice as much variance as the single-IAT approach.
Next, we considered the LST model (Model C), which fit acceptably χ2(165) = 205.00, p = .02, SRMR = 0.05, CFI = 0.94, RMSEA = 0.04. In this model, an average of 78% of the variance in latent states was explained by the trait factor (IAT1 = 44%, 95% CI [26%, 66%], IAT2 = 94%, 95% CI [69%, 100%], IAT3 = 91%, 95% CI [73%, 100%], IAT4 = 73%, 95% CI [54%, 95%], IAT5 = 87%, 95% CI [56%, 100%]).
Finally, we considered scoring the separate IATs as “one big IAT.” As depicted in Figure 4, correlation estimates increased with the number of IATs. At five IATs, the estimate approached (but did not reach) the estimate of the latent correlation (φ = .30) at r(197) = .26, p < .001.
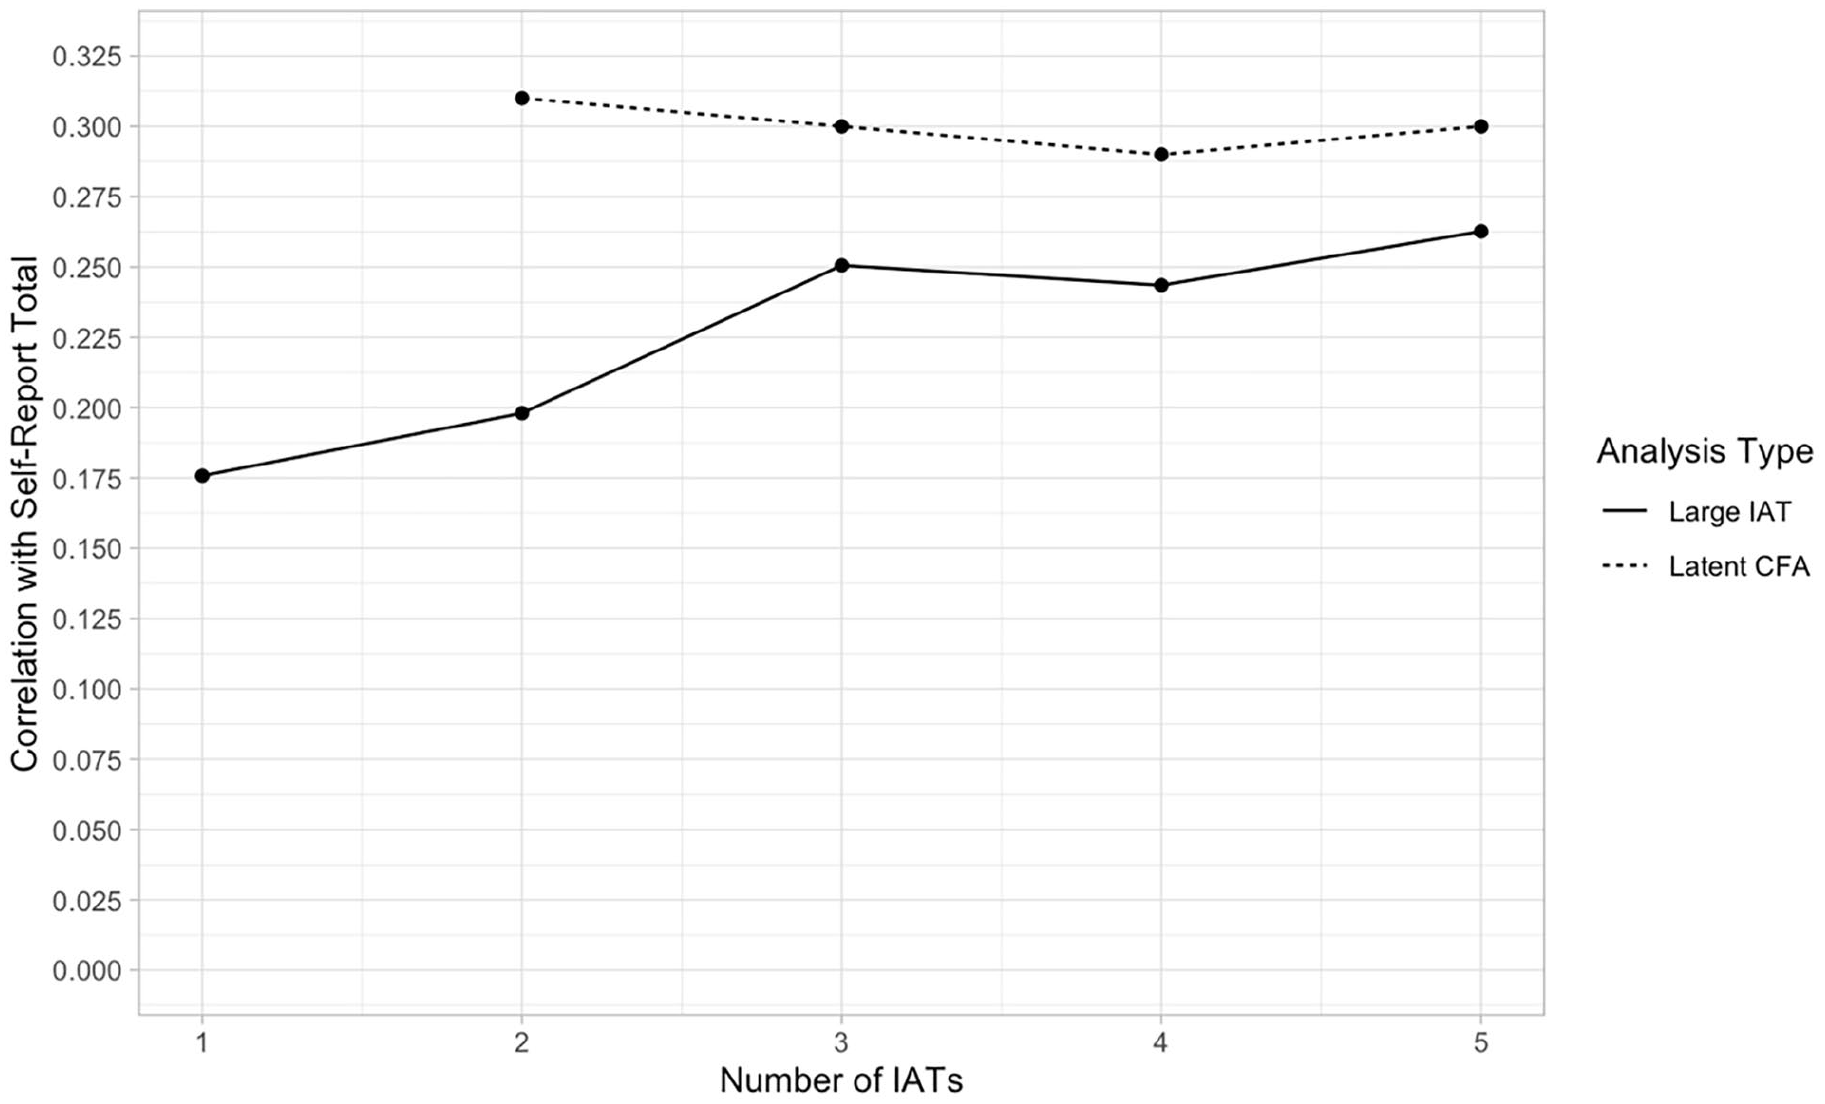
Correlations with Self-Report when Scored as “One Big IAT” vs CFA.
Exploratory Analyses
Given the performance of the “large IAT” analysis, we tested the performance of a sum-score approach again. The five-IAT sum score correlated identically to that from the “large IAT” analysis, r(197) = .26, 95% CI [0.13, 0.39], p < .001. Furthermore, the “large IAT” and sum-score approaches produced nearly identical composite scores, r(197) = .99, 95% CI [0.98, 0.99], p < .001, indicating these two methods were not substantively different from one another.
Given that the latent variable models consistently recovered larger correlation estimates than did Pearson correlations on the same data, we next explored how many IATs were needed to achieve this benefit. We reestimated the correlation between latent IAT scores and self-reported racial preferences using 2 to 5 IATs; all models fit well (all: χ2 = ns, CFI = 1.00, RMSEA < .01, SRMR ≤ .02). As depicted in Figure 4 (dotted line), the benefit from latent IAT aggregation was achieved in just two IATs, achieving φ = .31 with two IATs, φ = .30 for three IATs, φ = .29 for four IATs, and φ = .30 for five IATs (all p < .001).
Discussion
Using a preregistered confirmatory design, Study 2 found similar results to Study 1. Although the nature of the study was different—racial bias, a student population, and a modified 5-IAT design—we saw a similar proportion of observed scores reflecting nontrait sources as in Study 1 (48% vs. 53%). Similarly, as in Study 1, when measurement error within the IAT was removed, the majority of variance in the underlying states (78%) appeared stable and explained by an individual difference factor. Finally, as in Study 1, there was a substantive increase in correlation when using a latent-variable approach; in this case, the proportion of variance explained (r2) was over twice as large in the latent variable analysis than when the same data was analyzed via Pearson correlations on single IATs, again suggesting the superiority of the aggregate approach.
Study 2 also found that a sum-score approach yielded an estimate that approached, but did not reach, the estimated latent correlation. In this case, it did not matter whether the IATs were scored separately and summed or analyzed as one large IAT. This is expected, as these methods address measurement error of trait bias by aggregation—expecting errors to cancel out by adding additional data (Nunnally, 1967)—rather than setting it aside via structural equation modeling (Brown, 2015). In this case, a modestly reliable sum score was achieved (.81), yet this still indicates substantial measurement error. Conversely, by using a different analytic technique on the same data, the CFA recovered a larger estimate, the benefits of which were apparent after just two IATs.
It should be noted that the proportion of variance in IAT scores attributable to “trait” across Studies 1 and 2 may be an upper-bound estimate. Our “trait” estimate includes any variation stable within persons; however, because the IATs were administered back-to-back, it could be that states did not have enough time to fluctuate. In other words, a larger time gap between administrations (i.e., longitudinal data) may yield lower estimates of trait and higher estimates of fluctuating latent states. We considered this in Study 3.
Study 3: Four Race IATs Over 4 Weeks
Study 3 considered the possibility that implicit states may fluctuate over time, further reducing trait variance in IAT scores. In Study 3, we assessed implicit and self-reported racial biases at 4 weekly intervals. We also estimated whether fluctuations in IAT scores correlate with similar fluctuations in self-report measures—if so, this would provide evidence for meaningful within-person fluctuations. This study was preregistered at https://aspredicted.org/gg42r.pdf.
Method
Participants
Participants were 490 psychology students from an American Midwest university (70% female, 29% male, 1% other; Mage = 19.24, range: 18–22) participating in exchange for partial course credit in Fall 2020. The sample identified as White (54%), Asian (38%), Black (9%), Latino/a (8%), Middle Eastern or North African (3%), American Indian/Alaskan Native (1%), and other (<1%). All participants completed the initial wave and were asked to complete 3 follow-up surveys at 1-week intervals. The majority of participants (n = 366) completed all four waves. Responses were similar for Wave 2 (n = 380), Wave 3 (n = 367), and Wave 4 (n = 369).
We preregistered a plan to collect at least 200 participants with three usable IATs in one semester with the plan to continue collecting until the end of the semester as resources allowed. This was based on the simulation from Study 2; we also conducted a power simulation based on participants who completed all waves (n = 366); this produced strong fit, χ2(15) = 15.16 ± 5.52 [CV = 25.00]; RMSEA = .01 ± .015; SRMR = .02 ± .005. Precision for residuals was adequate (estimate ± .05) as was the latent I/E correlation (estimate ± .07). Estimates for the residual I/E links at each wave were estimated at ±.035. As the achieved sample size was actually larger than this, the sample size was considered adequate. Effect-size sensitivity power analysis revealed at least 80% power to detect ρ ≥ .15.
Procedure
Participants completed a single IAT each week (standard 7-block format) with Black–White photo stimuli from Study 2. Internal consistencies (unadjusted split-half correlations) were internally consistent at wave 1 r(485) = .76, wave 2 r(375) = .72, wave 3 r(360) = .70, and wave 4 r(360) = .74 (all p < .001). Participants also completed the self-report racial preference measure from Study 2. Because scoring this requires averaging two z-scores, z-scores were calculated using a grand SD across all four waves; this ensured that scores at each wave were comparable. The measure was internally consistent at Wave 1: r(487) = .72, Wave 2: r(378) = .67, Wave 3: r(362) = .72, and Wave 4: r(366) = .72 (all p < .001).
Although not part of our preregistered plan, we included exploratory measures at each wave that are included here. 7 We included two norms questions (Forscher et al., 2015): “According to most people in the United States, if someone is Black, that makes it acceptable to express negativity toward him or her” and “According to most people in the United States, it is appropriate to treat people poorly because they are Black.” These were answered on 7-point Likert-type scales (1 = Strongly Disagree, 7 = Strongly Agree). Second, we included Plant and Devine (1998)’s internal and external motivations to respond without prejudice (IMS, EMS; 5 items each, 9-point Likert-type). IMS was internally consistent at each wave (α = .78, .78, .80, .80) as was EMS (α = .81, .90, .91, .93).
Data analytic plan
Per our preregistered plan, we estimated a CFA on the implicit measures (Model A) and a similar model for self-report measures (Model B). Finally, we combined them (Model C), allowing trait factors and state residuals to correlate. In this model, correlations between the trait factor represent the degree to which trait implicit/explicit tendencies correlate. Conversely, correlations between the state residuals reflect whether temporary fluctuations in implicit and explicit measures correlate. As in Studies 1–2, we also estimated a LST model (Model D), 8 with the focal result being stability in the latent states. Because these have more time to vary between observations, these may be lower in Study 3.
As before, IATs were not scored if >10% of responses on combined trials < 300 ms. Only 16 IATs met this criteria (IAT1 = 2, IAT 2 = 3, IAT 3 = 5, IAT 4 = 6). In addition, computer errors during the IATs caused corrupted data for two IATs, which were not scored (1 at wave1, 1 at wave4). This left a total of 1,588 IATs for analysis (n = 487 for wave1, 377 for wave2, and 362 for wave3, and 362 for wave4). Less than 0.1% of trials were deleted; the error rate was 7% to 10%. Missing data were again handled using FMIL.
Results
Models are depicted in Figure 5. The CFA (Model A) fit the data well, χ2(2) = 0.57, p = .75, SRMR = 0.01, CFI = 1.00, RMSEA < .01. The individual-difference factor explained an average of 47% of the variance in observed IAT scores (IAT1 = 48%, IAT2 = 50%, IAT3 = 38%, IAT4 = 51%). The IAT scale was modestly internally consistent, ω = .78, 95% CI [0.73, 0.81]. We next assessed the same model for self-reports (Model B), which fit the data well χ2(2) = 0.85, p = .65, SRMR = 0.00, CFI = 1.00, RMSEA < .01. A single trait factor explained an average of 90% of the variance in self-reported attitudes (wave1 = 84%, wave2 = 92%, wave 3 = 92%, wave 4 = 91%). The self-report items formed a reliable aggregate, ω = .97, 95% CI [0.96, 0.98].
Models in Study 3.
Next, we examined the relationship between implicit and self-report measures. When single IATs were assessed, the average correlation was r = .27: wave1 r(484) = .34 wave2 r(375) = .28, wave3 r(358) = .21, wave4 r(359) = .22 (all p < .001). However, as demonstrated in the combined model (Model C), which fit the data well, χ2(15) = 12.22, p = .66, SRMR = 0.01, CFI= 1.00, RMSEA < .01, the latent correlation was considerably larger (φ = .41, 95% CI [0.31, 0.50], p < .001). In other words, the latent variable explained ≈ 2.3 times the variance in the self-report measure as did the average single IAT.
We next examined the correlations among Model C’s state residuals, which represent whether fluctuations in IAT scores correspond to similar fluctuations in self-reports. Residuals were correlated at wave1, r = .15, p = .01, and not significantly correlated at wave2, r = .14, p = .05, at wave3, r = .02, p = .75, or wave4, r = −.05, p = .51.
Finally, we examined the LST model, reconsidering the stability of states after removing measurement error within each IAT. The model met fit criteria, χ2(100) = 127.11, p = .03, SRMR = 0.03, CFI = 0.98, RMSEA = .02. The latent trait explained an average of 62% of the variance in the latent states (IAT1 = 62%, IAT2 = 65%, IAT3 = 54%, IAT4 = 69%).
Exploratory Analyses
In the analyses earlier, we consider the correlation between IAT scores and a close analog of the IAT, self-reported racial preferences (Nosek et al., 2005). Would the same benefit of aggregation be achieved when correlating with other related outcomes? We reestimated Model C above with measures of social norms and internal/external motivations to respond without prejudice. We report here correlations between the observed scores and then the same data when analyzed as a latent variable. Results are summarized in Table 1; across measures, correlations using single IAT scores were weaker and inconsistently significant. Conversely, the latent correlation estimates tended to be larger and explained 1.86 to 2.96 times the variance in self-report measures.
Observed and Latent Correlations in Study 3.

Note. r1- r4 refer to the observed correlations between IATs and self-report items. Norms 1 = “According to most people in the United States, if someone is Black, that makes it acceptable to express negativity toward him or her.” Norms 2 = “According to most people in the United States, it is appropriate to treat people poorly because they are Black.” IAT = Implicit Association Test; IMS = Internal Motivations to Control Prejudice; EMS = External Motivations to Control Prejudice.
p < .05. **p < .01.
Discussion
As in Studies 1 and 2, approximately half of the variance in observed IAT scores could be explained by a single underlying trait. Thus, despite more time between estimates, we observed nearly the same instability in IAT scores as we did when administering IATs back-to-back. Conversely, self-reported racial attitudes were largely stable, with 90% of the variance explainable by an underlying trait. This is consistent with past research on implicit and self-report measures, which finds that self-reported attitudes tend to be considerably more stable than implicitly identified attitudes (Gawronski et al., 2017). As in Studies 1 and 2, the latent correlation estimate (φ = .41) was considerably larger than the raw correlation estimates. We also extended this to other measures, where the increase in variance explained was similar in magnitude. However, with lower baseline correlations, the absolute change in correlation estimates was smaller. On the contrary, when the underlying associations are weak to begin with, a loss of any variance explained could be impactful.
We also observed evidence for meaningful state fluctuations in the IAT. First, fluctuations away from one’s baseline were related to similar fluctuations on self-reported measures in one of four waves. This inconsistent relationship may be attributable to the general lack of fluctuations in self-reported measures in this sample. The LST model further suggested that the biases were largely stable over 4 weeks, with an estimated 62% of variance in the states explained by a stable trait. This may indicate some potential fluctuations in the underlying biases, even if dissociated from explicit fluctuations (e.g., Gawronski & Bodenhausen, 2006, 2011) Further research into state instability may help to further clarify these questions.
General Discussion
Across three studies, we showed that approximately half of the variance in observed IAT scores is explained by a stable individual-difference factor. This corresponds well to recent past estimates. For example, Greenwald and colleagues (Greenwald & Lai, 2020; see also Greenwald et al., 2021) estimate a similar 50% value based on test–retest correlations. This suggests that prior research has underestimated the amount of trait bias captured by the IAT by using only single IAT D-scores. If researchers wish to use the IAT as a measure of individual differences, a single IAT will likely underestimate the true relationship between trait bias and outcomes due to attenuation (Spearman, 1904).
Consistent with the solution taken by creators of multi-item scales (Nunnally, 1967) and those who study state measures (e.g., Finnigan & Vazire, 2018), we found that this lack of reliability can be overcome by within-person via aggregation. Our results also confirm analyses by Greenwald et al. (2020) and support the value of aggregation across a range of attitude objects. Specifically, we showed that a small number of IATs can be combined together to create a latent trait factor; these trait estimates in turn return substantively higher association estimates than when analyzing the same data as individual IATs (r2 ≈ 1.5–2.0 times larger). The correlation gains observed here are an implied property of measurement error and unreliability (Brown, 2015; Nunnally, 1967; Spearman, 1904); however, the magnitude of impact here is notable. A sum score or combined scoring also appears to improve correlations with self-report measures, but the gains in prediction are not as large as when using a latent-variable model that can estimate the trait factor directly. Getting correct estimates of association with the IAT is important, particularly in cases where statistical control or “unique” effects of implicit attitudes are considered (see Kurdi et al., 2019). With current practices, we are likely underestimating the degree to which individual differences in implicit bias are associated with other psychological constructs.
Our findings support a mixture of the “measurement error” and “unstable states” accounts for instability in IAT scores. However, we interpret our results as more strongly supporting the measurement-error position. In two studies of back-to-back, identical IAT administrations, nearly half of the variance in IAT scores was not attributable to an individual-difference factor. Almost nothing else about the participants’ contexts changed during this time. Thus, we see little reason to suspect that this variation is explainable by true shifts in the underlying construct assessed by the IAT. Furthermore, when one attempts to partition measurement error out of each IAT by parceling (Buttrick et al., 2020), the underlying states appeared largely—but not entirely—stable. An open question is whether the parceling approach adequately removes all measurement error from within the IAT; if so, this would suggest there may still be some fluctuation in moment-to-moment underlying states that is not present in self-report measures. Conversely, it could be that the parceling approach reduces measurement error but does not fully remove it. This remains a question for future research. Regardless, results from Studies 1 and 2 demonstrate that IAT scores are considerably unstable even when IATs are given moments apart; we interpret this as being more consistent with a measurement error explanation. The fact that nearly the same results were obtained over a longitudinal study (4 weeks; Study 3) as in the back-to-back administrations (Studies 1 and 2) further suggests that the instability commonly observed over short periods (e.g., 1 week; Gawronski et al., 2011) can be achieved without invoking the contextual nature of IAT scores. Thus, our findings are more consistent with the view that the IAT may be a “noisy” trait measure than the view that IAT scores reflect temporal instability in the states themselves (Connor & Evers, 2020). However, we also did not test how changes in context (e.g., moving from one locale to another; Payne et al., 2017) impact IAT scores or add additional variability to the data. Instead, we demonstrate that the IAT returns a noisy signal when the context is held constant and show that this signal can improved through aggregation.
The present results found some evidence consistent with fluctuations in underlying states, in addition to the evidence for a measurement error account described earlier. As noted earlier, the LST analyses did not indicate the underlying states were perfectly stable or trait driven, with an estimated 20% to 30% of the variance in latent states appearing to be unstable. This is consistent with estimates by Greenwald et al. (2020), who suggested that IATs are 80% reliable yet (i.e., 20% noise) and 50% reflective of “person” variation, implying ~30% residual variation for states. Although our methodology is different from the present research, the convergence of these values is encouraging. This suggests some instability in the underlying biases themselves. Furthermore, Study 3 observed some (inconsistent) relationships between nontrait components of self-report and implicit measures. Thus, we do not see evidence that IAT scores entirely represent a stable underlying trait. As these present results represent an initial test of this possibility, future research could expand upon the approach taken in Study 3 to further explore and model within-person changes on implicit measures over time.
The present results also have larger theoretical and methodological implications for implicit bias research. Previous conceptualizations have tended to suggest that implicit bias should act “trait-like”—being relatively robust and stable over time (e.g., Wilson et al., 2000). However, other theorists have pointed to instability in IAT scores as evidence against a purely trait-based conception of implicit bias, arguing that weak test–retest correlations may indicate that the IAT is context-sensitive (e.g., Gawronski & Bodenhausen, 2011; Gawronski et al., 2017). Although experimental research has clearly demonstrated that IAT scores are susceptible to contextual influence (e.g., De Houwer, 2001; Forscher et al., 2019; Lai et al., 2014, 2016), the present results suggest that IAT scores are also capable of assessing trait-like variance reliably. Given that IAT scores contain considerable extraneous measurement error, then instability may instead represent a psychometric “bug” rather than a theoretical “feature.” In this case, aggregation may be a better method for conducting implicit bias research.
We note that another possibility that is consistent with the present results is that the underlying states may change so rapidly as to fluctuate while participants are completing a single IAT. For example, participants may become more tired over the course of several IATs and this fatigue may lead to greater expression of automatic impulses. If this is the case, however, then a single IAT score represents a sort of aggregation over states anyway, and the present approach again may prove useful. Of course, the present results are consistent with the possibility that the IAT may capture a mixture of states and traits as do many measures (e.g., in personality, see Finnigan & Vazire, 2018; Rauthmann et al., 2018).
Another consideration implied by the present research is that implicit and self-report measures may be more related than previously assumed. Considerable effort has gone into assessing the degree to which IATs and self-report measures associate with one another (e.g., Axt, 2018; Hofmann et al., 2005). The weak relations between the IAT (and implicit measures generally) and self-report measures have been one argument for dual-process accounts of social cognition (e.g., Rydell & McConnell, 2006; Wilson et al., 2000). The present results suggest that the relationship between automatic and deliberative evaluations may be underestimated due to measurement error. Still, it is important for researchers to keep this attenuation in mind when making theoretical sense of correlations with IAT scores.
The present research also has an important implication for research designs with the IAT and IAT practice in general. As noted earlier, group averages of IAT scores tend not to have the unreliability problems associated with single IATs as they already represent aggregates (e.g., Connor & Evers, 2020). Thus, study designs that emphasize group comparisons (e.g., randomized experiments) may still yield unbiased estimates of IAT means. Conversely, studies that use a single IAT and correlate IAT scores with other measures may underestimate these relationships. One solution may be for researchers to include several IATs in their study and to aggregate across them with a latent variable, as done here.
To facilitate the use of latent-variable models, we have created a web-based application to automate the latent-variable analysis for researchers, which can be found at https://tcarpenter.shinyapps.io/trait_iat/. This application reproduces the analyses found in this article exactly—a one-factor CFA using FIML for missing data and robust estimation, and a second model that estimates the latent correlation with a self-report measure. The tool will also assess the proportion of trait variance within each single IAT score, and it calculates the gain in predictiveness achieved by using a latent variable approach. In addition to producing a paragraph summarizing the results, it also provides a CFA diagram with factor loadings and full model output and fit statistics. We hope this makes the present analysis technique more accessible.
However, we also acknowledge that practical constraints may prohibit researchers from including multiple IATs in a study. If a researcher is unable to include three or more IATs, what should they do? One option may be to include just two IATs. As noted in Study 2, the benefits of latent aggregation were observed with just two IATs (with a minimized practice-block schedule). Should this be too onerous, some (but not all) of the benefits of aggregation can be obtained through sum scores (or through a longer single IAT). However, this approach was weaker than a latent-variable approach. Across studies, a latent-variable approach produced the best value given participants’ time. Unfortunately, there are no easy solutions to these problems. We hope the present research will inform researchers about the costs and consequences of their design decisions.
Limitations and Future Directions
There were several limitations to the present research. First, we focused largely on correlations between IATs and conceptually analogous self-report measures. Although this method is often used for validating implicit (and self-report) measures (Axt, 2018; Greenwald et al., 2003; Nosek et al., 2005), we did not assess behavioral outcomes. Future research could assess whether IAT aggregates are better predictors of corresponding behavioral tendencies, which would also help to address concerns about these relationships in the field (Kurdi et al., 2019). Our assessment of stability was also based on only two time frames: back-to-back and weekly administrations. It is possible that more meaningful variation in implicit attitudes might emerge at longer time intervals or over relevant life periods. We also note that our study was focused only on the IAT; as a result, we do not have a means of assessing method effects on our estimates of stability or other parameters. Future studies could seek to expand to other implicit measures.
Researchers should consider even larger longitudinal designs to assess patterns of within-person change. Along those lines, it is also possible that fluctuations in implicit bias may have meaningfully occurred in Study 3 but may not have coincided with fluctuations in self-report measures due to the nature of the constructs. Future research could probe for meaningful within-person change in IAT scores by assessing for correlations with other contextual or self-reported shifts (e.g., moving to a different region, intergroup contact, or other life experiences). Finally, we focused here on racial attitudes and consumer preference. Future research could assess for method effects in stability. For example, researchers could test whether one or another set of stimuli produces larger trait estimates, whether making a single IAT longer (e.g., number of trials) would produce robustly better estimates as documented here, or whether a new implicit measure applying this aggregation principle might be warranted to maximize stability and relationships with other measures.
Conclusion
Researchers of implicit social cognition are often interested in individual differences. However, a single IAT score is too noisy to make strong claims about one’s stable and enduring evaluations. Single IAT scores contain considerable nontrait variance from measurement error and state-based fluctuations. To assess trait levels of implicit bias, we find that researchers can aggregate across multiple administrations of the IAT. Aggregating across multiple administrations, particularly via latent variables, can yield more robust estimates of traits. These findings illuminate a new approach to studying implicit social cognition that empowers researchers to develop a better understanding of individual differences in implicit bias.
Supplemental Material
sj-docx-1-psp-10.1177_01461672221099372 – Supplemental material for Individual Differences in Implicit Bias Can Be Measured Reliably by Administering the Same Implicit Association Test Multiple Times
Supplemental material, sj-docx-1-psp-10.1177_01461672221099372 for Individual Differences in Implicit Bias Can Be Measured Reliably by Administering the Same Implicit Association Test Multiple Times by Thomas P. Carpenter, Alexandra Goedderz and Calvin K. Lai in Personality and Social Psychology Bulletin
Footnotes
Declaration of Conflicting Interests
The author(s) declared the following potential conflicts of interest with respect to the research, authorship, and/or publication of this article: Lai is the Chair of the Scientific Advisory Board and a consultant with Project Implicit, Inc., a non-profit organization and international collaborative of researchers who are interested in implicit social cognition.
Funding
The author(s) received no financial support for the research, authorship, and/or publication of this article.
Supplemental Material
Supplemental material is available online with this article.
Notes
References
Supplementary Material
Please find the following supplemental material available below.
For Open Access articles published under a Creative Commons License, all supplemental material carries the same license as the article it is associated with.
For non-Open Access articles published, all supplemental material carries a non-exclusive license, and permission requests for re-use of supplemental material or any part of supplemental material shall be sent directly to the copyright owner as specified in the copyright notice associated with the article.