
Abstract
The industrialized world is becoming more ethnically diverse. Research in several disciplines has suggested that exposure to racial out-groups may be associated with more positive and more negative intergroup attitudes. Given that U.S. states are often at the center of debate regarding diversity-related public policy, we examined how exposure to out-groups is associated with state-level implicit and explicit race bias among White and Black Americans. We found that larger proportions of Black residents across U.S. states were associated with stronger implicit and explicit in-group bias among both White and Black respondents. State-level bias was predicted by proportions of Black residents even when controlling for (a) state-level demographic control variables (e.g., median income), (b) proportions of non-Black minorities, and (c) historical membership in the Confederacy. Our results convey the importance of investigating why diversity may not always have the positive impact on intergroup relations that one might hope it to have.
Ethnic diversity is on the rise in virtually all industrialized countries (Coleman, 2006), and researchers are increasingly interested in understanding the consequences and correlates of exposure to members of racial out-groups. Greater diversity is associated with benefits such as improved group problem solving (Page, 2007) and enhanced educational outcomes (Chang, 1999). However, diversity may also have downsides, including decreased trust and increased social isolation (Putnam, 2007). Within psychology, research on the relationship between diversity and explicit intergroup bias has similarly reached opposing conclusions, suggesting that exposure to racial out-groups may be associated with either more positive or more negative intergroup relations (e.g., Sigelman & Welch, 1993; cf. Bobo, 1988). In this research, we investigated whether exposure to racial out-groups is positively or negatively associated with intergroup bias measured at the implicit (i.e., more indirect or automatic; Fazio & Olson, 2003) and explicit (i.e., more direct and controlled) levels.
Consistent with theories arguing that exposure to out-groups heightens perceptions of threat and competition (LeVine & Campbell, 1972; Riek, Mania, & Gaertner, 2006; Stephan & Stephan, 2000), greater exposure to racial minorities is often associated with increased explicit bias. For example, among White respondents sampled from comparable cities in the U.S. North and South, those in the South expressed stronger explicit anti–Black bias; and within the South, anti–Black bias was greater in regions with more African American residents (Pettigrew, 1959). Similarly, larger proportions of African American residents within communities have also been linked to lower support for racial integration and greater perceived threat among White residents (Fossett & Kiecolt, 1989; Taylor, 1998; see also Ayers, Hofstetter, Schnakenberg, & Kolody, 2009, for similar effects with exposure to Latino residents).
However, other work argues that exposure to out-groups reduces threat and intergroup bias (Allport, 1954; Pettigrew & Tropp, 2006). This research has found that greater exposure to out-groups is associated with lower explicit bias among majority-group members. For instance, relative to living in East Germany, residing in West Germany (that has more non-German residents) predicted lower explicit prejudice among native Germans (Wagner, Van Dick, Pettigrew, & Christ, 2003). Moreover, as the proportion of non-German residents within German districts increased, negative explicit evaluations of non-Germans among native Germans decreased (Wagner, Christ, Pettigrew, Stellmacher, & Wolf, 2006). Similarly, greater community-level ethnic diversity in the United Kingdom was associated with perceptions that ethnic diversity was respected and groups of different backgrounds interacted positively (Laurence, 2009).
Thus, exposure to racial out-groups can predict either greater or lower intergroup bias measured at the explicit level. However, given that implicit measures are increasingly relied upon in intergroup research (Fazio & Olson, 2003) and may be more strongly influenced (relative to explicit measures) by one’s cultural environment (e.g., observing local status differences; Rudman, 2004; see also Newheiser & Olson, 2014), in this work we primarily considered the relationship between exposure to racial out-groups and implicit race bias. To date, most evidence suggests that exposure to racial out-groups may be an effective method of reducing implicit bias (Pearson, Dovidio, & Gaertner, 2009), such that out-group exposure and the quantity of intergroup interaction predict more positive implicit out-group attitudes (Prestwich, Kenworthy, Wilson, & Kwan-Tat, 2008; Turner, Hewstone, & Voci, 2007). However, given that implicit bias is sensitive to environmental associations and societal evaluations of social groups (Karpinski & Hilton, 2001; Rudman, 2004), the direction of the relationship between exposure to out-groups and implicit bias may depend on whether the exposure is primarily positive or negative. Indeed, while positive (vs. negative) exposure to out-group members may be more prevalent, negative exposure may have a more potent influence on intergroup processes (Graf, Paolini, & Rubin, 2014). Thus, we explored whether exposure to out-groups is positively or negatively associated with implicit bias at the level of U.S. states.
We examined implicit bias as indexed by the most commonly used implicit attitude measure, the Implicit Association Test (IAT; Greenwald, McGhee, & Schwartz, 1998). Specifically, we analyzed state-level implicit race bias using data aggregated from over 890,000 race IATs completed via Project Implicit (see Xu, Nosek, & Greenwald, 2014, for information about this publicly available data set). For comparison, we also analyzed aggregated explicit bias, available from the same database. Because few studies have investigated the relationship between exposure to out-groups and minority-group members’ attitudes (see Shelton, 2000), we examined implicit and explicit bias among both Black and White respondents. 1 We focused on the state-level because states are often at the center of debate about diversity-related policy (e.g., immigration; Archibold, 2010), and investigated whether the proportion of Black residents within a U.S. state predicted aggregated intergroup bias among residents of the state (see Christ et al., 2014, for a similar strategy). Understanding how proportions of minority-group and majority-group residents relate to group-level attitudes is helpful in contextualizing the environment within which diversity-related policy and politics occur. Prior work has employed a similar approach in the domains of gender disparities in math and science performance (Nosek et al., 2009) and weight bias (Marini et al., 2013).
Method
Participants
Volunteers completed the race IAT via Project Implicit (https://implicit.harvard.edu/implicit/). To match the available population estimates we employed as predictor variables (see below) while maximizing sample size, we considered data collected from 2008 to 2012 (the full data set contains IAT scores from 2002 to 2012). 2 Because geographic location was a primary predictor, the data set (>3.6 million observations) was restricted to participants within the United States with complete IAT data (N = 1,104,428). The sample was further restricted to participants with adequate IAT performance (using conventions established by Greenwald, Nosek, & Banaji, 2003 and Nosek et al., 2009): Data from participants who made errors on >30% of trials or had reaction times <300 ms on >10% of trials were excluded (approximately 2% of the sample). Finally, excluding respondents who did not self-identify as Black or White yielded a total of N = 893,387 observations. For ease of reporting and because of the large sample size contributing to our state-based analyses, we performed separate analyses on subsamples of White (n = 759,755) and Black (n = 133,632) respondents.
As indicated by demographic information provided on the site, our White and Black samples were highly educated, typically visited the Project Implicit website to fulfill an educational requirement (approximately 40% of participants), and were similar to each other with regard to education level, religiosity, and political orientation (see online materials for details on sample demographics). The actual population of a state was strongly correlated with the number of people who completed the IAT in that state, r(48) = .91, p < .001 (also true at the county level, mean r = .85, SD = .21).
Measures
Implicit bias
We analyzed D scores (Greenwald et al., 2003) that were coded to represent in-group bias: For White respondents, scores above 0 indicated a bias favoring Whites over Blacks and scores below 0 indicated a bias favoring Blacks over Whites; for Black respondents, scores above 0 indicated a bias favoring Blacks and scores below 0 indicated a bias favoring Whites.
Explicit bias
Participants also responded to an item assessing explicit racial attitudes (Nosek et al., 2007). Specifically, participants indicated their relative preference for White and Black Americans on a 7-point scale (1 = I strongly prefer African Americans to European Americans; 4 = I like European Americans and African Americans equally; 7 = I strongly prefer European Americans to African Americans). Scores were recoded to indicate in-group preference and centered at 0 so that possible values ranged from −3 to +3.
Ratio of Black to White residents within states
Estimates of the proportion of residents from different racial/ethnic backgrounds within states were obtained via the American Community Survey (ACS), conducted by the U.S. Census Bureau. We used the ACS 5-year averages of data collected between 2008 and 2012. Because the race IAT measures implicit bias favoring Whites over Blacks (or vice versa), we created a ratio of the number of Black to White residents in each state (with higher numbers indicating more Black residents) to measure intergroup exposure across U.S. states. Similar to prior work using this technique (Alba, Rumbaut, & Marotz, 2005), values were natural logarithm transformed because this ratio was small in states with few Black residents. 3 However, for ease of interpretation, in descriptive statistics and figures the index refers to the untransformed number of Black residents for every 100 White residents, which ranged from 0.47 to 62.3 (median = 9.28).
The ratio of Black to White residents may seem incomplete as an index of exposure to racial out-groups as it ignores the possibility that apparently diverse locales may be divided into homogeneous subregions (Holloway, Wright, & Ellis, 2012). Therefore, to validate this index, we investigated its relationship with racial/ethnic segregation. Specifically, we considered the interaction index, which represents the chances of a Black resident encountering a White resident (or vice versa) in a given spatial unit (Massey & Denton, 1988). Interaction index scores range from 0 to 1, with scores near 0 indicating that Black and White residents in an area are unlikely to meet (high segregation and low diversity) while scores near 1 indicate that encounters between individuals from different racial groups are likely (low segregation and high diversity). Because segregation is typically measured at the level of relatively small geographical units (e.g., the U.S. Census tract level; e.g., Iceland & Scopilliti, 2008), we correlated the interaction index for White and Black residents and the ratio of Black to White residents at the level of U.S. counties (see below for more information about our county-level analyses), again using ACS 5-year estimates. The correlation was strong: White residents, r(813) = .97, p < .001; Black residents, r(813) = −.71, p < .001. These results validate the ratio of Black to White residents as an index of out-group exposure.
Results
We estimated state-level implicit and explicit bias by averaging IAT and explicit bias scores within each state, separately for White and Black respondents (see Nosek et al., 2009). We then investigated whether the ratio of Black to White residents within states predicted state-level implicit and explicit bias among White and Black respondents. 4 Given recent concerns about covariates (Simmons, Nelson, & Simonsohn, 2011), in the main text we report results without any adjustment variables; however, in the online materials we report analyses including covariates used in previous research (Putnam, 2007; Taylor, 1998). In all cases, the association between both implicit and explicit bias and out-group exposure was unchanged in the presence of covariates. All data analytic decisions, including exclusion criteria, selection of control variables, and our use of both state-level and county-level data, were made a priori on conceptual grounds before any data were analyzed.
State-Level Implicit Bias
Validating the state-level approach
We sought to validate the state-level IAT scores by correlating them with another state-level measure of racial bias: percentage of racially charged Google search queries. Specifically, we correlated the average state-level IAT scores for White and Black respondents with the relative percentage of Google search queries of the pejorative word “nigger” or its plural for each state between 2004 and 2007 (i.e., the state with the highest percentage of racially charged search queries was assigned a score of 100; for details, see Stephens-Davidowitz, 2013). The correlation was positive and strong: White respondents, r(48) = .78, p < .001; Black respondents, r(48) = .50, p < .001, lending validity to the aggregated IAT scores.
Primary analyses
On the national level (i.e., collapsing across states), the mean IAT score among Black respondents was 0.04 (SD = 0.44); among White respondents, it was 0.41 (SD = 0.40), mirroring patterns observed in laboratory studies (e.g., Ashburn-Nardo, 2010). For the Black sample, the number of IAT scores per state ranged from 36 to 9,461, with aggregated IAT scores ranging from −0.10 to 0.13 (SD = 0.04). For the White sample, the number of IAT scores per state ranged from 894 to 56,800, with aggregated IAT scores ranging from 0.35 to 0.45 (SD = 0.03). White and Black respondents’ state-level IAT scores were positively correlated, r(48) = .59, p < .001, such that states with stronger implicit in-group bias among White respondents also had stronger implicit in-group bias among Black respondents.
Central to testing the relationship between exposure to racial out-groups and implicit bias, the ratio of Black to White residents within a state (with higher numbers indicating more Black residents) was strongly positively correlated with implicit bias among both White respondents, r(48) = .83, p < .001 (Figure 1, left pane), and Black respondents, r(48) = .76, p < .001 (Figure 2, left pane). Thus, as the ratio of Black to White residents increased, state-level implicit in-group bias among both White and Black respondents increased.
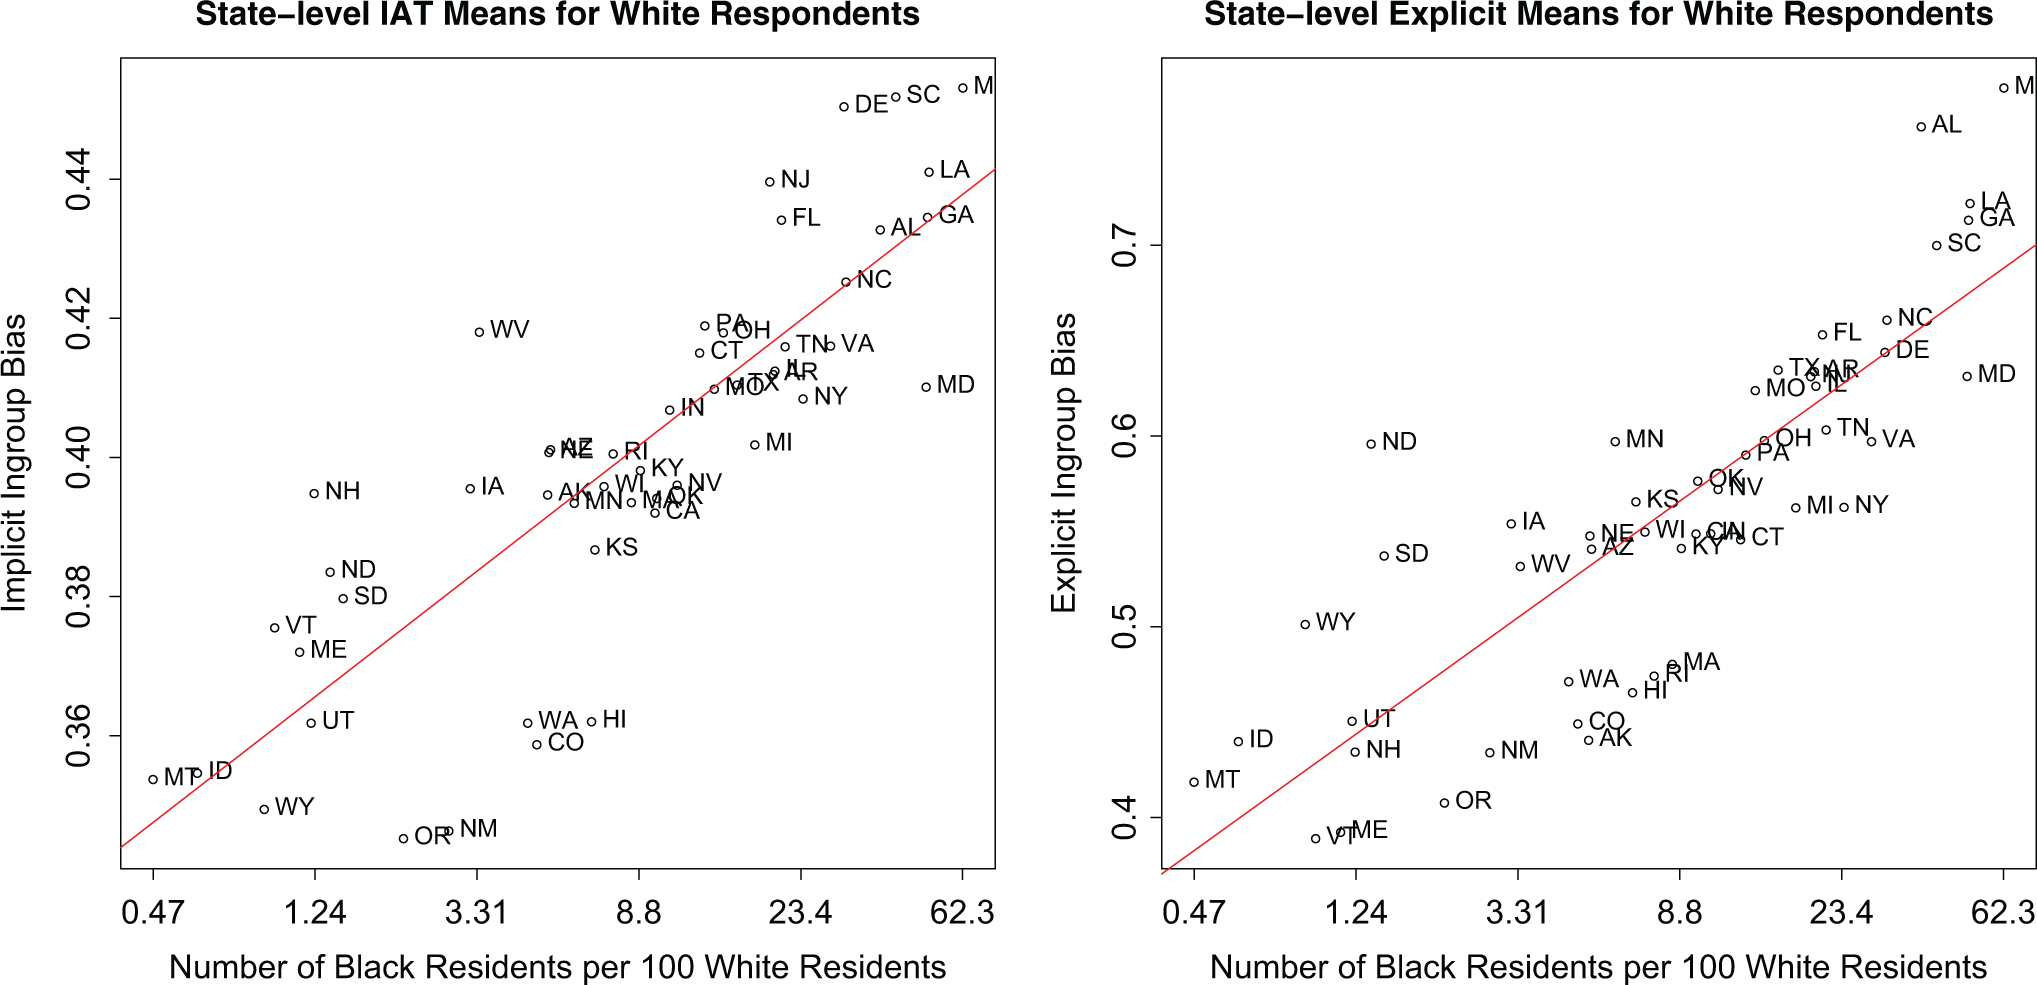
White respondents’ state-level Implicit Association Test (IAT) scores (left pane) and explicit bias scores (right pane) as predicted by the natural log of the ratio of Black to White residents within each state, with a fitted line from a simple linear regression model. Each data point represents a U.S. state.
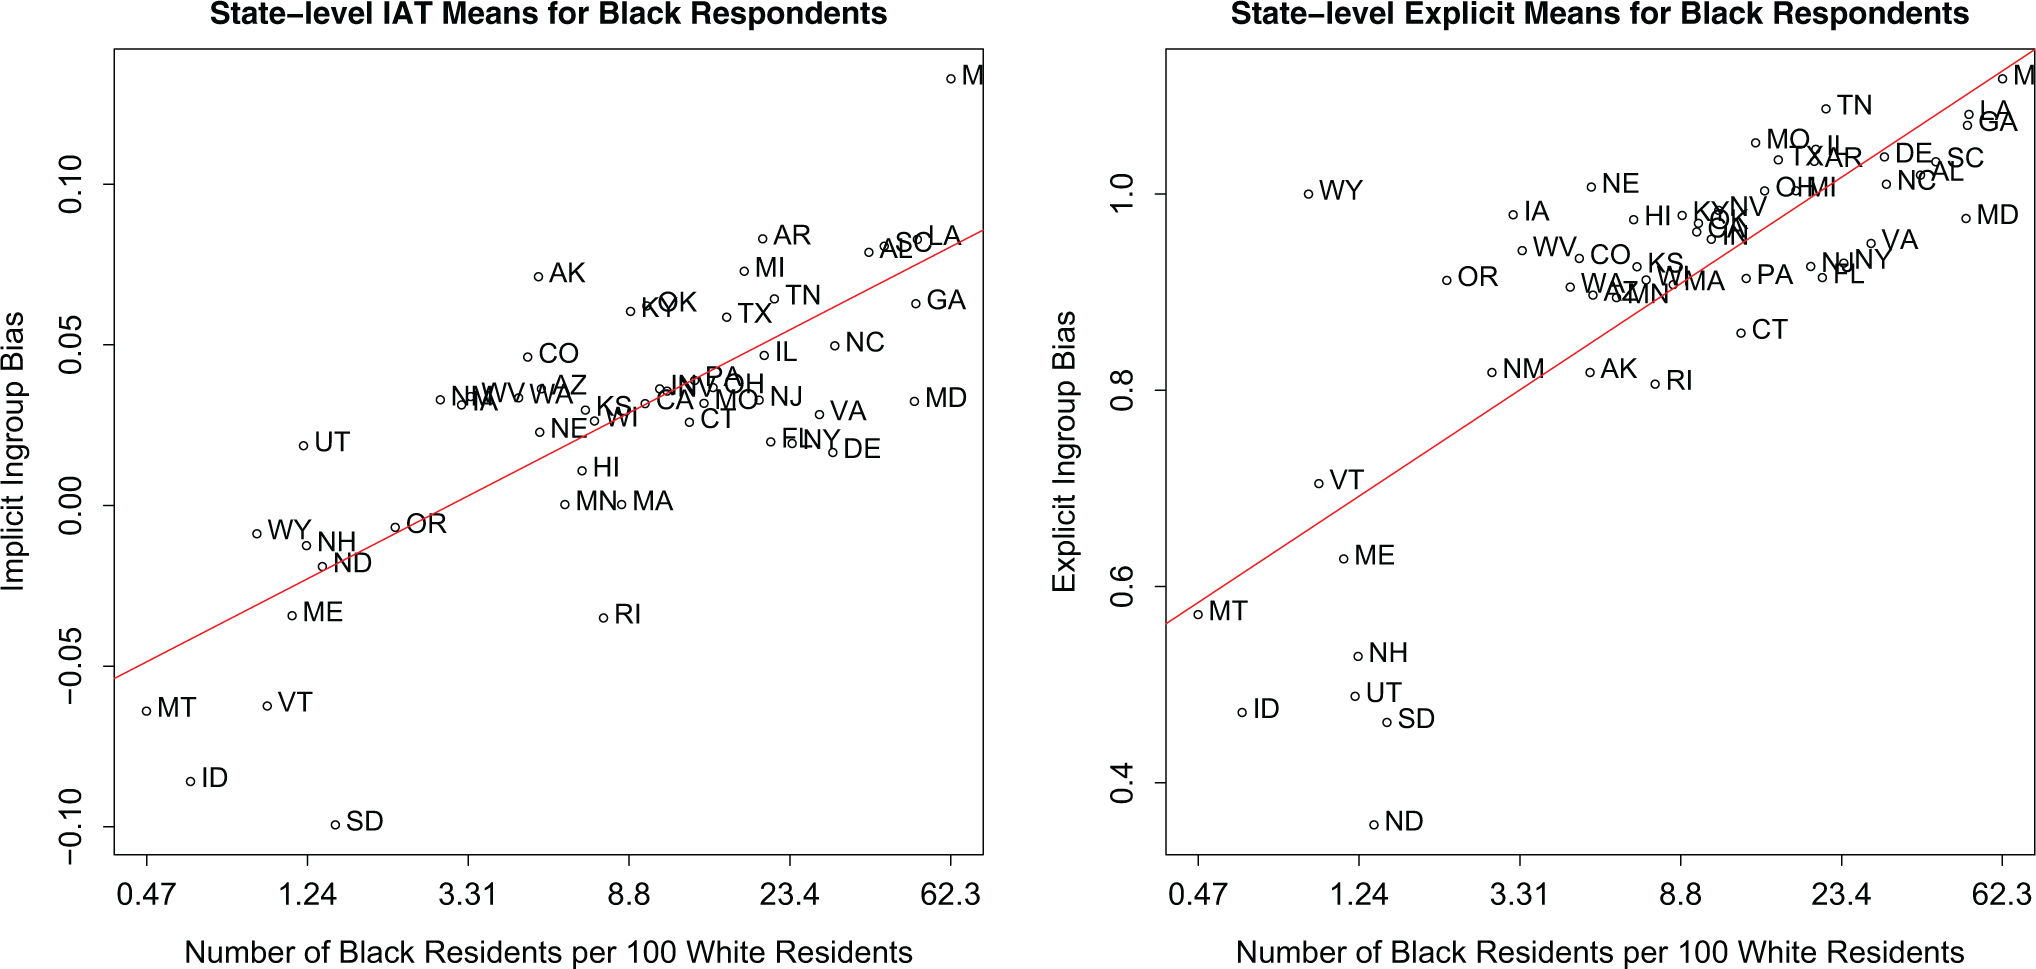
Black respondents’ state-level Implicit Association Test (IAT) scores (left pane) and explicit bias scores (right pane) as predicted by the natural log of the ratio of Black to White residents within each state, with a fitted line from a simple linear regression model. Each data point represents a U.S. state.
Replicating and Extending the State-Level Analyses
Having found evidence of a positive relationship between exposure to racial out-groups and implicit in-group bias, we next sought to replicate this pattern of results across different units of analysis and using additional control variables. Our aim was to document that the relationship between out-group exposure and implicit bias was not spurious or reducible to other variables. The details of these analyses are reported in online materials.
County-level analysis
A potential limitation to the results reported previously is our focus on large regions—U.S. states—which could appear more or less diverse simply because of their inclusion of urban centers with high concentrations of Black residents and rural areas with high concentrations of White residents. Accordingly, we also analyzed the data by U.S. counties (which represent the smallest geographical unit available in the public-use IAT data set, with an average population of approximately 100,000 residents; Xu et al., 2014). We only considered counties with at least 10 observations from White and Black respondents, yielding a sample of 815 counties (mostly located in states high in racial diversity). Although these counties do not represent a sample generalizable to the entire United States, our county-level findings mirrored our state-level findings: The ratio of Black to White residents in a county positively predicted county-level IAT scores in both the White sample, β = .33, p < .001, and the Black sample, β = .38, p < .001.
Overall racial/ethnic diversity
Because the IAT available in the public-use data set (Xu et al., 2014) measures implicit bias favoring Whites over Blacks (or vice versa), our primary predictor was the ratio of these two groups. However, it is possible that overall racial/ethnic diversity, rather than the ratio of Black to White residents specifically, predicts implicit bias. We investigated this possibility by using the ratio of non-Black racial/ethnic minority residents (e.g., Asian, Hispanic, and multiracial residents) to White residents as an additional predictor. For White respondents, state-level IAT scores were not significantly associated with the ratio of non-Black racial/ethnic minority residents to White residents at the bivariate level, r(48) = −.24, p = .100. When considered in the full model (together with the ratio of Black to White residents and all control variables), this index predicted lower state-level implicit bias, β = −.36, p = .005. Importantly, however, the predictive strength of the ratio of Black to White residents was substantially higher, β = .77, p < .001. The ratio of non-Black racial/ethnic minority residents did not predict implicit bias among White residents at the county level. For Black respondents, the ratio of non-Black racial/ethnic minority residents to White residents was not associated with state-level implicit bias in either bivariate or multivariate analyses. The same pattern emerged at the county level.
Southern versus Northern states
Observing that most studies that have revealed a negative relationship between diversity and interracial relations in the United States have surveyed intergroup attitudes in the South, Wagner et al., (2006) hypothesized that unique features of the South may explain this relationship. Our implicit bias results do not align with this hypothesis: The ratio of Black to White residents was positively associated with stronger implicit in-group bias among White and Black respondents across all U.S. states. In addition, even after excluding the 11 former Confederate states from the analysis, the ratio of Black to White residents remained a positive predictor of implicit bias among both Black, β = .68, p < .001, and White respondents, β = .74, p < .001. However, we further tested the possibility that lingering historical biases particular to, or especially pronounced in, Southern states could explain our findings. We included a binary variable indicating whether a state was a member of the Confederate States of America to the saturated state-level model that included both Black and non-Black ethnic/racial diversity and all covariates (see online materials). In a subsequent model, we added the interaction between this binary variable and the ratio of Black to White residents. Neither the main effect nor the interaction predicted implicit bias for either sample. A similar pattern emerged at the county level. 5
State-Level Explicit Bias
The ratio of Black to White residents predicted a similar pattern of results for explicit state-level bias. This ratio correlated strongly and positively with explicit in-group bias among both White respondents, r(48) = .83, p < .001, and Black respondents, r(48) = .78, p < .001 (see online materials for detail). However, explicit bias did differ from implicit bias in that state-level explicit bias among Black respondents (M = 0.90, SD = 0.18) was higher than that reported by White respondents (M = 0.56, SD = 0.10), t(49) = 16.25, p < .001 (see right panes in Figures 1 and 2). This pattern aligns with prior lab results in which White participants typically express stronger implicit in-group bias than Black participants, but Black participants often express stronger explicit in-group bias than White participants (e.g., Ashburn-Nardo, 2010; Livingston, 2002).
Discussion
We aggregated 890,000 observations collected via Project Implicit to investigate the relationship between exposure to members of racial out-groups and group-level implicit and explicit race bias across U.S. states and counties. The pattern of results for implicit and explicit bias was the same: Higher proportions of Black residents in a state or county predicted stronger in-group bias among both White and Black respondents from that state or county. Thus, states like Mississippi and South Carolina that have a higher proportion of Black residents tended to have stronger aggregated in-group bias, relative to states like Montana and Vermont that have few Black residents.
While the differences in state-level IAT scores were modest, with aggregated D scores ranging from 0.35 to 0.45 among White respondents and from −0.10 to 0.13 among Black respondents, even small IAT effects can be associated with large and consequential societal effects (e.g., group-based discrimination in a variety of domains; Greenwald, Banaji, & Nosek, in press). Furthermore, the degree of in-group bias separating Black and White respondents within states was large. For example, the difference in implicit in-group bias for White respondents (D = 0.45) and Black respondents (D = 0.13) from Mississippi was 0.58 (considered a large effect; the smallest difference of implicit bias scores within states was 0.24). Moreover, in-group bias aggregated at the state level revealed a pattern consistent with previous reports that have found that implicit in-group bias is stronger among White (vs. Black) respondents, while explicit in-group bias is stronger among Black (vs. White) respondents (e.g., Ashburn-Nardo, 2010; Livingston, 2002).
Despite the clear pattern in our primary analysis, it is unclear why greater proportions of Black residents are associated with higher in-group bias. One possibility was that our findings were not specific to the presence of Black residents, and in-group bias was rather driven by racial/ethnic diversity more generally. For example, states and counties with high proportions of racial/ethnic minority groups may also have higher proportions of Black residents, which in turn increases overall bias against all racial/ethnic out-group members among both Black and White respondents. In this case, a third variable (overall proportions of racial/ethnic minority residents) would be driving our pattern of results. If this were the case, controlling for the proportions of non-Black racial/ethnic minority residents should diminish, or even eliminate, the relationship between in-group bias and the proportion of Black residents. However, we found that whereas the proportion of non-Black racial/ethnic minority residents did predict implicit bias among White respondents when controlling for state-level covariates (though not at the bivariate level), this variable predicted lower levels of implicit bias and had no effect on the relationship between implicit bias and proportions of Black residents. In addition, greater proportions of non-Black minority residents did not predict bias among Black respondents. This pattern indicates that our results are uniquely tied to the relative proportions of Black and White residents.
Another possible explanation for our results was that historical or structural contexts unique to or more pronounced in the U.S. South could explain the pattern (see Wagner et al., 2003). For example, lingering effects of the slavery era may not only have contributed to high proportions of Black residents in the South relative to other parts of the United States but also created higher levels of historical tension between White and Black residents in the region. Therefore, this historical confound could have driven our results by producing a spurious correlation between proportions of Black residents and in-group bias. However, we found that historical membership in the Confederacy did not moderate the relationship between proportions of Black residents and implicit bias. Further supporting our interpretation, the proportion of Black residents remained a positive predictor of state-level implicit bias even when we excluded the 11 former Confederate states from the analysis. Interestingly, explicit in-group bias was stronger among White respondents from Southern states and counties, perhaps indicating differences in perceived expression norms (e.g., Crandall, Eshleman, & O’Brien, 2002).
One concern that could be raised is that states are too large of a unit of measurement to sufficiently index out-group exposure. Exposure computed at the state-level averages across urban centers with higher proportions of Black residents and rural areas with higher proportions of White residents, potentially failing to represent respondents’ immediate environments. Therefore, it may be that the association between exposure to racial out-groups and in-group bias is only found at the level of U.S. states and does not hold at more fine-grained levels of analysis. However, we found the same pattern of results even at the smaller unit of counties.
Another concern may be that there is an association between the proportion of Black residents and state-level aggregated IAT scores, but that these measures are not optimal indexes of exposure to racial out-groups and group-level implicit bias, respectively (e.g., see Tetlock & Mitchell, 2009, for a criticism of the IAT as a measure of “implicit bias”). This is an important issue, and future research might seek to replicate our pattern of results using alternative measures. While prior research has utilized both the ratio of Black to White residents (Alba et al., 2005) and aggregated IAT scores (within the domains of gender-science stereotypes and weight bias; Marini et al., 2013; Nosek et al., 2009), we attempted to further validate the measures used in this study. We found that the ratio of Black to White residents in a locality was strongly correlated with the interaction index, a measure designed to assess the likelihood that county residents from different racial groups actually encounter each other, providing some validity for our exposure measure. We also report evidence that lends validity to our aggregated state-level IAT scores: These scores were strongly correlated with the percentage of racially charged Google search queries performed in each state. Given that users feel relatively anonymous online, racially charged Google search queries likely index undisclosed attitudes toward race.
Whereas we ruled out some possible reasons for the relationship between out-group exposure and in-group bias, we did not demonstrate why this relationship exists. Future research will benefit from testing potential explanations, such as the ways in which group status may interact with out-group exposure in shaping implicit bias. Implicit bias is sensitive to environmental cues, such as societal evaluations of social groups (Newheiser & Olson, 2014; Rudman, 2004), which likely explains the overall pattern of higher implicit in-group bias among White (higher status group) relative to Black (lower status group) respondents. Critically, out-group exposure may reinforce or undermine intergroup status differentials, which may explain differences in implicit in-group bias within groups and the association between out-group exposure and implicit bias. For example, Black respondents living in areas with low proportions of Black residents experience relatively high exposure to White residents, and as a result may notice status differentials more. As the proportion of Black residents increases, Black respondents have relatively less exposure to White residents (perhaps further exacerbated by ongoing racial segregation; Holloway et al., 2012), likely making low in-group status less salient. In contrast, White respondents living in areas with few Black residents have relatively few encounters with the low-status group, and therefore their high in-group status may not be chronically salient. But for White respondents living in areas with high proportions of Black residents, high in-group status may indeed be chronically salient and may bolster in-group bias. This reasoning would predict the pattern of results we observed in our primary analysis, in which states and counties with higher proportions of Black residents showed stronger in-group bias among both White and Black respondents.
Although our results contribute to a more comprehensive understanding of the relationship between exposure to out-groups and intergroup bias, we acknowledge important limitations. First, our data are correlational and causal relationships cannot be inferred. Second, participants self-selected into our sample by completing the race IAT via the Project Implicit website. Our sample was highly educated and the most common reason why participants visited Project Implicit was to fulfill an educational requirement (approximately 40% of our sample). While between-group differences do not appear to be driving our results (see online materials), our sample is not representative of the United States more broadly. Finally, while there were clear reasons why we focused on aggregated data, this necessarily meant that we averaged out meaningful individual-level variation that can and should be the focus of additional research.
In conclusion, aligning with findings from political science (Putnam, 2007) and sociology (Quillian, 1995), we found that greater proportions of Black, relative to White, residents in U.S. states and counties predicted stronger in-group bias among both White and Black Americans. Although we attempted to isolate the relationship between out-group exposure and race bias (e.g., by using control variables and replicating the pattern across units of analysis), it remains unclear exactly why this pattern emerged. Our results underscore the importance of further investigation into why exposure to racial out-groups—a feature that we strive to increase in our schools, workplaces, and communities—may not always have the beneficial impact it is hoped to deliver.
Footnotes
Acknowledgment
We thank John DeWitt from the Population Studies Center at the University of Michigan for providing county segregation indices and Anthony G. Greenwald for feedback on drafts of this article.
Declaration of Conflicting Interests
The author(s) declared no potential conflicts of interest with respect to the research, authorship, and/or publication of this article.
Funding
The author(s) received no financial support for the research, authorship, and/or publication of this article.
Notes
References
Supplementary Material
Please find the following supplemental material available below.
For Open Access articles published under a Creative Commons License, all supplemental material carries the same license as the article it is associated with.
For non-Open Access articles published, all supplemental material carries a non-exclusive license, and permission requests for re-use of supplemental material or any part of supplemental material shall be sent directly to the copyright owner as specified in the copyright notice associated with the article.