



Abstract
In a selected response test, aberrant responses such as careless errors and lucky guesses might cause error in ability estimation because these responses do not actually reflect the knowledge that examinees possess. In a computerized adaptive test (CAT), these aberrant responses could further cause serious estimation error due to dynamic item administration. To enhance the robust performance of CAT against aberrant responses, Barton and Lord proposed the four-parameter logistic (4PL) item response theory (IRT) model. However, most studies relevant to the 4PL IRT model were conducted based on simulation experiments. This study attempts to investigate the performance of the 4PL IRT model as a slip-correction mechanism with an empirical experiment. The results showed that the 4PL IRT model could not only reduce the problematic underestimation of the examinees’ ability introduced by careless mistakes in practical situations but also improve measurement efficiency.
Keywords
Introduction
In a selected response test, examinees’ responses could be classified into the following three types: (a) responses reflecting examinees’ true ability, (b) correct responses made through lucky guesses, and (c) false responses derived from anxiety, carelessness, or distraction. The latter two types of aberrant responses might cause error in ability estimation because they would not reflect the actual knowledge that examinees possessed. According to the classical test theory (CTT), the aberrant responses might have little effect on ability estimation in a traditional paper-and-pencil (P&P) or computer-based test (CBT) for each item if items are equally weighted. Yet, these aberrant responses may actually lead to estimation error in computerized adaptive tests (CAT).
CAT was designed to tailor item administration in accordance with each examinee’s ability, whereas item response theory (IRT) was used to estimate an examinee’s ability. Each subsequent item would then be selected to be administered based on the test taker’s estimated ability. Hence, an examinee’s aberrant response could cause an estimation error, and accordingly, an inappropriate item selection might occur. To lessen the excessive punishment for careless errors (or “slip”), Barton and Lord (1981) proposed the four-parameter logistic (4PL) IRT model. Later, Rulison and Loken’s (2009) study showed that the 4PL IRT model could effectively reduce underestimation caused by careless error. However, most relevant studies on the 4PL IRT model were conducted based on simulation experiments; few empirical experiments were included.
Therefore, this study aims to investigate the performance of the 4PL IRT model as a slip-correction mechanism in an empirical experiment. The measurement precision and efficiency of the 4PL and 3PL IRT models were discussed and compared with each other within two different administration conditions. The two conditions were a standard condition and a poor-start condition, and, in the latter, the first two items were always scored incorrect.
4PL IRT Model
Generally speaking, there are three kinds of IRT models: the 1PL model, 2PL model, and 3PL model. In the 1PL and 2PL models, the probability of a pass ranges between 0 and 1 as

where the lower asymptote c (guessing parameter) represents the probability that an examinee with extremely low ability would get the item with difficulty b correct. Parameter a is called the discrimination parameter and allows an item to discriminate among the examinees (Harvey & Hammer, 1999).
In the 1PL and 2PL models, the probability should approach 0 when a low-ability student answers difficult items correctly, and it should approach 1 when a high-ability student answers an easy item. Strictly speaking, this assumption might not always be true because an examinee knowing nothing could still select the correct answer by chance. Moreover, the chance would be even stronger if the examinee possessed partial knowledge (Bar-Hillel, Budescu, & Attali, 2005; Burton, 2002; Gardner-Medwin & Gahan, 2003; Yen, Ho, Chen, Chou, & Chen, 2010). However, high-ability students might on occasion miss items that they should have answered correctly when they are anxious, careless, unfamiliar with computer techniques, distracted by poor testing conditions, or even when they misread the question (Hockemeyer, 2002; Rulison & Loken, 2009). Under such conditions, the 3PL model might severely penalize a high-ability student who makes a careless error on an easy item (Barton & Lord, 1981; Rulison & Loken, 2009). More specifically, the lower asymptote in the 3PL IRT model can accommodate the situation when a low-ability student makes a correct guess on a difficult item, but the upper asymptote of 1 in the 3PL model assigns a probability of 0 when a high-ability student fails on an easy item (Loken & Rulison, 2010).
To correct the potential estimation error, Barton and Lord (1981) introduced an upper-asymptote parameter, expressed by the lowercase d, into the 3PL model:

Whereas
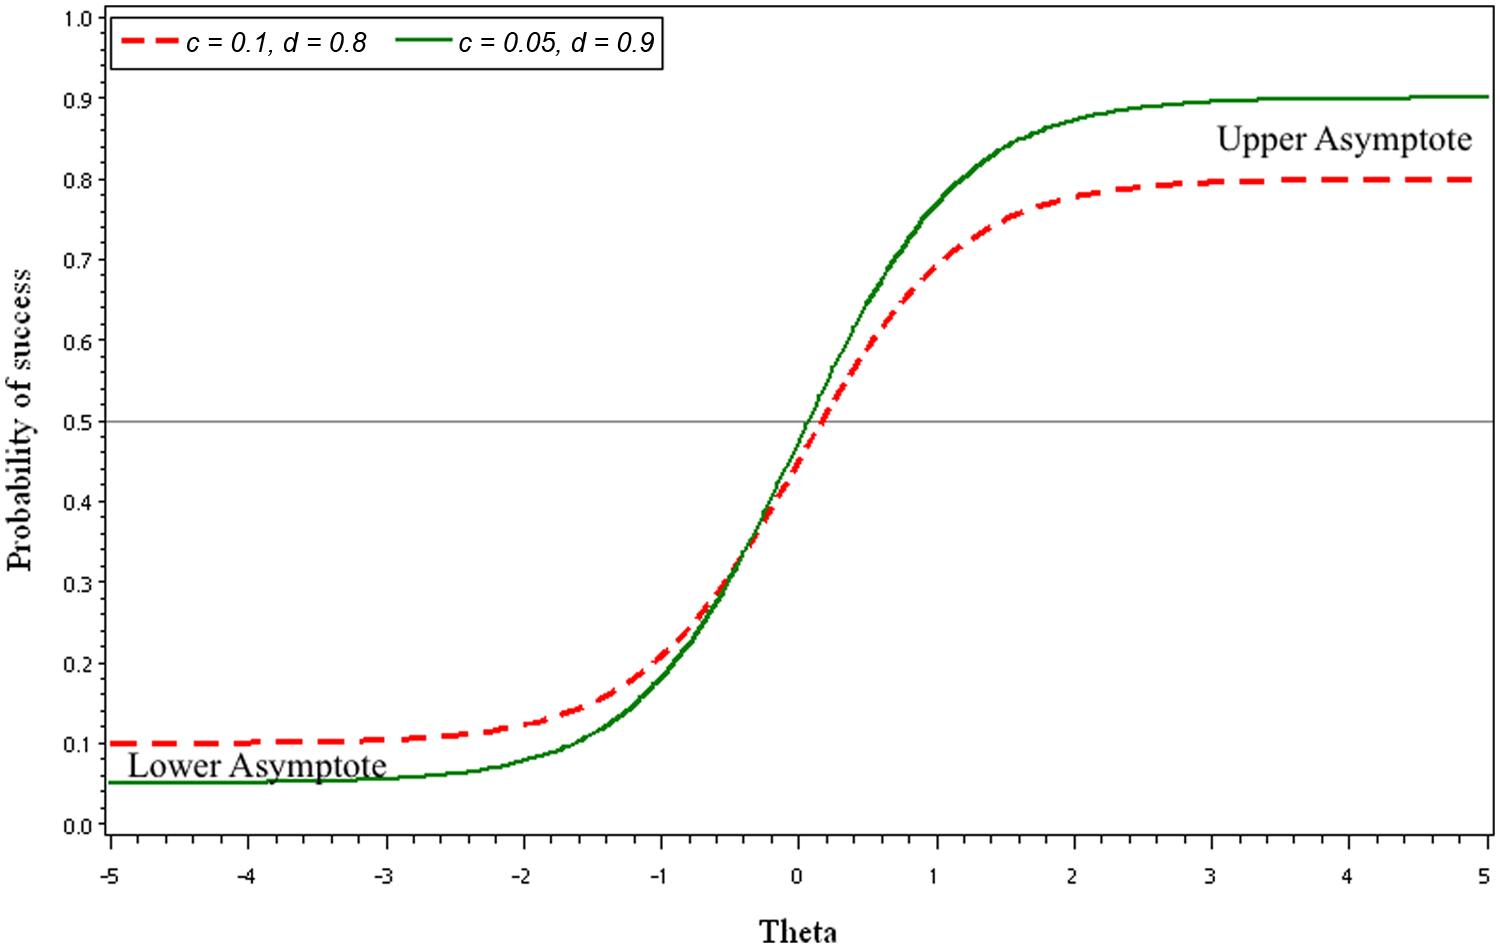
Two typical ICCs for the 4PL IRT model
To evaluate whether changing the upper asymptote is likely to improve the measurement precision of standardized tests, Barton and Lord (1981) compared the 3PL model with the 4PL model under two upper-asymptote values, d = 0.99 and d = 0.98. Reestimating test scores from four data sets: the Scholastic Aptitude Test (SAT) Verbal, SAT Math, Graduate Record Examinations (GRE) Verbal, and Advanced Placement (AP) Calculus AB led to the conclusion that the changes in ability estimation were too small to be of practical significance (Barton & Lord, 1981). However, it should be emphasized that the study mentioned was carried out based on the fixed response data from administered tests in which all examinees received predetermined items from the entire ability range. Hence, the item following the aberrant response was not dynamically selected from the item bank according to examinees’ accumulating information.
Rulison and Loken (2009) conducted two CAT simulation experiments to reevaluate the effect of the upper asymptote on ability estimation in a dynamic CAT environment. Figure 2 shows the trajectories of
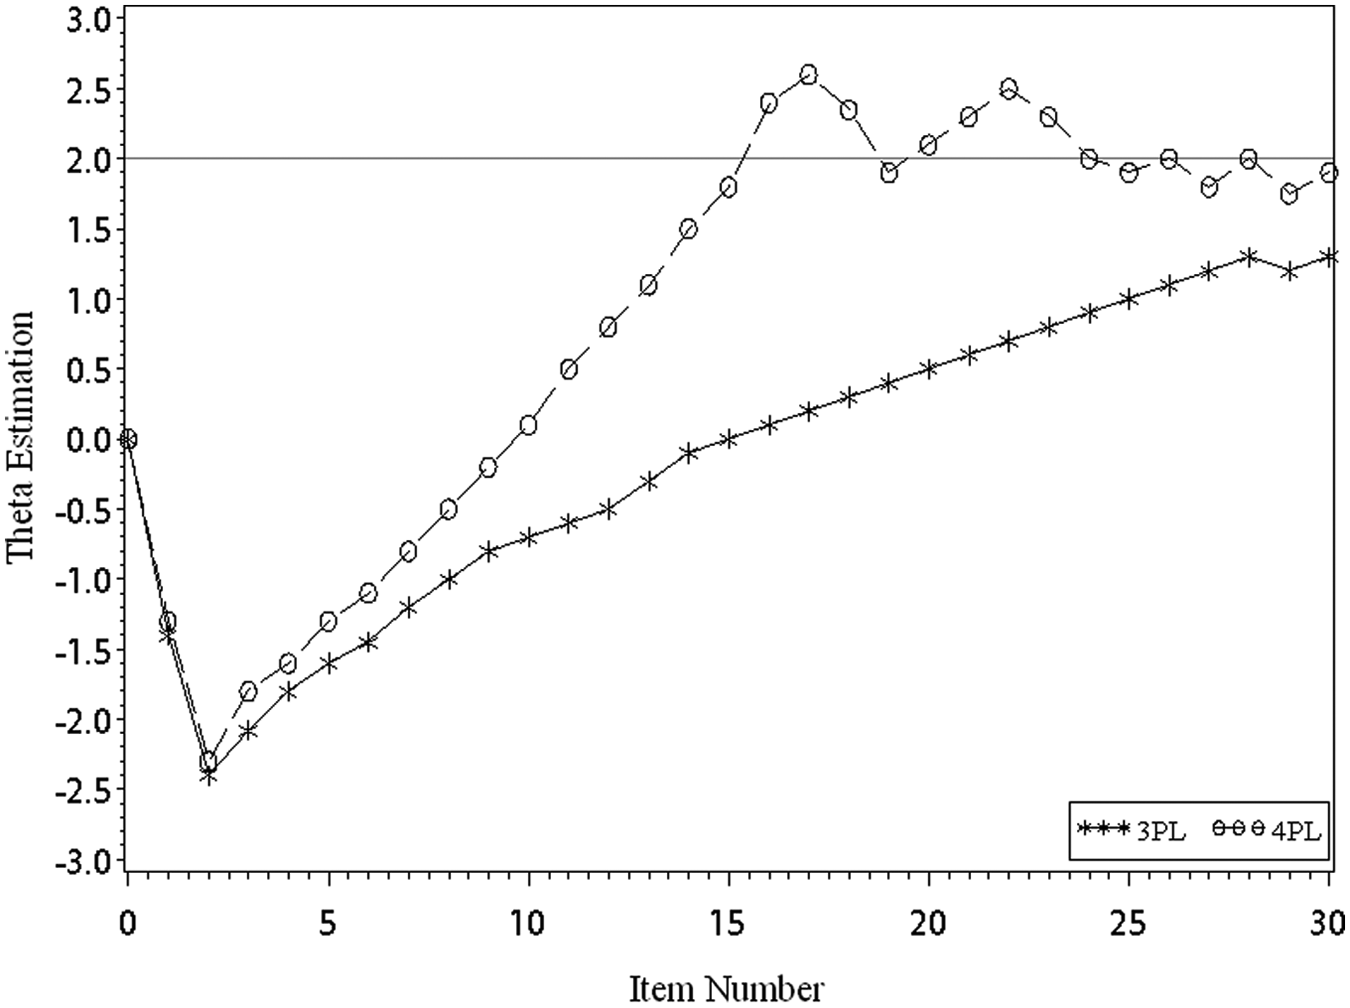
Ability estimation in a poor-start 3PL and 4PL IRT model CAT
To further investigate the general implementation of the 4PL model, Loken and Rulison (2010) conducted their parameter estimation of the 4PL model, assessed its model fit, and evaluated its performance on an empirical, nonstandard IRT test (a self-report measure of delinquency). Instead of using a testwide upper asymptote, an item-specific upper asymptote was estimated in their simulation, and the results from the simulation and the empirical experiment indicated that the 4PL model could provide a refined model fit over the 2PL and 3PL models.
Green (2011) argued that high-ability students made careless errors in only a few cases and that the early errors noted by Rulison and Loken might occur at any time during the test. Hence, the effect was seen on the conventionally administered tests and the CAT, except that the CAT lessens the effect in comparison to a conventionally administered test. However, Green agreed that the asymmetry between lower and upper asymptotes in the 3PL model was the reason why the forced correct responses did not benefit low-ability students to a similar extent as careless errors penalized high-ability students. The empirical experiment that follows was thus conducted to reevaluate the performance of the 4PL model for students of all ability levels.
Method
In this study, an empirical experiment was conducted to compare the measurement precision and efficiency of the 3PL and 4PL IRT models under ordinary administration conditions, and to evaluate the performance of these two models in regard to diminishing estimation error caused by missing early items in a test. The four CAT systems, participant demography, item bank characteristics, and procedure are described in the following.
CAT Systems
Four versions of fixed-length web-based CAT systems were developed for this study: P3CAT, P4CAT, N3CAT, and N4CAT. Within P3CAT and P4CAT, the participants of this study were unaware that the first two items would be judged as wrong regardless of their responses, and that was to create a poor-start administration condition. The remaining test was administered according to the ordinary CAT procedure. The third and fourth tests (N3CAT and N4CAT) were administered according to ordinary CAT procedure, but N3CAT was based on 3PL IRT and N4CAT was based on 4PL IRT. The four CATs are categorized as follows, and the corresponding administration flowcharts are shown in Figure 3:
P3CAT: A CAT based on the 3PL model under a poor-start administration condition
P4CAT: A CAT based on the 4PL model under a poor-start administration condition
N3CAT: A normally administered 3PL-based CAT
N4CAT: A normally administered 4PL-based CAT
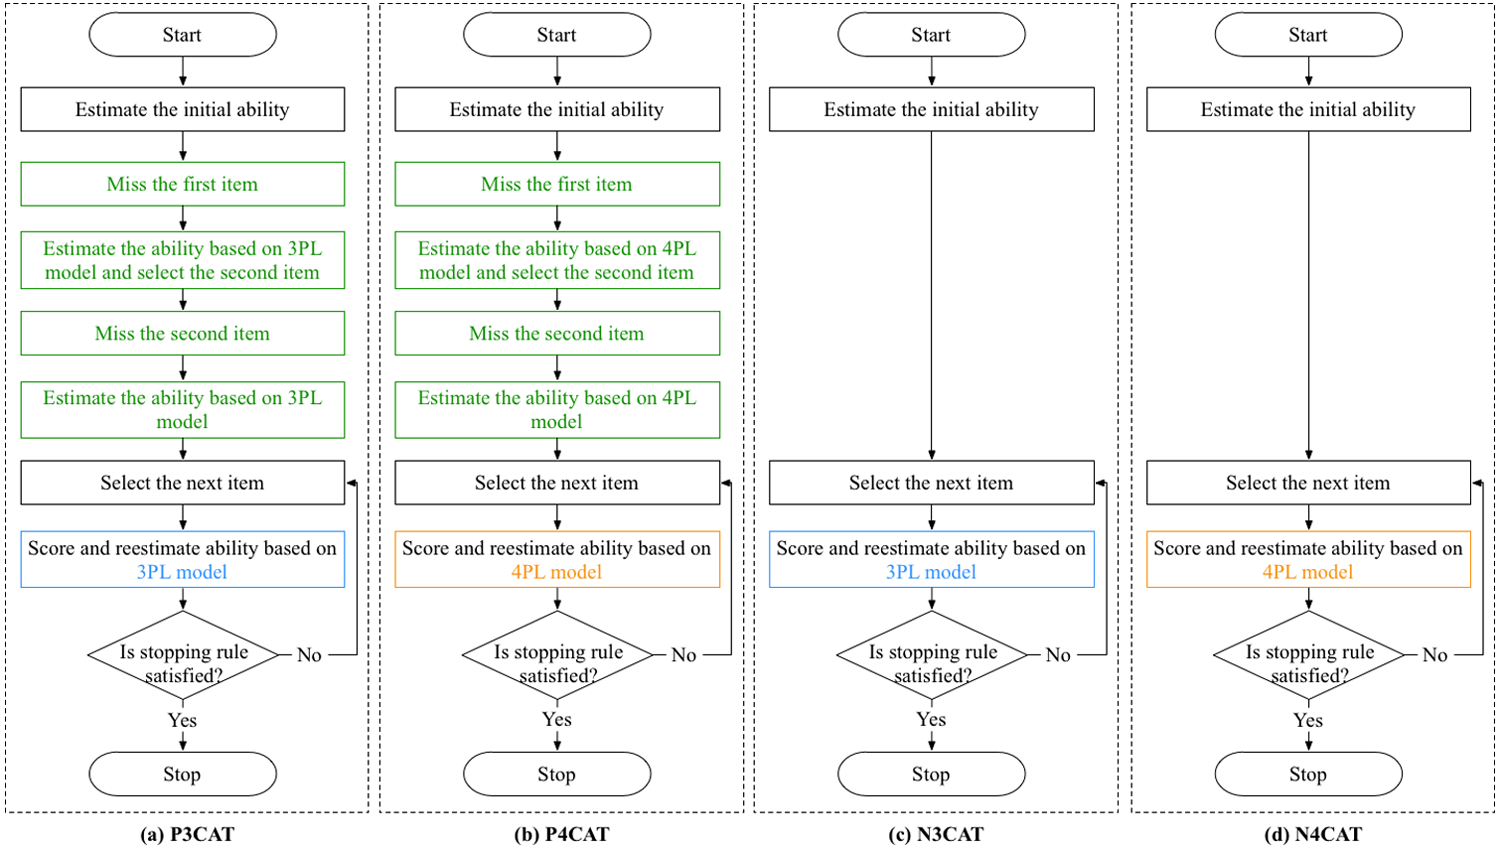
The flowchart of four versions of CAT
Participants
A total of 212 senior high school students (115 boys and 97 girls) from six classes of three different senior high schools participated in this experiment. All participants were aged from 17 to 18, with learning experience via the Internet and computers for more than 3 years, and with learning experience in English for more than 6 years. None of them possessed experience with CAT. As they logged in to the web-based CAT system, the participants would be randomly assigned to one of the four CATs. The participants’ distribution to the four CATs is shown in Table 1.
Gender Distribution of Participants in Four CAT Conditions
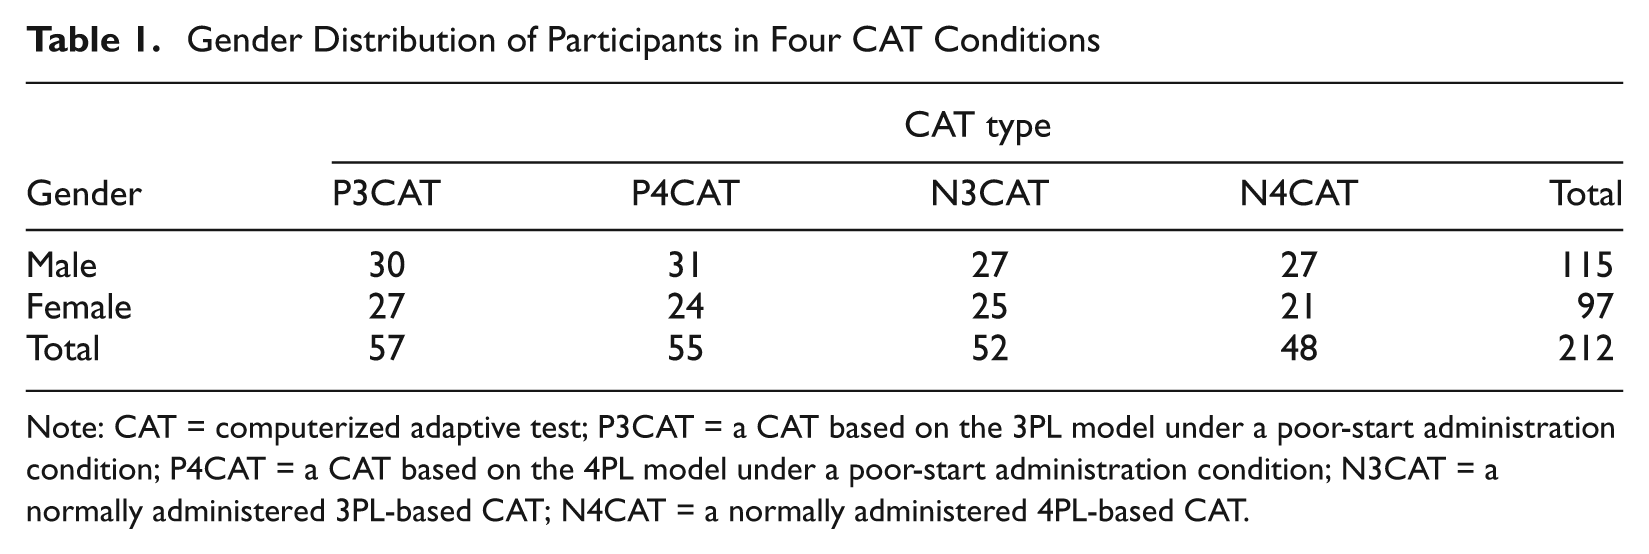
Note: CAT = computerized adaptive test; P3CAT = a CAT based on the 3PL model under a poor-start administration condition; P4CAT = a CAT based on the 4PL model under a poor-start administration condition; N3CAT = a normally administered 3PL-based CAT; N4CAT = a normally administered 4PL-based CAT.
Item Bank
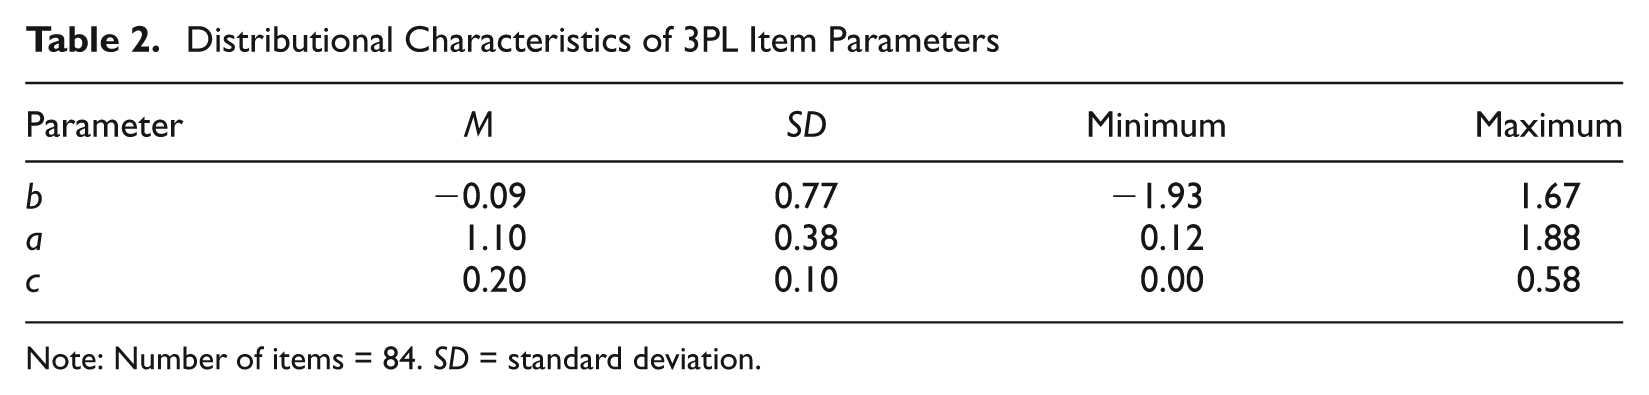
The item bank used in this experiment consisted of 84 items, each with four response options. This item bank was suggested in the study of Ho and Yen (2005), with each item drawn from the English Ability Test for college entrance in Taiwan, administered by the College Entrance Examinations Center (CEEC). The properties of the three parameters in the item bank are shown in Table 2. The test information curve is shown in Figure 4, and it shows that the item bank provided higher information amounts for middle- and high-ability examinees.
Distributional Characteristics of 3PL Item Parameters
Note: Number of items = 84. SD = standard deviation.
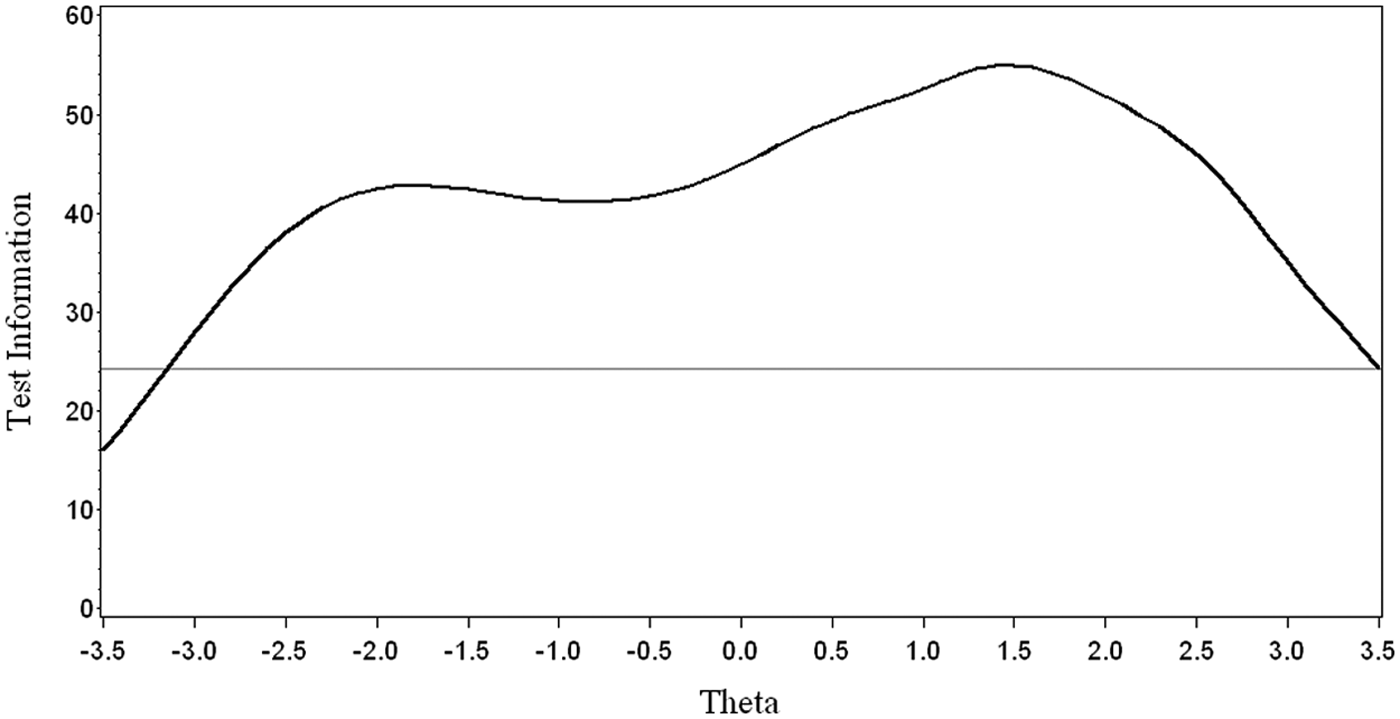
Test information curve of the CEEC item bank
Experimental Procedure
The participants were requested to take a computerized English test in a computer lab, and they were informed that the result would be an important reference for their English ability. A demonstration of how to login and operate the web-based CAT system was then achieved by the experimenter. This was followed by an opportunity to ask questions. Participants were then required to complete the test within 40 min.
All CATs began with an item of medium difficulty to obtain each examinee’s initial ability, and terminated when a preset maximum test length (30 items) was reached. The test length was set to 30 because that should be sufficient to properly estimate the examinee’s ability (McBride, Wetzel, & Hetter, 1997). Expected a posteriori Bayesian estimation (EAP; Bock & Mislevy, 1982) with

and Fisher’s information function for the P4CAT and N4CAT was given as

where
Results
To demonstrate the theta convergence of 3PL- and 4PL-based CAT under a practical situation, from each CAT system, a student of average ability was selected. The results of the estimation trace plots for the four students are shown in Figure 5. The four students were considered to possess identical English competence, as they all got a score of 80 in the English midterm. As the convergence curves show, the P3CAT suffered a more serious initial drop compared with that of the P4CAT, and the P4CAT ascended more rapidly than the P3CAT. However, the trajectory oscillation of N4CAT’s theta estimation ascended more steadily and faster than that of N3CAT. In addition, the final theta estimated by the 4PL-based CAT (P4CAT and N4CAT) was higher than that estimated by the 3PL-based CAT (P3CAT and N3CAT).
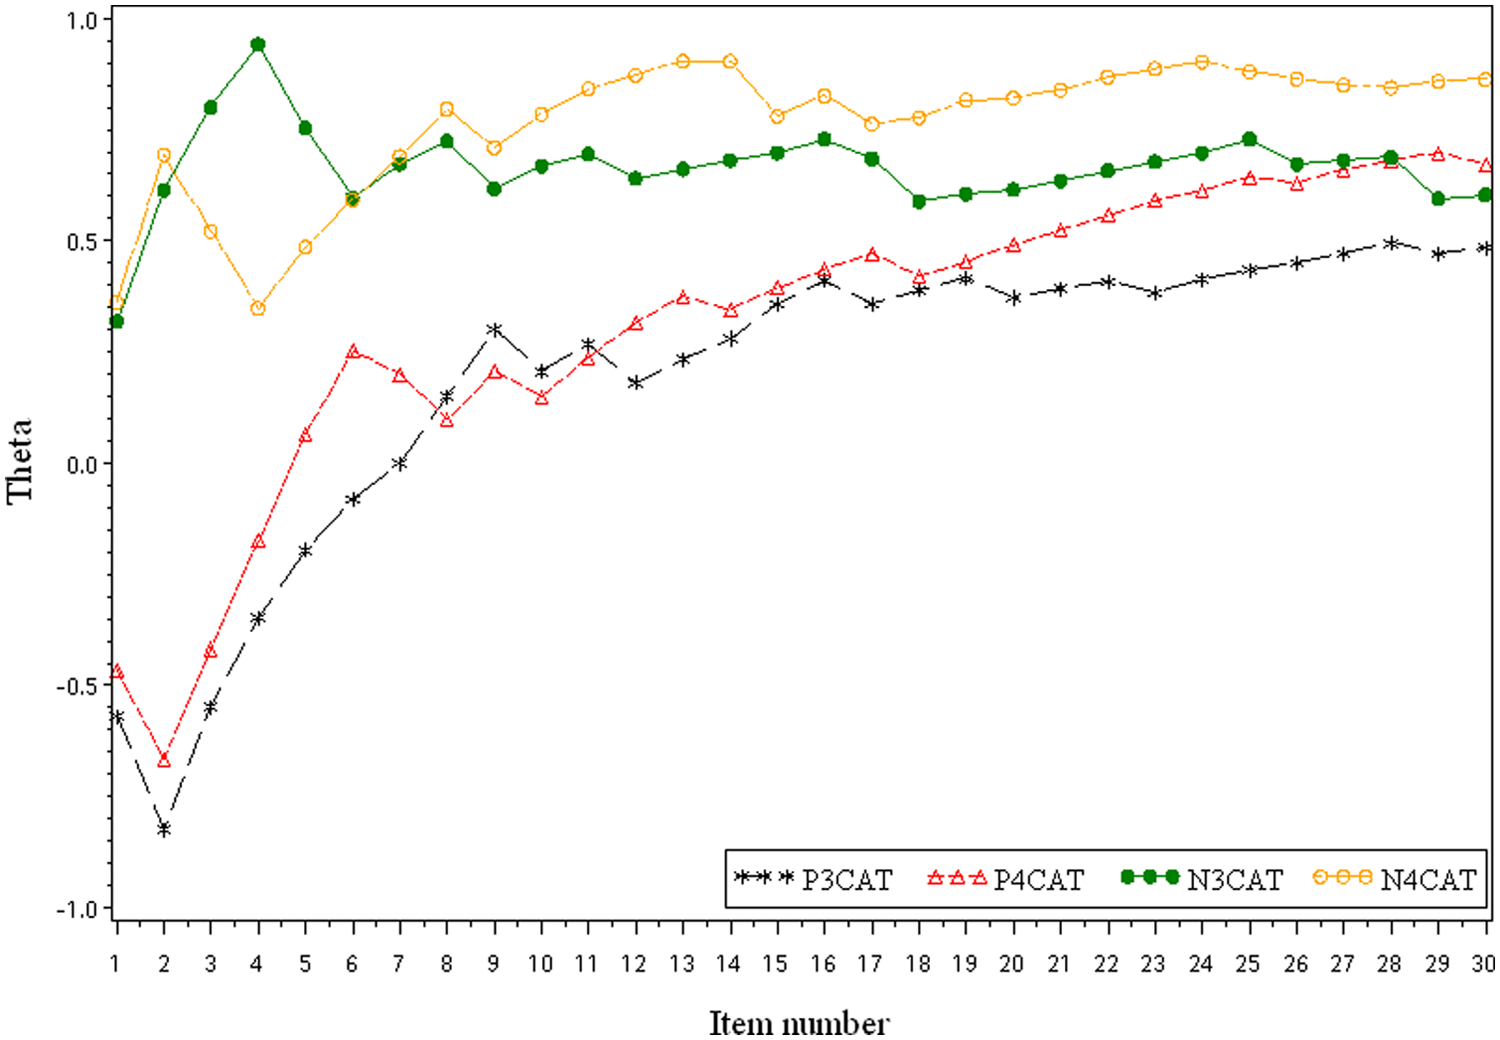
The theta convergence of four CATs in practical situations
The Precision of 3PL- and 4PL-Based CAT
The English midterm test scores of participants were used as indicators to investigate whether participants assigned to different CATs were of the same level of English ability. Table 3 displays the descriptive statistics of participants’ English midterm scores in P3CAT, P4CAT, N3CAT, and N4CAT conditions. No significant difference was found in the English midterm scores among these four groups, F(3, 208) = 0.11, p = .9534.
Descriptive Statistics of Participants’ Midterm Scores in the Four CAT Conditions
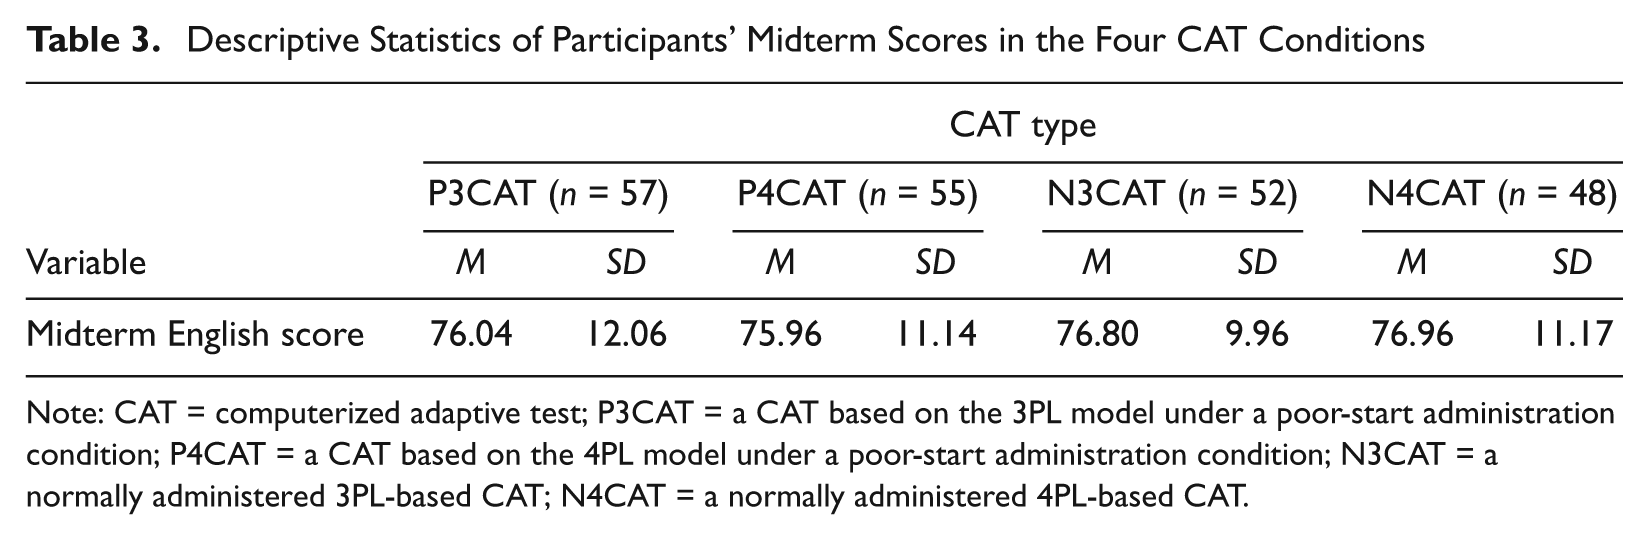
Note: CAT = computerized adaptive test; P3CAT = a CAT based on the 3PL model under a poor-start administration condition; P4CAT = a CAT based on the 4PL model under a poor-start administration condition; N3CAT = a normally administered 3PL-based CAT; N4CAT = a normally administered 4PL-based CAT.
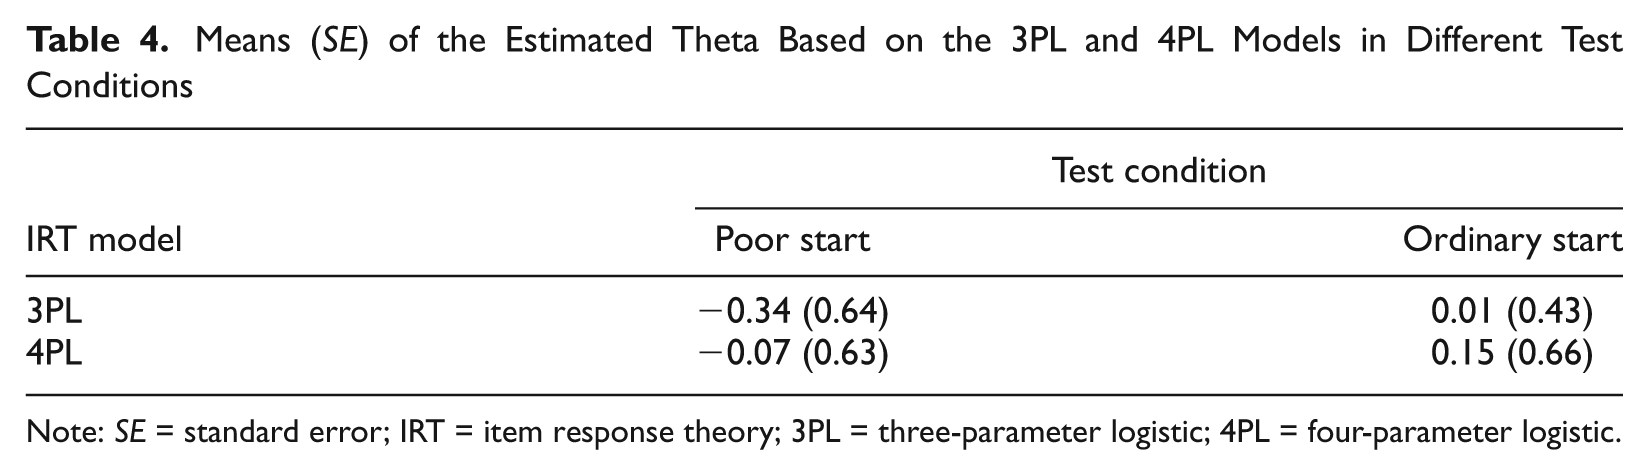
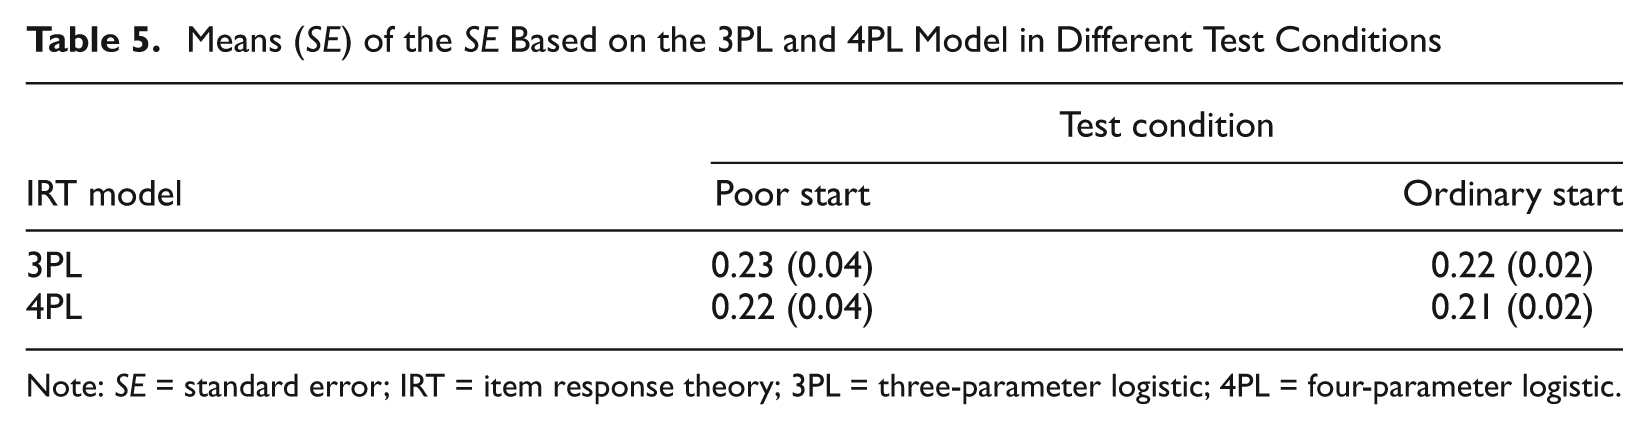
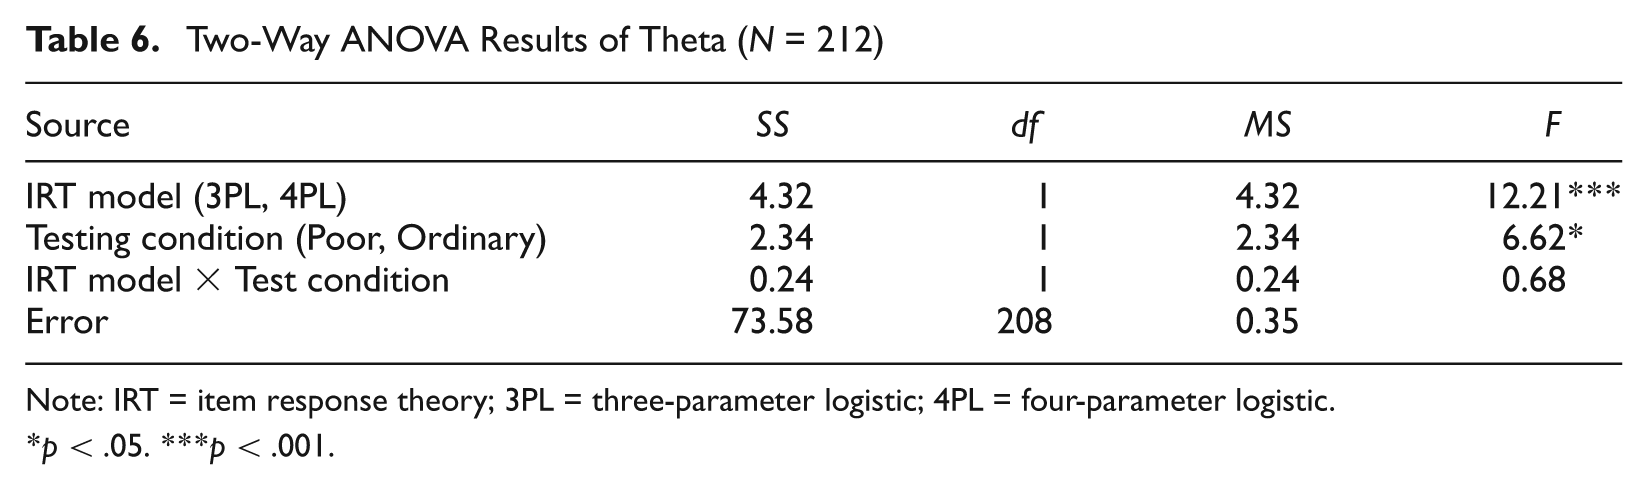
The keynote of this article was the performance of the two IRT models under different testing conditions. The means and standard deviations of estimated theta, along with the corresponding standard errors (SEs), are presented in Tables 4 and 5. The results were subjected to two-way ANOVAs to evaluate how the IRT models (3PL and 4PL) and testing conditions (poor-start and ordinary condition) might affect the theta estimation. As Table 6 shows, no significant interaction was detected between IRT models and testing conditions for estimated theta, F(1, 208) = 0.68, p > .05. However, a significant main effect of the IRT model, F(1, 208) = 12.21, p < .001, and test type, F(1, 208) = 6.62, p < .05, was found. The results revealed that the theta estimated by P4CAT was significantly higher than that estimated by P3CAT in both testing conditions, and the theta estimated in the ordinary condition was higher than that in the poor-start condition.
Means (SE) of the Estimated Theta Based on the 3PL and 4PL Models in Different Test Conditions
Note: SE = standard error; IRT = item response theory; 3PL = three-parameter logistic; 4PL = four-parameter logistic.
Means (SE) of the SE Based on the 3PL and 4PL Model in Different Test Conditions
Note: SE = standard error; IRT = item response theory; 3PL = three-parameter logistic; 4PL = four-parameter logistic.
Two-Way ANOVA Results of Theta (N = 212)
Note: IRT = item response theory; 3PL = three-parameter logistic; 4PL = four-parameter logistic.
p < .05. ***p < .001.
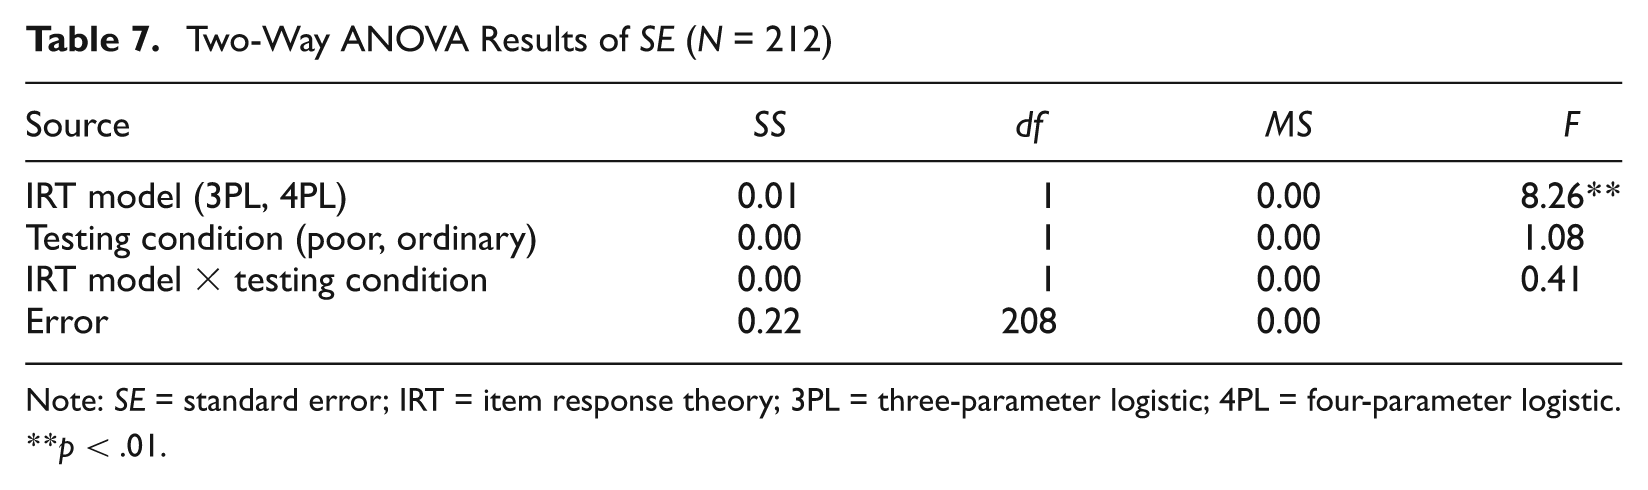
However, Table 7 shows no significant interaction between IRT models and testing conditions in term of SE, F(1, 208) = 0.41, p > .05. The only significant effect found was between different IRT models, F(1, 208) = 8.26, p < .01, which indicated that the SE of the 4PL model was smaller than the 3PL model in both test conditions.
Two-Way ANOVA Results of SE (N = 212)
Note: SE = standard error; IRT = item response theory; 3PL = three-parameter logistic; 4PL = four-parameter logistic.
p < .01.
The Efficiency of 3PL- and 4PL-Based CAT
The efficiency of 3PL- and 4PL-based CAT was evaluated by comparing the number of items required for these CATs to achieve a specified estimation precision. A few stopping criteria for these CATs were set, including an SE reaching 0.45, 0.40, 0.35, and 0.30. Based on these criteria, the numbers of the required items within P3CAT, P4CAT, N3CAT, and N4CAT were compared. Figure 6 depicts the required items for the four CATs as the corresponding SE reaches the different stopping criteria. According to the plots for test length, the efficiency of the 4PL-based CATs (P4CAT and N4CAT) was higher than that of the 3PL-based CATs (P3CAT and N3CAT) under both testing conditions.
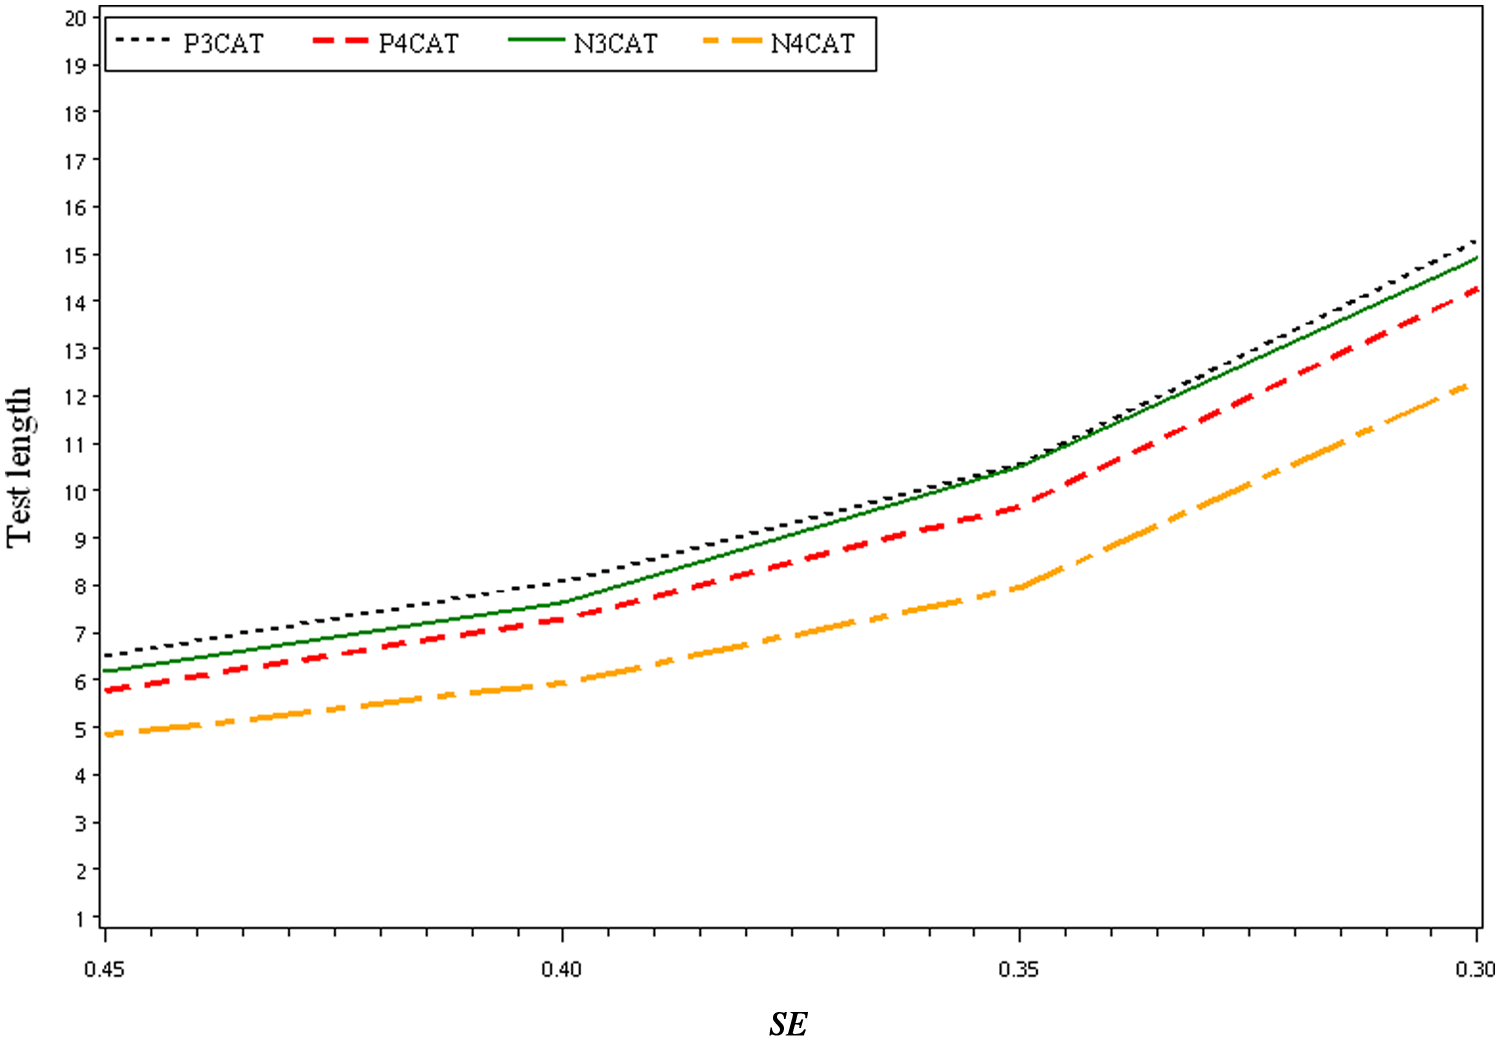
Mean of test length for four CAT conditions
To verify the efficiency statistics of 3PL- and 4PL-based CATs under poor-start and ordinary testing conditions in practical situations, two sets of unpaired t tests were conducted. The results indicated that the efficiency improvement introduced by the 4PL IRT model under the poor-start condition was not statistically significant (as shown in Table 8). However, Table 9 reveals that the 4PL model could improve the CAT’s efficiency significantly under ordinary conditions.
Efficiency Statistics of P3CAT (n = 57) and P4CAT (n = 55)
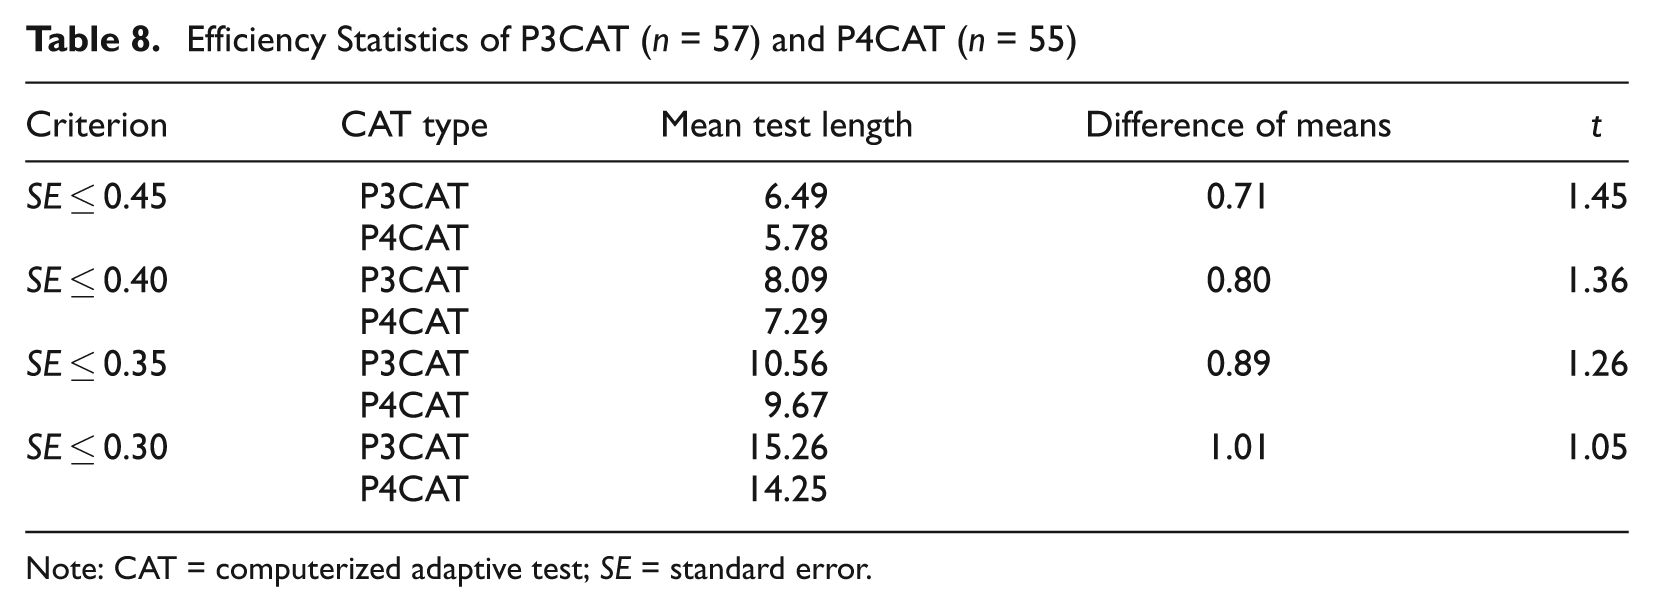
Note: CAT = computerized adaptive test; SE = standard error.
Efficiency Statistics of N3CAT (n = 52) and N4CAT (n = 48)
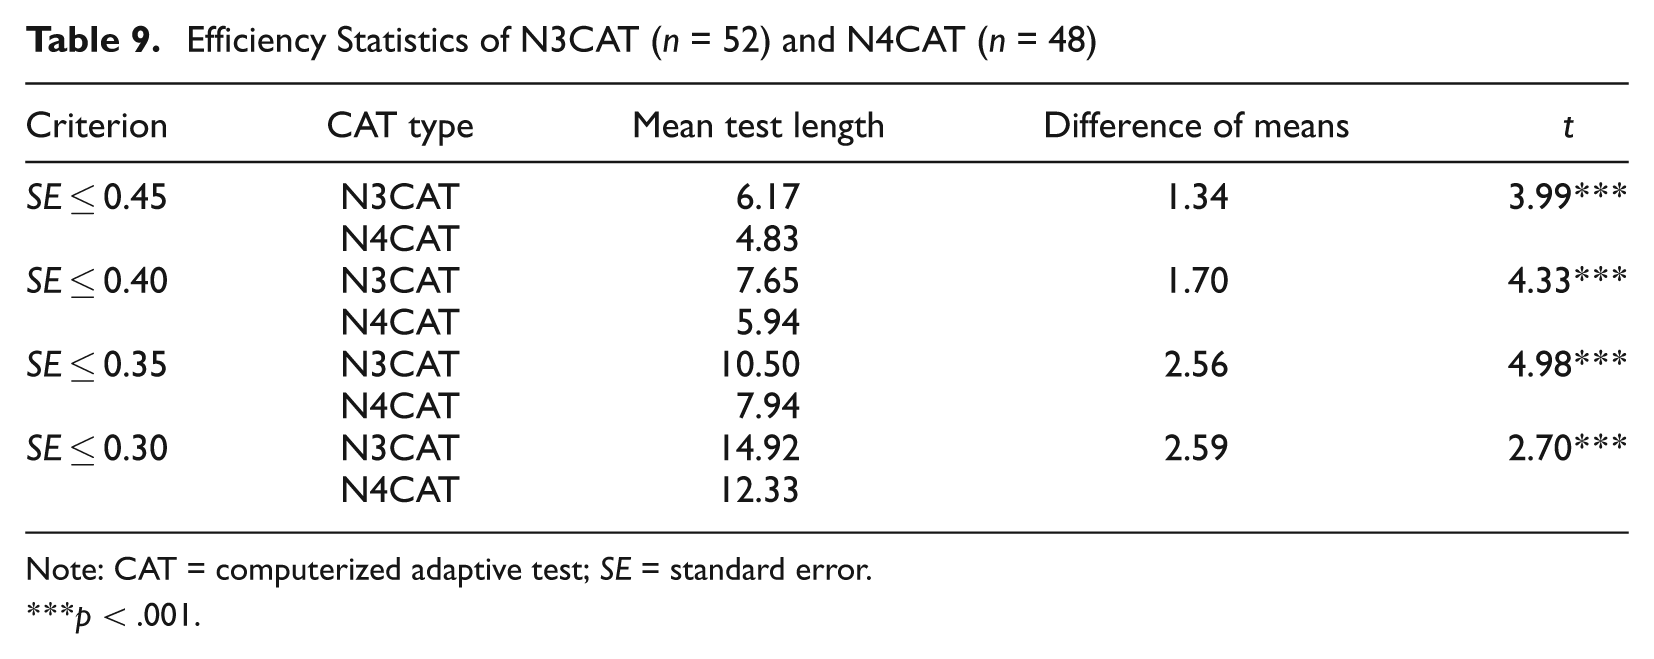
Note: CAT = computerized adaptive test; SE = standard error.
p < .001.
According to this empirical experiment, the following results were obtained: (a) The theta estimated by P4CAT was significantly higher than that estimated by the P3CAT in both tests, (b) the theta estimated under ordinary conditions was also significantly higher than that in poor-start conditions, and (c) under ordinary conditions, test efficiency could be improved significantly with implementation of the 4PL IRT model. The slightly smaller SE of 4PL seems inconsistent with the hypothesis that the addition of the extra parameter would increase the SE value. However, as the 4PL model required fewer items than did the 3PL model to reach a certain SE, as shown in Table 8, it was reasonable that the 4PL estimates had slightly smaller SE than did their 3PL counterparts when the stopping criterion was set to the same fixed numbers of items. Another explanation for the smaller SE of the 4PL model could be that the 4PL model makes the estimation more robust against violations of the know-correct assumptions of IRT (Ackerman, 1989). As a result, the forced errors inconsistent with the examinee’s ability degrade the theta estimate less with the 4PL model than that with the 3PL model.
Conclusion
The objective of assessment is to measure examinees’ true ability accurately. In real testing situations, the confounding effect of lucky guesses and careless errors should be taken into consideration, especially for selected response tests. If these careless errors occur at the beginning of the test, the ability could be underestimated seriously under the 3PL IRT model. Simulation experiments made previously showed that the 4PL IRT model could diminish estimation error due to missing items early on, and that the measurement efficiency and precision could be improved with the model (Rulison & Loken, 2009). Green (2011) further suggested that the choice of the 4PL model meant losing precision for all scores to lessen the impact of one or two blunders on scores for the highly proficient.
In this study, the theta estimated by the 4PL model was higher than that estimated by the 3PL model regardless of the initial errors. Also, the difference in the average theta of 4PL and 3PL in poor-start conditions (0.27, P4CAT-P3CAT) was more obvious than that in ordinary conditions (0.14, N4CAT-N3CAT). The upper asymptote in this study means more tolerance for careless errors from the perspective of the examinees. A similar conclusion has also been made in Green (2011). Meanwhile, it seems that the upper asymptote lessens not only the excessive punishment for early errors but also the punishment for errors at any point of the test. According to this study, the precision of the 4PL IRT model is better than that of the 3PL model in both administration conditions. Finally, under ordinary administration conditions, the efficiency of CAT could be improved with the 4PL model.
In sum, the 4PL IRT model could not only reduce the problems of ability underestimation introduced by initial careless mistakes in practical situations but also improve measurement efficiency. To investigate the evaluation of the 4PL model comprehensively, further studies are required to (a) evaluate the performance of the 4PL model with an item bank in which all four parameters are item specific and calibrated based on empirical response patterns (Loken & Rulison, 2010); (b) investigate the effect of the 4PL model on theta estimation with forced errors occurring in the beginning, middle, and end of CAT; and (c) have examinees take 3PL and 4PL model CATs to compare the differences between these two models.
Footnotes
Acknowledgements
The authors would like to thank the National Science Council of Taiwan for financial support.
The author(s) declared no potential conflicts of interest with respect to the research, authorship, and/or publication of this article.
The author(s) disclosed receipt of the following financial support for the research, authorship, and/or publication of this article: This work was supported in part by the Science Education Division of Taiwan