



Abstract
Position effect, the interaction between a test item’s position in an exam booklet and examinees’ performance, is always of concern in developing test instruments. This study is intended to explore the factors that have interactive effects with prompt position in large-scale writing assessments and to differentiate the impact of each factor. This study analyzed the 2007 National Assessment of Educational Progress writing assessment by comparing three types of p-value scores at the first and second item positions; mixed linear regression models were applied to explore the factors correlated with position effects in the writing assessment. Although examinee motivation was the leading predictor of position effects, the results showed that other factors, such as gender, school type, and teaching emphasis, could also be predictors of position effects in writing performance, and they could be further differentiated by grade and other demographics.
Keywords
A position effect is the interaction between an assessment item’s position as printed in a test booklet and examinees’ performance on that item. In large-scale assessments such as the National Assessment of Educational Progress (NAEP; Allen, Donoghue, & Schoeps, 2001), the influence of position effect is an issue of practical concern in the professional development of test instruments. It usually occurs because of two major factors: the motivation level of an examinee and the overall length of an assessment (Attali & Bar-Hillel, 2003; Kingston & Dorans, 1984), although other factors might also be strongly correlated with position effects.
This study has dual goals: establishing the existence of position effects in large-scale writing assessments and exploring factors that interact with prompt position. In addition to examinee motivation, this study focuses on investigating other factors that are correlated with position effects, such as gender, school type, score of student prewriting activities, and teaching emphasis. Although psychometricians are aware of the existence of position effects in large-scale assessments (Allen et al., 2001), few studies have explored which particular factors significantly interact with prompt position, and fewer still have differentiated the impact of these factors on writing performance at different grade levels.
Literature has shown that taking account of position effect is important to test validity of an assessment (Hahne, 2008; Harris, 1991; Hohensinn et al., 2008). Prior research has shown varied results regarding the effects of item positioning on examinee performance: While some early studies reported a decline in performance on items that appear later on tests (Wise & DeMars, 2005), others reported no disparity in performance on items based on their test position (Zwick, 1991). Yamamoto (2002) found diminishing performance in blocks that were positioned later in a booklet. Yang, O’Neill, and Kramer (2002) used item response time to assess the amount of examinee effort on test items and found that the strongest predictors of the effort received by items were item length and item position.
Although position effects in writing tests have always elicited research interest in test development (Pintrich & Schunk, 2002; Yamamoto, 2002), it is very costly to evaluate the factors that influence position effects because of the enormous cost of collecting the test data from a large-scale writing assessment while tracking an examinee’s demographic information and background. Fortunately, existing NAEP writing assessments provide a ready source of data for studying position effects of large-scale writing assessments. Each of the NAEP writing test booklets contains two 25-min writing prompts (i.e., writing questions/tasks); NAEP uses a partially balanced incomplete blocking (pBIB) design (Allen et al., 2001) to arrange all of the 20 prompts in use by permuting the positions of prompts in test booklets. Moreover, because the NAEP writing assessments are based on probability sampling, the statistical results (including those of position effects) derived from the probability samples are valid population estimates, which are unbiased and have known levels of precision. As a low-stakes test, for all subjects including writing, the NAEP only reports aggregate scores for nation, states, demographic groups, and so on.
The existence of position effects in the NAEP writing assessment can be shown by comparing the responses from the prompt in the first position with those in the second (Qian, Chang, Kaplan, Liang, & Lim, 2001). Although these position effects are known, they have no appreciable influence on reported results because the assessment counterbalanced them by utilizing the aforementioned pBIB design which assembles booklets with fully permuted item block positions. In this study, the p-value scores (Kehoe, 1995) at different positions are used to present the position effects. To make an effectual comparison, three types of p-value scores were used: empirical p-value score, posterior p-value score, and pseudocount-based p-value score. Although all p-value scores share a range of [0.00, 1.00], an empirical p-value score contains no extra information than a usual mean score. The posterior p-value scores and pseudocount-based p-value scores extend conventional method, bringing modeling information to estimation, in particular the item response theory (IRT; Lord, 1980), item parameter estimation, and the Bayesian estimation of score distributions. In addition to p-value scores, the effect sizes (ESs; Cohen, 1988) were also used to measure the position effects in the item analysis. In this study, the mixed linear regression model was used to analyze the interaction between prompt position and explanatory variables. Because the NAEP writing assessments had enormous amount of data including the information about test takers’ background, teachers, and schools, model selection was an essential part of modeling. The possibility of using alternative models, such as fixed-effects regression model, was also discussed (see “Mixed Linear Regression Model” section).
The article is organized as follows: In the “Data Resources” section, the assessment data used and the matrix sampling of its design are described. In the “Analysis of Position Effects in the NAEP Writing Assessments” section, three types of p-value scores are used to analyze position effects, and the results are evidence of position effects in the NAEP writing assessments. In the “Investigation of the Interactions Between Position and Other Factors” section, based on linear regression models, factors that interact with position effects in the writing assessment are explored; of particular note, this study finds inconsistency at different grade levels in the salient factors correlated with position effects. The “Conclusion” section summarizes the findings and offers suggestions for test development.
Data Resources
Samples from the 2007 NAEP writing assessment for Grades 8 and 12 were used in this study. In addition to the cognitive item data gathered from the assessment booklets, the samples also contained the information collected from background questions (demographic and subject-specific), teacher questionnaires, and school questionnaires.
To cover the domain defined by test framework, the prompt pool needs to be sufficiently large; for 2007, the NAEP writing assessment for each grade included a total of 20 prompts from which booklets were created. Under the constraint that no examinee be tested for more than 50 min, matrix sampling was used to test each examinee on two 25-min prompts of the total 20. In testing, examinees only responded to one prompt in each 25-min slot. The prompts are treated as polytomous items, and all of the examinee responses to the prompts were rated according to a six-level scoring guide, namely, 0 (unsatisfactory), 1 (insufficient), 2 (uneven), 3 (sufficient), 4 (skilled), or 5 (excellent). Note that, according to the NAEP scoring guidelines, the “missing” category includes the cases of student responses which are off topic as well as almost blank responses on test booklets. In the NAEP analysis, “missing” responses were treated as if they had not been presented to the examinees (Mislevy & Wu, 1988; Qian et al., 2001), and they had been excluded from the calibration. Following the NAEP writing analysis, only the examinees with non-missing scores were included in the investigation.
The matrix sampling utilized a pBIB design (Allen et al., 2001) to control for positional and contextual effects. A total of 20 prompts were arranged into 40 different booklets and each prompt appeared in 4 booklets. Every booklet contained a pair of two distinct prompts (Qian et al., 2001). The design also balanced the positioning of prompts, that is, every prompt appeared in both the first position and in the second position with equal frequency. To report examinees’ writing proficiency in the United States, NAEP makes use of survey data from all the students assessed. The data are collected by a complex sampling approach based on stratification and clustering techniques (Allen et al., 2001). This study takes into account NAEP’s complex sample design both in obtaining an estimate of means and in deriving an estimated variance of the means. The examinee weights in the sample are used to yield unbiased estimates, and a grouped jackknife approach is used to estimate the standard errors (Qian et al., 2001).
In the analysis, any demographic variables that are used are based on only those examinees for whom data were available at the examinee level. For the main demographic variables such as gender, race/ethnicity, school lunch, and school type, there are no missing values on the data sets delivered by the NAEP contractor, Westat (Allen et al., 2001). For example, the variable of race/ethnicity, sdrace, is derived from school records instead of from a student questionnaire or from being imputed by Westat from several resources on the assumption of missing at random (Little & Rubin, 1987). Some of the variables, obtained from the student, school, and teacher questionnaires, may contain missing values though the actual total amount of missing data was small (usually, less than 2%). If there was a case with missing data, it would be removed from the analysis by the software package.
Analysis of Position Effects in the NAEP Writing Assessments
In this section, the presence of position effects in large-scale writing assessments is presented by comparing three types of p-value scores for prompts in the first and second positions.
Three p-Value Scores as Measures of Position Effects
Empirical p-value score
As in conventional item analysis procedures, the empirical p-value score (Kehoe, 1995; Lord, 1980) for a dichotomous item is the proportion of examinees who obtained a correct answer. For a polytomous writing prompt, the empirical p-value score is defined as the ratio of the weighted mean to the maximum score range. All the prompts in the NAEP writing assessment were extended constructed-response items. In the comparison of empirical p-value scores of identical items in different positions, a significant change of performance in the second position is an indicator of a position effect.
The prompts in the data are extended constructed-response items with six scoring levels from 0 to 5, and calculating the p-value score is based on normalized scores. Let G be the examinee group of interest. Let

where
Empirical p-value scores are estimated from test scores directly, but due to several aspects of the pBIB design, these scores can be incomparable and unstable due to the disparities in the examinee distributions at different positions, inconsistencies in scoring across score levels, and so on. Although the empirical p-value scores are often used to examine position effects in an initial analysis, the posterior p-value scores and pseudo p-value scores, model-based estimates, are also used to refine analysis.
Posterior p-value score
The posterior p-value scores (Rogers, Gregory, Davis, & Kulick, 2007) are based on IRT modeling (Lord, 1980). The constructed-response items applied in writing assessments are modeled by using a generalized partial credit model (GPCM; Allen et al., 2001). Based on the estimates of the examinee ability and the item parameter estimates, the PARSCALE procedure uses a numerical quadrature approach to evaluate the integrals of the marginal maximum likelihood function in the E-step of the expectation–maximization (EM) algorithm. It also estimates the number of examinees in the population expected to have an ability score equivalent in the range of each quadrature point (Mislevy, Johnson, & Muraki, 1992). Let Q be a set of quadrature points on the posterior distribution of ability and K be a set of ordered score categories of the responses to a prompt. The continuous ability distribution is approximated by a set of discrete quadrature points. Let

Let N be the set of examinees in the sample. An estimate of the number of examinees who have the ability equivalent to

where

where 5 is the number of categories minus one in the response to a prompt,

Posterior p-value scores, in contrast to empirical p-value scores, are computed based on all examinees calibrated.
Pseudocount-based p-value score
The pseudo p-value scores are computed based on IRT modeling as well, but the pseudo p-value computation only includes those examinees who were actually administered the item. Pseudo p-value scores are based on pseudocounts, that is, an estimate of the number of examinees who would have correctly answered the item on category k at each specific ability level if the IRT model is correct. Based on the concepts defined earlier, the pseudocounts are calculated according to the following equation:

The pseudo p-value score for all items is calculated as follows:

Again, the pseudocount-based p-value score uses only examinees who have been administered the item.
The Results of the Analysis of the Position Effects
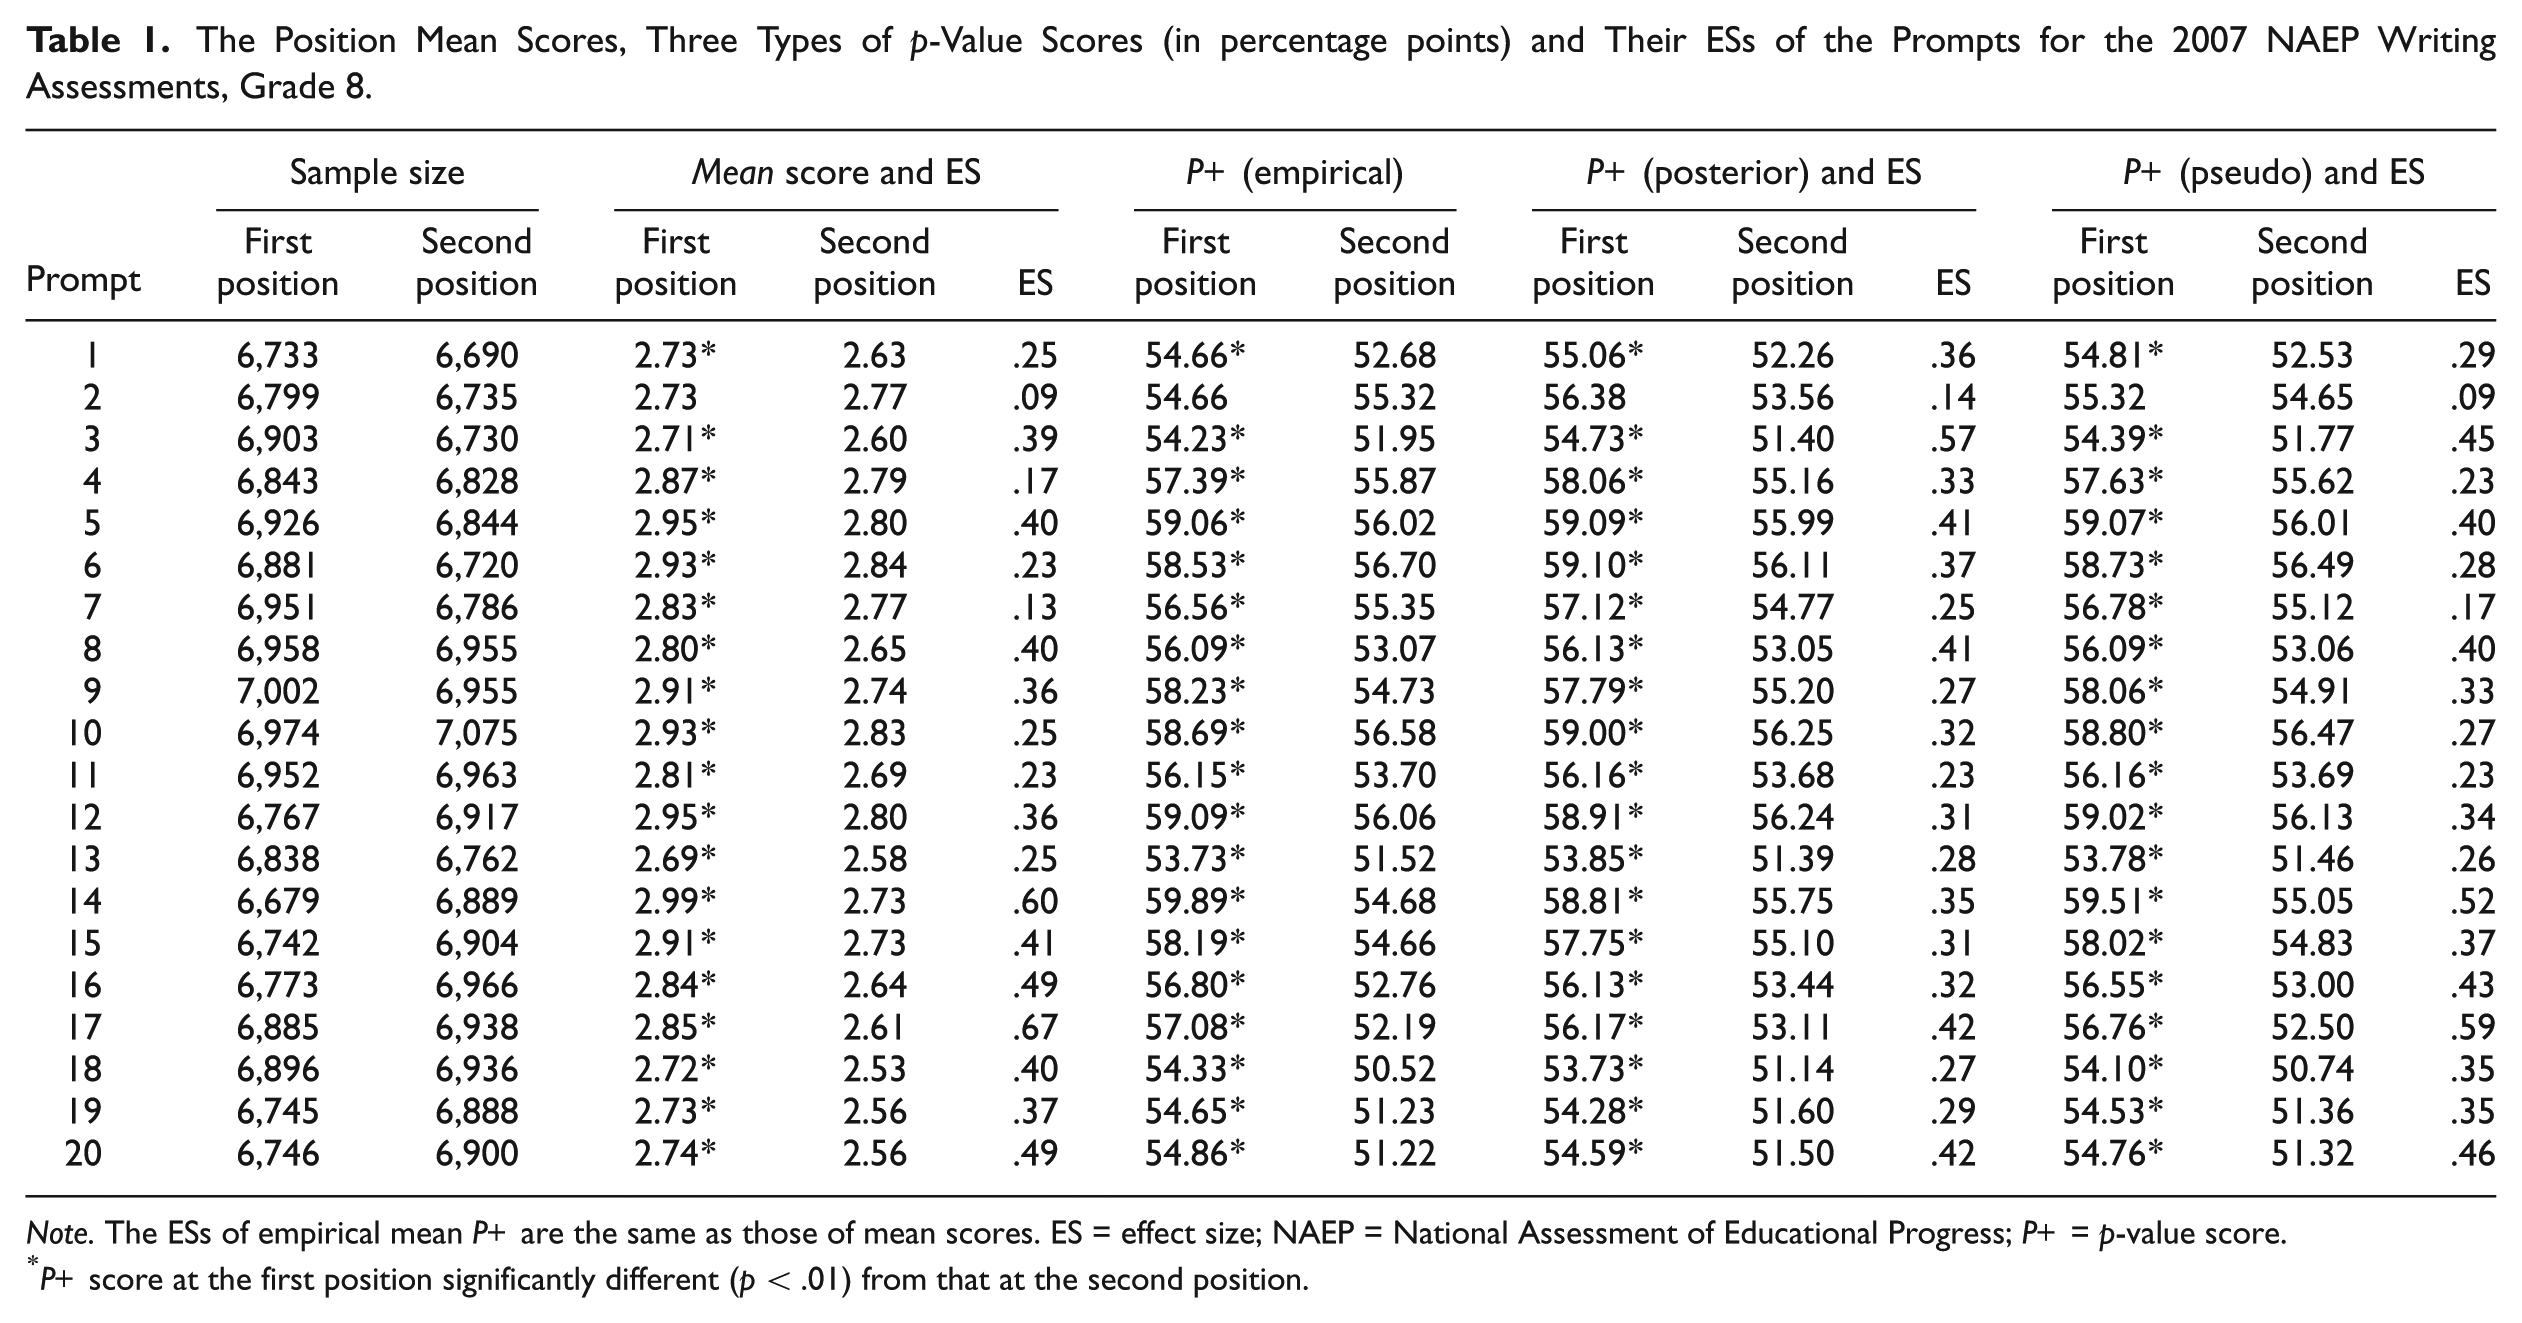
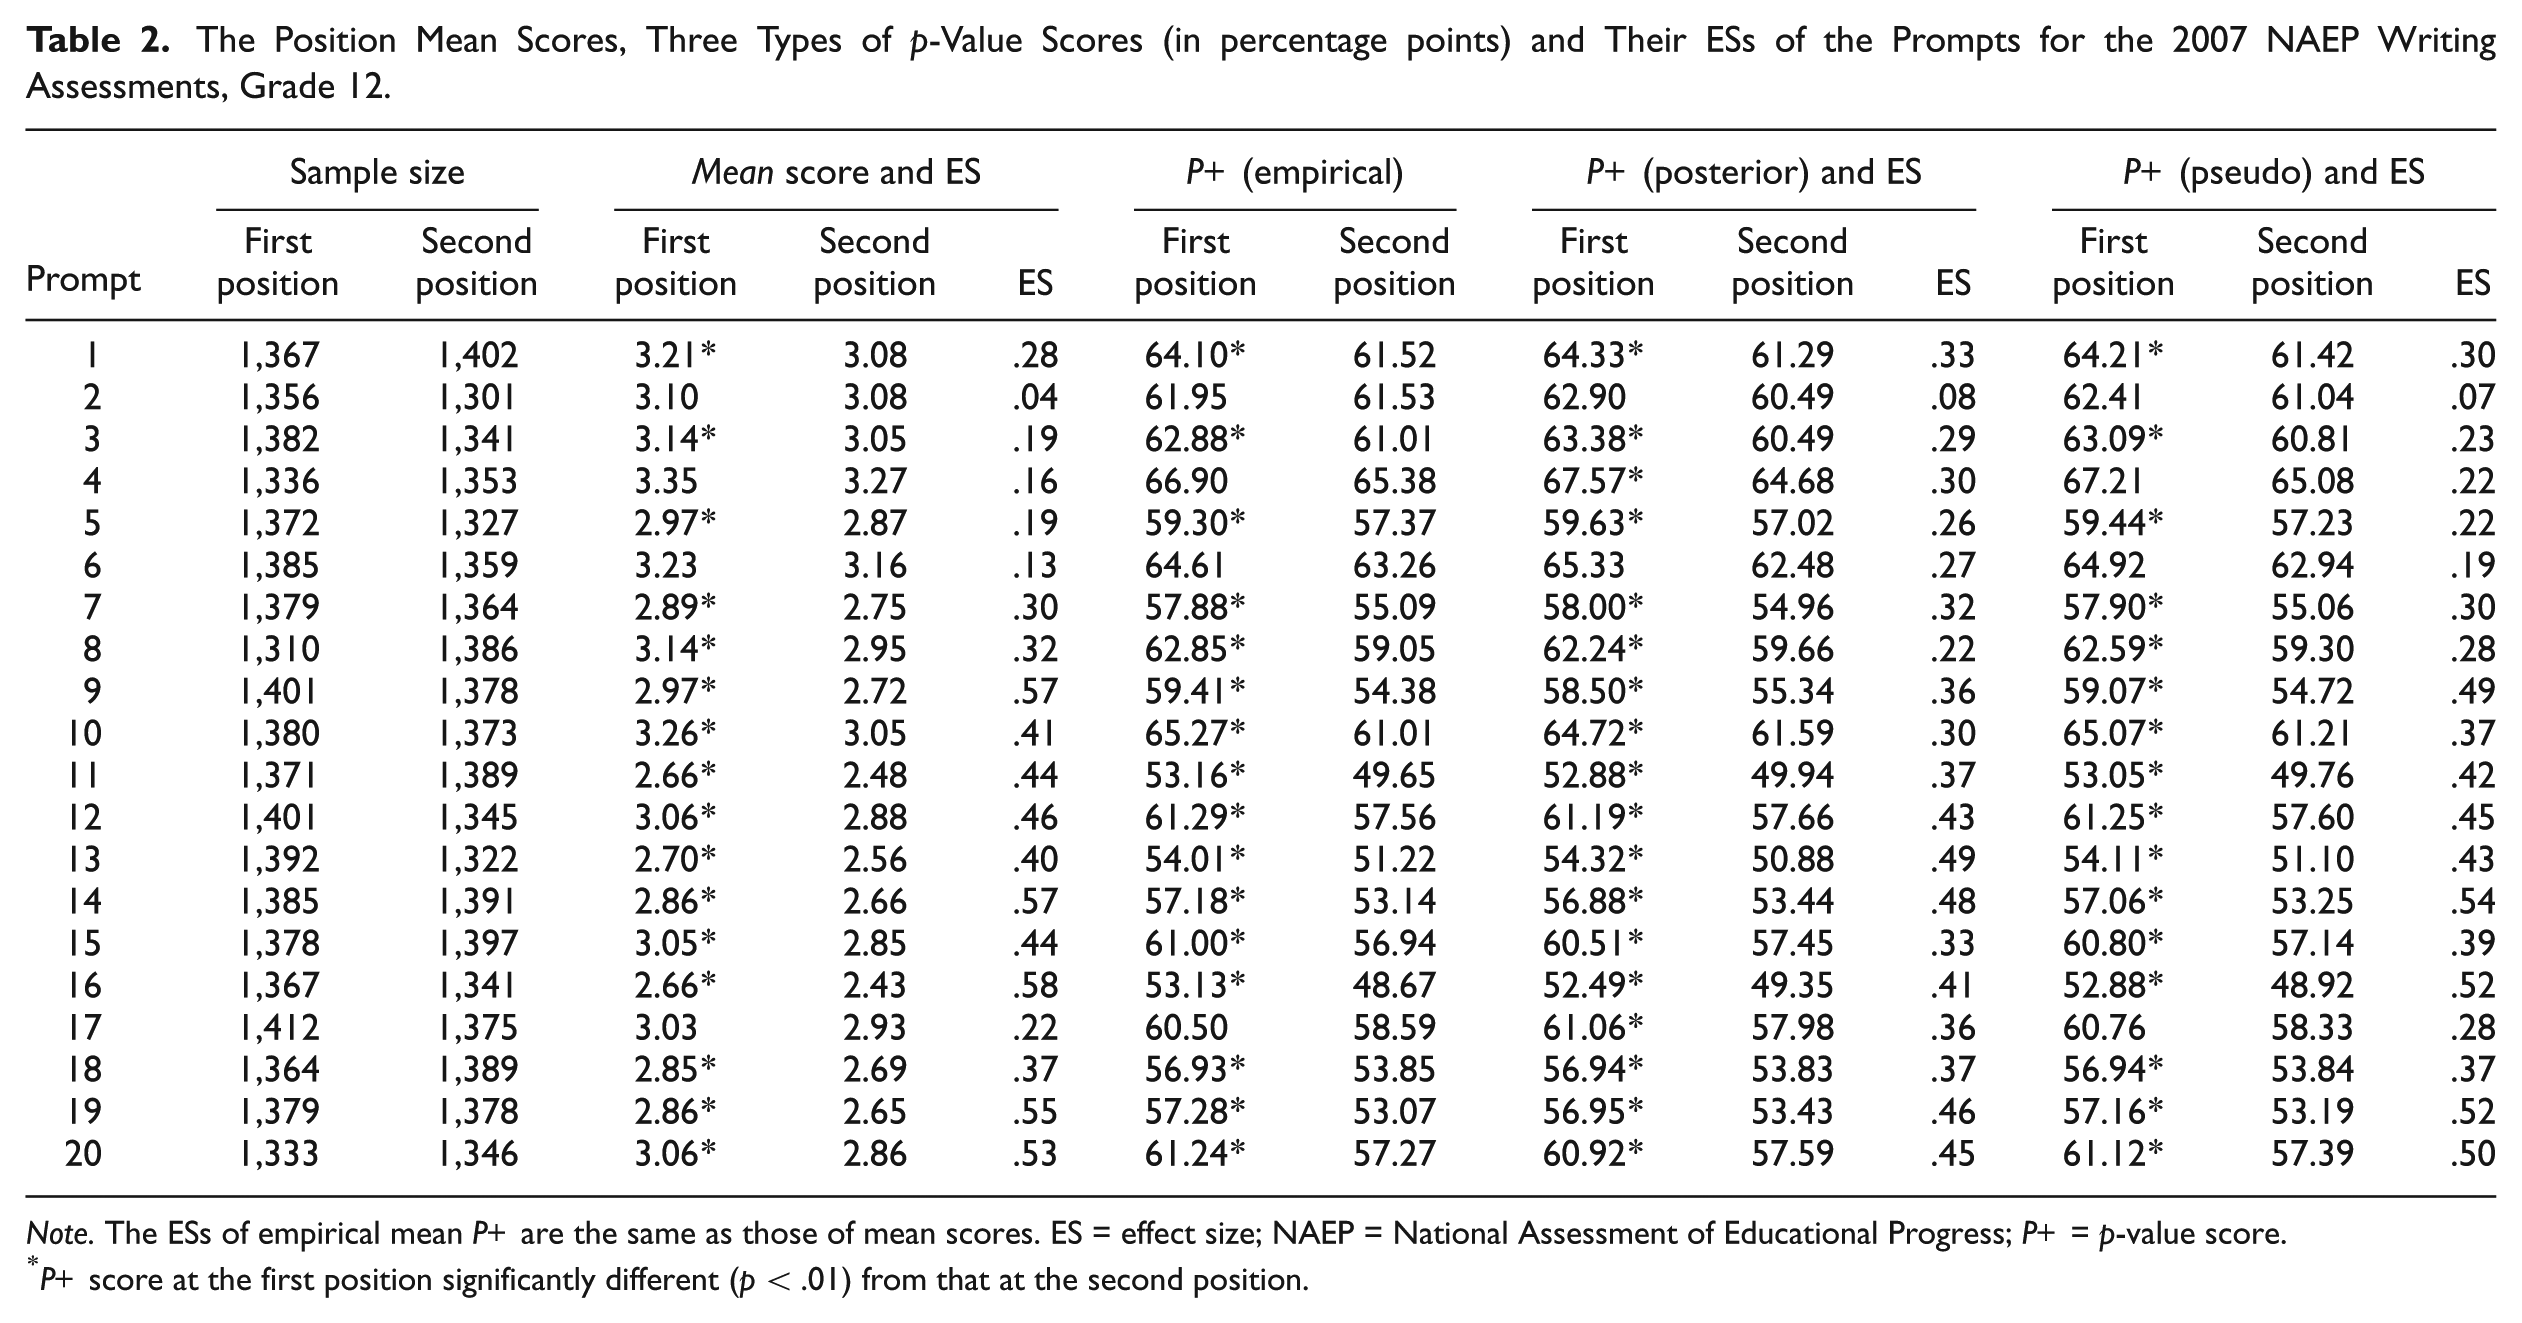
Tables 1 and 2 present the mean scores, the ESs of the difference magnitude of the means, and the three types of p-value scores (in percentage points) for each prompt presented to Grades 8 and 12, respectively; likewise, Figures 1 and 2 present the plot of the mean scores of the prompts for the two samples.
The Position Mean Scores, Three Types of p-Value Scores (in percentage points) and Their ESs of the Prompts for the 2007 NAEP Writing Assessments, Grade 8.
Note. The ESs of empirical mean P+ are the same as those of mean scores. ES = effect size; NAEP = National Assessment of Educational Progress; P+ = p-value score.
P+ score at the first position significantly different (p < .01) from that at the second position.
The Position Mean Scores, Three Types of p-Value Scores (in percentage points) and Their ESs of the Prompts for the 2007 NAEP Writing Assessments, Grade 12.
Note. The ESs of empirical mean P+ are the same as those of mean scores. ES = effect size; NAEP = National Assessment of Educational Progress; P+ = p-value score.
P+ score at the first position significantly different (p < .01) from that at the second position.
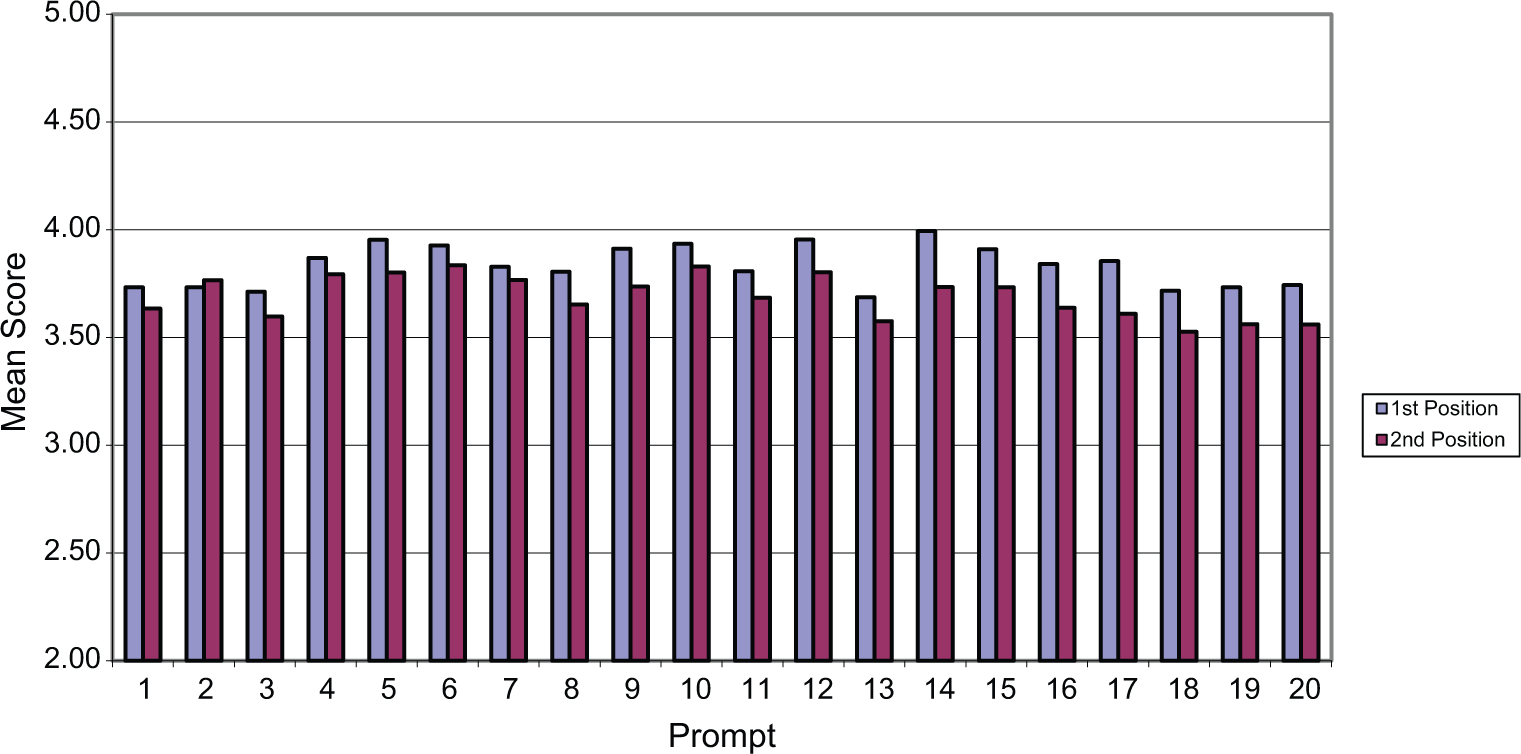
The mean scores of the prompts in the first and second positions for the 2007 writing assessment, Grade 8.
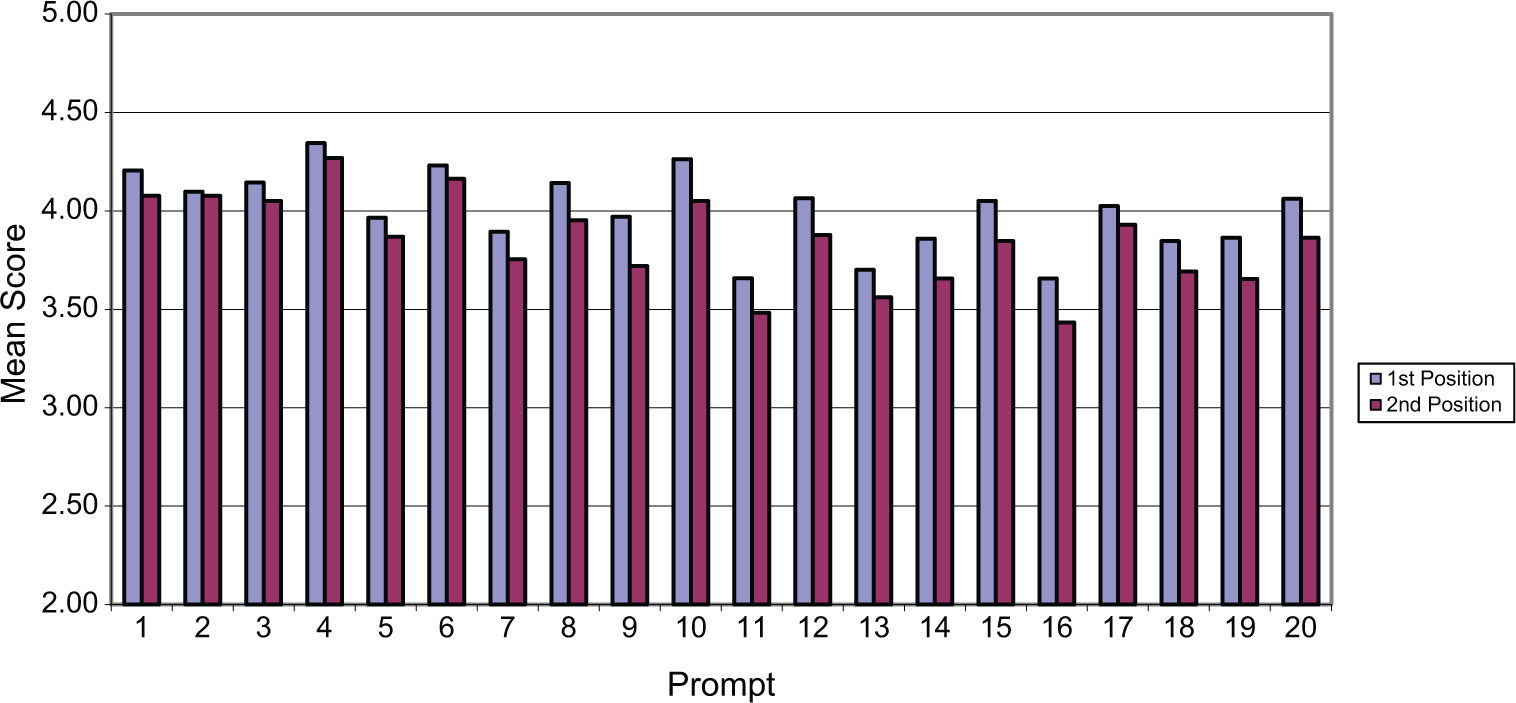
The mean scores of the prompts in the first and second positions for the 2007 writing assessment, Grade 12.
In Table 1, for Grade 8, with the exception of Prompt 2, the three types of p-value scores (empirical, posterior, and pseudocount-based) of all prompts in the first positions are significantly higher than those in the second positions. Prompt 2 is the only prompt that has slightly higher p-value scores in the second positions. In a comparison t test (Draper & Smith, 1998), the standard errors are estimated by using the grouped jackknife approach (Allen et al., 2001). The ES criterion (Cohen, 1988) is also used to evaluate the differences between two groups; an ES, the difference between two means divided by a pooled standard deviation, is usually interpreted as the standardized distance between two means for a pair of distributions. An ES between .2 and .3 is considered small, around .5 is medium, and a size of .8 and above is large. The results in Table 1 for Grade 8 show that the significance tests for position effects are consistent with the presence of intermediary ESs of score differences across item position except for Prompts 4 and 7. For Grade 8, 60% of the ESs of position mean scores are medium (>.3), and the average ES of position mean scores is .35. The test results and ES of the empirical p-value scores are the same as those of mean scores whereas the results of posterior p-value scores and pseudocount-based p-value scores are similar to those of the empirical p-value scores. An intermediate ES of the difference of position scores is considered meaningful; therefore, the position effects should not be ignored in developing instruments for large-scale writing assessment.
In Table 2, for Grade 12, the empirical and pseudocount-based p-value scores of 16 prompts in the first positions are significantly higher than those in the second positions. In addition to these 16 prompts, the posterior p-value scores of Prompts 4 and 17 in the first positions are also significantly higher than those in the second positions. For Grade 12, 70% of the ESs of position mean scores are medium (>.3), and the average ES of mean scores is .36. The results in Table 2 for Grade 12 also show the same consistency for each prompt between statistically significant score differences across item position and intermediary ESs, except for Prompt 4.
There are similar results of position effects for total samples and gender groups, shown in Table A1 in the Online Appendix. For both grades, all of the group average p-value scores in the first position are significantly higher, about 2% to 3%, than for those in the second one, indicating the existence of position effects. The results of significance tests are consistent with the presence of intermediary ESs.
For Grade 8, the ES for male group, .36, is higher than the ES for female group, .22; the ES for the total sample, .3, is between the ESs for males and females. The difference in position effects between the male and female groups implies an interaction between position effects and gender groups, and the analyses in the “Investigation of the Interactions Between Position and Other Factors” section shows that such interaction is significant. For Grade 12, similar results were found as shown in Table A1; the ESs for the groups of males, females, and total sample are .42, .21, and .32, respectively. In general, the posterior p-value scores and pseudo p-value scores are very close to those of the empirical p-value scores. Evidence of these position effects reinforces the need for a balanced design such as a pBIB design by enforcing the equal frequency of appearance for each prompt in every possible position and pairing each prompt with every other prompt in at least one test booklet for the large-scale writing assessments.
Investigation of the Interactions Between Position and Other Factors
In this section, to study the interactions between position and other factors facing examinees, regression models were used to investigate the relationship between the test scores and the explanatory variables, the position of prompts, and the interaction between prompt position and explanatory variables.
Mixed Linear Regression Model
The explanatory variables listed in Table A6 are obtained from background questions, as well as teacher and school questionnaires. The analysis of the Grade 8 sample used 56 variables, and among these, 29 variables were from the examinee background questions and subject-specific questionnaires, 12 variables were collected from the teacher questionnaires, and 4 variables were collected via the school questionnaires. The Grade 12 assessment did not use any teacher questionnaires in collecting information, and among the 44 variables used, 29 are from the examinee background questions and subject-specific questionnaires, and 4 are based on the school questionnaires.
In the analysis, the data must first be comprehended based on the assessment framework and questionnaire knowledge. There are many questions on the same questionnaire that are associated with same subject matters. For example, the variables b9 to b17, in Table A6, are the related questions about how often an examinee writes an essay, a report, a story, and so on. To obtain a clear meaning of the effects and avoid multicollinearity in modeling, any variables correlated in the way just described are combined into a single variable by summation. Three kinds of these composite variables were created for both Grade 8 and Grade 12 data: (a) for the cluster of the variables b6 and b7 of background questions, (b) for the cluster of b9 to b15 on subject-specific questionnaire, and (c) for the cluster of b18 to b20 on subject-specific questionnaire. In modeling, the composite variables are used as quantitative variables.
Let

where

Although the mixed regression model is applied in this analysis, alternative models can also be considered for use. An example is fixed-effects regression model, in which the dependent variable is defined as the difference of two position scores of each examinee. This simple model is effective because the prompts in data are arranged by pBIB spiraling, and the booklets, packaged in bundles, are randomly distributed. Nevertheless, a mixed regression model will clearly exhibit the effects and their relationships of interest.
Model Selection
Model (or variable) selection is an essential part of modeling. The process consists of several steps, screening for main significant factors, screening for factors that have significant interactions with position, and fitting mixed linear regression models.
Because the NAEP writing samples are survey data, weights are applied in each analysis step and weighted least squares are employed in the regression procedure. In addition, because the SAS MIXED procedure has no automated algorithm of model selection and each NAEP writing sample contains more than 400 variables, as the initial step, based on expert recommendation, some variables that have no effects on writing performance were excluded from the analysis. The examples of these variables are building code, census region, and so on. The demographic variables, including gender, ethnicity, region, and school type (public and private), are important in the reporting of the NAEP assessments, and so they are included in the modeling. These variables are tested to check whether they have any main effects on the dependent variable and whether their interactions with posit are significant. The demographic variables are listed from No. 46 to 58 in Table A6.
Based on the reduced list, linear regression is applied to find variables that have significant main effects on the dependent variable. This initial step uses simple regression models with no interaction terms, and its dependent variable is the difference of two position scores of each examinee. During this process, the categorical variables are recoded as dummy variables. The forward stepwise selection procedure is applied to include variables at a rate of one per step if the variable is known to be statistically significant (Draper & Smith, 1998). The critical p value of alpha, significance level for entry, is set at .05. Because the entry level is not stringent, this process will yield a list large enough for constructing mixed linear model. Based on this approach, there are 24 variables that have significant effects on the score for Grade 8 data; there are 15 variables that have significant effects for Grade 12 data. The variables with asterisks in Table A6 in the online appendix are the main factors confirmed in the initial step. Those categorical variables marked with an asterisk imply that the effects of one or more categories are significant in selection testing.
Step 1
Based on the reduced variable list prepared in the initial step, the SAS MIXED procedure is used to fit mixed regression models without interaction terms. The basic strategy is to fit a sequence of models beginning with a batch of simple models with an intercept and an explanatory variable. One of the main variables is included into the model each time, and then it is checked whether the variable is significant in the model. When a model is adequate, one additional term is included to the successive model, and the statistical significance of the effects of the variable just included is assessed. In this process, prior experience from analyzing NAEP assessments is used in judging and selecting models. The main factors included in Step 1 are those variables with asterisks in Table A6.
Step 2
The interaction term between position and main factors is added to the mixed models. The strategy is to include one such term at a time and keep the term in the model if the interaction is significant. In constructing models, the interactions between prompt position and main factors are emphasized because this is connected with the theme of this study. For Grade 8, five factors, interacted with prompt positions, are sorted out: gender, school type, b8 (“enjoy writing emails to friends”), b24 (“the importance in doing well on this test”), and b37 (“status of doing prewriting on test”). For Grade 12, three factors are included: gender, b24, and b37.
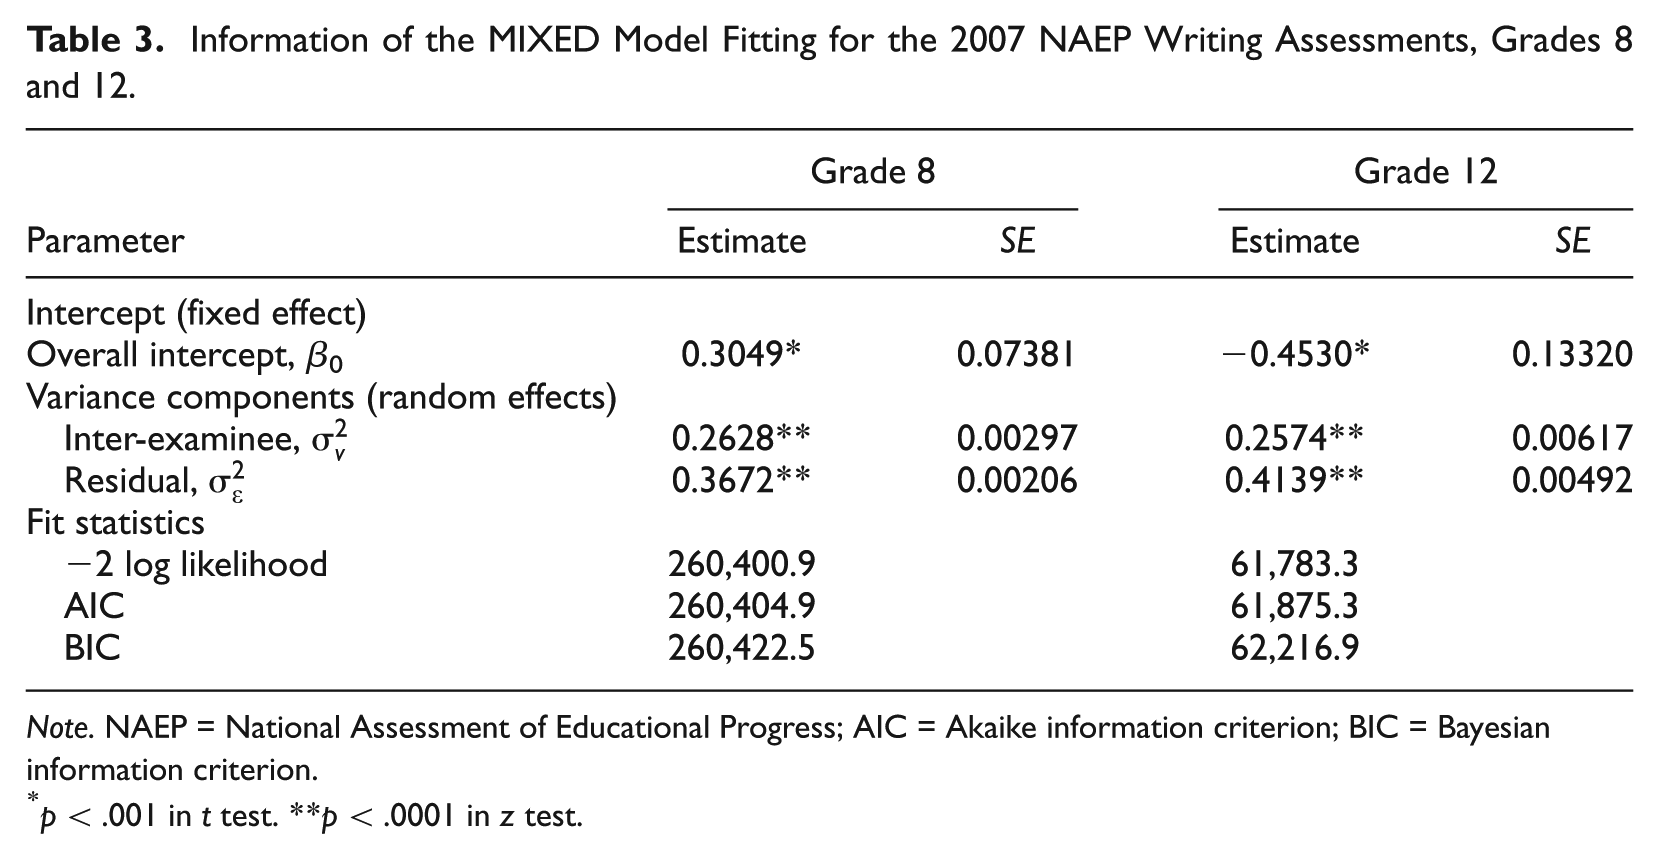
In the process of model selection, various information criteria, such as Akaike information criterion (AIC) and Bayesian information criterion (BIC; Schwarz, 1978), are also used to compare a sequence of different models and to judge the adequacy of the final models. Table 3 presents the fit statistics and covariance parameter estimates of the final mixed models for Grades 8 and 12. The AIC and the BIC of the final fitted mixed model for Grade 8 are 260,405 and 260,423, which are smaller than those of other models tried; the AIC and BIC are 61,875 and 62,217 for the final models for Grade 12. In Table 3, for Grade 8, two variance components,

for Grade 8, and
Information of the MIXED Model Fitting for the 2007 NAEP Writing Assessments, Grades 8 and 12.
Note. NAEP = National Assessment of Educational Progress; AIC = Akaike information criterion; BIC = Bayesian information criterion.
p < .001 in t test. **p < .0001 in z test.
The statistical tests of the fixed effects of the final models are presented in Tables A2 and A3 for Grades 8 and 12, respectively. In the SAS MIXED procedure, the statistics of F tests are calculated based on Type III sums of squares because of the unbalanced weighted cases (Harville & Jeske, 1992). For both grades, the tests of all fixed effects in the models are significant at the 5% level except for b24 (“the importance in doing well on this test”); however, the tests for b24xposit are significant.
Empirical Results of Modeling
Empirical results for Grade 8
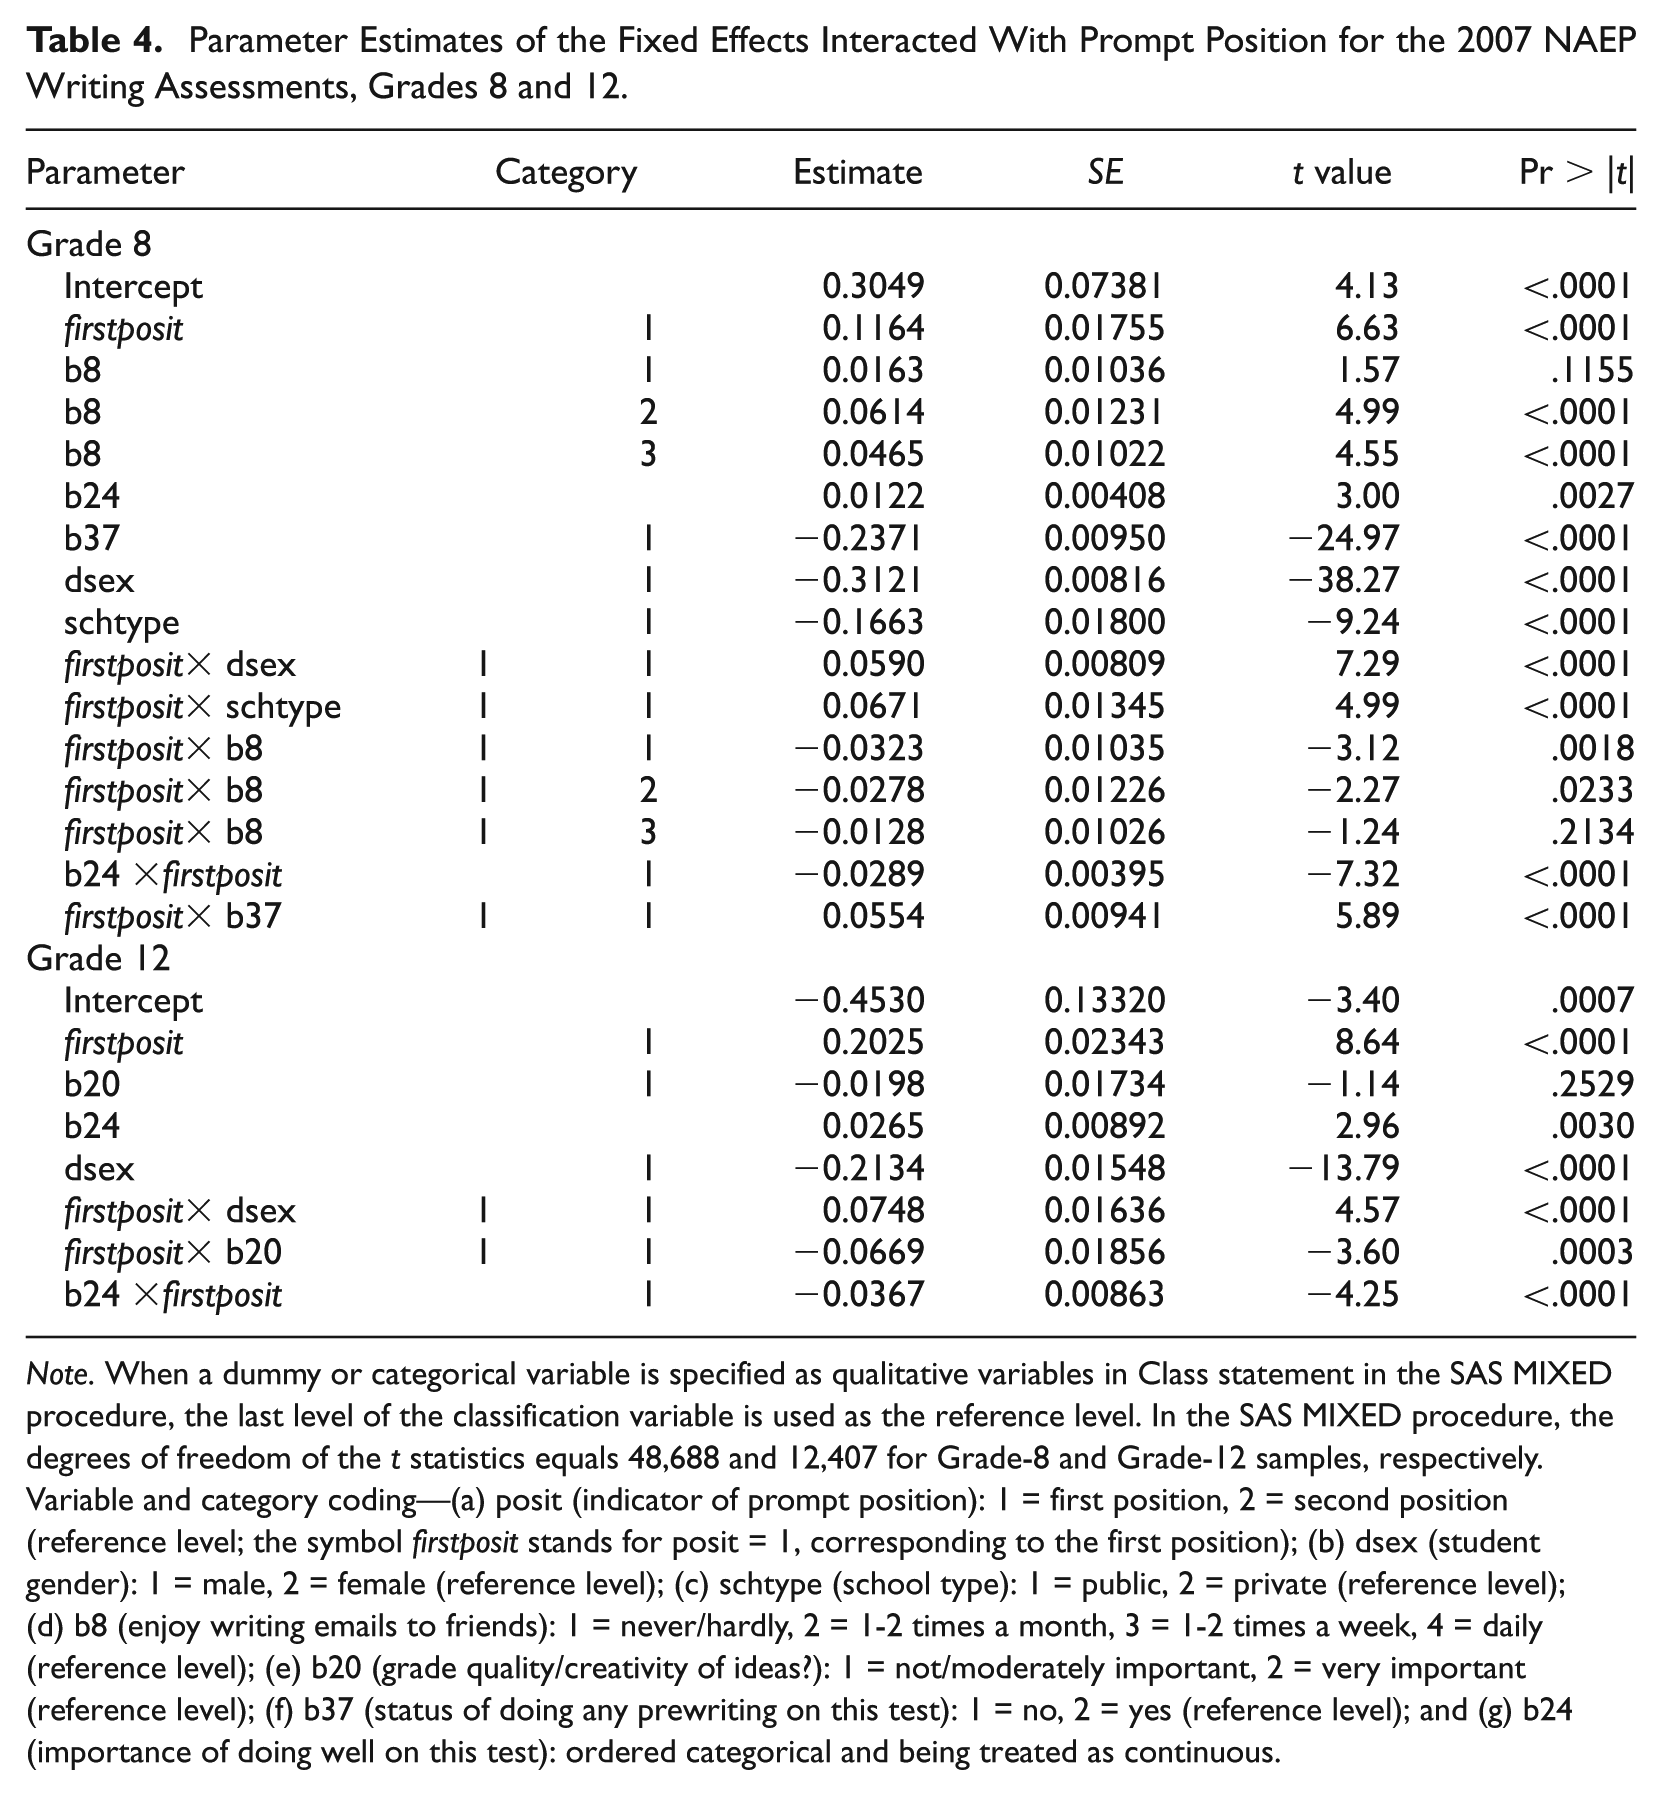
The upper part of Table 4, for Grade 8, shows the results of the parameter estimates of the fixed effects that have interaction with prompt positions. The estimate for firstposit (posit = 1, the indicator variable of posit corresponding to the first position) is .30. Note that, in the SAS MIXED procedure, the last level of qualitative variables is used as the reference level, and in this case, the second position, posit = 2, is a reference level. With other parameters the same, the intercept of the curve for the first position is .30 higher than that for the reference level. of the position effects: The performance on the prompt in the first position is in average better than that in the second position. In Table 4, the interaction between firstposit (posit = 1) and males (dsex = 1) is .059, which shows that the gender variable is an indicator of the position effects. For males, by Table 4, with other parameters the same, the intercept of the curve for the first position is .237 (.116 + .059 + .067 − .032 − .029 + .055) higher than that for the second position; for females (reference level), the intercept of the curve for the first position of the curve is .178 (.116 + .067 − .032 − .029 + .055) higher than that for the second position. The difference between .237 and .178 is .059, implying that the drop of score at the second position for males is significantly larger than the drop for females. It is possible that the female student population has different writing habits when compared with males, for instance, more patience; this can explain the smaller position effect observed for females in writing assessments. However this theory should be cross-validated.
Parameter Estimates of the Fixed Effects Interacted With Prompt Position for the 2007 NAEP Writing Assessments, Grades 8 and 12.
Note. When a dummy or categorical variable is specified as qualitative variables in Class statement in the SAS MIXED procedure, the last level of the classification variable is used as the reference level. In the SAS MIXED procedure, the degrees of freedom of the t statistics equals 48,688 and 12,407 for Grade-8 and Grade-12 samples, respectively. Variable and category coding—(a) posit (indicator of prompt position): 1 = first position, 2 = second position (reference level; the symbol firstposit stands for posit = 1, corresponding to the first position); (b) dsex (student gender): 1 = male, 2 = female (reference level); (c) schtype (school type): 1 = public, 2 = private (reference level); (d) b8 (enjoy writing emails to friends): 1 = never/hardly, 2 = 1-2 times a month, 3 = 1-2 times a week, 4 = daily (reference level); (e) b20 (grade quality/creativity of ideas?): 1 = not/moderately important, 2 = very important (reference level); (f) b37 (status of doing any prewriting on this test): 1 = no, 2 = yes (reference level); and (g) b24 (importance of doing well on this test): ordered categorical and being treated as continuous.
The estimated interaction between firstposit (posit = 1) and public schools (schtype = 1) is .067. Based on the process for dsex above, using the intercept-checking, it can be shown in similar fashion that the variable school type is an indicator of position effects. In particular, public schools have stronger position effects than private schools. Nevertheless, based on significance test, for Grade 8 data, there are no significant interactions between position and the demographic variables of ethnicity, region, status of disability, and status of being English language learners. This shows that these variables are not predictors of position effects.
In addition to the demographic variables discussed earlier, the significant interactions with position effects include variables that related to examinee motivation and general ability. The motivationally related factors, as introduced before, include variables of b8, b24, and b37. The interaction estimate (−.032) between firstposit and the group (b8 = 1, not enjoying writing e-mails) shows that the effect on the score of the first prompt is negative, which implies that those who are not enjoying writing e-mails had less position effects than other groups. The intercept-checking can be used to verify the position effects, the score of the first prompt is in average higher than the score of the second one, for all the categories in b8. Table A4 shows that, measured by position mean scores, this group (b8 = 1) completed both prompts in a similarly poor fashion. For other groups (b8 = 2 or b8 = 3), their interaction estimates with firstposit are −.028 and −.012, less negative, which show that those who enjoy writing e-mails more have relative stronger position effects than the first group (b8 = 1). Table A4 shows that these groups (b8 = 2 or b8 = 3) did not do both prompts as poorly as the first group (b8 = 1). For Grade 8, the status of the prewriting of the test (b37) is also a predictor of position effects that can be confirmed by the intercept-checking. The interaction between firstposit and the group (b37 = 1, not do prewriting in the test) is .055. Those who did not do prewriting (b37 = 1) exhibited stronger position effects than did those who did prewriting.
Note that b24 is treated as a continuous variable. For Grade 8, b24 is a predictor of position effects that can be validated by the intercept-checking, and the interaction estimate (−.029) between firstposit and b24 shows that those examinees (b24 = 4) who thought that doing well in the test was very important demonstrated least position effects; these examinees (b24 = 4) had done relatively better on the second prompt than those who were less motivated.
Empirical results for Grade 12
The second part of Table 4, for Grade 12, presents the parameter estimates of the fixed effects that have interaction with prompt positions. The estimate of firstposit is .203. This implies that, with other parameters the same, the intercept of the curve for the first position is .203 higher than that for the second one (the reference level); that is, the score at the first position is higher than that for the second position. The results show that variable dsex (gender) is also a predictor of the position effects with an interaction estimate between firstposit and males of .075. Based on the intercept-checking, the position effects for both males and females can be verified. The male group has stronger position effects than does the female group (the reference level), which implies that, for males, the drop of score at the second position is larger than the drop for females. Similar to the results of Grade 8, there are no interactions between position and most of the demographic variables, including ethnicity, region, school type, status of disability, and status of being English language learners. Among the variables related to teaching style, the variable b20 (“teacher grades quality or creativity of ideas?”) is also an indicator of position effects, which can be confirmed by the intercept-checking. The interaction between firstposit (posit = 1) and the group (b20 = 1, teachers less stressing quality or creativity) is −.067. This shows that the group (b20 = 1) exhibited less position effects than the group (b20 = 2, the reference level) with teachers stressing quality or creativity. In fact, the position mean scores in Table A5 show that the examinees in the first group (b20 = 1) completed both prompts in a likewise poor fashion and thus showed less position effects.
The estimate of the interaction between firstposit and b24 (−.037) shows, as with eighth graders, that for the examinees who thought doing well on the test was more important, less position effect was evident. These results can also be confirmed by the position mean scores and the ESs. See Table A5.
Conclusion
The NAEP writing samples, well-designed assessment surveys, offer a unique opportunity to study the impact of position effects on writing performance. The results from this study provide evidence for the presence of position effects in large-scale writing assessments, and this supports special attention to position effects in developing test instruments. It is therefore necessary to design test instruments in a way that balances prompt positions in large-scale assessments. For example, in some applied test designs (such as pBIB), booklets are assembled with prompt or prompt-block positions fully permuted.
In this study, it was discovered that motivation and gender were the primary predictors (among the personal and demographic information collected) of the position effects for both grades. For Grade 12, the variables of school type and student prewriting were not as strongly predictive of position effect as they were for Grade 8, whereas teacher emphasis on quality or creativity of ideas in composition was a predictor in Grade 12 though not for Grade 8. Compared with the model for Grade 12, the model for Grade 8 included more main factors and their interactions with prompt positions. Ethnicity was not a predictor of position effects in the investigation albeit it is a significant predictor of test scores. Other variables, such as region, disability, and status of English language learners, are not significantly correlated with position.
The main finding of this study, that examinee motivation is strongly associated with position effects, is consistent with the results of other studies (Pintrich & Schunk, 2002; Wise & DeMars, 2005; Wolf, Smith, & Birnbaum, 1995). Moreover, it was found that other factors, such as gender, school type, and teaching emphasis, can also be predictors of position effects; with these factors, there were inconsistencies at different grade levels in large-scale writing assessments.
Although the specific results of this study should not be spontaneously extended to other academic subjects and assessments without reevaluation (such as cross-validation), they certainly offer promising angles to take when investigating the factors correlated with position effects. Ongoing research should facilitate the identification of position effects and enhance the understanding of why gender and other factors influence the magnitude of the effects. When certain findings are confirmed, educators may use them as effective guidelines to prescribe different strategies in teaching at different grade levels and to enhance examinee motivation toward learning and testing. Educators and policy makers should encourage all students to demonstrate the full scope of their writing achievement in a test and also apply different strategies to student groups appropriate to each group’s salient traits and background factors.
Footnotes
Acknowledgements
The author thanks Shelby Haberman, Deping Li, and Jian Cao for their suggestions and comments. The author also thanks Scott Davis for analyzing data and Kim Fryer for editorial assistance.
Author’s Note
The opinions expressed herein are solely those of the author and do not necessarily represent those of Educational Testing Service.
Declaration of Conflicting Interests
The author declared no potential conflicts of interest with respect to the research, authorship, and/or publication of this article.
Funding
The author disclosed receipt of the following financial support for the research, authorship, and/or publication of this article: This study was partially supported under the National Assessment of Educational Progress (Grant No. R999G50001, CFDA No. 84.999G) as administered by the Office of Educational Research and Improvement, U.S. Department of Education.
References
Supplementary Material
Please find the following supplemental material available below.
For Open Access articles published under a Creative Commons License, all supplemental material carries the same license as the article it is associated with.
For non-Open Access articles published, all supplemental material carries a non-exclusive license, and permission requests for re-use of supplemental material or any part of supplemental material shall be sent directly to the copyright owner as specified in the copyright notice associated with the article.
