



Abstract
The asymptotic power of the Mantel–Haenszel (MH) test for the differential item function (DIF) is derived. The formula describes the behavior of the power when the number of items is large, so that the measured latent trait can be considered as the matching variable in the MH test. As shown in the derived formula, the power is related to the sample size, effect size of DIF, the item response function (IRF), and the distribution of the latent trait in the reference and the focal groups. The formula provides an approximation of the power of the MH test in practice and thus provides a guideline for DIF detection in practice. It also suggests analytical explanations of the behavior of the MH test as observed in many previous simulation studies. Based on the formula, this study shows how to conduct the sample size calculation. The power of MH test under some practical models such as the two-parameter logistic (2PL) and three-parameter logistic (3PL) item response theory (IRT) models is discussed.
Differential item function (DIF) occurs when the chance to get correct answer to an item differs for people having the same level of ability the item is designed to measure but from different populations (Holland & Wainer, 1993; Lord, 1980; Millsap & Everson, 1993). DIF detection and related topics have been continuously in active research (Cheng, Chen, Qian, & Chang, 2013; Finch, 2012; Wang, Tay, & Drasgow, 2013). The Mantel–Haenszel (MH) test for DIF (Holland & Thayer, 1988) is one of the most popular methods to detect DIF. The method is nonparametric in the sense that it does not make assumptions on the specific form of the item response function (IRF) and the underlying latent trait distribution. It is the uniform most powerful (UMP) test for detecting uniform DIF effect (Birch, 1964) and the test statistic is very easy to calculate. With these advantages, the MH test for DIF has been widely adopted in practice.
Since the introduction of the MH test in DIF research, there have been many studies on the power of the MH test and through these studies, many factors that may influence the power became well understood (Donoghue, Holland, & Thayer, 1993; Paek, 2010; Roussos & Stout, 1996; Swaminathan & Rogers, 1990; Uttaro & Millsap, 1994). However, most of those studies were simulation studies, where the power of the MH test was estimated by the rejection rate of the MH test applied on the simulated data sets generated under specific designs of the underlying model and parameters. And there is still a lack of a theoretical formula for the power of the MH DIF test. Simulation studies are very useful in identifying factors that influence the power of the MH test, but they provide very little explanation about why the power is influenced by those factors. Without a clear understanding of the underlying mechanism, it is difficult to say whether the knowledge learned from particular simulation studies still holds when facing a new test situation. One may conduct new simulation studies specifically tailored to that new situation, but practitioners often lack the time and resources to conduct extensive large-scale simulation studies. However, a power formula would provide insights on the factors in the formula, and its applicability is general, and a formula is straightforward to use in practice.
In practice, a DIF analysis is often conducted only when sufficient sample sizes are reached; otherwise, it would be a waste of the resources due to the lack of the power. For example, at ETS, the current requirements for DIF analyses at the test assembly phase are at least 200 people in a smaller group and at least 500 in total (200/500 rule); and at post-administration and prescore reporting phases, the requirements are at least 300 in a smaller group and 700 in total (300/700 rule; Zwick, 2012). One can argue that such rules are rather arbitrary. Generally speaking, the power is an intrinsic property of a statistical test; and it is related to the effect size, the sample size, and the significance level (Cohen, 1988). For DIF analysis, there are many factors that affect the power of the test, and there is no single rule that fits all possible situations. Although in other areas of behavioral sciences where t tests, ANOVAs, and so on are conducted, power analyses and sample size calculations are routinely done or recommended at the research planning stage, for DIF studies, they are seldom conducted mainly due to the lack of tools available to practitioners.
This article aims at theoretically deriving a general formula for the power function of the MH test for DIF detection, and applying the formula to the Rasch, item response theory (IRT) two-parameter logistic (2PL) and three-parameter logistic (3PL) models. Power formulas have been developed in recent articles for SIBTEST (Li, 2014b) and logistic regression DIF tests (Li, 2014a). With the power function formula, it is possible to not only identify but also explain the factors that influence the MH test, and conduct power and sample size calculations for the experimental design of DIF studies.
DIF and MH Test
Consider a test consisting of
2×2 Table for the jth Matched Set of Members of Reference and Focal Groups.
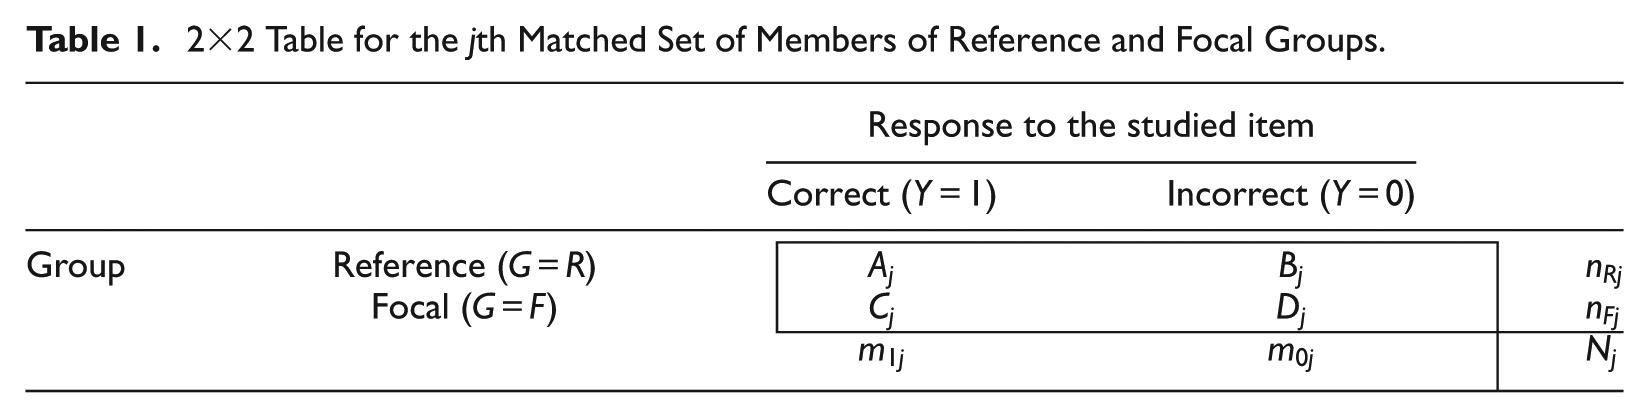
In the table,
The MH chi-square test statistic (Mantel & Haenszel, 1959) is given by,

where

are the estimates of the mean and the variance, respectively, of the cell count

Previous simulation studies suggest that the MH chi-square with the continuity correction tends to be more conservative than the MH chi-square without the continuity correction (Paek, 2010). For example, at the level of 0.05, it is often observed in simulated data with smaller test length that the actual Type I error rate for the MH chi-square test with continuity correction is about 0.03 to 0.04, whereas for the MH-chi-square test without continuity correction on the same data set, it is about 0.05.
The MH chi-square statistics in Equations 1 or 2 do not directly give the direction of the DIF effects if they are significant. Holland and Thayer (1988) use the following formula to estimate the common odds ratio:

The MH log odds ratio estimate

Therefore, a MH-Z statistic can be defined by dividing the log odds ratio estimate by its standard error:

The MH-Z statistic is asymptotically equivalent to the MH-
Asymptotic Formula for
MH and the Variance Estimate of Log
MH
Let
Define the local odds ratio

Roussos, Schnipke, and Pashley (1999) gave a general asymptotic formula for the MH odds ratio estimate

where
To derive a power formula for the MH-Z statistics, a general formula is also necessary for the variance of the log odds ratio estimates under the null hypothesis, where

Deriving the Power Formula for MH Test
Under the null hypothesis, the MH-Z statistic follows the N(0,1) distribution. So for the one-sided test,

For details on the theory on asymptotic power, see Lehmann (1999).
Therefore, the asymptotic power for the one-sided DIF test (
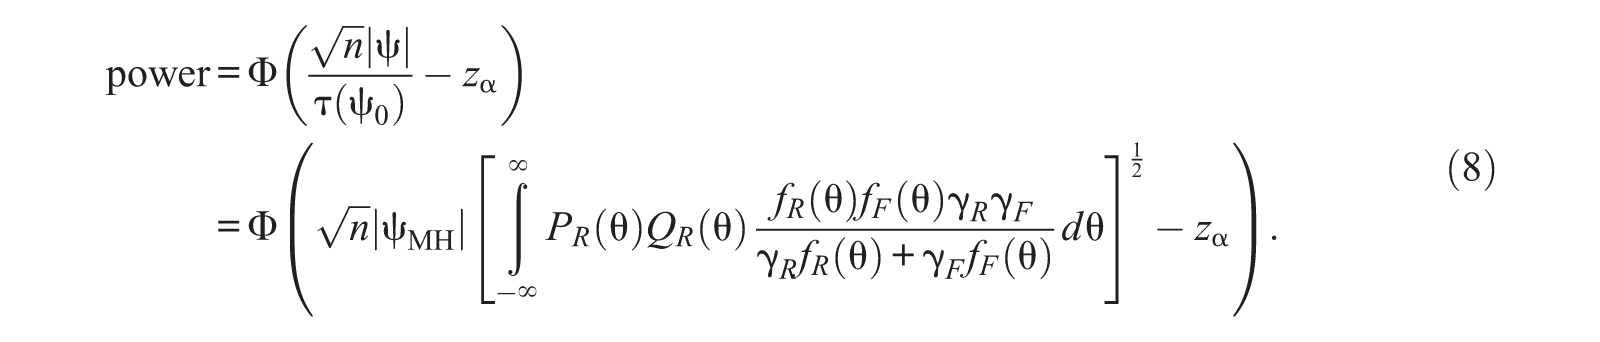
And for the two-sided DIF test (
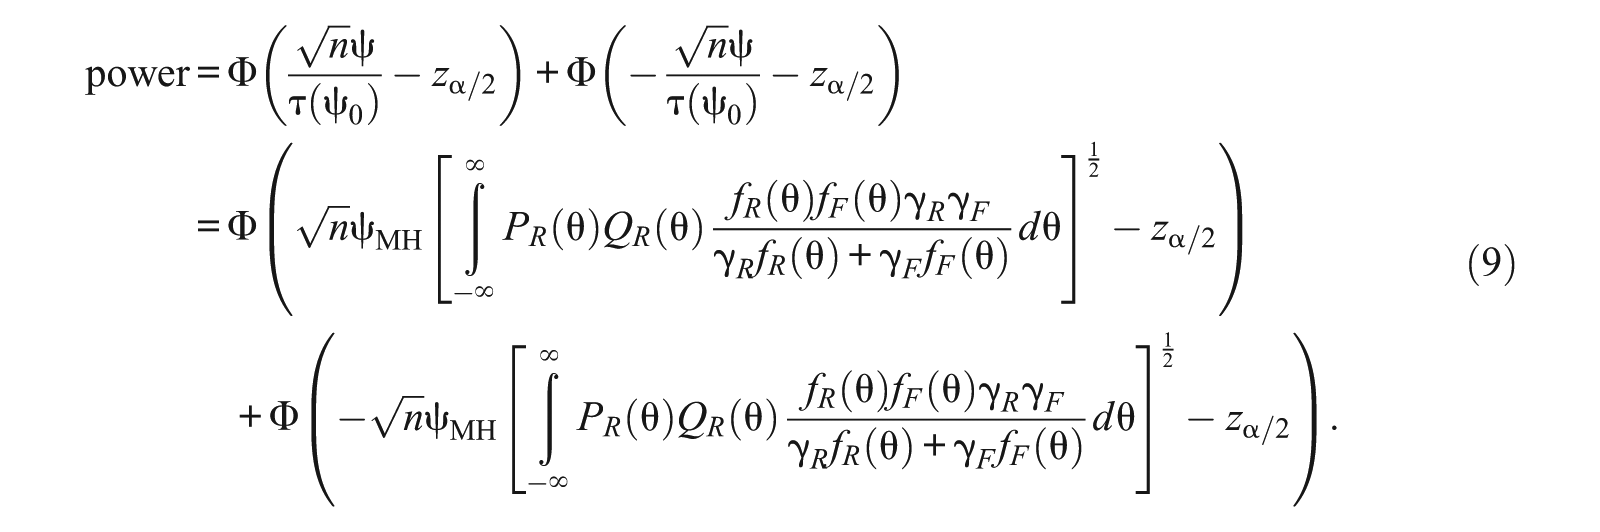
The integrals in the power formulas can be evaluated by numeric integration methods. The author has used the numeric integration procedure in R (R Core Team, 2012) to obtain the numeric results in this article.
Factors That Influence the Power of the MH Test
From Equations 8 and 9, it can be shown that the power of the MH test when the number of items is large is related to
The sample size
The effect size
The integral that is related to both the IRF and the distribution of the latent variable—The test will have higher power if the integral is larger.
The Type I error α—The power will increase if one is willing to increase the Type I error. However, in practice, the Type I error is usually fixed, for example,
A detailed discussion is presented on the components in the integral

and how they influence the power. The reciprocal of the integral is
IRF P(θ)
The most often used IRT models are the one-parameter logistic (1PL), 2PL, and 3PL models. Consider the IRF for the 3PL model:

where
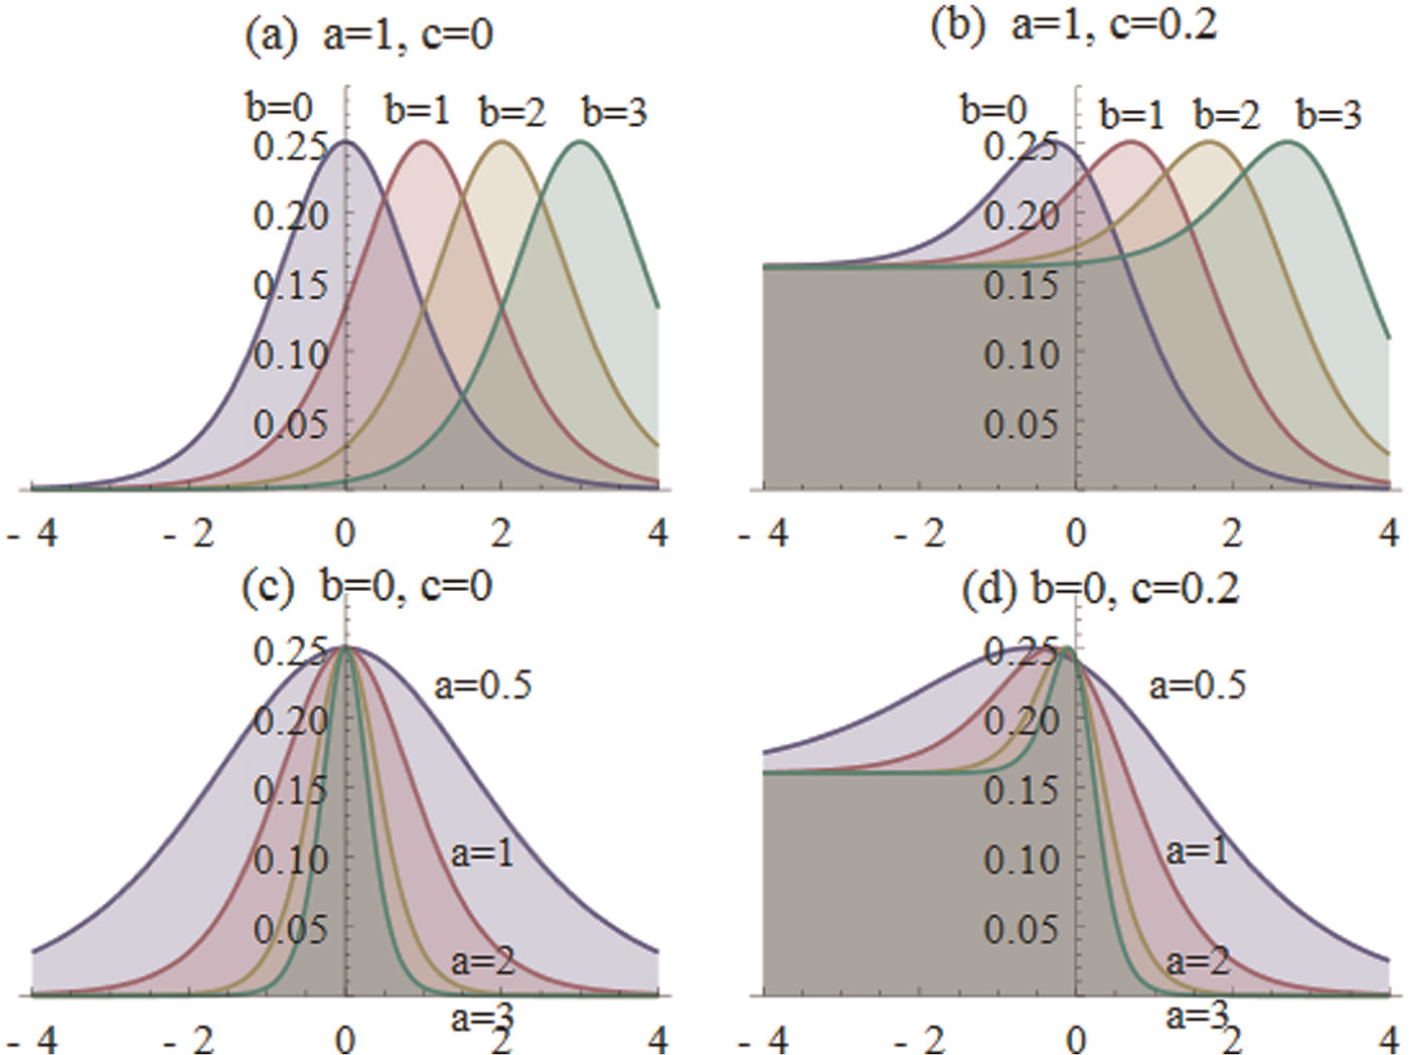
If the studied item follows the 2PL model, the product
However, by including a non-zero guessing parameter
Panels (a) and (b) of Figure 1 show that the difficulty parameter
Latent Trait Distributions
Now consider the term

which has three components: the proportion of the population composed of the focal group
Figure 2 shows the shape of the function
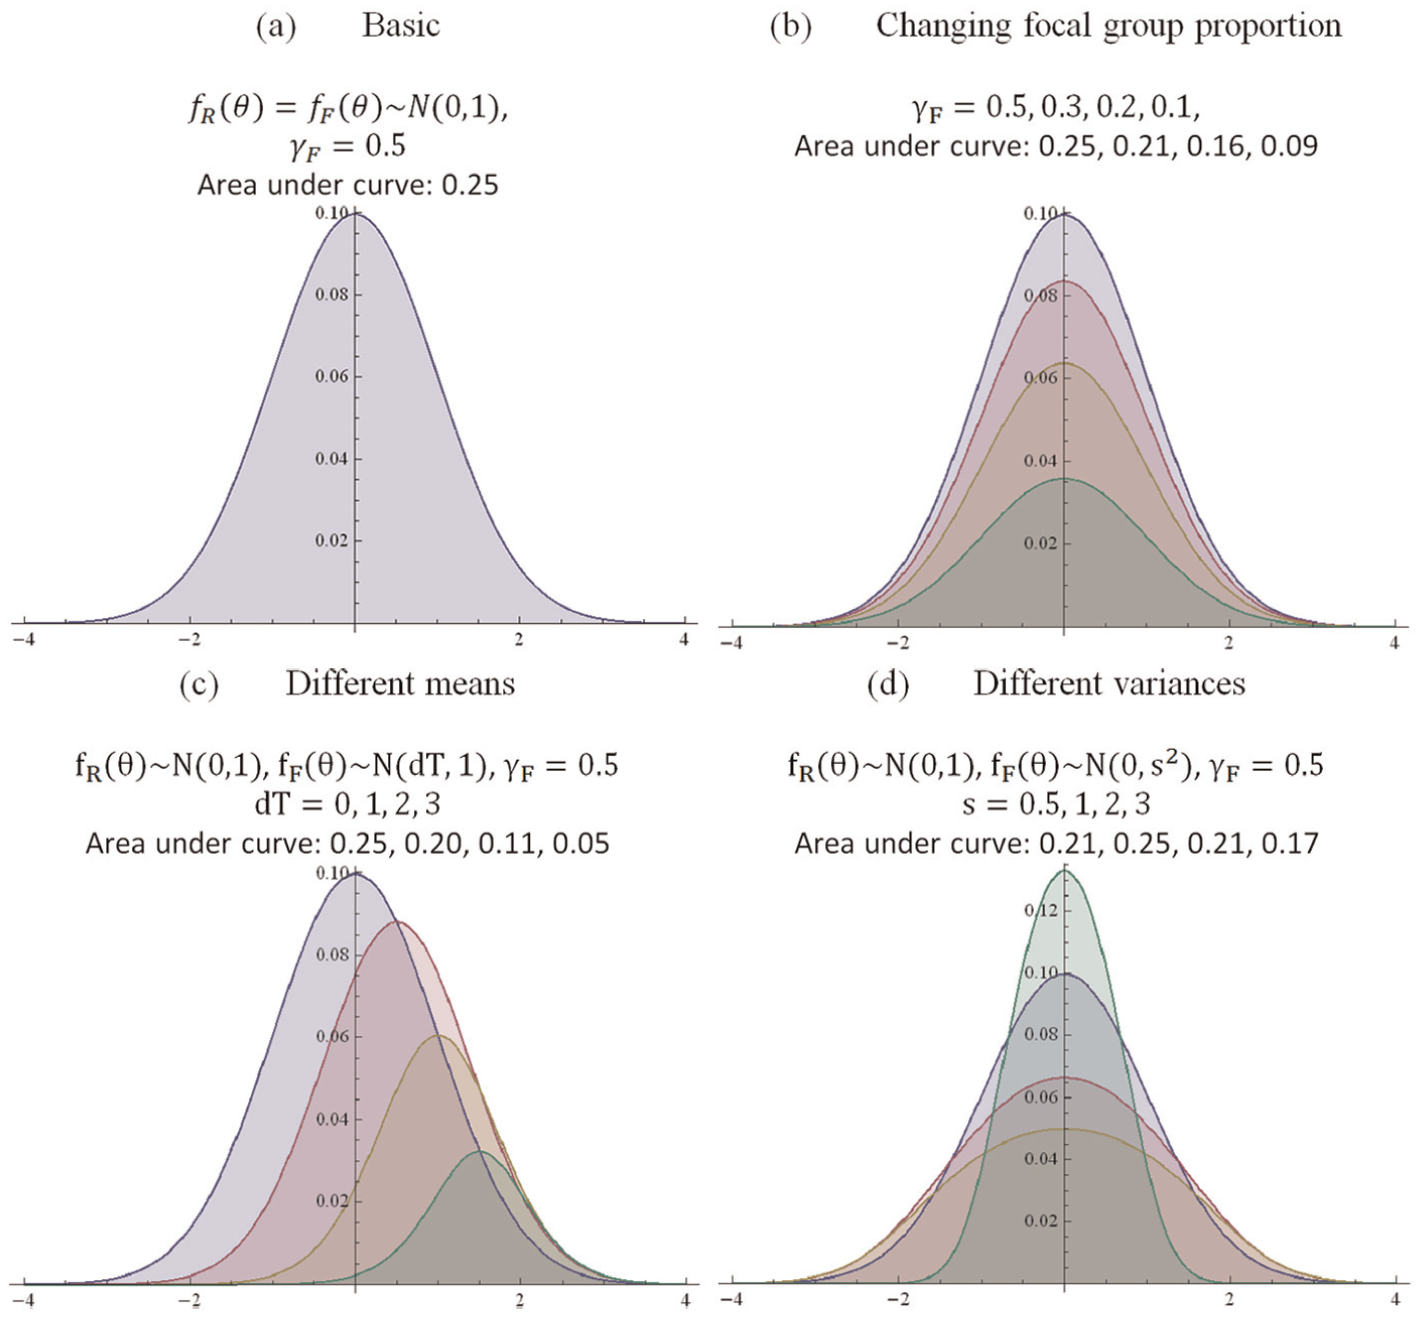
The shape of
Combining Item Characteristic Curve and Latent Trait Distribution
For the integral
Table 2 summarizes the factors that influence the power of the MH test as discussed so far. These factors were also previously studied and reported by various authors through simulation studies. Here, they were identified from the theoretical power formula. These factors may influence the power in complicated ways. Therefore, the power formulas are important tools to quantify how the power is influenced by these factors. It should be pointed out that the power formulas are very general and their applicability should not be considered as only restricted to the situations already discussed. There is no restriction that the IRF has to be 2PL or 3PL IRT models; actually, it can be of any form, for example, a normal ogive model, even a nonparametric IRT model. Also, the distribution of the latent trait may take forms other than the normal distribution.
A Summary Table of Factors Influencing the Power of MH Test.
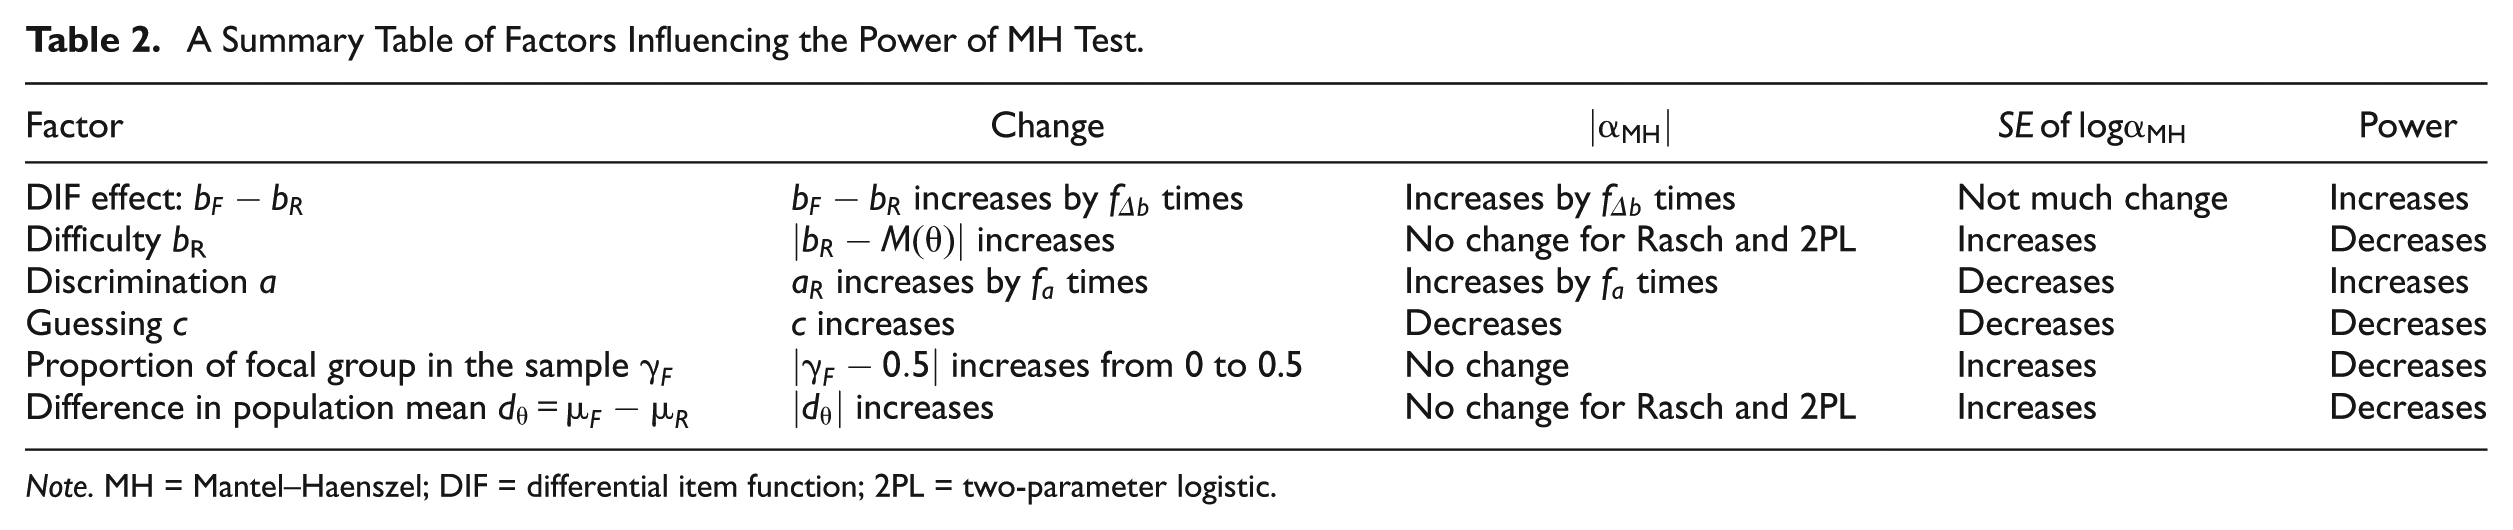
Note. MH = Mantel–Haenszel; DIF = differential item function; 2PL = two-parameter logistic.
Sample Size Formula
Based on the power formula, the formula for sample size can be readily solved. Generally, for a one-sided test,

By substituting in

For the two-sided MH test,
As an example, for the two-sided MH test with a Type I error rate of 0.05, Table 3 shows the results of minimum sample size needed to achieve 0.80 power when the studied item follows the Rasch model or a model modified from the Rasch model by changing one of the factors. In the default setup (the bolded row in each section of the table), the studied item follows the Rasch model: the reference difficulty
Sample Size Needed to Reach Power 0.80 for the Two-Sided MH Test on the Rasch Model or a Model Modified From the Rasch Model.
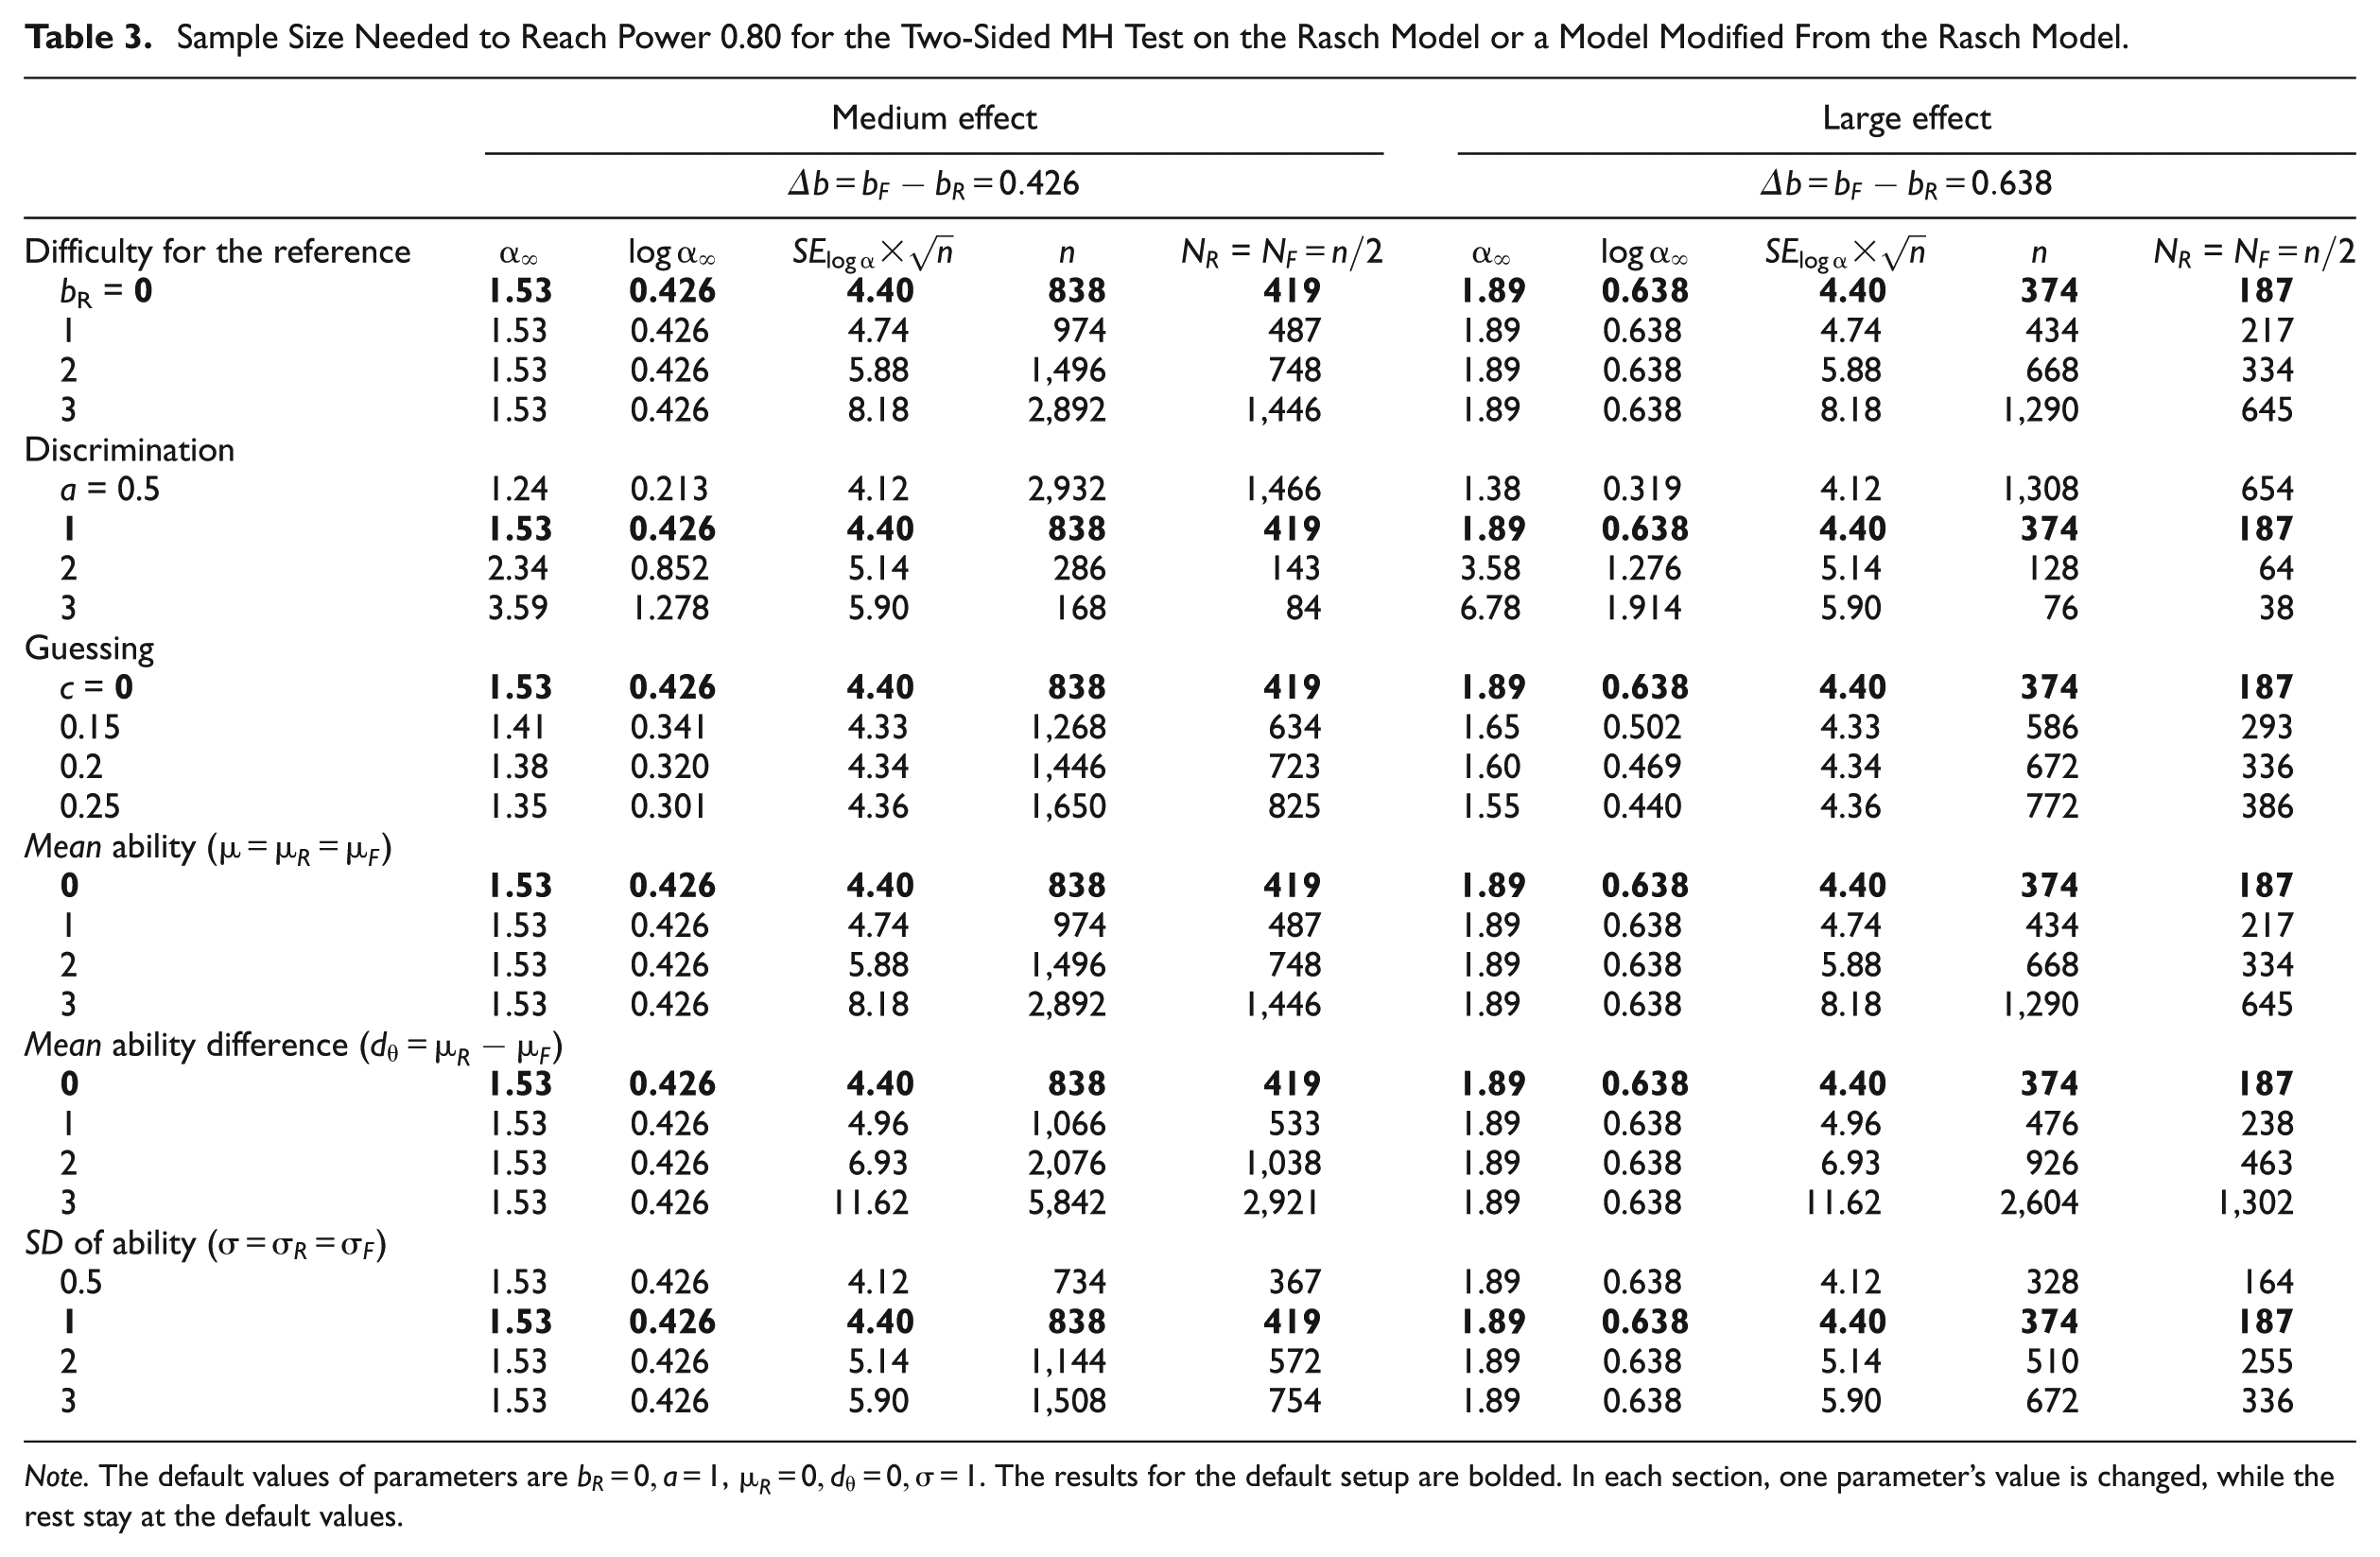
Note. The default values of parameters are
Simulation Studies
In this section, the purpose of the simulation studies is to confirm that the power formula is correct, in the sense that the theoretical power is close to the power obtained by Monte Carlo simulation. Here, the theoretical values are compared with the results from two previously published simulation studies. The first was from Paek and Guo (2011), and the second was Uttaro and Millsap (1994). For the Paek and Guo study, their simulation results were used directly, whereas for the Uttaro and Millsap study, their simulation setup was used and the simulation study was re-conducted.
Simulation Study 1: Paek and Guo (2011)
Paek and Guo (2011) examined the power of the MH procedure when the focal and reference groups have notably unbalanced sample size. They focused on the situation where the focal group has a fixed small sample size, which may not satisfy the minimum DIF sample size requirement. They showed through simulation studies that the MH procedure still may have enough power to detect DIF in such situations if the sample size of the reference group is large enough. Here, the results could be reexamined by comparing the DIF detection rates reported in their simulation studies with the theoretical power as calculated by Equation 9.
Paek and Guo (2011) conducted two simulation studies, where in Study 1, they studied the impact of the sample size ratio at a fixed total, and in Study 2, the focal group is fixed at a small sample size whereas the reference group sample size increases. The DIF data were generated from the 3PL model with a scaling factor D = 1.7. In each test form, there were 40 anchor items and 1 studied DIF item. For the anchor items, the item parameters were randomly selected from the following distributions:
The observed rejection rates from the simulated data agree very well with the power calculated from the asymptotic power formula in Equation 9. Panel (a) of Figure 3 shows the scatter plot of the rejection rate from the MH-Z statistic versus the rejection rate from the MH-
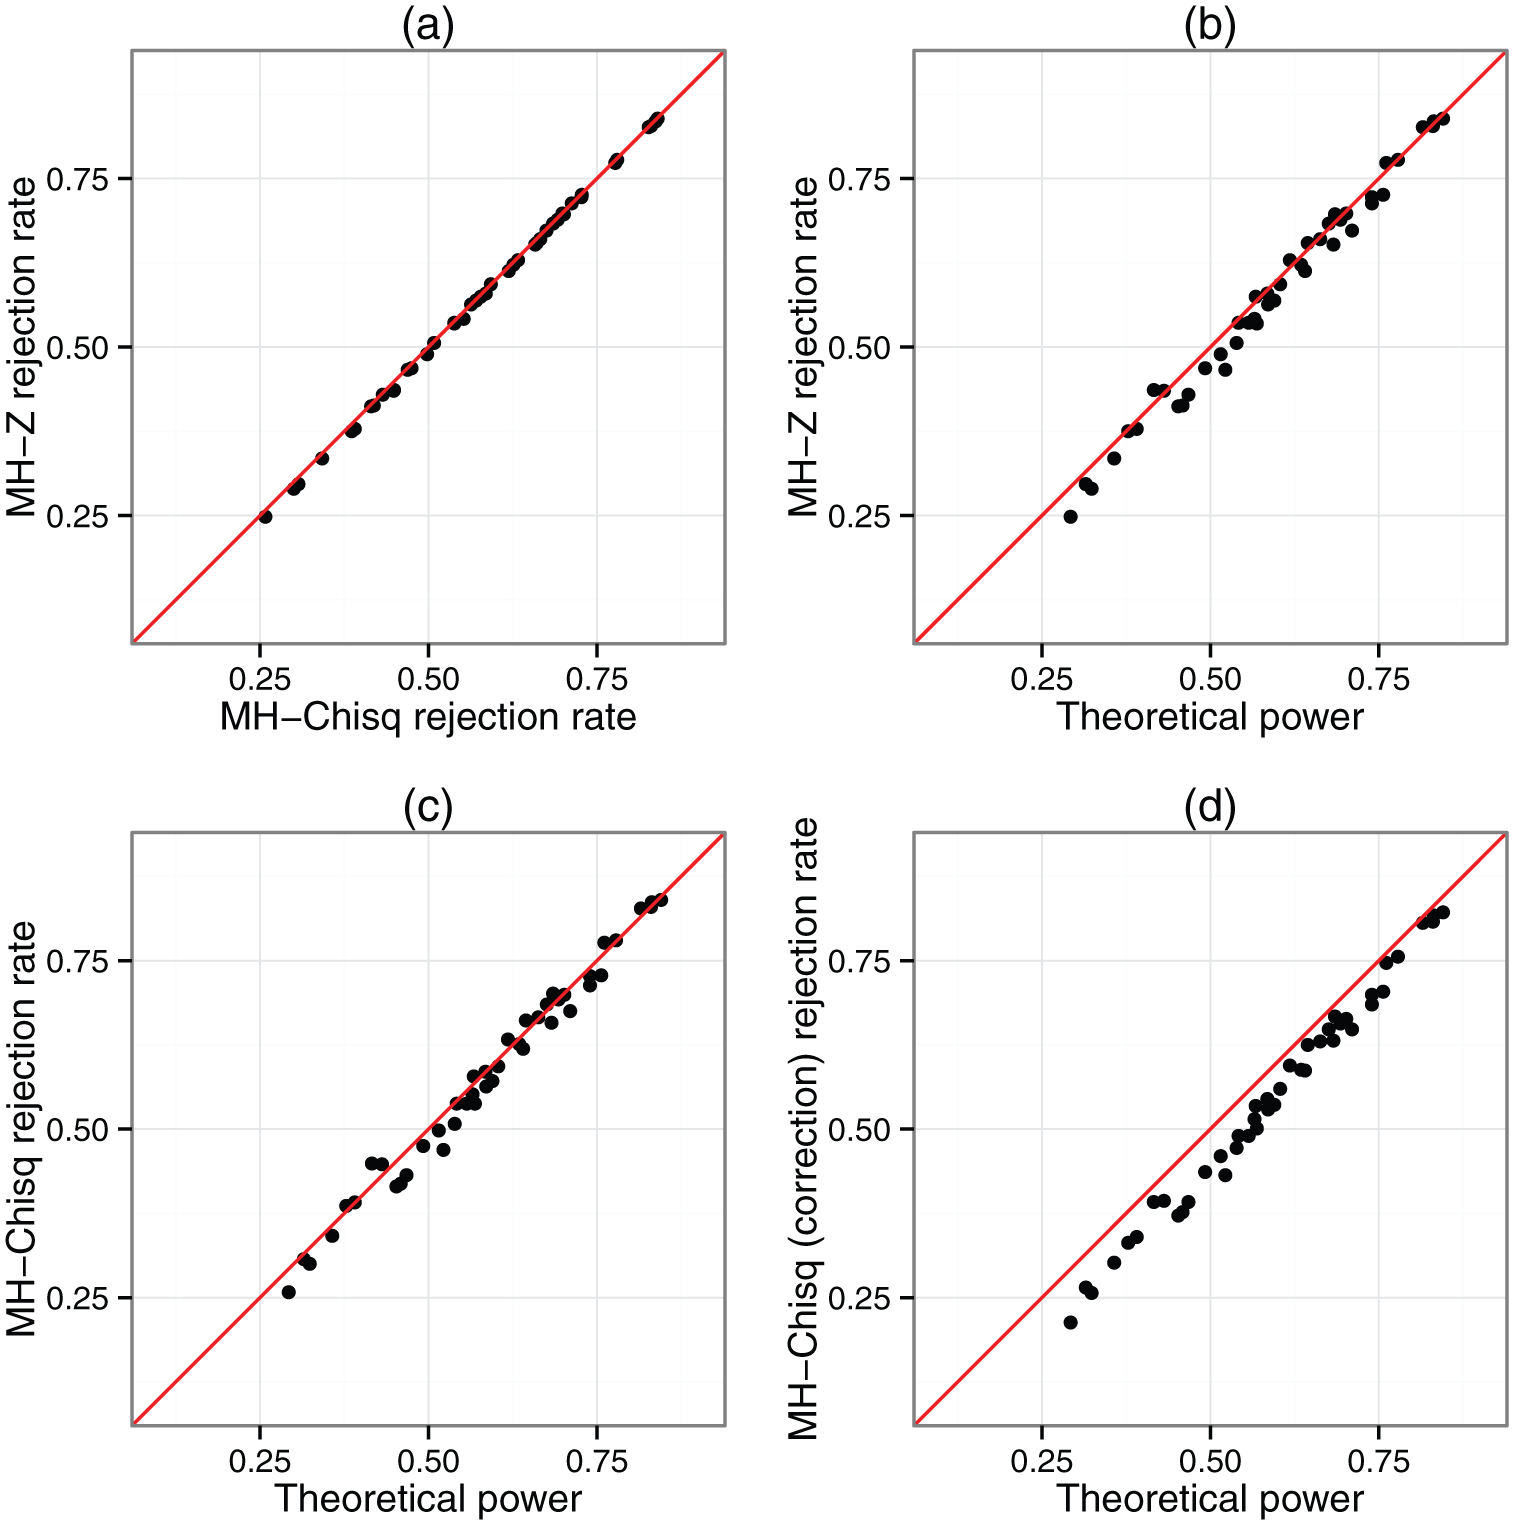
Comparisons of the rejection rate from the Peak and Guo (2011) simulation studies to the theoretical power.
Simulation Study 2: Uttaro and Millsap (1994)
Uttaro and Millsap (1994) conducted a comprehensive simulation study of a variety of factors and their interactions on the detection of DIF by the MH procedure. They designed 20-item and 40-item tests with 36 conditions for the studied item by varying the following four factors: item parameters a, b, c for the focal group in the IRT 3PL model, and the group difference in mean
In the original article, the number of replicates for each condition was 200, and only the MH-χ2 test with continuity correction was considered. Instead of directly using the results reported in Uttaro and Millsap (1994), this study re-conducted the simulation studies under the same design, and increased the number of replicates to 2000, and also obtained the results for the MH-χ2 test without continuity correction and the MH-Z test.
Figure 4 show the scatter plots of rejection rates of the MH tests versus the theoretical power. In the scatter plots, the points are close to the 45° line, indicating the theoretical power values are close to the rejection rates. The differences between the theoretical power value and the rejection rate for 40-item test have a root mean square difference (RMSD) of 0.032 for MH-χ2 and MH-Z and an RMSD of 0.041 for MH-
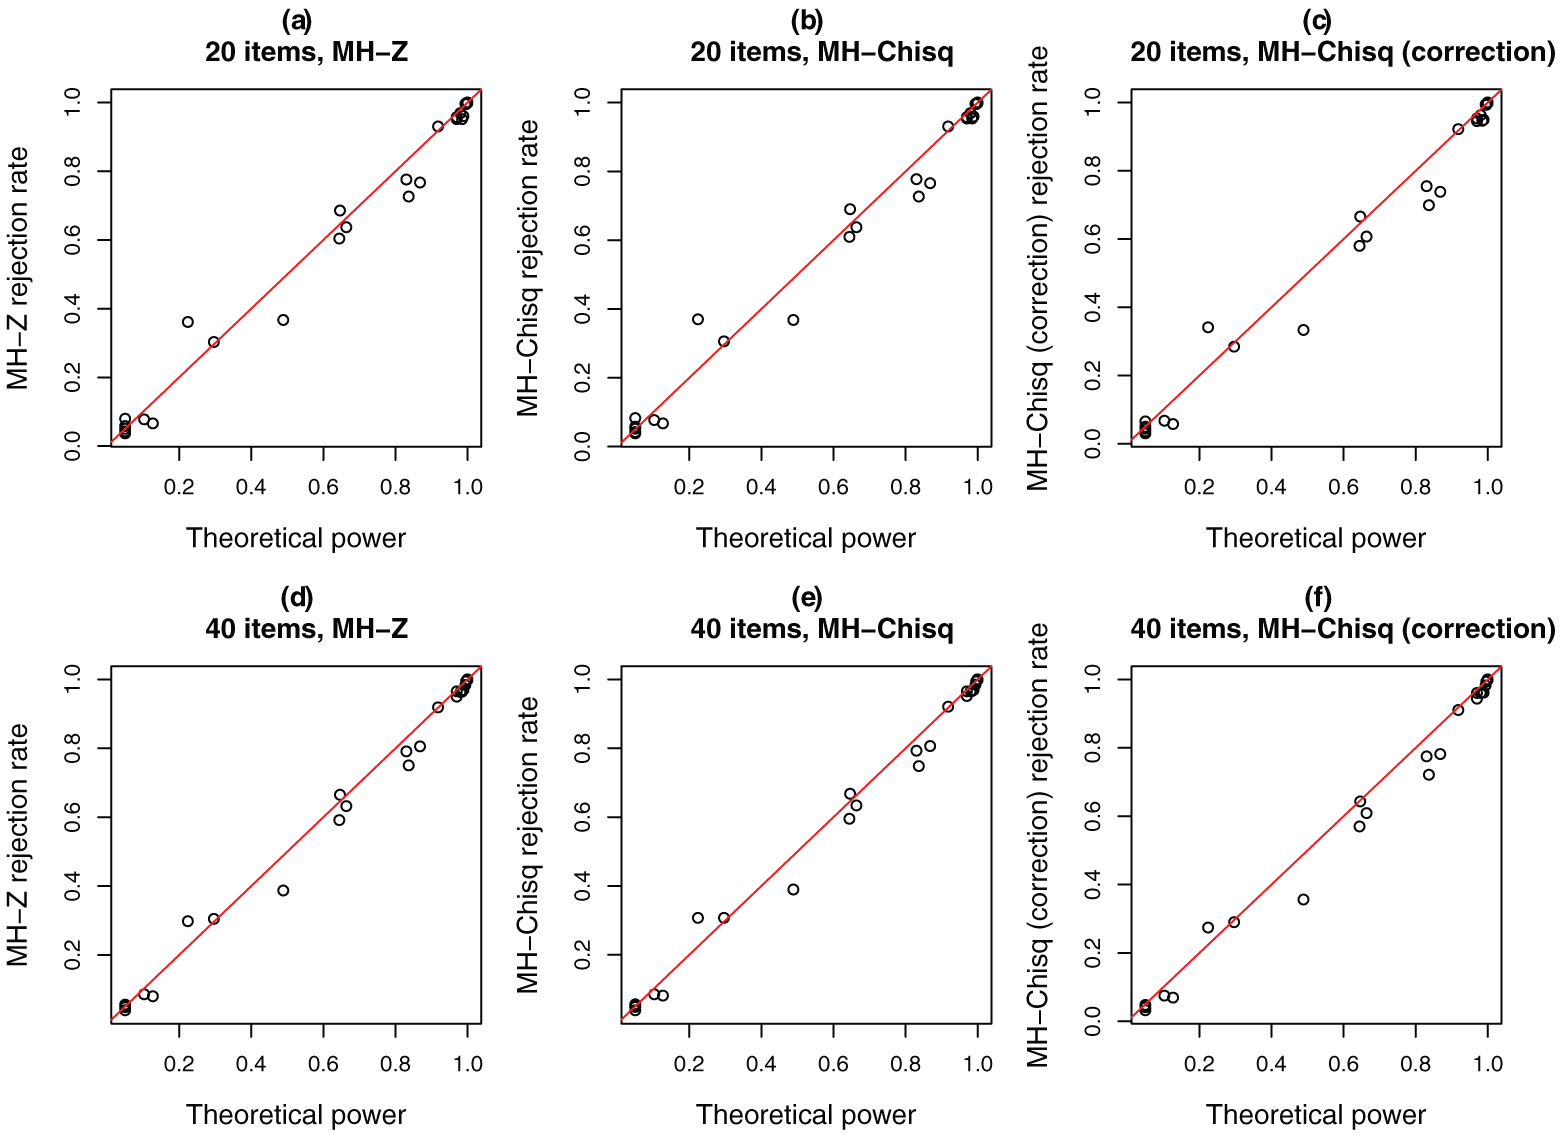
Comparison of rejection rates and the theoretical power in re-conducting the Uttaro and Millsap (1994) simulation studies.
Conclusion
In this article, a general formula for calculating the power of the MH test is derived. The formula is asymptotic in the sense that it assumes the number of examinees is large, and the number of the items is large so that by matching the total scores it is very close to the ideal situation that the underlying latent traits are matched. A comparison of the theoretical values of the power and the observed rejection rate in the simulation studies have shown that the formula provides a close approximation to the true power and thus can be used in practical applications. In particular, for example, it can be used in the design of DIF analyses in regard to determining the level power for detecting DIF effect of certain size under current sample size or in determining the sample size needed in each group for detecting a given DIF effect.
The power formula also helps understanding the factors that influence the power of the MH test, as seen by the discussion in this article. There have been many previous simulation studies on the factors that influence the power of the MH test, and the power formula explains precisely why these factors influence the power.
Practitioners should bear in mind that the use of the power formula involves certain limitations. The formula is derived under the assumptions that matching on the total score is equivalent to matching the latent trait. This assumption may not hold if the test is short and the study item is not included as a part of the matching score, and the distributions of the latent trait in the reference and focal group differ, one could see inflated Type I error if the sample size is large (DeMars, 2010; Roussos & Stout, 1996). In such situations, the power is not meaningful because the Type I error is not controlled and, thus, the test itself is not valid.
An R statistical package for conducting the power and sample size calculations for the MH DIF test, using the methods presented in the article, and the package is available upon request.
Footnotes
Acknowledgements
The author thanks Dr. Louis Roussos for his suggestions. She also thanks the editor, the associate editor, and anonymous reviewers for their constructive comments and feedback on the manuscript.
Declaration of Conflicting Interests
The author(s) declared no potential conflicts of interest with respect to the research, authorship, and/or publication of this article.
Funding
The author(s) disclosed receipt of the following financial support for the research, authorship, and/or publication of this article: This study was supported by a Boston College Research Expense grant that was awarded to the author by her employer, Boston College.

References
Supplementary Material
Please find the following supplemental material available below.
For Open Access articles published under a Creative Commons License, all supplemental material carries the same license as the article it is associated with.
For non-Open Access articles published, all supplemental material carries a non-exclusive license, and permission requests for re-use of supplemental material or any part of supplemental material shall be sent directly to the copyright owner as specified in the copyright notice associated with the article.
