
Abstract
Large-scale educational testing data often contain vast amounts of variables associated with information pertaining to test takers, schools, or access to educational resources—information that can help explain relationships between test taker performance and their learning environment. This study examines approaches to incorporate latent and observed explanatory variables as predictors for cognitive diagnostic models (CDMs). Methods to specify and simultaneously estimate observed and latent variables (estimated using item response theory) as predictors affecting attribute mastery were examined. Real-world data analyses were conducted to demonstrate the application using large-scale international testing data. Simulation studies were conducted to examine the recovery and classification for simultaneously estimating multiple latent (using dichotomous and polytomous items as indicators for the latent construct) and observed predictors for varying sample sizes and number of attributes. Results showed stable parameter recovery and consistency in attribute classification. Implications for latent predictors and attribute specifications are discussed.
Introduction
Scores and survey data from large-scale educational assessments can be a rich and untapped resource for explaining relationships among fine-grained skills and student background variables. In analyzing such educational data, focus can be placed on one of two areas: (a) improving the precision around test taker performance from an underlying latent construct (i.e., studies on descriptive measurement) or (b) examining the relationship between item response data and other variables, targeting factors that explain associations with test taker performance (De Boeck & Wilson, 2004). This study focuses on the latter tradition of explanatory psychometric models that aim to investigate the relationship between test taker performance and explanatory variables.
Cognitive diagnostic models (CDMs) refer to a class of psychometric models that classify examinees into skill profiles that indicate their mastery in fine-grained skills or attributes (Rupp, Templin, & Henson, 2010; von Davier, 2005, 2008). Mastery of skills may be expressed by dichotomous or polytomous categories. Most CDMs are semiparametric models that use a latent class model for specifying skills (discrete latent variables), while including skill-based restrictions through parametric item response functions, in a manner similar to latent trait models such as item response theory (IRT; see DiBello, Roussos, & Stout, 2007). While CDMs and their applications to large-scale data have expanded rapidly, these studies center on improving the descriptive measurement of test takers—that is, describing the performance of test takers at a more fine-grained level. On the contrary, methods for examining relationships between explanatory variables and CDMs have generally been limited. Moreover, despite large amounts of data collected, methods to integrate explanatory variables to CDMs have not been fully studied. For example, techniques for estimating latent variables (e.g., measure of self-confidence in mathematics) using items as indicators that can then be simultaneously fit as explanatory variables predicting skill profiles of examinees have yet to be explicitly investigated. Moreover, incorporating both latent and observed predictors (e.g., access to educational resources such as calculator, computer, and Internet) has not been examined. As such, a framework to incorporate explanatory variables into CDMs requires attention.
Explanatory variables that serve as predictors, in the sense of traditional regression models, can take various forms—observed variables (continuous or categorical) or latent variables (continuous or categorical). To date, only a limited scope of explanatory factors for observed covariates (continuous or discrete) has been examined within the CDM framework through a latent regression modeling approach (Dayton & Macready, 1988; Huang & Bandeen-Roche, 2004; Park & Lee, 2014). On the contrary, explanatory IRT models, incorporating both observed and latent variables, have been widely studied and used in various applications (De Boeck & Wilson, 2004). The development of a CDM framework that incorporates both observed and latent variables would be useful to expand prior work on covariate-only CDMs (using only observed variables) and to advance explanatory models targeting CDMs.
The purpose of this study is to incorporate the explanatory framework based on latent regression that combines measurement and structural components for CDMs, resembling a structural equation model (SEM) for CDMs. In this approach, observed and latent predictors can be either continuous or categorical, and can be specified within an explanatory CDM framework. Latent explanatory factors can be estimated using IRT and simultaneously specified as predictors in CDMs. The deterministic input, noisy, “and” gate (DINA; Junker & Sijtsma, 2001) model is used to demonstrate the framework, where predictors can be specified at the item, attribute, or higher order latent trait levels of the CDM, and extensions of this approach could be applied to other CDM families and generalizations of DINA models (de la Torre, 2011; von Davier, 2008).
This study is divided into two parts: A real-world data analysis was conducted to demonstrate the utility and flexibility of the approach using the Trends in International Mathematics and Science Study (TIMSS) data. Simulation studies were conducted to examine the stability of parameter recovery under varying sample sizes, number of attributes, and types of explanatory factors (observed discrete and latent continuous variables based on dichotomous and polytomous items). Findings from this study can provide implications on the use of explanatory CDMs for applied researchers and can inform the development of more flexible explanatory latent variable models.
CDMs
CDMs were developed to provide more targeted information in the form of skill profiles that resolves limitations of IRT models (de la Torre, 2009). Various forms of CDMs have been developed in the measurement literature, where patterns of attribute mastery have been represented as latent classes (e.g., Haertel, 1989; Henson, Templin, & Willse, 2009), including polytomous levels of mastery (von Davier, 2005, 2008). Holistically, these models cover a variety of situations (i.e., types of construct, response, and dimensionality). Generalizations of CDMs have also been recently proposed, which include the log-linear cognitive diagnosis model (LCDM; Henson et al., 2009), general diagnostic model (GDM; von Davier, 2008), and the generalized DINA model (G-DINA; de la Torre, 2011).
Reparameterized DINA (RDINA) Model
This study focuses on the DINA model, which estimates the probability that examinee i answers item j correctly, given that all required skills (i.e., attributes,
This study uses the RDINA (DeCarlo, 2011) to apply the explanatory framework, as it facilitates incorporating predictors based on a latent regression approach. The RDINA takes the logit of the traditional DINA model:
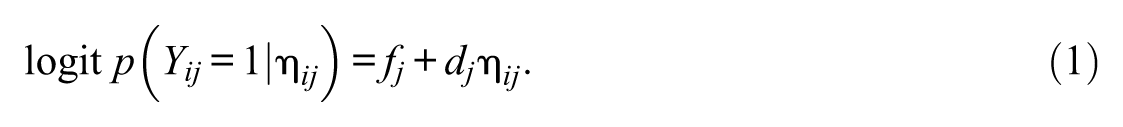
The fj parameter indicates the log odds of the guessing (gj) parameter, and the dj parameter provides a measure of how well the item can discriminate an examinee with or without the mastery of required skills. The guessing and slip parameters used in the DINA model can be recovered by exponentiating the RDINA parameters (DeCarlo, 2011):
Covariate Extension to the RDINA
When an observed covariate,
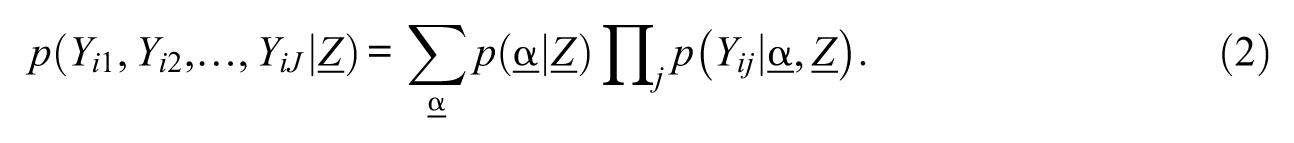
Equation 2 represents the response probability conditioning on covariate


When the covariate Z is conditioned on the response probability, the magnitude of the guessing and slip rates for item j shifts by lj. Moreover, when the covariate is conditioned on the attribute probability, attribute difficulty (bk) shifts by hk for each unit of Z. Other covariate approaches to CDMs have been proposed, including discrete forms and multiple-group extensions (von Davier, Xu, & Carstensen, 2011; Xu & von Davier, 2008). Unobserved covariates can be examined using mixtures of diagnostic models, as presented in von Davier (2007). In this study, the explanatory CDM framework is proposed by extending the covariate RDINA (Park & Lee, 2014), as it can be generalized to specify different parameterizations.
Explanatory CDMs: Incorporating Observed and Latent Predictors
This study is motivated from explanatory IRT models that include latent or observed explanatory factors (see De Boeck & Wilson, 2004) and is extended here for latent class models that subsume CDMs. To date, explanatory variables have been limited to observed categorical or observed continuous variables, where a covariate (
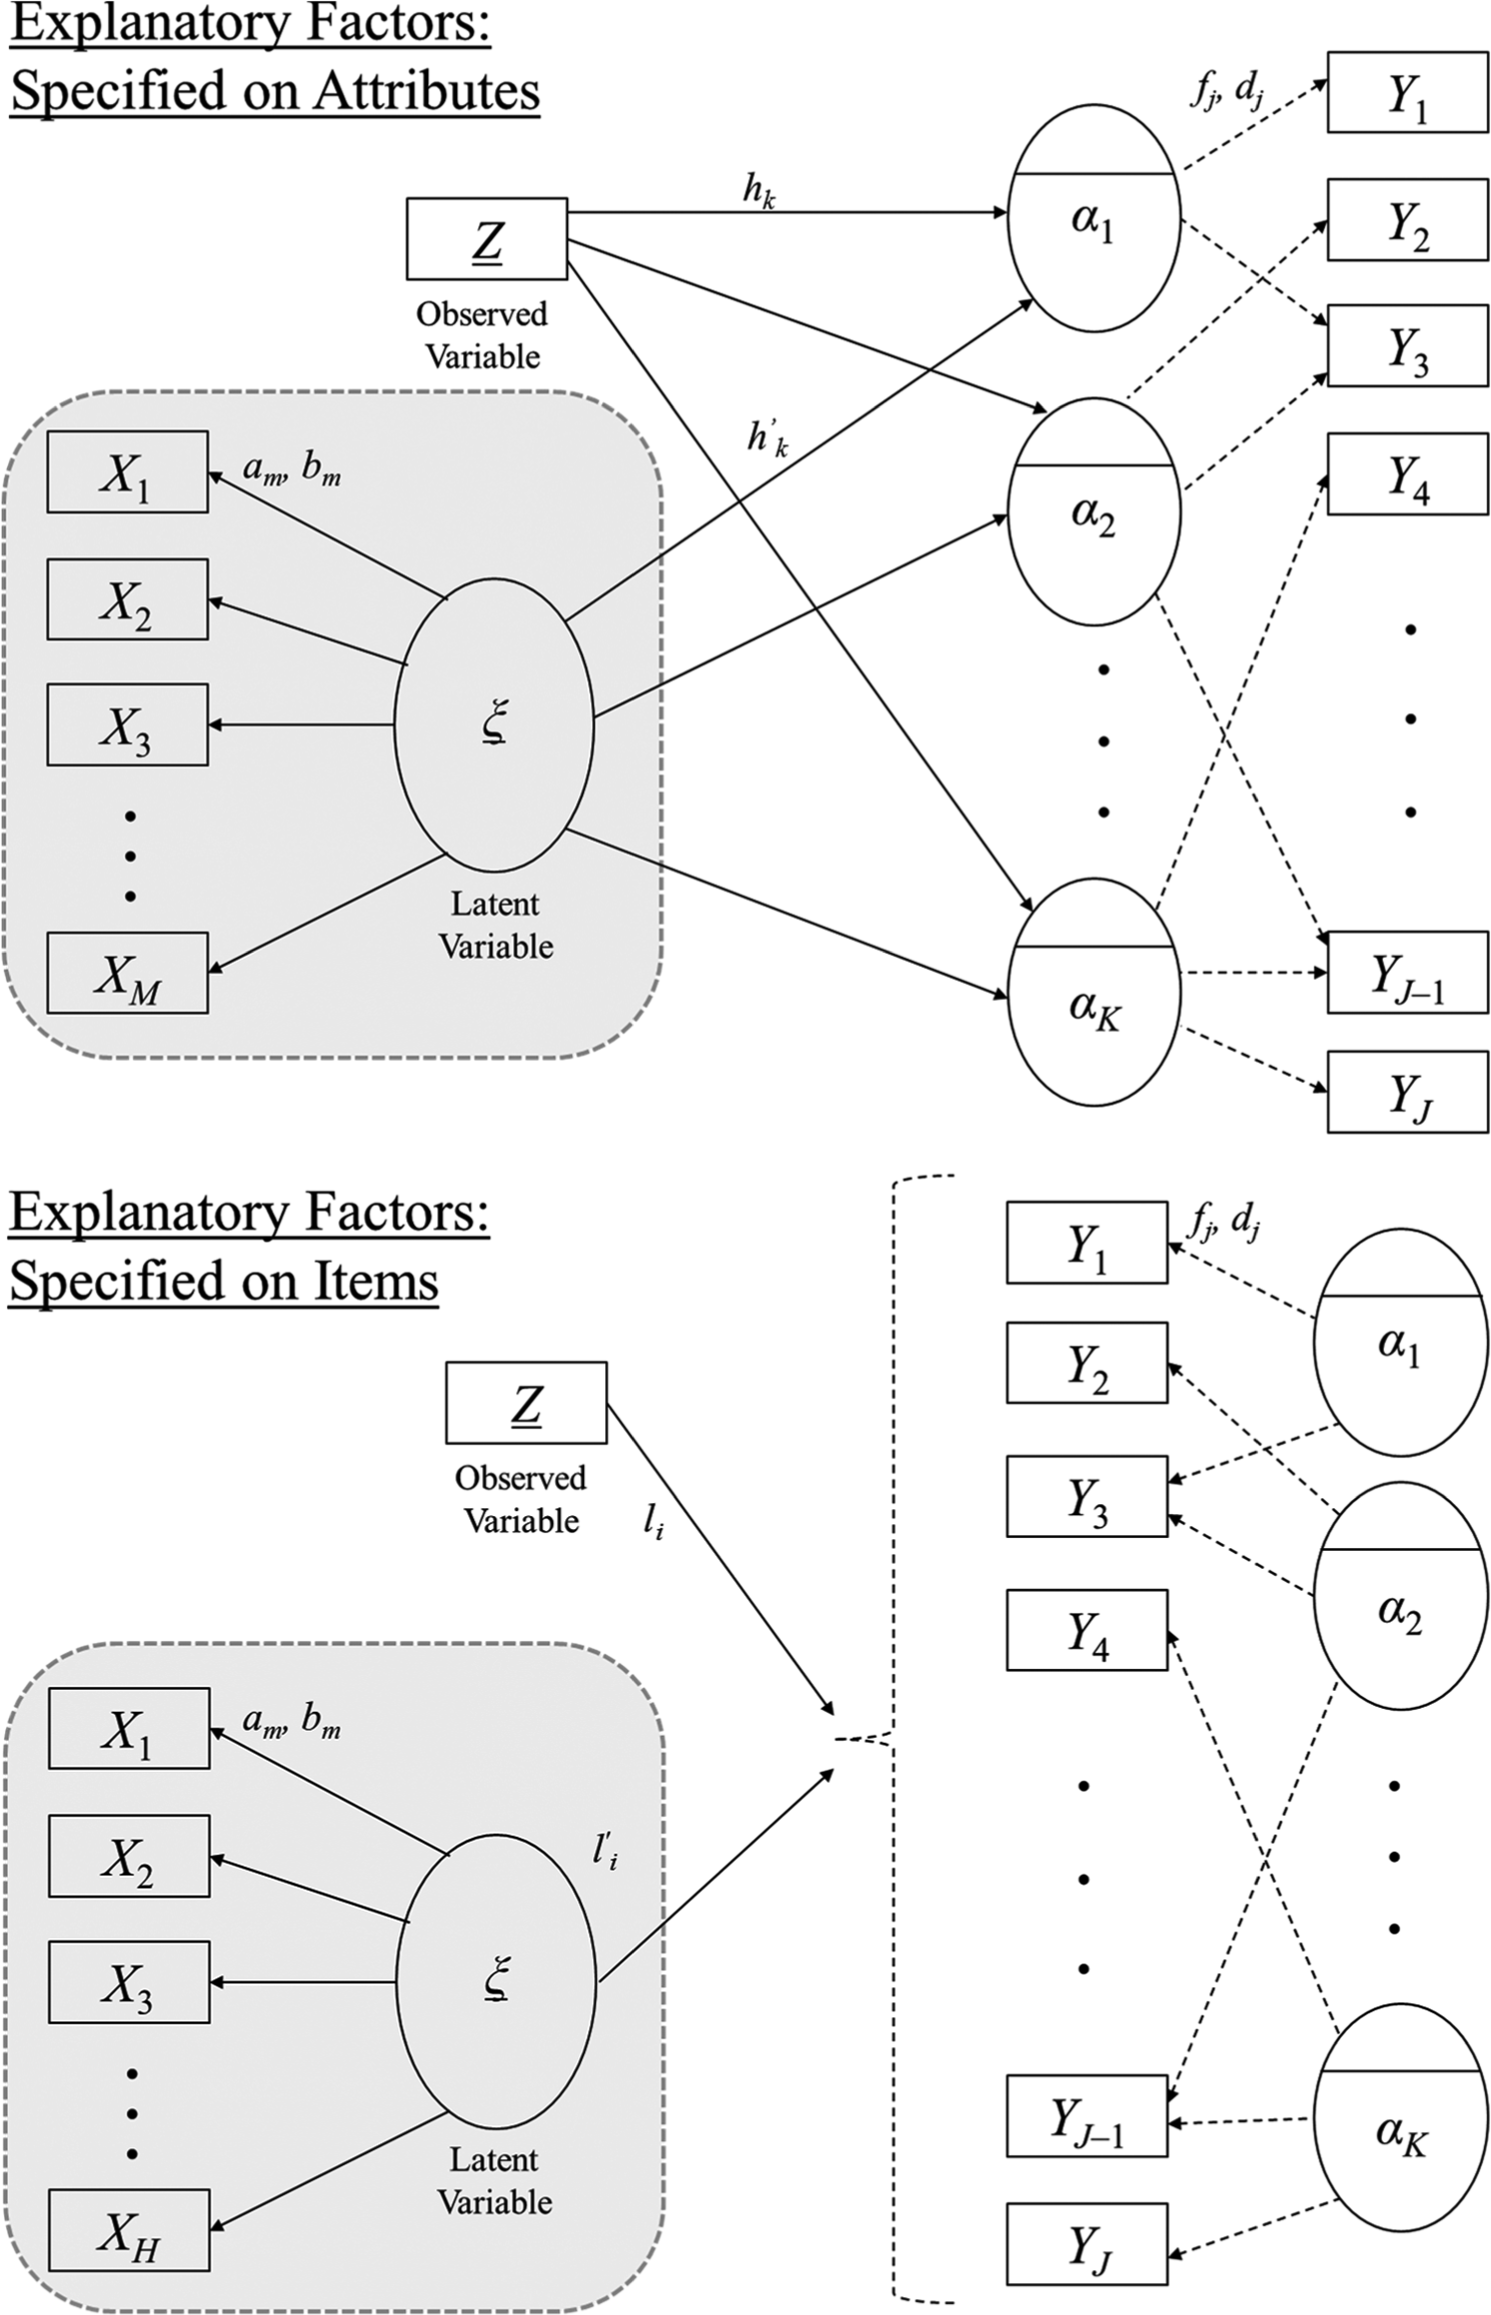
Graphical representation of explanatory CDM: explanatory factors (observed or latent) affecting attributes (top) and items (bottom).
The shaded area indicates the explanatory latent variable (ξ) that is simultaneously estimated using item response data from XM (for M items) as indicators. Prior covariate-based methods in Park and Lee’s (2014) study used only observed variables (
The structural components of the CDM that links the explanatory variables (latent and/or continuous) are as follows:


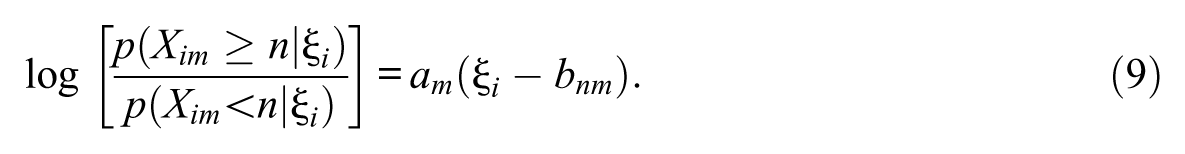
Equations 6 and 7 show the regression parameters for item and attribute levels, respectively. In Figure 1, the structural parameters with a prime (′) denote the explanatory regression effects of the latent explanatory variable. The measurement model associated with the latent explanatory variable (ξ) is estimated using IRT. For dichotomous item response XM, the two-parameter logistic item response theory (2PL-IRT) model is used (see Equation 8), where parameters am and bm represent discrimination and difficulty parameters for item m. For ordinal item response of N categories, the graded response model (GRM; Samejima, 1969) can be used (see Equation 9), where am is the discrimination parameter and bnm is the category threshold parameter. However, other variant IRT models can also be adopted based on theoretical motivation. For identification, the mean and variance of the ξ is fixed to (0, 1).

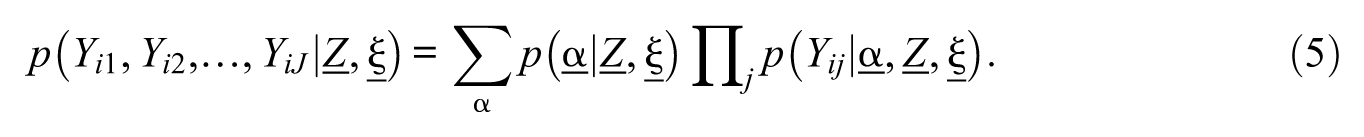
There are several advantages to using the explanatory RDINA approach. The covariate model (Park & Lee, 2014) only includes the structural component, meaning that only observed covariates can be specified. If a latent variable (ξ) is included as a predictor, a two-step approach is required, where IRT is used to estimate the latent variable first; then, the estimated latent variable is used as an observed variable in the covariate model, forming the second step. However, the explanatory framework allows simultaneous estimation of latent factors as predictors within a single model (rather than a two-step process). The focus of this article is on the attribute- and item-level explanatory RDINA to examine factors that explain mastery of attributes and item responses.
Study I: Real-World Data Analysis Using TIMSS
Method
Real-world data analysis was conducted to demonstrate the application of the explanatory CDM presented in Figure 1. The 2007 fourth-grade mathematics TIMSS data were used, following the five-attribute Q-matrix specification in Park and Lee’s (2014) study for 25 items from Booklet 4 (M = 13.26, SD = 6.19; see Table 1). In these data, examinees from Armenia (n = 294), Hong Kong (n = 270), Italy (n = 321), Morocco (n = 265), United States (n = 565), Massachusetts (n = 127), and Minnesota (n = 133) were aggregated, totaling 1,975 examinees.
RDINA Parameters.
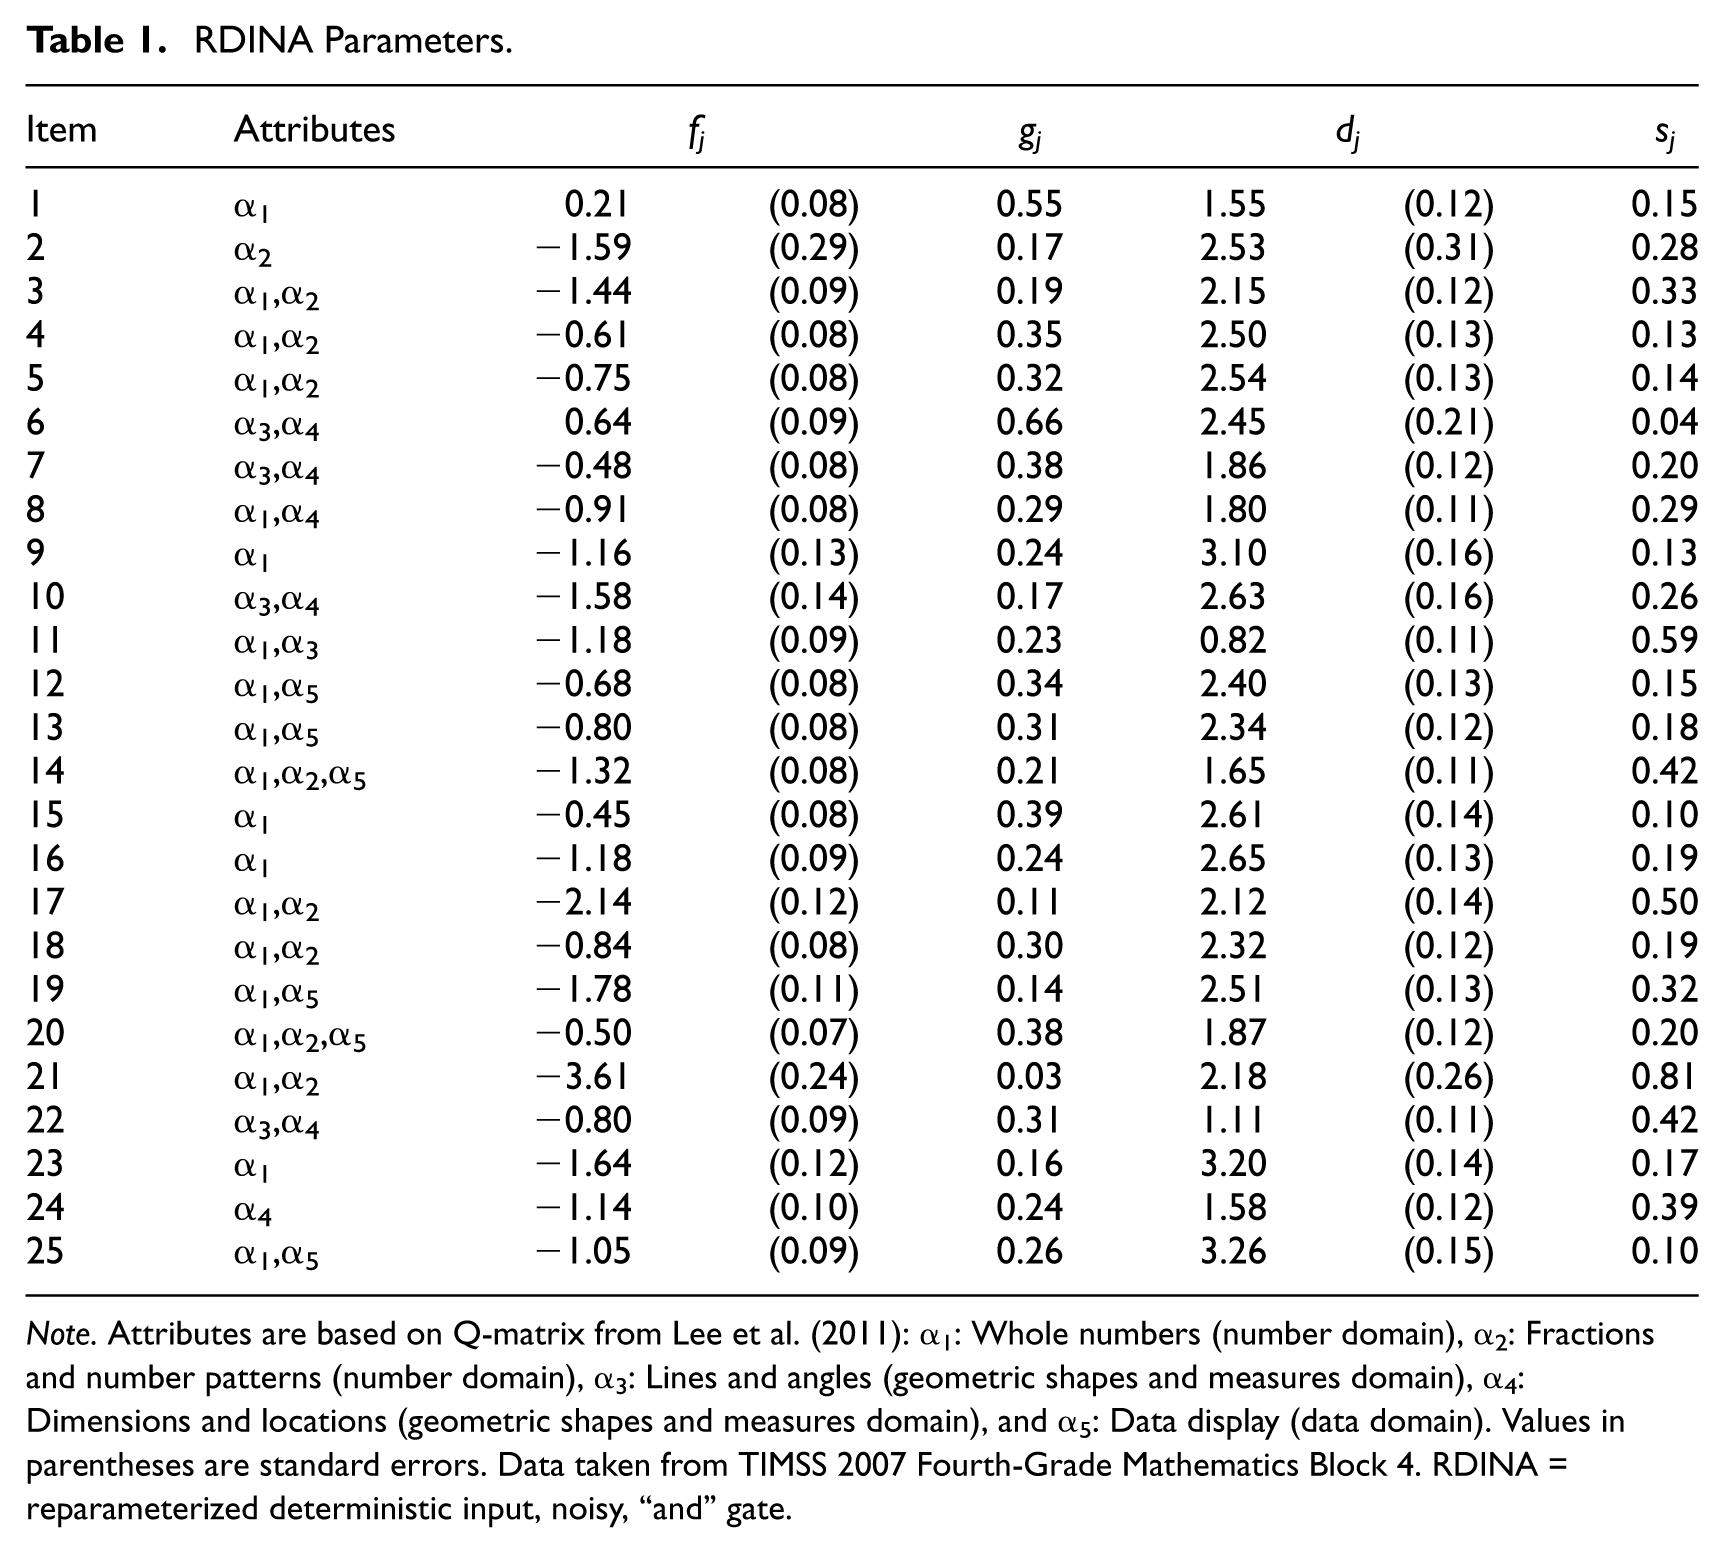
Note. Attributes are based on Q-matrix from Lee et al. (2011): α1: Whole numbers (number domain), α2: Fractions and number patterns (number domain), α3: Lines and angles (geometric shapes and measures domain), α4: Dimensions and locations (geometric shapes and measures domain), and α5: Data display (data domain). Values in parentheses are standard errors. Data taken from TIMSS 2007 Fourth-Grade Mathematics Block 4. RDINA = reparameterized deterministic input, noisy, “and” gate.
Three predictors were used as explanatory variables:
Confidence: four-item self-reported measure of confidence in mathematics rated on a 4-point scale, ranging from 1 = “Disagree,” 2 = “Agree a little,” 3 = “Somewhat agree,” and 4 = “Agree a lot.” The items are as follows: (1) I usually do well in mathematics, (2) Mathematics is easier for me than for many of my classmates, (3) I am good at mathematics, and (4) I learn things quickly in mathematics (Cronbach’s α = .70; M = 2.02, SD = 0.71).
Affect: three-item self-reported measure affect in mathematics, reported as “Yes = 1” or “No = 0.” The items are as follows: (1) I enjoy learning mathematics, (2) Mathematics is fun, and (3) I like mathematics (Cronbach’s α = .80; M = 0.76, SD = 0.34).
Calculator: self-reported status of calculator ownership (82% own calculators).
The explanatory variables were selected based on their association (correlation) with the mathematics score (rcalculator = .14, raffect = .13, and rconfidence = .33, all ps < .001).
The attribute-level explanatory RDINA was estimated with “confidence” fit using GRM, “affect” fit using 2PL-IRT, and “calculator” fit as an observed dichotomous variable. To compare the attribute-level effects of the predictors, a covariate RDINA model was also fit, by separately estimating “confidence” and “affect” via IRT and using the predicted values as covariates (a two-step approach). The purpose of this comparison was to examine differences in estimates for simultaneous estimation (explanatory RDINA) versus a two-step approach (covariate RDINA). In both approaches, the variance of “confidence” and “affect” was fixed to 1.0 for identification.
Models were fit using Latent GOLD 5.0 (Vermunt & Magidson, 2013), with 100 sets of starting values. Estimation began with the expectation–maximization (EM) algorithm, followed by the Newton–Raphson (NR) to obtain maximum-likelihood (ML) or posterior mode (PM) estimates, to avoid boundary estimation issues. The Jacobian matrix was examined to be of full rank for local identification (Huang & Bandeen-Roche, 2004).
Results
The attribute-level model converged (tolerance criteria = 1.0 × 10⁻⁸), with the following estimates: –2 log likelihood (–2LL) = 77,572.76, Akaike information criterion (AIC) = 77,756.75, Bayesian information criterion (BIC) = 78,270.88; 92 parameters.
RDINA item parameters
Table 1 shows the RDINA parameters. The corresponding guessing and slip parameters are also presented in the table. The mean guessing and slip parameter estimates were .28 and .27, respectively.
IRT parameters
IRT parameters for “confidence” and “affect” are presented in Table 2, where confidence was fit using GRM and affect was fit using 2PL-IRT. The item discrimination for confidence ranged between 1.26 and 1.54; for affect, item discrimination ranged between 1.28 and 3.44.
Explanatory Measurement Model Parameters: GRM and 2PL-IRT Models.
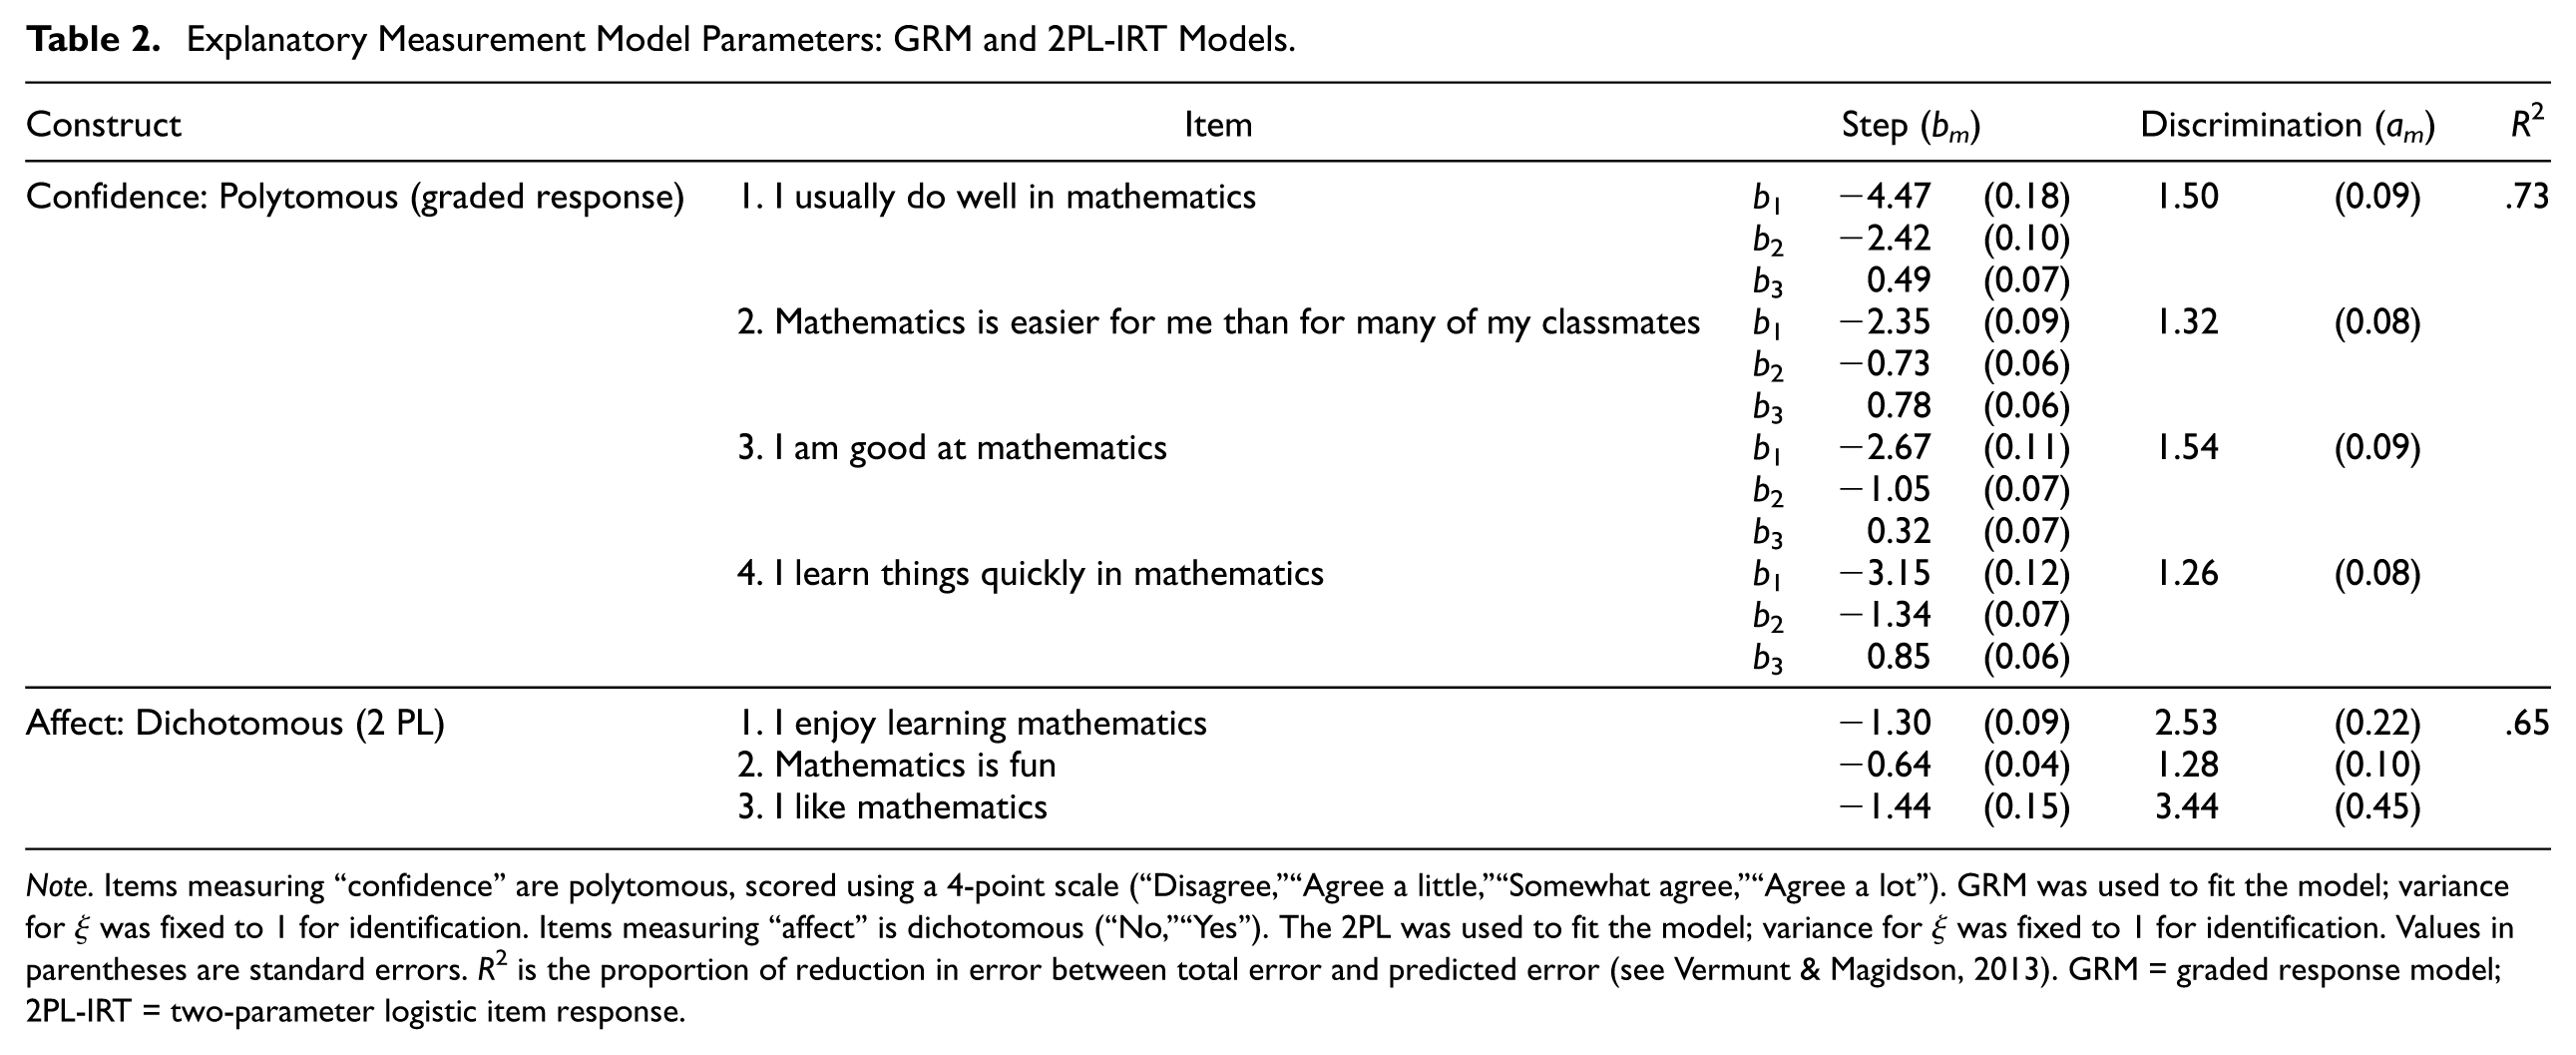
Note. Items measuring “confidence” are polytomous, scored using a 4-point scale (“Disagree,”“Agree a little,”“Somewhat agree,”“Agree a lot”). GRM was used to fit the model; variance for ξ was fixed to 1 for identification. Items measuring “affect” is dichotomous (“No,”“Yes”). The 2PL was used to fit the model; variance for ξ was fixed to 1 for identification. Values in parentheses are standard errors. R 2 is the proportion of reduction in error between total error and predicted error (see Vermunt & Magidson, 2013). GRM = graded response model; 2PL-IRT = two-parameter logistic item response.
Attribute parameters
The attribute-level explanatory RDINA parameters indicate significant effects as predictors shifting attribute difficulty (bk). Table 3 shows the results. To compare the simultaneous estimation provided by the explanatory RDINA and the two-step covariate RDINA models, parameter estimates are presented together.
Attribute Difficulty (bk) and Predictors (hkq).
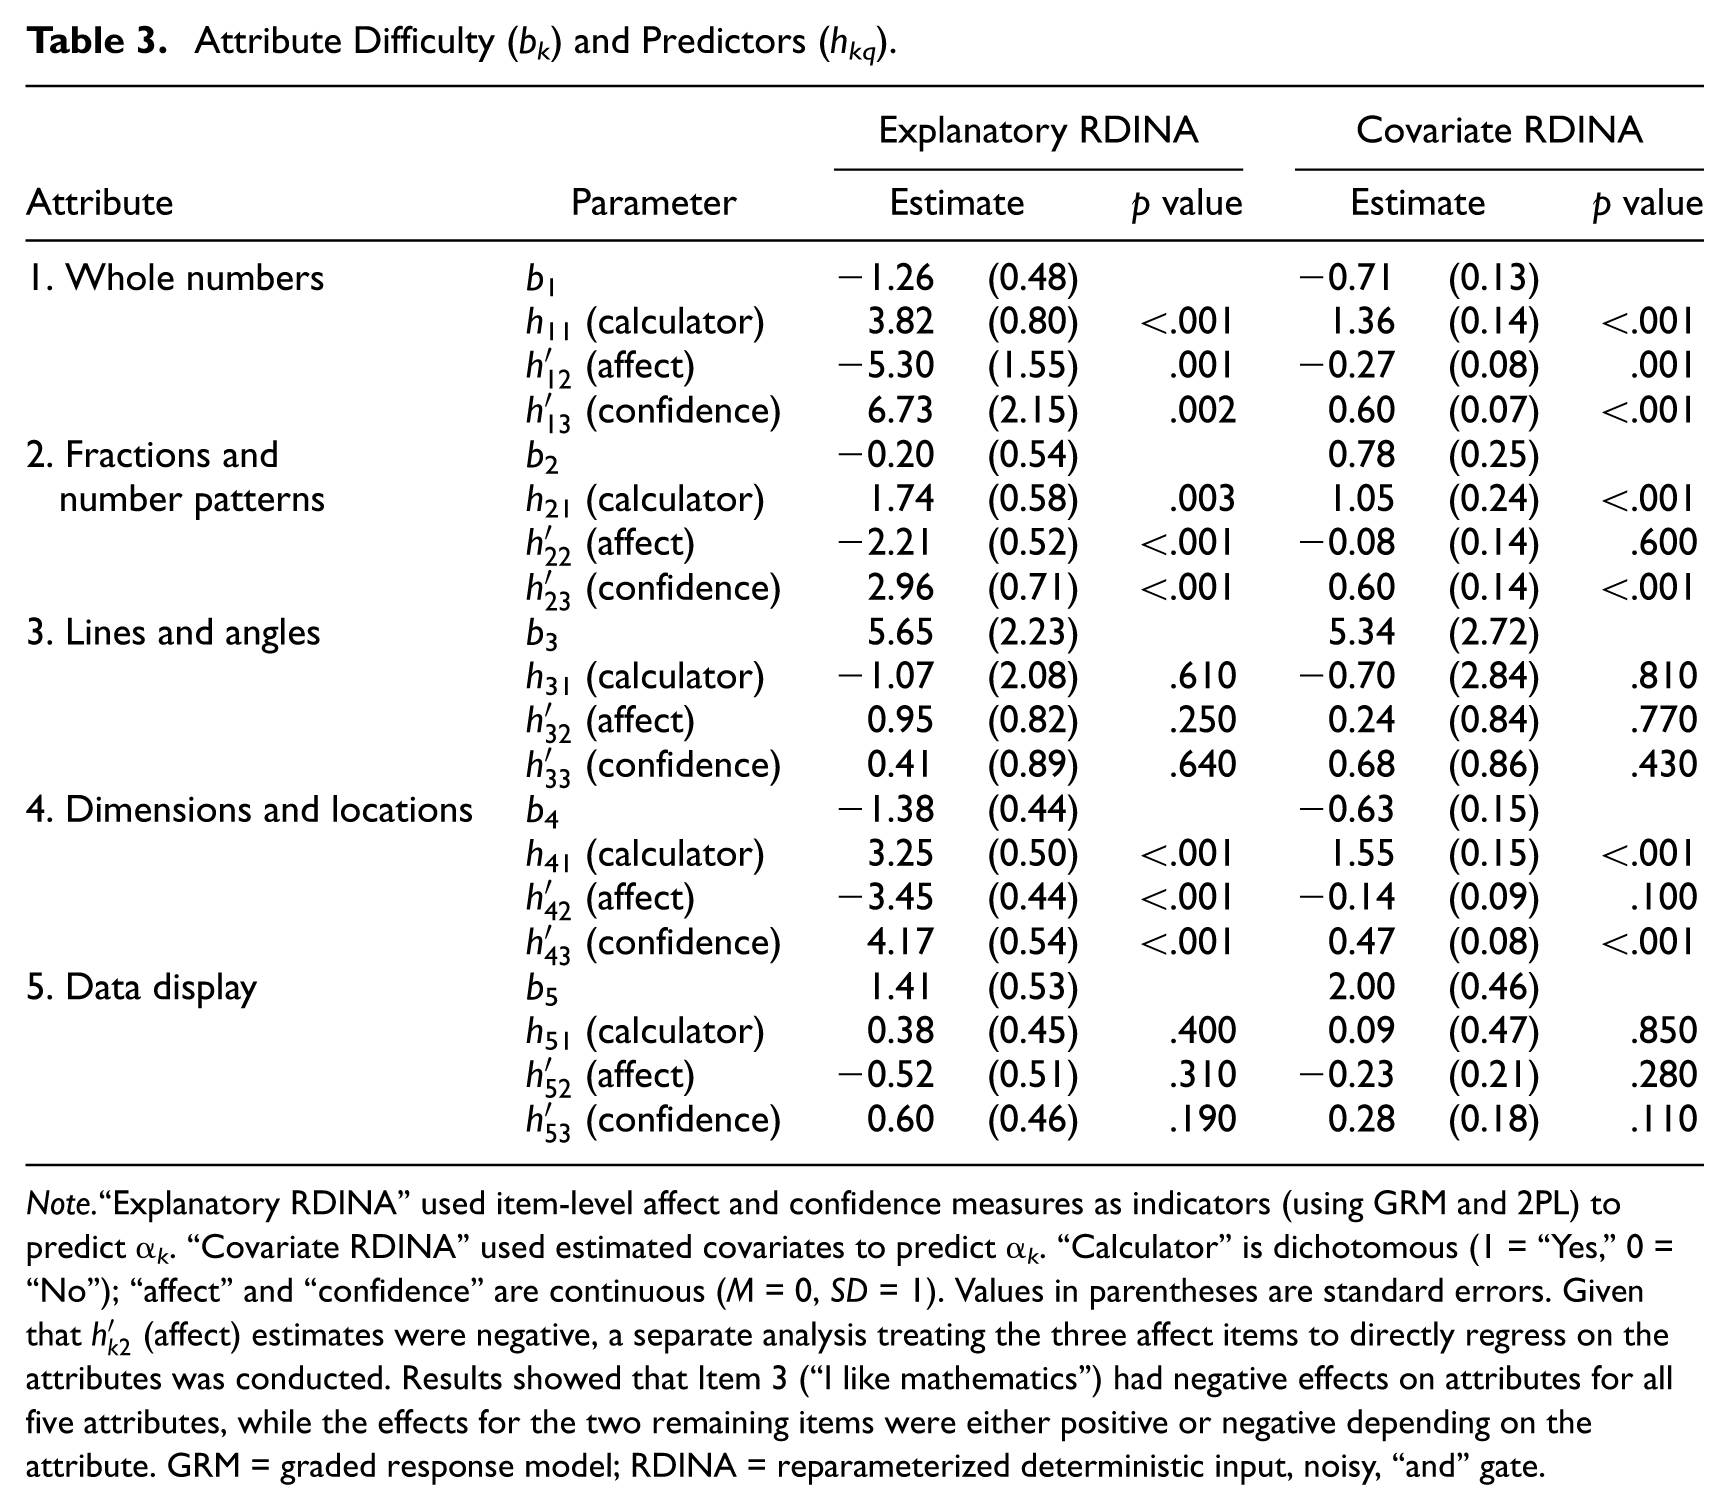
Note.“Explanatory RDINA” used item-level affect and confidence measures as indicators (using GRM and 2PL) to predict α
k
. “Covariate RDINA” used estimated covariates to predict α
k
. “Calculator” is dichotomous (1 = “Yes,” 0 = “No”); “affect” and “confidence” are continuous (M = 0, SD = 1). Values in parentheses are standard errors. Given that
Results show relatively large differences in the estimates for all parameters. In particular, the differences between the explanatory and the covariate models were larger when the predictor was based on a latent variable (“affect” and “confidence”). For bk, the largest difference was in Attribute 2 (fractions and number patterns), with a difference of .98 units. For hk1 (calculator) and for
Owning a calculator and having higher self-confidence in mathematics had significant effects for Attributes 1 (whole numbers), 2 (fractions and number patterns), and 4 (dimensions and locations). On the contrary, higher “affect” had negative effects on attribute mastery for Attributes 1, 2, and 4. With respect to differences between models, the latent measure of affect, as estimated using the explanatory model, was significant for Attributes 2 (fraction and number patterns) and 4 (dimensions and location), whereas it was not significant for the covariate model, indicating differential attribute difficulty due to the inclusion of the measurement model, as opposed to only a structural component to the model.
Classification and latent class sizes
Classification (Pc) estimates based on posterior probabilities ranged between .86 and .98, with similar estimates between the explanatory and covariate RDINA models. Latent class sizes were similar, except for Attribute 2 (fractions and number patterns), which was .62 for the explanatory and .82 for the covariate RDINA models. For full comparison of classification and latent class sizes, see Online Appendix Table A1.
Item-level explanatory RDINA
The corresponding item-level explanatory RDINA model was also fit to examine convergence and trends in parameter estimates. For the item-level explanatory RDINA model, three predictors were specified on the items; GRM and 2PL were used to fit “confidence” and “affect,” respectively. The model converged (tolerance criteria = 1.0 × 10⁻⁸), with the following estimates: –2LL = 76,132.24, AIC = 76,420.23, BIC = 77,224.95; 144 parameters. Pc ranged between .77 and .92, and was lower for all attributes, when compared with the attribute-level explanatory RDINA model. The three predictors had significant effects on all 25 items (except for Item 11, which did not have a significant effect for calculator, p = .400). Complete results for the item-level explanatory RDINA can be obtained from the corresponding author.
Study II: Simulation Study
Method
Simulation studies were conducted to examine consistency in parameter recovery and classification using the TIMSS real-world results as generating population values. Five main conditions were examined:
Explanatory RDINA with one latent predictor (three dichotomous items fit using 2PL),
Explanatory RDINA with one latent predictor (four polytomous items fit using GRM),
Explanatory RDINA with one latent (GRM) and one observed dichotomous predictor,
Explanatory RDINA with two latent predictors (GRM and 2PL) and one observed dichotomous predictor, and
Covariate RDINA with three observed predictors (two continuous and one dichotomous).
The fifth condition was added to compare the parameter recovery and classification of the explanatory model that includes both latent and observed predictors (full model: Condition 4) with a covariate-based model that only has observed predictors (two continuous and one dichotomous observed predictors). Following the real-world data, the 25-item response data were generated. The choice to use three and four items for the dichotomous and polytomous (4-point scale) items was motivated from the real-world data, as most self-reported scales in TIMSS had similar structures.
Two sample size conditions (1,000 and 2,000 examinees) and attribute sizes (three and five attributes) were examined, resulting in a total of 20 conditions (= five model conditions × two sample sizes×two attribute specifications). The sample sizes were based on numbers of examinees often used for large-scale data analysis, including the TIMSS; the number of attributes and Q-matrix specification follow from the TIMSS example. For the three-attribute simulation, attributes α1 and α2 were combined to form the “Number” attribute; attributes α3 and α4 were combined to form the “Geometry” attribute; and attribute α5 was kept to form the “Data” attribute (see Table 1).
Data were generated using Stata 14 and fit using Latent GOLD 5.0. One hundred replications were fit for each condition. Parameter estimates were summarized and compared with population data using three measures: (a) bias, (b) % Bias, and (c) mean squared error (MSE). Here,
Results
Condition 1 (using 2PL to estimate explanatory latent variable)
Table 4 shows the parameter recovery results by sample size and by number of attributes.
Explanatory RDINA With IRT: Parameter Recovery (Conditions 1 and 2).
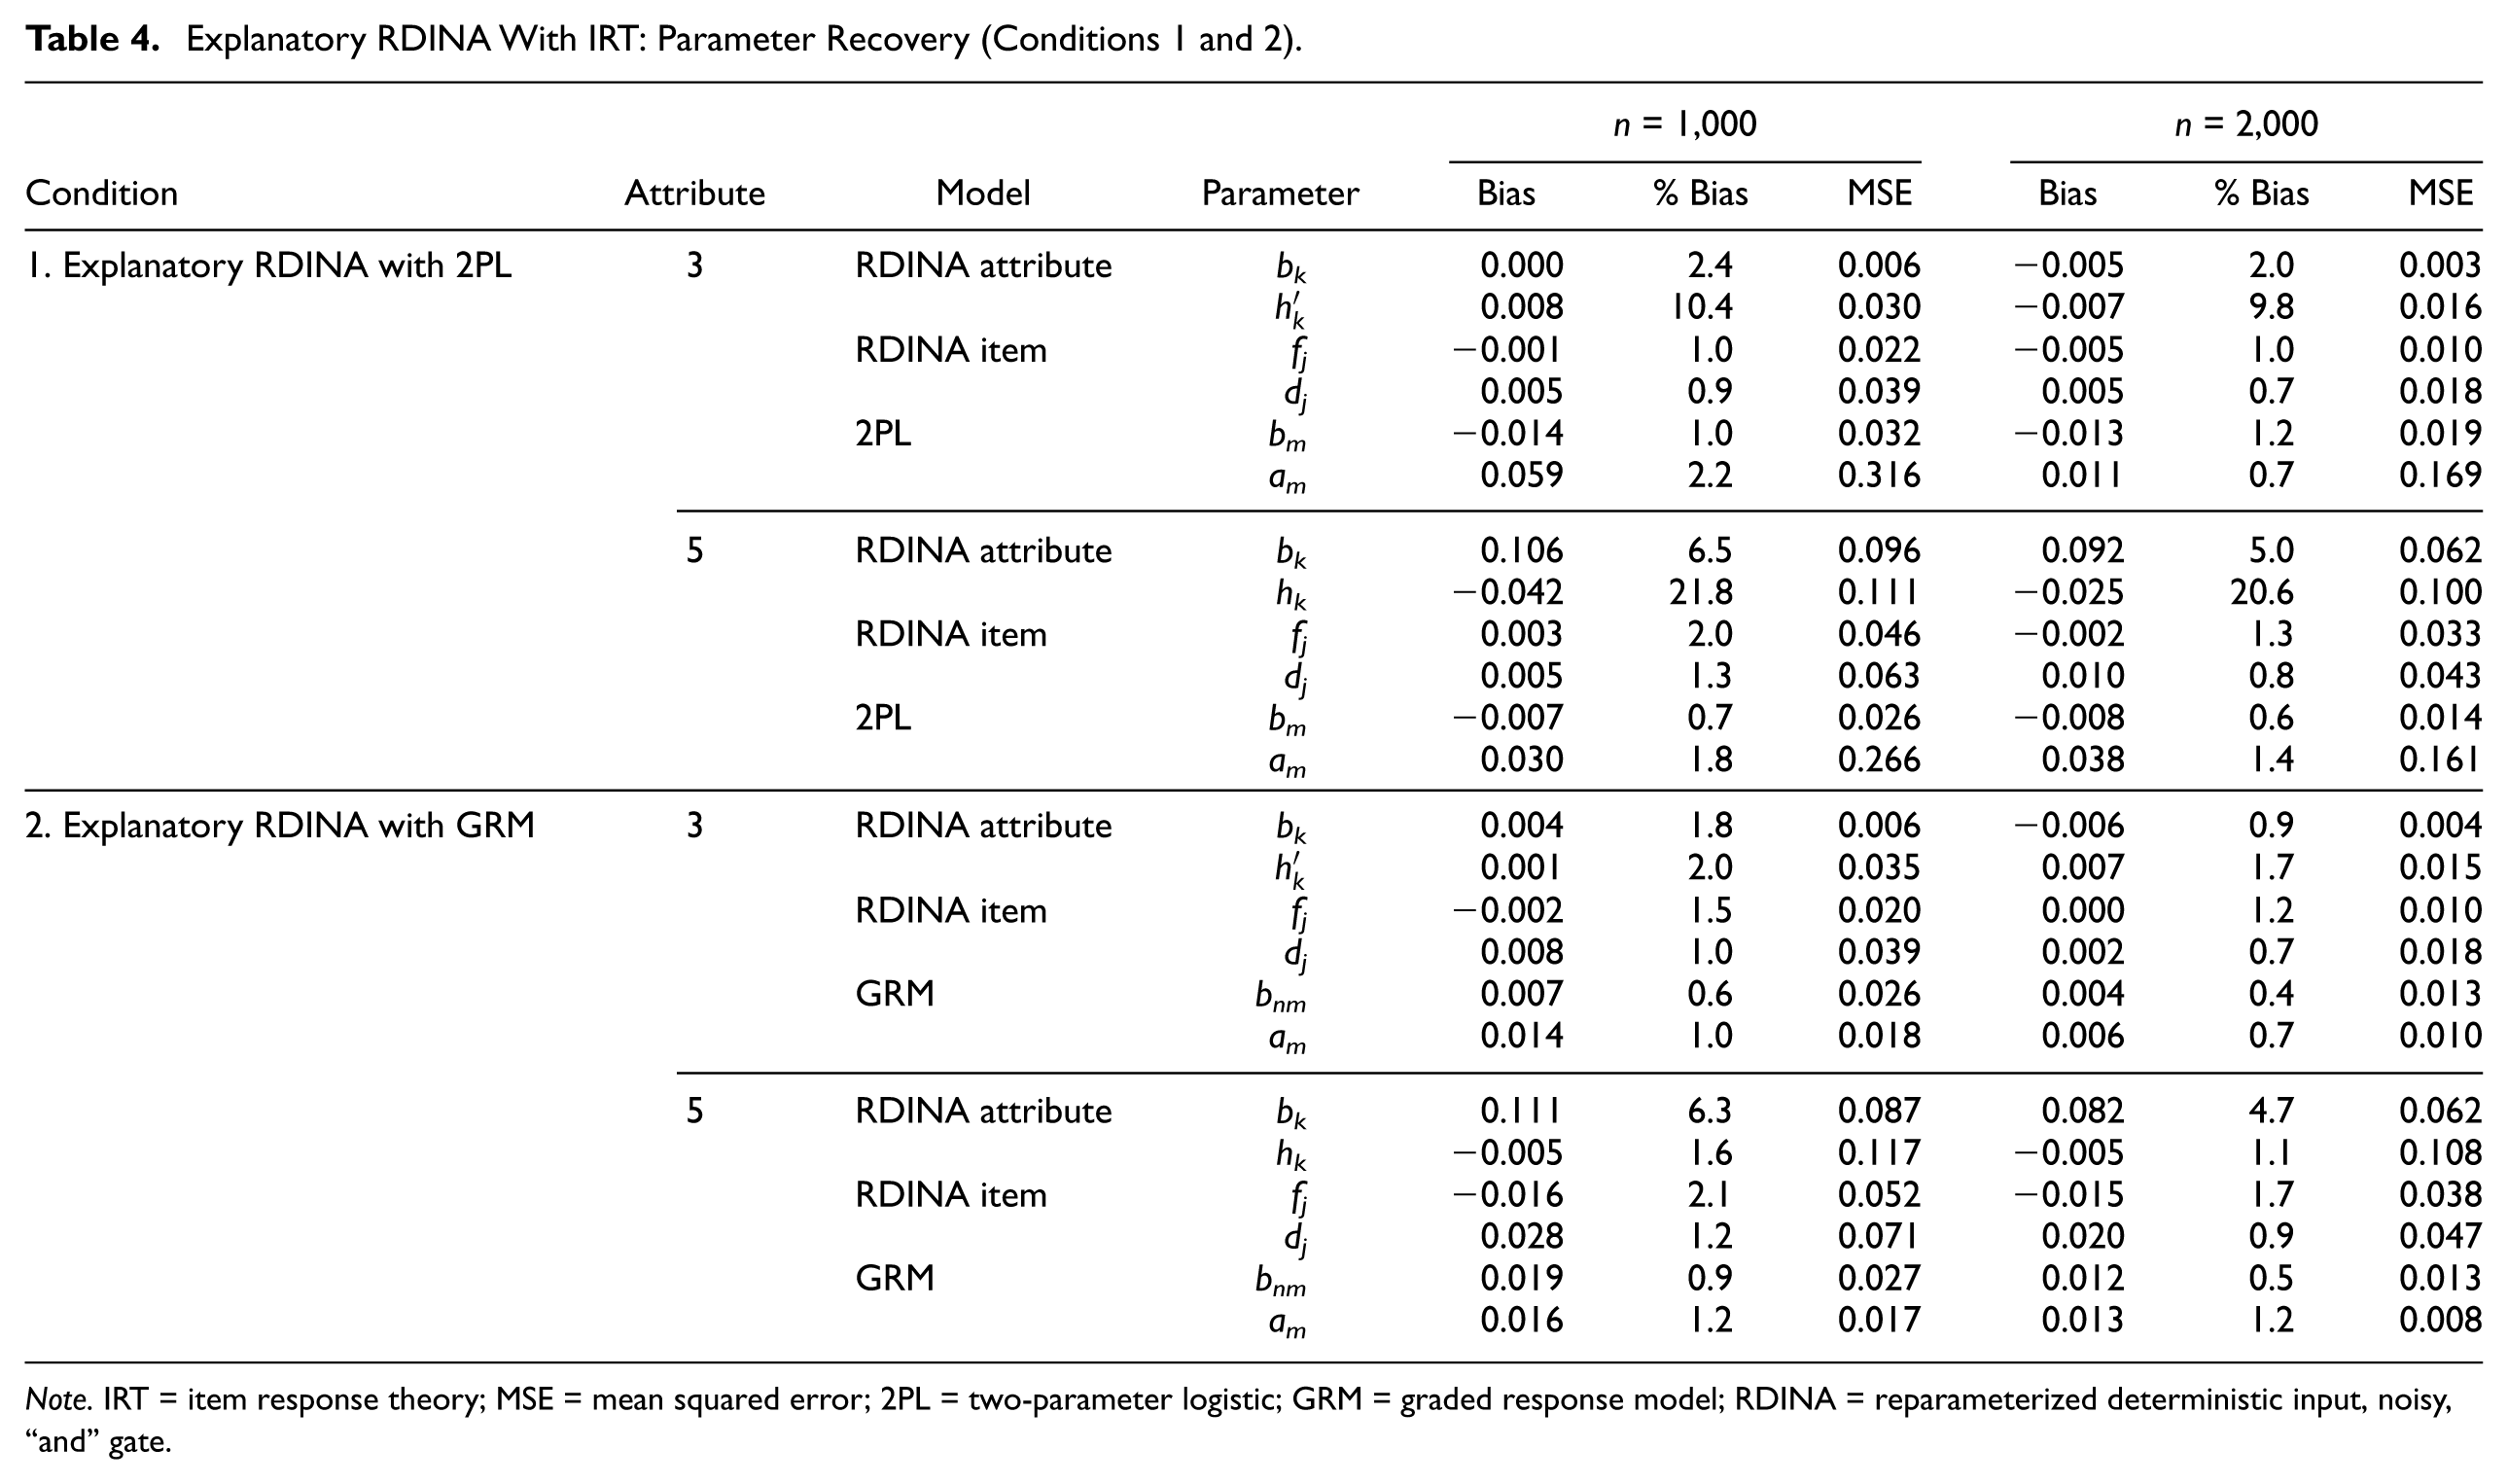
Note. IRT = item response theory; MSE = mean squared error; 2PL = two-parameter logistic; GRM = graded response model; RDINA = reparameterized deterministic input, noisy, “and” gate.
For the three- and five-attribute conditions, the RDINA item parameters had % Bias less than or equal to 2.0%. Generally, recovery was better for the dj parameter than fj. Parameter recovery for the 2PL had % Bias less than or equal to 2.2%. The greatest variability was at the attribute level. The bk parameter % Bias was less than 2.5% and 6.5% for the three- and five-attribute conditions. The % Bias was largest for the
Condition 2 (using GRM to estimate explanatory latent variable)
The item-level trends in the explanatory CDM using items as indicators to predict attributes using GRM were similar to Condition 1, with % Bias less than 2.2% (see Table 4). The GRM parameter estimates had % Bias less than 1.3%. The largest bias was at the attribute level for the five-attribute condition (three-attribute condition had % Bias less than or equal to 2.0%), with % Bias of 6.3% and 4.7% for sample sizes of 1,000 and 2,000, respectively, for attribute difficulty.
Condition 3 (one observed covariate and one explanatory latent variable fit using GRM)
Condition 3 examines estimation for one latent predictor (estimated using GRM) and one observed dichotomous predictor (see Table 5). Overall, the recovery for the three-attribute condition had % Bias less than 3.5% across both sample size conditions and models. For the five-attribute condition, the RDINA item and GRM parameters all had % Bias less than 1.7%. However, at the attribute level, the attribute difficulty parameter had % Bias of 15.2% and 10.2% for the three- and five-attribute conditions, respectively. The % Bias for hk1 (observed) and for
Explanatory RDINA With IRT and Observed Covariate: Parameter Recovery (Conditions 3 and 4).
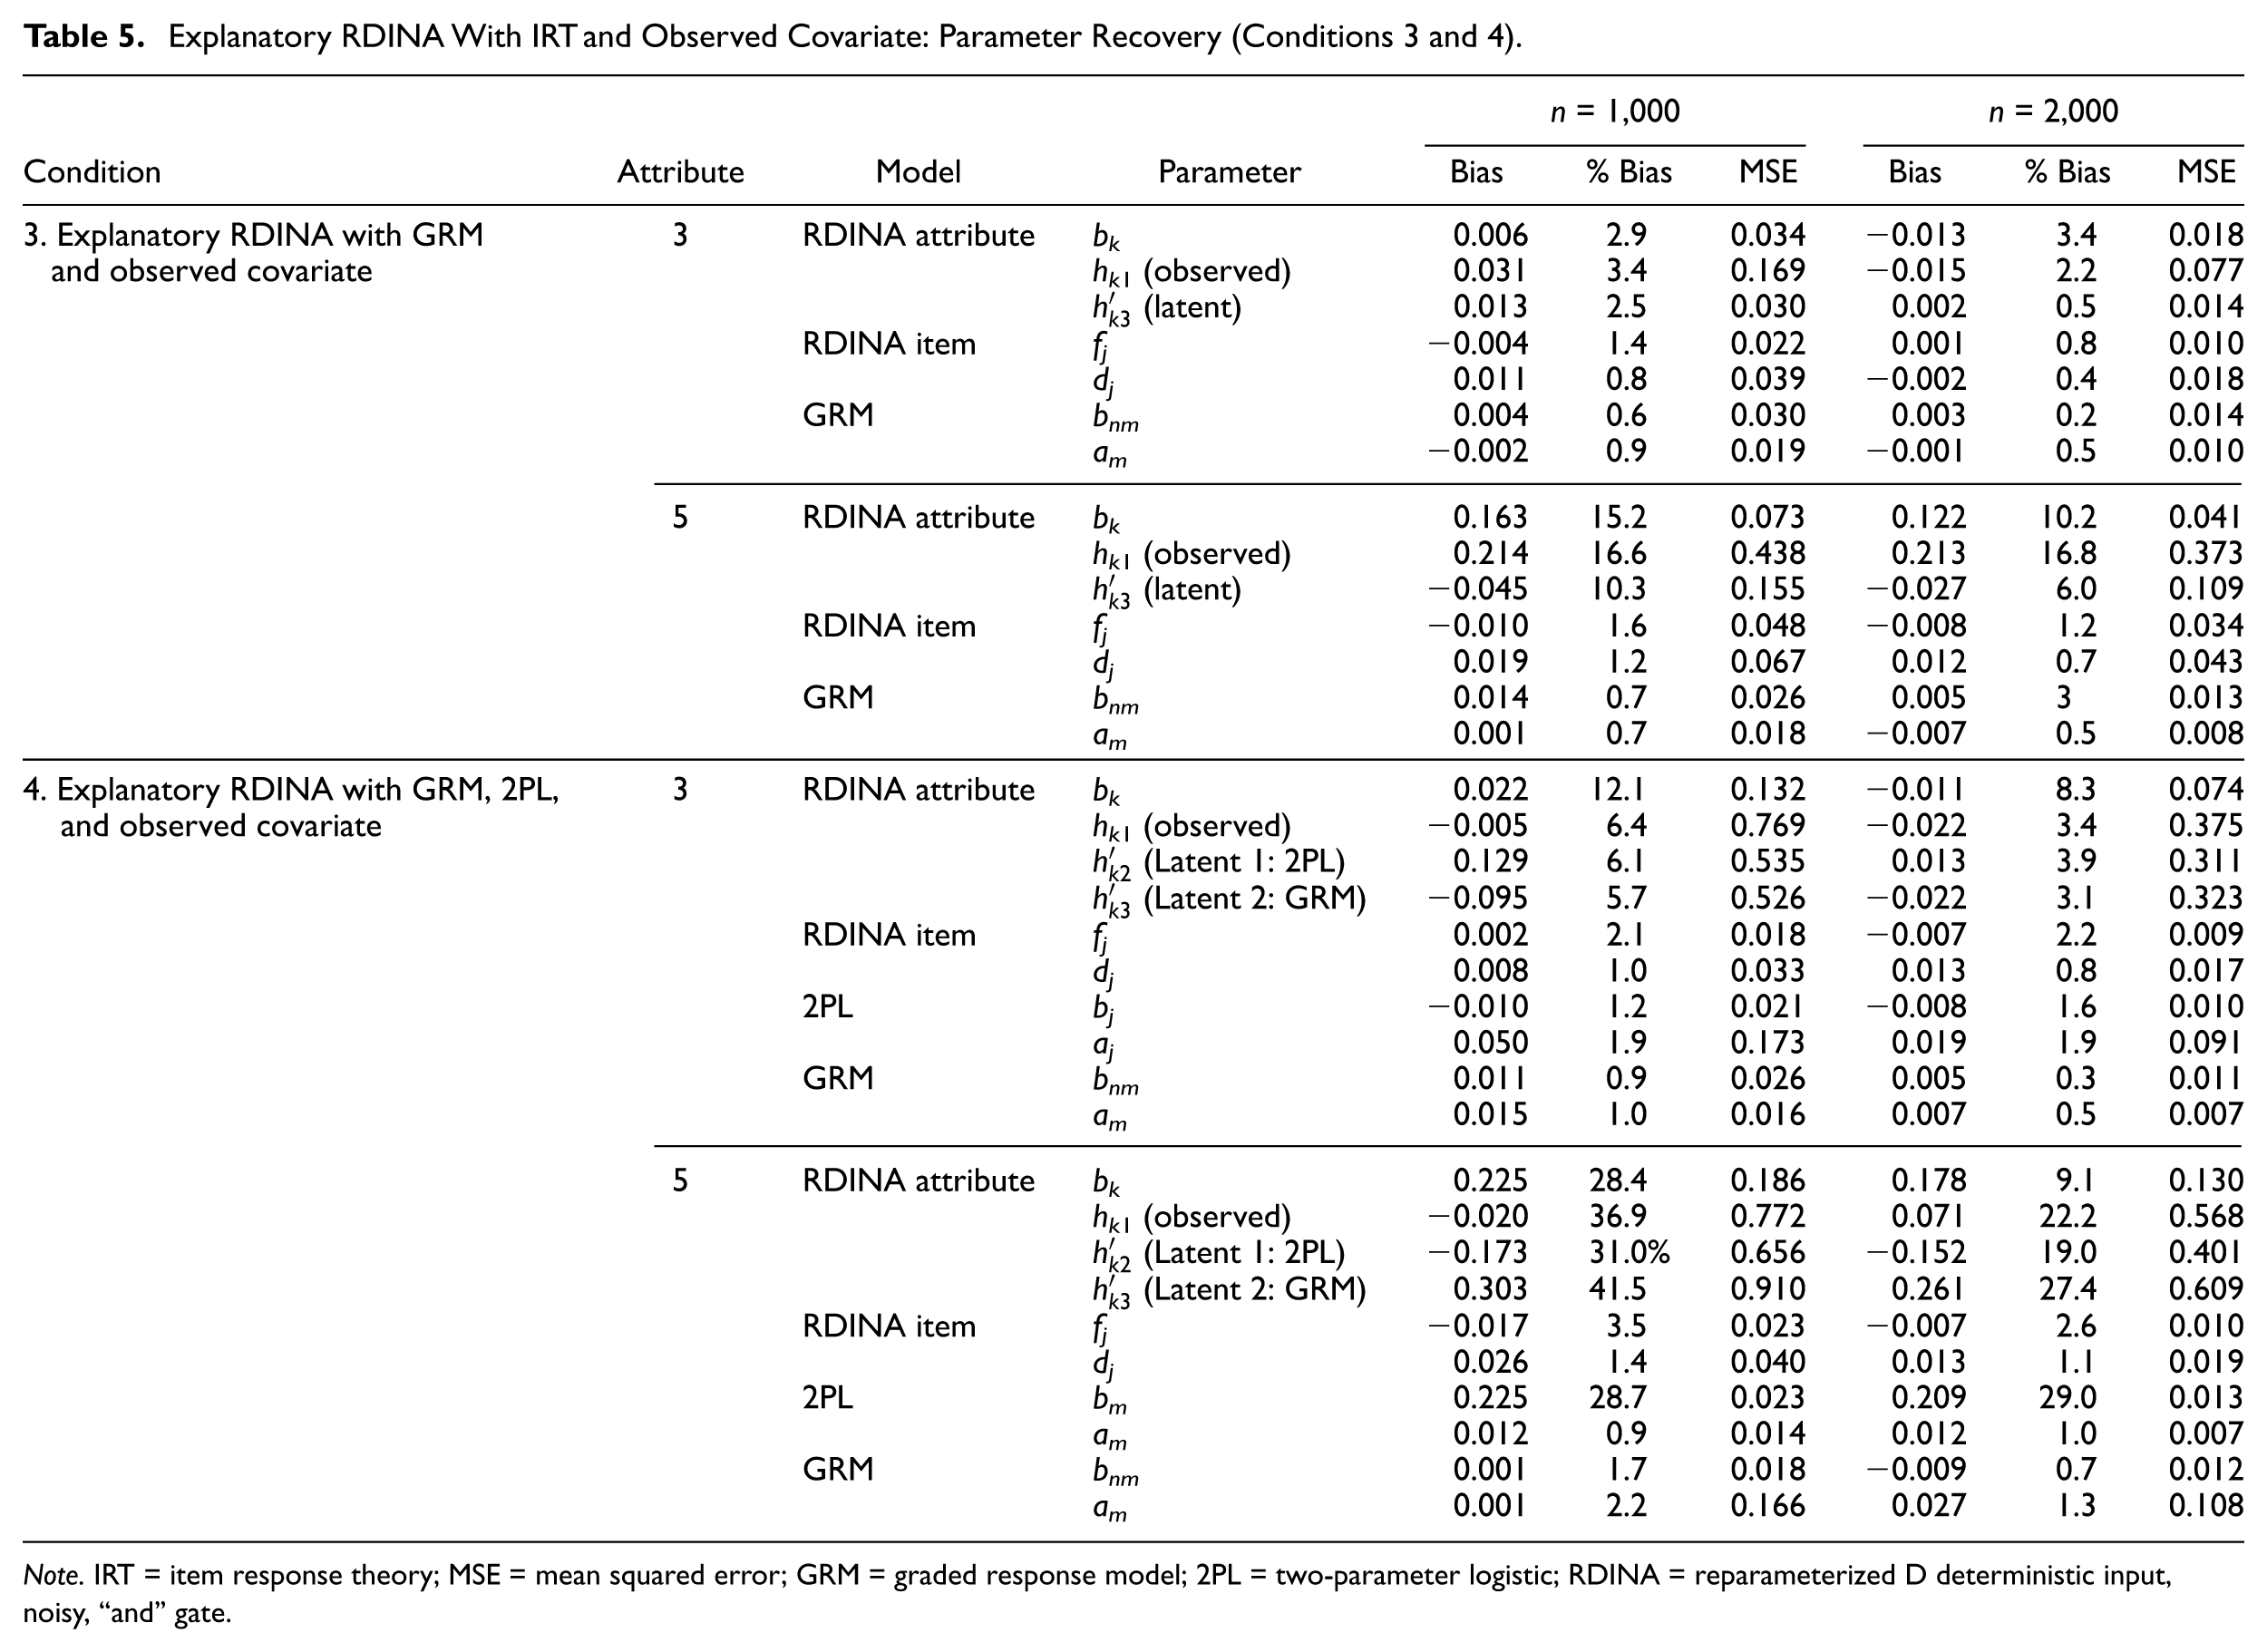
Note. IRT = item response theory; MSE = mean squared error; GRM = graded response model; 2PL = two-parameter logistic; RDINA = reparameterized D deterministic input, noisy, “and” gate.
Condition 4 (one observed covariate and two latent variables fit using GRM and 2PL)
In Condition 4, two latent variables were fit using GRM and 2PL, in addition to an observed dichotomous variable. The % Bias for RDINA item and GRM was less than 2.3%. For the three-attribute condition, the % Bias for 2PL parameters was also less than 2.0%. For the five-attribute condition, the % Bias for 2PL discrimination parameters was as large as 29.0%. For the three-attribute condition, the % Bias for attribute difficulty were 12.1% and 8.3% for the 1,000 and 2,000 sample size conditions, respectively. For the five-attribute condition, % Bias was 28.4% and 9.1%, respectively.
Moreover, for the three-attribute condition, the % Bias for the observed variable was 6.4%, whereas the % Bias for the latent variable estimated using GRM was 5.7% for the 1,000 sample size condition. This contrasts with the five-attribute condition, where % Bias was 36.9% for the observed variable, while the latent variables estimated with the 2PL and GRM were 31.0% and 41.5%, respectively, for the 1,000 sample size condition (see Table 5).
Condition 5 (covariate RDINA model using two continuous and one dichotomous observed covariates)
The parameter recovery for one dichotomous and two continuous observed predictors was fit using the covariate RDINA model (see Online Appendix Table A2). The largest % Bias in the three-attribute model was for the continuous covariate effect (hk3), which was 14.3%. RDINA item-level parameters had % Bias less than 1.6%. In the five-attribute model, the % Bias for the covariate effects ranged between 2.7% and 81.2%, and between 1.3% and 36.3% for sample sizes 1,000 and 2,000, respectively.
Classification and class sizes
Regardless of condition, number of attributes, and sample size, Pc was greater than .92 (see Online Appendix Table A3). When compared with a covariate-based model (Condition 5), Pc estimates were .94 for the three- and five-attribute conditions across samples, respectively. For latent class sizes, the % Bias was less than 1.5% across conditions, number of attributes, and sample sizes.
Summary of simulation results
Overall, parameter recovery was consistent across conditions, number of attributes, and sample sizes when single latent or observed predictor was specified (Conditions 1, 2, and 3). In particular, the recovery of IRT parameters was particularly notable, as % Bias was all less than 2.3%. Moreover, the RDINA item parameters had similar stability in recovery with % Bias less than 2.3%. The largest variability in estimation was at the attribute level, which could be due to predictors specified at this level. When only a single predictor was specified at the attribute level, the bias for attribute difficulty (bk) was modest. However, when multiple predictors were specified—particularly for multiple latent predictors (Condition 4)—bias increased substantially. This was found to be the case when more attributes were specified in the model, noting the larger bias in the five-attribute condition relative to the three-attribute condition. When comparing these results with a covariate RDINA with only observed predictors, the largest % Bias for the structural attribute parameters (h and
Discussion
Combining observed or latent predictors to CDMs to explain patterns in skill profiles addresses both methodological issues that advance explanatory models for latent classes and also facilitates answering important substantive questions for applied educational and psychological research. Many large-scale assessment data contain background variables. For example, prior research has shown that access to educational technology (e.g., computer and Internet access) is linked with improved computational ability of students in elementary and middle school mathematics and science performance (e.g., Chang & Kim, 2009; Tienken & Wilson, 2007). When applied researchers can identify specific skills (rather than broad domain scores) that are related to educational technology resources, such information can be meaningful for answering applied educational research questions; it can lead to resource allocation discussions and also contribute to underscoring factors that affect problem solving. As such, when explanatory variables can be linked with CDMs, they could inform instructional needs and identify whether certain educational resources may be effective.
Results from the real-world data analysis showed that student background variables from large-scale international testing data, such as TIMSS, could be used to link with a CDM. In this application, two sets of items (dichotomous and polytomous) were used as indicators of the latent construct, by fitting IRT models (2PL and GRM), and as such were simultaneously specified to predict attribute mastery. Findings indicated differences in effect sizes by attribute. Depending on the substantive nature of the explanatory variables and their relationship with the attributes, this information could be used to inform instruction and learning needs for students. Moreover, results varied when compared with a two-step approach (covariate model), where latent variables were first estimated, and then used to regress as covariates on the attributes. In this comparison, results showed that estimates from the two-step approach were different for some attributes, possibly due to attenuation from measurement error, signaling the value of simultaneously estimating latent predictors. Similar to findings from the SEM literature (e.g., Bedeian, Day, & Kelloway, 1997), the explanatory approach proposed in this study provides meaningful implications for simultaneously estimating latent factors within this framework.
The simulation study showed that IRT parameters were consistently recovered even with sample sizes of 1,000. While modest differences were found between the three- and five-attribute conditions, attribute-level estimates were stable. Additional attention may be given to the attribute difficulty parameter (intercept, bk) when multiple predictors are specified. Generally, results from the simulation study indicate that incorporating both latent and observed predictors at the attribute level of the RDINA did not affect estimation greatly. Classification was also consistent, regardless of conditions examined. However, based on findings when multiple latent variables are specified with multiple attributes (i.e., five attributes with two latent and one observed predictor), bias in estimates increased substantially, with mean attribute-level % Bias of 19.4% and 15.0% for even the 2,000 sample size condition. These results indicate a need to investigate the effect of multiple latent predictors when a large number of attributes are used in CDMs.
This study provides implications to expand CDMs to incorporate other measurement models that can be linked using a structural component, resembling SEMs. While the focus of this study was on the RDINA, extensions of this model would yield more flexible and generalized CDMs to allow specification of explanatory predictors. Other extensions to the covariate or explanatory frameworks can also be made. For example, using the von Davier (2010) multilevel diagnostic model, covariates or other explanatory factors can be specified at a higher level, which could be used to answer other substantive questions. Future studies may investigate these extensions to advance explanatory models for CDMs.
Footnotes
Declaration of Conflicting Interests
The author(s) declared no potential conflicts of interest with respect to the research, authorship, and/or publication of this article.
Funding
The author(s) received no financial support for the research, authorship, and/or publication of this article.
Supplemental Material
Supplementary material is available for this article online.
References
Supplementary Material
Please find the following supplemental material available below.
For Open Access articles published under a Creative Commons License, all supplemental material carries the same license as the article it is associated with.
For non-Open Access articles published, all supplemental material carries a non-exclusive license, and permission requests for re-use of supplemental material or any part of supplemental material shall be sent directly to the copyright owner as specified in the copyright notice associated with the article.