
Abstract
The hierarchical item response theory (H-IRT) model is very flexible and allows a general factor and subfactors within an overall structure of two or more levels. When an H-IRT model with a large number of dimensions is used for an adaptive test, the computational burden associated with interim scoring and selection of subsequent items is heavy. An alternative approach for any high-dimension adaptive test is to reduce dimensionality for interim scoring and item selection and then revert to full dimensionality for final score reporting, thereby significantly reducing the computational burden. This study compared the accuracy and efficiency of final scoring for multidimensional, local multidimensional, and unidimensional item selection and interim scoring methods, using both simulated and real item pools. The simulation study was conducted under 10 conditions (i.e., five test lengths and two H-IRT models) with a simulated sample of 10,000 students. The study with the real item pool was conducted using item parameters from an actual 45-item adaptive test with a simulated sample of 10,000 students. Results indicate that the theta estimations provided by the local multidimensional and unidimensional item selection and interim scoring methods were relatively as accurate as the theta estimation provided by the multidimensional item selection and interim scoring method, especially during the real item pool study. In addition, the multidimensional method required the longest computation time and the unidimensional method required the shortest computation time.
Introduction
The hierarchical item response theory (H-IRT) model (Rijmen, 2011; Yung, Thissen, & McLeod, 1999) is a confirmatory multidimensional IRT (MIRT) model for which items are structurally assigned with discrimination parameters equal to zero on some dimensions. Previous research on H-IRT computer adaptive tests (CATs; Gibbons, Weiss, Frank, & Kupfer, 2016; Gibbons et al., 2008; Seo & Weiss, 2015) considered only the best-known H-IRT model, the bifactor model (Gibbons & Hedeker, 1992; Kingston & McKinley, 1988; McKinley & Kingston, 1988). However, the H-IRT model allows for more complex data structures, which extends the bifactor model to include multiple levels that can be unbalanced (i.e., some items that load on the second-order factors may also load on third-order factors). A three-level unbalanced H-IRT model based on literature in reading motivation has been proposed by the authors (Kingston et al., 2017) for the Adaptive Reading Motivation Measure (ARMM). This model had one general factor (gen), two second-level factors (
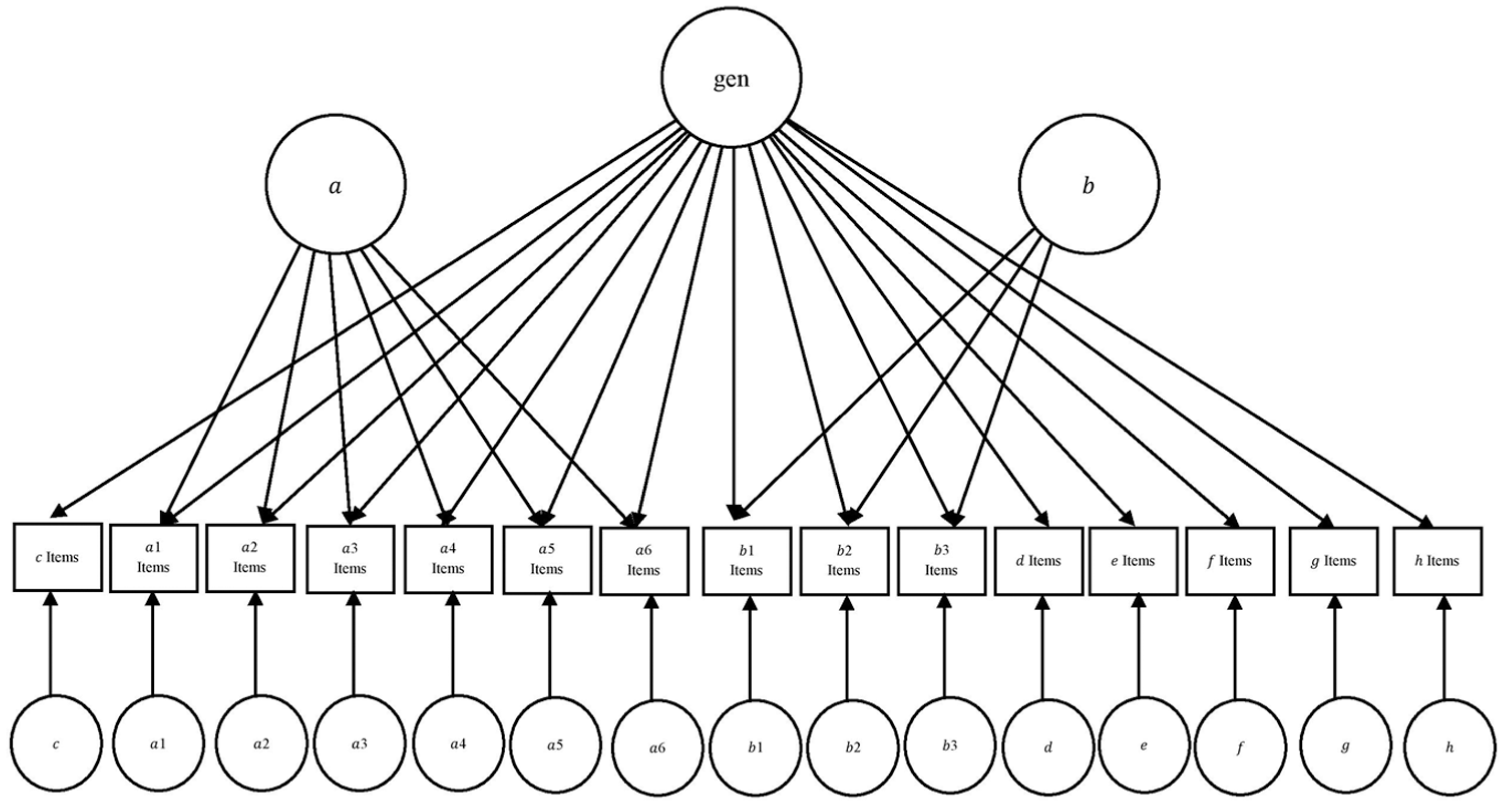
Path diagram of the Adaptive Reading Motivation Measure (ARMM) hierarchical item response theory (H-IRT) model.
This type of complex H-IRT model can have a large number of dimensions, for example, 18 in the case of the ARMM H-IRT. Moreover, the ARMM tests, the development of which is based on this three-level unbalanced H-IRT model, are administered online, using a CAT algorithm. When this model is used for CAT, the computational burden of item selection and interim scoring can be very heavy because of the large number of dimensions. The simplified item selection and interim scoring methods can help reduce the computational burden. Bifactor CAT research (Seo & Weiss, 2015; Weiss & Gibbons, 2007) proposed simplified item selection and interim scoring methods that include only a subset of dimensions during computation. However, the accuracy of final scoring may be affected by the items that were selected using simplified item selection and interim scoring methods. The trade-off between computational burden and final scoring accuracy has not previously been studied. Thus, this study compared different item selection and interim scoring methods of the unbalanced three-level H-IRT CAT with regard to those two criteria.
Hierarchical IRT Model
The ARMM items are 6-point Likert-type-scale items. Thus, the ARMM H-IRT graded response model (Rijmen, 2011; Samejima, 1969) for the probability of a student answering item j in or above score category t is

where the item discrimination parameter,
Item Selection and Interim Scoring
Item selection and interim scoring go hand in hand. After an item is selected and administered, the interim theta is updated. Once the interim theta is estimated, the updated theta is used for item selection. Thus, the theta dimensions involved in item selection affect the theta dimensions in interim scoring.
A common approach to item selection based on a MIRT model is to select the item that provides the most information about the vector of proficiency estimations. Fisher information is one frequently used measure of information (Gibbons et al., 2016; Gibbons et al., 2008; Huang, Chen, & Wang, 2012; Mulder & van der Linden, 2009; Segall, 1996, 2001; Seo & Weiss, 2015; W.-C. Wang & Chen, 2004); Kullback–Leibler (KL) information is another measure (Chang & Ying, 1996; Veldkamp & van der Linden, 2002; C. Wang, Chang, & Boughton, 2011). In addition, two simplified KL information indices have been suggested by C. Wang et al. (2011) because of the computational intensity of KL information (C. Wang et al., 2011). KL information and Fisher information are related: The Fisher information matrix for a theta vector is equal to the second partial-derivative matrix of KL information at the same true theta vector (C. Wang et al., 2011). Another MIRT-model CAT item selection method is to select the items with the minimum error variance of proficiency-level estimations, based on the Fisher information function (van der Linden, 1999; Yao, Pommerich, & Segall, 2014). Traditionally, the thetas of all dimensions are considered in calculating one of these types of information.
Multidimensional Item Selection and Interim Scoring
The multidimensional item selection method used in this study selects the items that maximize the determinant of the Fisher information matrix in Equation 2:

There are S– 1 items administered, and one of the remaining items, j, is selected from the item pool.
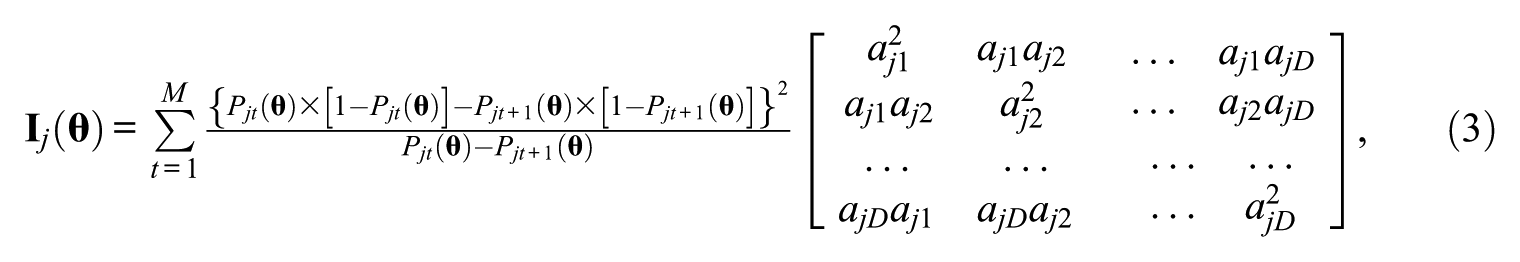
where M is the number of score categories and D is the number of dimensions included in calculation. For the multidimensional method, D is equal to the number of H-IRT model dimensions, which includes all theta dimensions.
To achieve content balance, the multidimensional method selects the same number of items for each loading pattern by cycling through different groups of item pools. The cycling order of groups was predetermined by an arbitrary dimension sequence established by the content-structure index for both simulation and real item pool studies of this article. The content-structure index for the real item pool of this article is provided by the content experts. Using ARMM as an example, this method first selects one item measuring
The multidimensional interim scoring method in this study uses the Bayesian method to estimate the thetas of all dimensions (Segall, 1996; Seo, 2011; van der Linden, 1999; Veldkamp & van der Linden, 2002). When tests are short and the number of dimensions is high, Bayesian estimation methods that are implemented with a reasonable prior distribution provide estimations that converge faster and are more accurate than the maximum likelihood estimation (Segall, 1996; van der Linden, 1999; Veldkamp & van der Linden, 2002). The Bayesian estimation finds the theta vector that maximizes the posterior density function,

The prior distribution,
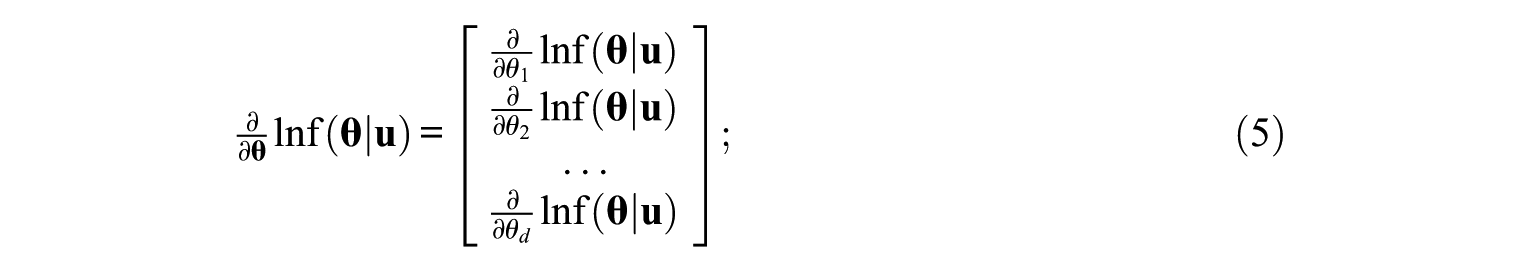
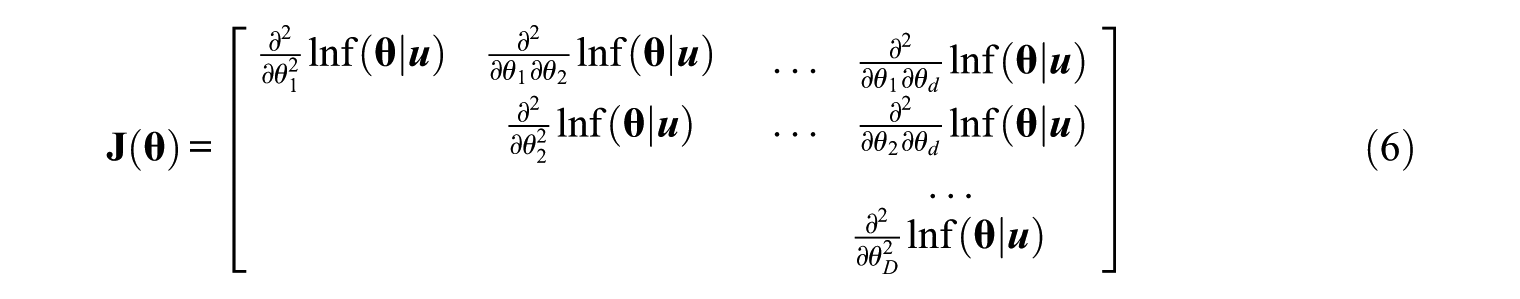
The Newton–Raphson algorithm, as in Equation 7, is applied until the difference between the previous and current theta solutions,

As the prior distribution function is applied to the likelihood function for Bayesian estimation, the information matrix can also include prior distribution to gain more information in a Bayesian framework. The posterior information matrix,

Simplified Item Selection and Interim Scoring
Using a general MIRT model, Mulder and van der Linden (2009) compared the multidimensional item selection method with a simplified method that considered only some of the thetas, which they referred to as intentional thetas. The results indicated the multidimensional method leads to more accurate estimations. As the general MIRT model does not differentiate dimensions, Mulder and van der Linden (2009) randomly chose intentional thetas in their simulation studies. However, for the H-IRT model, choosing intentional thetas is usually model based; for example, a general- or a sub-level theta can be the intentional theta. Randomly choosing intentional thetas for an H-IRT model might not be practical. C. Wang (2014) also compared the multidimensional item selection method with the simplified method, which considers only one theta dimension at a time and found that the multidimensional method leads to more precise results. For the simplified method, only the intentional theta was updated during interim scoring. However, the IRT model used in C. Wang’s (2014) study is a higher order IRT model, and the higher order dimension does not directly govern the item responses. Weiss and Gibbons (2007) proposed a simplified item selection method when using the bifactor model. In this method, item selection is based on the theta of one dimension at a time. They first focused on the general-factor theta, selecting items that can provide maximum Fisher information for this theta; only the general-factor theta was estimated during interim scoring. After the precision criterion of the general-level theta estimation was reached, the previously selected items were used to calculate the initial estimation of theta for the first second-level dimension. This procedure was repeated for all other second-level thetas. After 615 items were administered, the results of their simulation study showed that this simplified item selection and interim scoring method can provide accurate estimations for both general- and second-level thetas, although it is not realistic for students to take a 615-item test. Seo (2011) compared this simplified method with the multidimensional method, using Fisher information during the application of a bifactor model to CAT when the number of items administered was fixed for both item selection methods. Comparison results indicated similar accuracy of the general-level theta estimation between the two methods. However, items selected by the multidimensional method provided a more accurate estimations of the second-level thetas. Seo and Weiss (2015) compared another simplified item selection method with the multidimensional method for bifactor-model CATs under a fixed-length condition. This simplified method considered only the general factor and selected items that maximized the information of the general factor only. Results indicated this simplified method improved proficiency estimations on the general factor, but not on the second-level factors, when compared with the multidimensional method. It is not clear whether similar results would occur with the more complex H-IRT model, such as an unbalanced three-level H-IRT. Moreover, those studies did not compare methods on their computation efficiency. Therefore, this study compares the multidimensional method with two simplified item selection and interim scoring methods—unidimensional and local dimensional methods—on the accuracy and efficiency of final scoring.
Unidimensional item selection and interim scoring
The unidimensional item selection and interim scoring method in this study is very similar to the one used by Weiss and Gibbons (2007). Like the multidimensional method, this method selects items by cycling through loading patterns according to the predetermined order. Only the lowest level dimension theta with nonzero loading (e.g., a1 dimension or c dimension, as shown in Figure 1) is used in item selection and is updated in interim scoring because one item loads only on one lowest dimension and all dimensions are independent. The lowest level dimension is chosen in case different items load on different dimension levels. As only one theta dimension is considered, the IRT model in Equation 1 is treated as a unidimensional model, and the information function in Equation 3 is not a matrix but a value, as shown in Equation 9:

where dimension d is the lowest level dimension with nonzero loading for the current loading pattern. The item that maximizes Equation 9 in the item pool with the current loading pattern is selected.
Only

where dimension d is the lowest level dimension with nonzero loading for the current loading pattern and
Local multidimensional item selection and interim scoring
The second simplified method has characteristics of both the unidimensional and multidimensional approaches, called local multidimensional item selection and interim scoring in this study. This method has not been studied in other research. As in the multidimensional and unidimensional methods, the first step is cycling through loading patterns according to the predetermined order. Instead of using only the lowest level dimension theta with nonzero loading, though, this method uses thetas of all the dimensions with nonzero loadings, including a first-level dimension, a second-level dimension, and perhaps a third-level dimension. For example, the thetas of the gen and
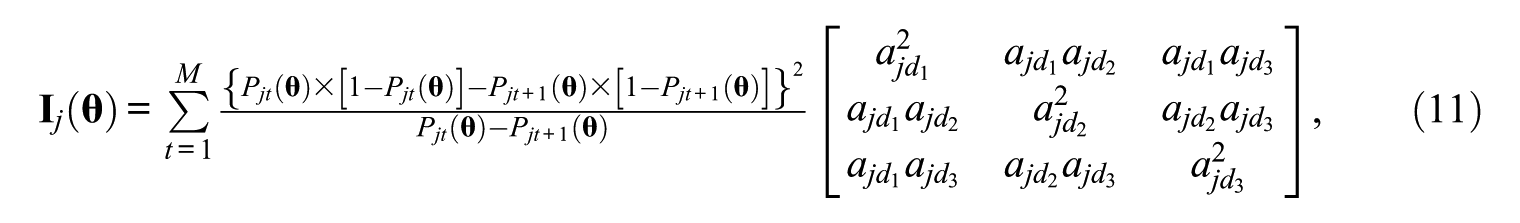
where dimension d1 is the general-level dimension, dimension d2 is the second-level dimension, and dimension d3 is the third-level dimension, if there is a nonzero third-level dimension for the current loading pattern. The item, in the item pool with the current loading pattern, that maximizes the determinant of the Fisher information matrix of Equation 2 is selected. The
Only the thetas of three dimensions in Equation 11 are estimated after administering this item because only the thetas of these three dimensions are used for selection of items with the current loading pattern. The same Bayesian method is used for scoring, but the Jacobian and Hessian matrices have fewer dimensions, as shown in Equations 12 and 13:

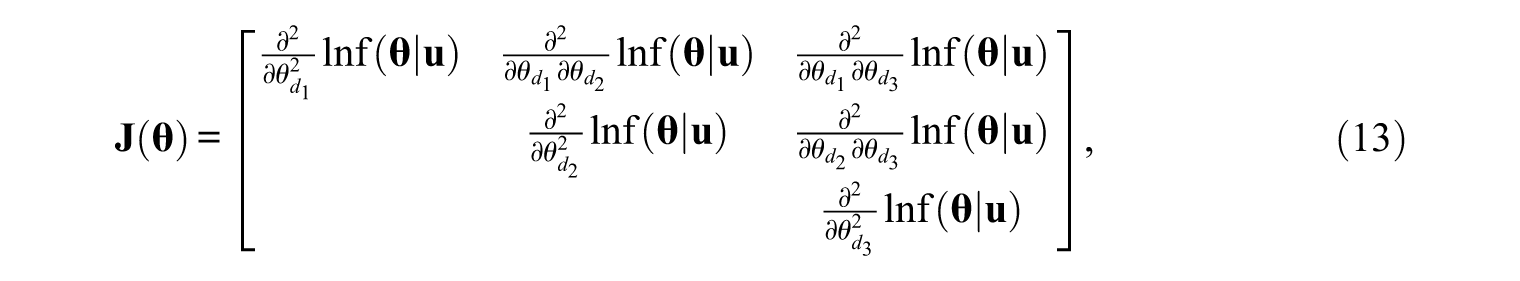
where these three dimensions are the same dimensions in Equation 11. For the posterior density function,
The intent of this study is to compare three item selection and interim scoring methods on the accuracy and efficiency of theta estimations using both a simulated item pool and a real ARMM item pool. The three item selection and interim scoring methods used are multidimensional, local multidimensional, and unidimensional. These three methods differ only on item selection and interim scoring. When the desired test length is reached, the final scoring procedures for these three methods are the same. In final scoring, all dimensions were estimated based on all item responses for all three methods.
Design of Simulation Study
Simulation H-IRT Models
This simulation study used two unbalanced H-IRT models. The first model was the simplest: five dimensions comprising one general-level dimension, two second-level dimensions, and two three-level dimensions. Items were grouped into three groups based on their loading patterns. In the first group of items, nonzero discrimination parameters were loaded on the general-level factor and on one of the two second-level factors. In the second and third groups of items, a nonzero discrimination parameter was loaded on the general-level factor, on the other second-level factor, and on one of the third-level factors. The second H-IRT model was more complex, composed of 13 dimensions: one general-level dimension, six second-level dimensions, and six third-level dimensions. Items were organized into nine groups based on their loading patterns. The first three groups of items had nonzero discrimination parameters loaded on the general-level factor and on one of the two second-level factors. The rest of the six groups of items had a nonzero discrimination parameter loaded on the general-level factor, on one of the second-level factors, and on one of the third-level factors.
Item Pools
Two sets of item pools were simulated, one for each H-IRT model, with each pool comprising 270 items. The ratio of item pool size to the longest test length in this study (270:90) was very similar to the ARMM’s ratio. The design of the item pool represents the best scenario in real testing: an equal number of items in the item pool for each loading pattern, meaning each loading pattern had the same number of items to select from. Therefore, in the item pool for the simple model, 90 items were generated for each of three loading patterns. In the complex-model item pool, 30 items were generated for each of nine loading patterns. For all items, the nonzero discrimination parameters for each dimension were drawn randomly and independently from the log-normal distribution (M = 0, SD = 0.4). The item difficulty parameter was drawn randomly and independently from a standard normal distribution (M = 0, SD = 1.0). Thus, all items had only two score categories.
Generating Data
After an item was selected, Monte Carlo simulation generated a response using the H-IRT model from Equation 1. Two groups of 10,000 theta vectors were randomly generated from the multivariate normal distribution, N(
Simulation Conditions
For each item selection and interim scoring method, simulation conditions varied by test length and H-IRT model. Ten conditions were studied using five test lengths (i.e., 18, 36, 54, 72, and 90 items) and two H-IRT models. Using test length as one of the simulation conditions provides evidence about whether the number of items affects the accuracy of the three item selection and interim scoring methods. All these test lengths also ensured that equal numbers of items could be administered to each loading pattern for two H-IRT models. Therefore, for the simple H-IRT model, one third of the test items were administered for each of the three loading patterns. For the complex H-IRT model, one ninth of the test items were administered for each of the nine loading patterns. These two H-IRT models included a model with a small number of theta dimensions and a model with a large number of theta dimensions. The difference in number of theta dimensions may affect the efficiency of the three item selection and interim scoring methods. Table 1 summarizes the simulation design.
Simulation Condition Information.
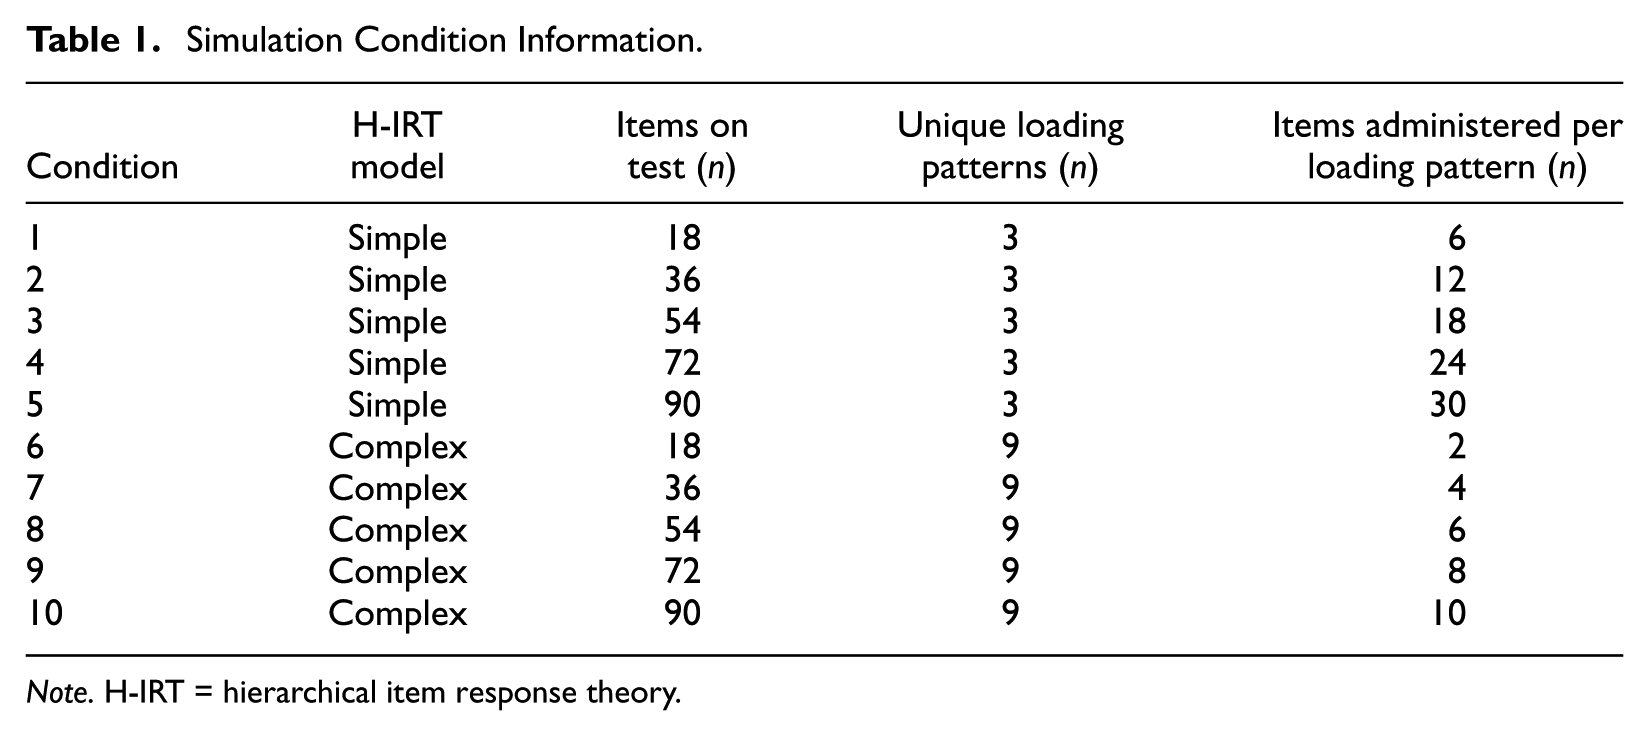
Note. H-IRT = hierarchical item response theory.
For each of the 10 conditions within each of the three item selection and interim scoring methods, the initial value of each element of the theta vector was set to 0. Next, the appropriate item selection method was used to select one item for one loading pattern. After a new item was administered for each loading pattern, the corresponding interim scoring method was applied. The same procedure was repeated until the test-length criterion was reached. After the simulated administration was completed, the final theta of all dimensions was estimated, based on all item responses and using the Bayesian method introduced above.
Evaluation Criteria
Two criteria were used to compare the accuracy of final scoring of different item selection and interim scoring methods under the 10 different conditions: the Pearson correlation between the true and estimated thetas of each dimension and the root mean square error (RMSE) of the estimation of each dimension. The Pearson correlation, r(

where K is the number of true theta vectors (10,000 in this study). The RMSEs were calculated for each method and condition, and the criteria of different dimensions within each loading level were averaged arithmetically for that loading level of theta dimensions. The correlation average was achieved through Fisher’s z transformation. Thus for every condition, two criteria were reported for four loading levels of theta dimensions: the general level (e.g., gen theta), the second level with the third level loaded (e.g., a theta), the second level without the third level loaded (e.g., c theta), and the third level (e.g., a1 theta).
We used computation time to compare the efficiency of different item selection and interim scoring methods under the 10 different conditions. The simulation study program was written in Microsoft Visual Studio 2010, Version 10.0.40219.1, using Fortran and executed on a computer with an Intel Xeon 2.4 GHz Processor and 12 gigabytes of RAM. The computation times of one student finishing one test and 10,000 students finishing tests were reported for each method and condition.
Design of Real Item Pool Study
H-IRT Model and Item Pool
The real item pool study used the ARMM’s three-level unbalanced H-IRT model with 18 dimensions. The ARMM’s adaptive test item pool is used in this study. This item pool included 12 items for each loading pattern, except for items measuring b2 factor, as shown in Figure 1. Of the 174 total items in the pool, only six items measured b2 factor, and there were six score categories for all items. There were 174 first-level item discrimination parameters (M = 1.61, SD = 0.88), 174 second-level item discrimination parameters (M = 1.61, SD = 0.89), 102 third-level item discrimination parameters (M = 1.28, SD = 0.71), and 870 item difficulty parameters (M = 0.03, SD = 2.71).
Generating Data and Result Evaluation
After an item was selected, Monte Carlo simulation generated a response using the H-IRT model from Equation 1. There were 10,000 theta vectors with 18 dimensions randomly generated from the multivariate normal distribution, N(
For each of the three item selection and interim scoring methods, the initial values of each element of the theta vector were set to 0. Next, the appropriate item selection method was used to select one item for one loading pattern. After a new item was administered for each loading pattern, the corresponding interim scoring method was applied. The same procedure was repeated until the test-length criterion was reached. After the simulated administration was completed, the final theta of all dimensions was estimated, based on all item responses and using the Bayesian method introduced above.
The results of the real item pool study were evaluated using the same evaluation criteria from the simulation study. The accuracy and efficiency of three different item selection and interim scoring methods were compared when the ARMM item pool was used.
Results
Results include a comparison of unidimensional, local multidimensional, and multidimensional item selection and interim scoring methods on two criteria of the final scoring accuracy and one criterion of efficiency, for both studies. These criteria include the correlation between true and estimated thetas, RMSEs, and computation time.
Results of Simulation Study
Figure 2 presents the correlations between the true and estimated thetas of four loading levels for each method and condition. For each model and item selection and interim scoring method, the correlations between true and estimated thetas of all loading levels increased as test length increased. The increase rate slowed, however, with longer tests. Comparing methods, the local multidimensional method had high correlations on the general and second loading levels. The unidimensional method had high correlations on the second level without the third level loaded and on the third loading level. The multidimensional method had relatively high correlations across four loading levels. The correlation differences among the methods were very large for the shortest test but became smaller as test length increased. For the 90-item test, the methods had similar, high correlations for all loading levels. When comparing the correlations of the same test length but different H-IRT models, the correlation of the simple model was higher.
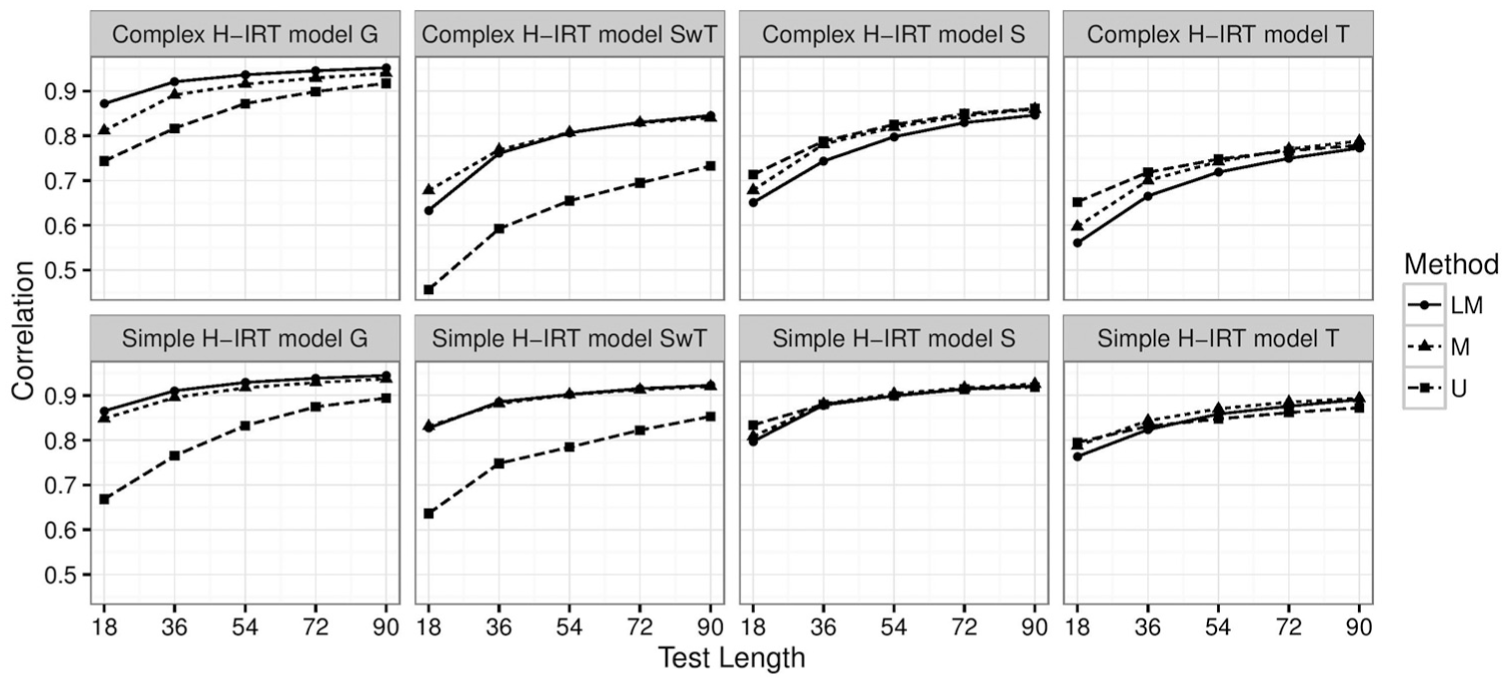
Correlations by H-IRT model, theta-loading level, and test length.
Figure 3 presents the RMSEs of four loading levels for each method and condition. For each model and item selection and interim scoring method, RMSEs of all loading levels decreased as test length increased. However, the decrease rate slowed as test length increased. Comparing methods, the local multidimensional methods had low RMSEs on the general and second loading levels. The unidimensional method had low RMSEs on the second level without the third level loaded and on the third loading level. The multidimensional method had relatively low RMSEs across four loading levels. There were differences among the methods for the shortest test, but the differences became smaller as test length increased. For the longest test, the methods had similar, low RMSEs on all loading levels. When comparing RMSEs of the same test length but different H-IRT models, the RMSEs of the simple model were lower.
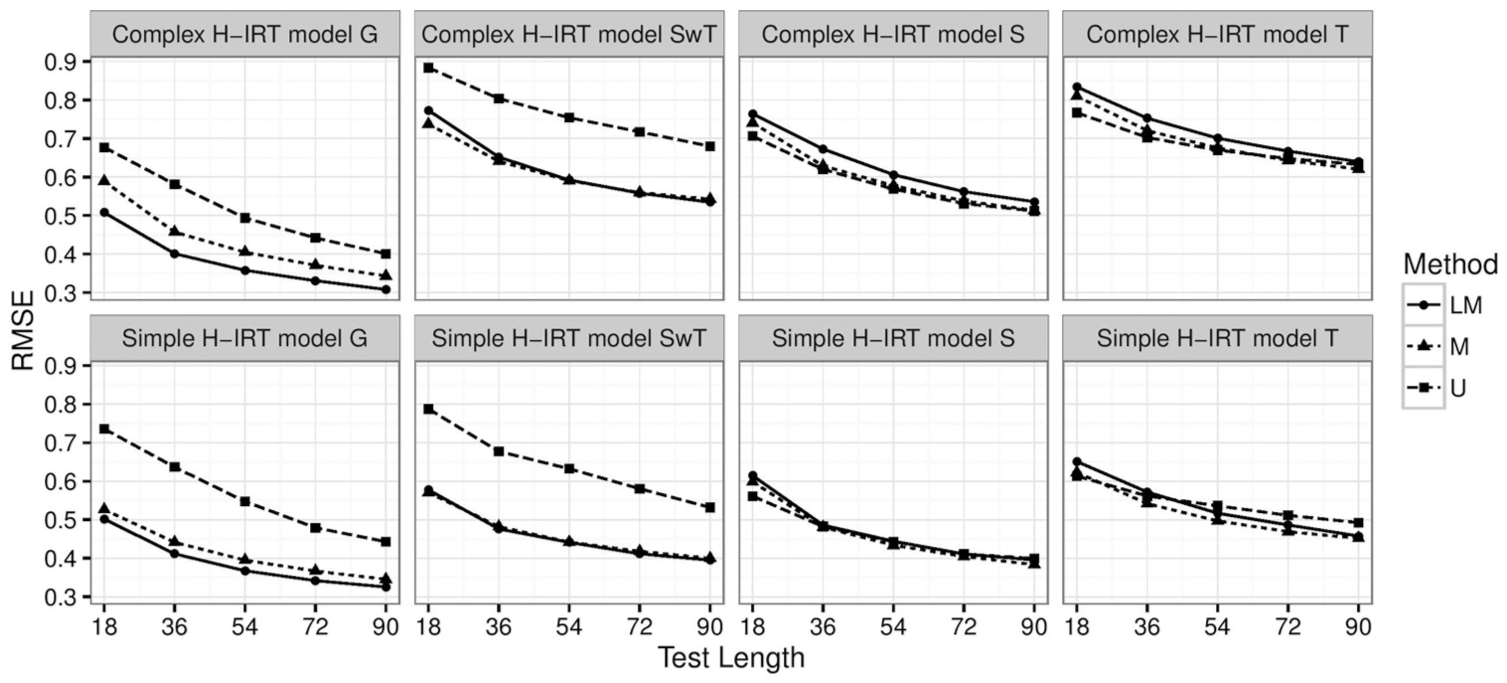
RMSEs by H-IRT model, theta-loading level, and test length.
Table 2 presents the computation times in seconds of a single test and 10,000 tests, respectively, for all three methods under 10 simulation conditions. For a single test, in general, the computation time for each model and item selection and interim scoring method increased as test length increased. The three methods required similar computation time for the simple model, but the multidimensional method required longer computation time for the complex model. For 10,000 tests, the computation time for each model and item selection and interim scoring method increased as test length increased. Comparing methods, the multidimensional method required the longest computation time and the unidimensional method required the shortest computation time. For the simple model, the multidimensional method required more than 6 times the computation time of the unidimensional method. For the complex model, the computation time of the multidimensional method was 20 times longer than that of the unidimensional method. When comparing computation times for the same test length but different H-IRT models, the computation time of the simple model was shorter.
Computation Time, in Seconds, of Three Methods for 10 Conditions.
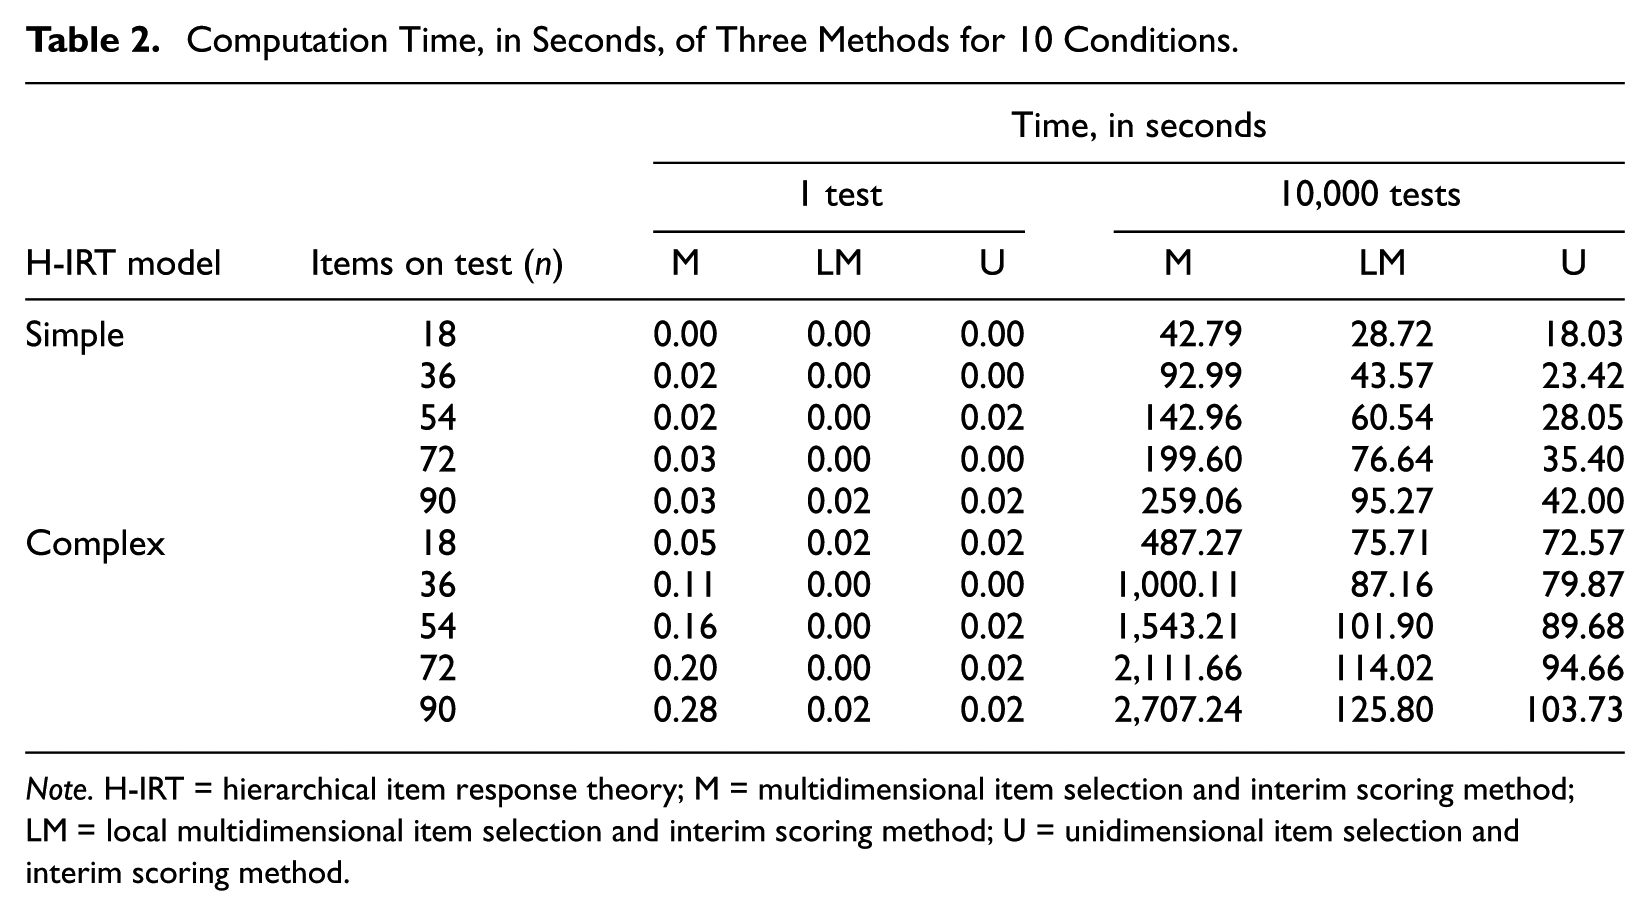
Note. H-IRT = hierarchical item response theory; M = multidimensional item selection and interim scoring method; LM = local multidimensional item selection and interim scoring method; U = unidimensional item selection and interim scoring method.
Results of Real Item Pool Study
Table 3 presents the correlations and RMSEs of four loading levels, as well as the computation times in seconds of a single test and 10,000 tests for the real item pool study. For the accuracy comparison criteria, the results of the real item pool study showed a slightly different pattern than did the results of the simulation study. The unidimensional method provided more accurate estimations on the general and second loading levels. The multidimensional method provided more accurate estimations on the second level without the third level loaded and on the third loading level. The local multidimensional method provided relatively accurate estimations across four loading levels. In general, the differences in accuracy comparison criteria among methods were very small. However, these accuracy results were not as accurate as the simulation study values, especially for the third loading level. We believe this is because the lower level item discrimination parameters of the real item pool were small. For the efficiency comparison criterion, the results of the real item pool study showed the same pattern as the simulation study results in that the computation time for multidimensional method was much longer than for the unidimensional or local multidimensional method. For 10,000 tests, the multidimensional method required about 15 times the computation time of the unidimensional or local multidimensional method.
Theta Estimation Accuracy and Computation Time, in Seconds, of Three Methods Used in Real Item Pool Study.
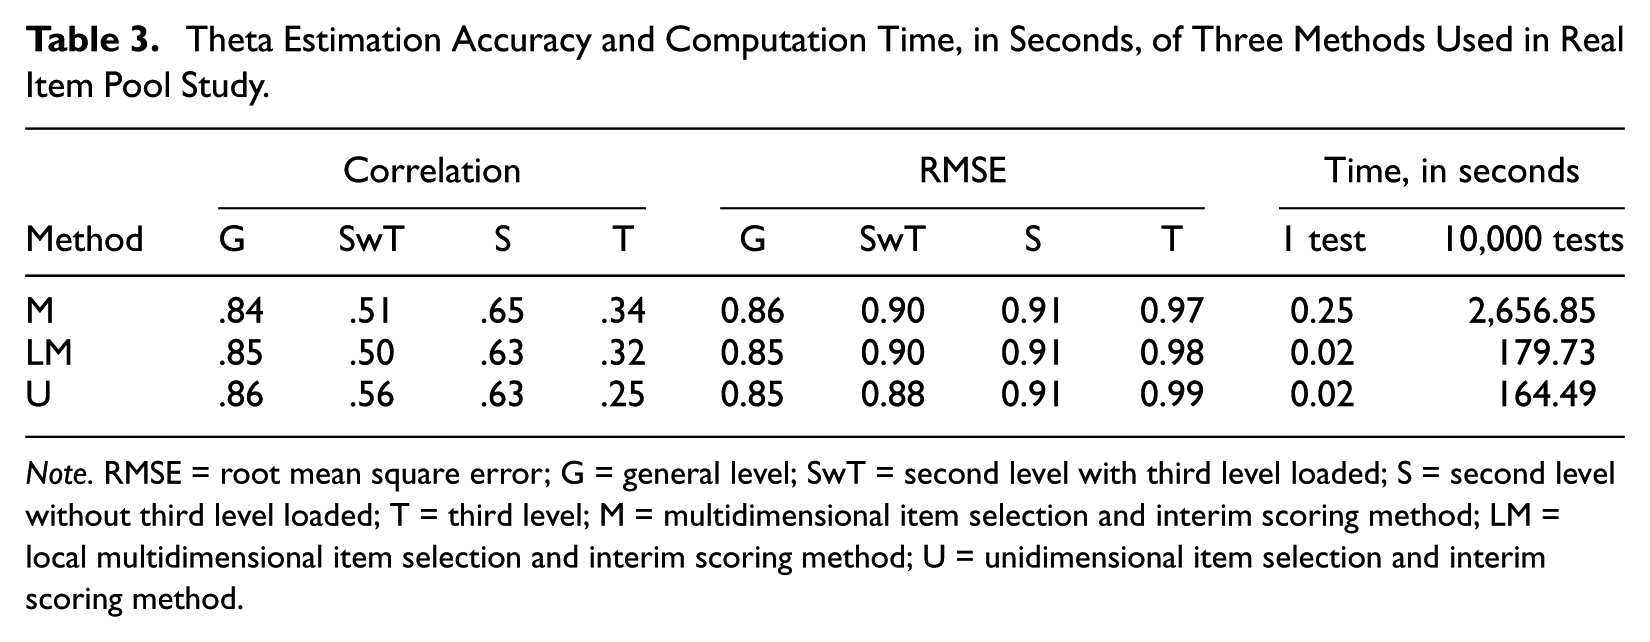
Note. RMSE = root mean square error; G = general level; SwT = second level with third level loaded; S = second level without third level loaded; T = third level; M = multidimensional item selection and interim scoring method; LM = local multidimensional item selection and interim scoring method; U = unidimensional item selection and interim scoring method.
Discussion
The aims of this study were to compare theta estimation accuracy and efficiency of three item selection and interim scoring methods of the three-level unbalanced H-IRT model CATs, using both simulated and real item pools. For the simulation study, accuracy comparison of theta estimation indicates the local multidimensional method provides a more accurate estimation on general-level thetas and the unidimensional method provided a more accurate estimation on sublevel thetas. The multidimensional method provided similarly accurate estimations across all theta levels. Theta estimation accuracy results of the real item pool showed a slightly different pattern, but differences among methods were very small. For the efficiency criteria, the computation time comparison of both studies indicates the unidimensional method required the shortest time, while the multidimensional method required the longest time. Thus, when a CAT is very short, the best method depends on the purpose of the test and the computation capability of the system. If an accurate sublevel theta estimation and a low computational burden are desired, the unidimensional method should be used. If an accurate general-level theta estimation is preferred and a medium computational burden is not a concern, the local multidimensional method should be used. If an accurate theta estimation of all levels is desired and a long computation time is not a concern, the multidimensional method should be used. When a CAT is long, the best method depends only on the computational capability of the system because all three methods lead to similarly accurate theta estimations.
The simulation study also sheds light on the determination of test length based on the H-IRT model. Generally, long tests provide accurate theta estimations, regardless of method. When considering the efficiency of the CAT, a medium-length test appears to be sufficient for the simulated item pool designed for this study. Condition 2 in the simulation study provided accurate estimations for the simple H-IRT model using 36 items. Condition 8 in the simulation study provided accurate estimations for the complex model using 54 items. Although only a few items were administered for the estimation of each sublevel theta of the two test lengths, results indicate these items can provide accurate theta estimation.
Moreover, different from other simplified methods (Seo, 2011; Seo & Weiss, 2015; Weiss & Gibbons, 2007), the unidimensional method in this study used only the lowest level dimension during item selection and interim scoring, instead of the general dimension only or the general dimension first and then the other dimensions. The lowest level dimension was chosen to maximize accuracy for the lower level dimensions, as they have fewer number of items taken by each student. The results do indicate that the unidimensional method provided more accurate estimation on the lowest level dimension. However, this method leads to less information on the higher level dimensions, which is not surprising as those dimensions were not used for item selection. However, when the tests are long (as in the simulation study) or the item discrimination parameters for higher level dimensions are large (as in the real item pool study), the unidimensional method can provide as accurate a higher level dimension theta estimation as the other two methods.
H-IRT CAT has not been well studied; thus, this study provides important guidance for any testing program using this method. This study also suggests a new, simplified item selection and interim scoring method: the local multidimensional method. Each item selection and interim scoring method we studied can meet different goals of an H-IRT CAT testing program, such as accurate general-level theta estimation, accurate sublevel theta estimation, or low computational burden. The unidimensional or local unidimensional method provides a solution for testing programs that would likely use high-dimension H-IRT CATs but require short algorithm running time. Moreover, while other item selection methods (Cheng & Chang, 2009; van der Linden, 2000) are feasible, all methods in this study also can resolve content-balance issues because the CAT procedure alternates item selection by cycling through the content specifications, resulting in the administration of an equal number of items for each loading pattern. Furthermore, the evaluation criteria in this study can be used in future research for choosing item selection and interim scoring methods and test lengths for H-IRT CATs.
Suggestions for Future Study
Several questions require further investigation. First, additional multidimensional information calculation methods can be considered, such as the KL method; this study used only the Fisher method. Chang (2015), however, stated that Fisher information is based on local information and has limitations. Second, the distribution used to generate theta vectors was also used as the prior distribution for Bayesian theta estimation. The same distribution of the prior and true thetas can lead to spuriously accurate theta estimations. The true theta distribution is unknown, and the prior distribution used may be different from the true theta distribution in real testing situations. Thus, future studies could investigate the effect on theta estimation accuracy of different prior distribution. Third, results of the real item pool study have low accuracy on the third-level theta estimation because item discrimination parameters of this level are low. However, item discrimination parameters of different levels of the simulated item pool are very similar and lead to more accurate theta estimations on the third-level, which may be one reason the accuracy results of the two studies have different patterns. Thus, future studies could differentiate the item discrimination parameter distributions of different loading levels for simulated item pools. Fourth, future studies could compare different item exposure rate control methods for CATs based on H-IRT models. Fifth, the interim theta in this study was updated after each item was answered. For the item selection and interim scoring methods in which the general theta is updated after each item is administered, the general theta for item selection of the nth loading pattern will be more accurate than for item selection of the first loading pattern. More research is needed to determine whether these differences in general theta accuracy lead to the selection of different items. Finally, the item selection order of different dimensions in this study was determined by an arbitrary dimension sequence. Future research could investigate and compare different rules of determining the item selection dimension order, such as random selection of dimensions.
Footnotes
Acknowledgements
This research is based on one portion of this large Institution of Education Sciences (IES) supported project and would not have been possible without the work of the larger research team, including Michael Hock, Gail Tiemann, Marcia Davis, and Stephen Tonks. The authors would also like to thank the reviewers and the editor for their valuable input on the earlier version of this article.
Declaration of Conflicting Interests
The author(s) declared no potential conflicts of interest with respect to the research, authorship, and/or publication of this article.
Funding
The author(s) disclosed receipt of the following financial support for the research, authorship, and/or publication of this article: This research is based on work supported by the U.S. Department of Education’s Institute of Education Sciences (IES; PR/Award R305A110148), titled Development and Validation of Online Adaptive Reading Motivation Measures. Any opinions, findings, conclusions, or recommendations expressed in this material are those of the authors and do not necessarily reflect the views of the IES.