
Abstract
Theoretical models of trade show that information-based trading is a consequence of four fundamental determinants: heterogeneous prior beliefs, differential interpretations, the consensus effect, and the informedness effect. Although the effects of these determinants on trading volume are clear theoretically, there is no prior empirical evidence on the relation between the informedness effect and the volume of trade, nor is there any empirical evidence on the incremental effect of each of the four determinants on the volume of trade. This study provides empirical evidence to fill this void. Consistent with theoretical predictions in Holthausen and Verrecchia, we find a significantly positive relation between the informedness effect and trading volume reactions to quarterly earnings announcements. We also find that the proxies for each of the four fundamental determinants of trading volume—prior belief heterogeneity, differential interpretation, the consensus effect, and the informedness effect of quarterly earnings signals—play a significant incremental role in explaining trading volume, thereby corroborating the theoretical results of financial economists. An important implication of our results is that empirical models of trade should consider controlling for each of these determinants.
Keywords
Introduction
Theoretical models of trade (Dontoh & Ronen, 1993; Holthausen & Verrecchia, 1990; Karpoff, 1986; Kim & Verrecchia, 1997; Varian, 1989) show that information-based trading is a consequence of four fundamental determinants. First, heterogeneous prior beliefs, in which differences in investors’ prior beliefs cause them to take positions that must be unwound in light of new information. Second, individual investors’differential interpretation of new information may cause them to revise their prior beliefs differentially and motivate a re-shuffling of assets to new owners. Third, given heterogeneous prior beliefs, a given magnitude of differential interpretation of new information can result in a decrease or an increase in consensus, thereby inducing more or less trade (i.e., the consensus effect). Fourth, individual investors can be differentially more informed by a new information release and these differences can induce further trading, all else equal. Holthausen and Verrecchia (1990) characterize this as the informedness effect, defined as the degree to which individual investors become differentially more knowledgeable at the time of an information release.
The intuition underlying the informedness effect is that when interim information releases (such as a quarterly earnings announcement) corroborate with an individual’s existing private predisclosure information about possible future earnings realization, the more knowledgeable the individual becomes, the more likely he or she is to act on it (i.e., trade) due to the increased confidence in his or her information. The level of trading following the release of the interim signal is therefore a reflection of differences in how well informed or confident an individual investor becomes after observing the interim quarterly earnings signal. The idea is similar to the model in Dontoh, Ronen, and Sarath (2003). Although the various effects that induce trade are clear theoretically, there is no prior empirical evidence on the relation between the informedness effect and the volume of trade. Furthermore, there is no prior empirical evidence on the incremental effects of these four determinants because empiricists have tended to combine them, thereby masking their incremental effects on trading volume reactions to earnings news.
The purpose of this study is twofold. First, we provide empirical evidence on the relation between the informedness effect and the volume of trade. Second, we empirically investigate the incremental roles of each of the four determinants—heterogeneous prior beliefs, differential interpretation, the consensus effect, and the informedness effect—in explaining trading volume reaction to earnings news. If a subset of these determinants dominates and the others are empirically unimportant, that would suggest that trade occurs primarily due to the dominant determinants. However, evidence that all four determinants play significant incremental roles would empirically corroborate the theoretical literature and imply that empirical trading volume models should consider controlling for each of these determinants.
Our empirical investigation of trading volume reaction to earnings announcements also differs from many prior studies in one important respect: It considers quarterly earnings releases as interim signals that convey information about future annual earnings realization. Thus, our empirical constructs are more consistent with the theoretical models of rational Bayesian learning with incomplete information such as Dontoh and Ronen (1993) and Kim and Verrecchia (1997) upon which these constructs are based. 1
The empirical analysis we present is based on a sample of 25,957 quarterly earnings announcements by 1,995 firms between 1985 and 2008, inclusive. We define investors’ prior belief heterogeneity as the cross-sectional dispersion in investors’ beliefs about a firm’s prospects prior to the arrival of a new piece of information. 2 We use the dispersion in individual financial analysts’ forecasts of annual earnings per share (EPS) immediately before each sampled quarterly earnings announcement as our proxy for investors’ prior belief heterogeneity. We define differential interpretation as the differential belief revision across individual investors as a result of observing a new common public signal. Our proxy for the extent of differential interpretation of each quarterly earnings signal is the standard deviation of the revisions in the same individual analysts’ forecasts of annual EPS immediately after each announcement, deflated by the absolute value of the mean of the analysts’ annual EPS forecasts immediately before each quarterly announcement. We define the consensus effect as a measure of the extent to which investors’ beliefs converge or diverge as a result of an information release. Consensus increases when beliefs converge and decreases when they diverge. We use the posterior dispersion in the same analysts’ annual EPS forecasts immediately after each quarterly earnings announcement, relative to their belief dispersion indicated in their prior forecasts, as our proxy for the consensus effect. Finally, following Holthausen and Verrecchia (1990), we define the informedness effect as the degree to which individual investors become differentially more knowledgeable at the time of an information release. Prior to an information release such as a quarterly earnings announcement, what each individual investor knows about the forthcoming quarterly earnings number is reflected in his or her predisclosure quarterly earnings expectation. The announcement of the actual earnings number provides a realization of this figure. Each investor’s correction from his or her expectation to the actual realization is a direct measure of the individual investor’s increased informedness or the degree to which an individual investor becomes more knowledgeable, and this is reflected in the individual investor’s quarterly earnings forecast error (i.e., the difference between the actual quarterly earnings number and his or her expected quarterly earnings number). The informedness effect is a measure of the differences in the quarterly forecast errors across individual investors. It differs from the measure of unexpected earnings, which is the difference between actual realized earnings and the predisclosure aggregate market expectation (i.e., consensus forecast). Consistent with Holthausen and Verrecchia’s theoretical construct, our proxy for the informedness effect is the mean-squared error associated with individual analysts’ quarterly forecasts made just before each quarterly earnings announcement divided by the absolute value of the mean individual analysts’ quarterly EPS forecasts. Thus, the informedness effect proxy captures differences in individual investor’s forecast errors and the effect of these differences on trading volume beyond unexpected earnings. Also, our empirical proxies for heterogeneous prior beliefs, differential interpretation, and the consensus effect are closely linked to their theoretical constructs, intuitive, and well-behaved.
It is important to note that our empirical proxies for prior dispersion in beliefs, differential interpretations, and the consensus effect are related in the sense that these three constructs all reflect, in one way or the other, changes and differences in individual investors’ beliefs about the realization of future annual earnings following the release of interim quarterly earnings signals. Unlike the above constructs, the informedness effect construct is not about predicting the future annual earnings number, or for that matter, some other future quarterly earnings. Rather, it is all about differences in individual investors’ ability to predict the realization of the interim signal itself.
We find a significantly positive relation between the informedness effect and trading volume reactions to quarterly earnings announcements. The results also indicate that the proxies for all four determinants—prior belief heterogeneity, differential interpretation, the consensus effect, and the informedness effect of quarterly earnings signals—play a significant incremental role in explaining trading volume reactions. These results hold even after controlling for the (positively associated) magnitude of the price reactions to quarterly earnings signals, as well as the magnitude of quarterly earnings surprise. This empirical evidence corroborates the theoretical results of Dontoh and Ronen (1993), Holthausen and Verrecchia (1990), Karpoff (1986), Kim and Verrecchia (1997), and Varian (1989) that these four determinants are fundamental explanators of trading volume. As determinants of trading volume, they are also determinants of trading volume reactions to financial and accounting information.
This article makes a number of contributions. First, it is the first article to provide empirical evidence on the positive relation between the informedness effect and trading volume reactions to earnings announcements. Second, it shows that the effects of heterogeneous prior beliefs, differential interpretation, the consensus effect, and the informedness effect are distinct determinants of trading volume reactions to news events, thereby corroborating the theoretical models of financial economists. Third, it presents a reasonable proxy for the informedness effect. Finally, an important implication of the empirical results is that empirical models of trade should consider controlling for each of these determinants.
The rest of the article proceeds as follows: “Theory, Prior Studies, and Hypotheses” section discusses the theoretical underpinnings and prior studies motivating our expectations. “Research Methodology” section discusses research methodology issues relating to sample design, data collection, operational definition of variables, and model specification, whereas “Empirical Tests and Results” section presents empirical tests and results. We provide a summary and conclusions in “Summary and Conclusion” section.
Theory, Prior Studies, and Hypotheses
Theoretical Motivation
Theoretical models of trade suggest that information-based trading is a consequence of four fundamental determinants. First, differences in investors’ prior beliefs cause them to hold positions that must be unwound in the light of new information such as a quarterly earnings announcement. Second, investors may interpret new information differentially, thus revising their prior beliefs differentially and motivating a new round of trading to rebalance individual asset portfolios. Karpoff (1986) and Varian (1989) model the first distinct motive for trade—heterogeneous prior belief—and Karpoff (1986), Varian (1989), Dontoh and Ronen (1993), and Kim and Verrecchia (1997) model the second distinct motive for trade—differential interpretation. Holthausen and Verrecchia (1990) advance the consensus effect of information releases as a third distinct reason for trade. That is, ceteris paribus, trading volume decreases as consensus increases because of decreased diversity in investors’ beliefs about the value of the asset, and vice versa. Holthausen and Verrecchia also propose the informedness effect as the fourth distinct reason for trade. That is, ceteris paribus, the more knowledgeable individual investors become at the time of an information release, the more they trade due to increased confidence in their information.
The theoretical models of Karpoff (1986) and Varian (1989) are based on heterogeneous investors who periodically and idiosyncratically revise their beliefs. They define heterogeneous prior beliefs as when investors have diverse prior beliefs. They show that when investors’ prior beliefs are different, they hold different positions accordingly. As a result, the arrival of new public information (e.g., a quarterly earnings announcement) causes them to modify their prior positions, which induces trading. Consistent with this theoretical definition, we measure heterogeneous prior beliefs as the standard deviation across the individual analysts’ forecasts of annual EPS immediately before each quarterly earnings announcement, divided by the absolute value of the mean individual analysts’ prior annual EPS forecasts, denoted as PrD. Intuitively, we characterize PrD as the variance in the individual analysts’ prior beliefs, normalized by their average prior beliefs.
Theoretical models show that differential interpretation occurs when investors differ in how much they revise their beliefs in reaction to a public announcement. The differential belief revision is reflected in how much individual investor’s revisions deviate from the average. Thus, given investors’ prior beliefs, the theoretical measure of differential interpretation is an increasing function of the variance of investors’ belief revisions following the observation of a public signal. When all investors revise their beliefs by the same magnitude in the same direction such that there is no variation in their belief revision, they have identical interpretations and the measure of differential interpretation is, by definition, zero. Consistent with this theoretical definition, we measure differential interpretation as the standard deviation of the revision in the same individual analysts’ annual EPS forecasts from immediately before to immediately after each quarterly earnings announcement (SDrev), divided by the absolute value of the mean individual analysts’ prior annual EPS forecasts, denoted as DI. Intuitively, we characterize DI as the variance in the individual analysts’ belief revision, normalized by their average prior beliefs. When analysts interpret information identically, there is no incremental trading beyond that caused by prior belief heterogeneity. However, when they interpret new information (e.g., quarterly earnings reports) differentially, they will also revise their prior beliefs (e.g., forecasts of annual EPS) differentially provided the precision of their prior information was identical. Some revise their prior beliefs optimistically, whereas others are more pessimistic. Analysts’ differential revisions resulting from their various interpretations induce additional trading volume beyond that resulting from the heterogeneity of prior beliefs.
Holthausen and Verrecchia (1990) present a partially revealing rational expectations model of competitive trading and demonstrate the influence of the consensus effect of information releases on volume of trade. They define the consensus effect as a measure of the extent to which investors’ beliefs diverge (decrease in consensus) or converge (increase in consensus) as a result of an information release. Holthausen and Verrecchia show analytically that, ceteris paribus, a decrease in consensus among investors is associated with an increase in trading volume, and vice versa. Consistent with Holthausen and Verrecchia’s theoretical definition, we use the posterior belief dispersion (PsD) in analysts’ annual EPS forecasts immediately following each quarterly earnings announcement relative to the prior belief dispersion (PrD) in their annual forecasts as our proxy for the consensus effect (CE). Consequently, CE = PsD / PrDf = 1.0 would imply no change in consensus, CE > 1.0 would imply a decrease in consensus; and CE<1.0 would imply an increase in consensus.
Holthausen and Verrecchia (1990) also show that, ceteris paribus, the more knowledgeable individual investors become at the time of an information release, the more they trade (i.e., the informedness effect) because they are more confident in their information. Prior to an information release such as a quarterly earnings announcement, what each individual investor knows about the forthcoming quarterly earnings number is reflected in his or her predisclosure quarterly earnings expectation. The announcement of the actual earnings number provides a realization of this figure. Each investor’s correction from his or her expectation to the actual realization is a direct measure of the individual investor’s increased informedness or the degree to which an individual investor becomes more knowledgeable, and this is reflected in the individual investor’s quarterly earnings forecast error (i.e., the difference between the actual quarterly earnings number and his or her expected quarterly earnings number). The informedness effect is a measure of the differences in the quarterly forecast errors across individual investors. Consistent with Holthausen and Verrecchia’s definition, we use mean-squared error associated with individual analysts’ quarterly earnings forecasts made just before each quarterly earnings announcement divided by the absolute value of the mean individual analysts’ quarterly EPS forecasts, denoted IEQ, as our proxy for the informedness effect associated with quarterly earnings releases.
The theoretical results of Dontoh and Ronen (1993), Holthausen and Verrecchia (1990), Karpoff (1986), Kim and Verrecchia (1997), and Varian (1989) form the basis of our hypotheses that the magnitude of trading volume reaction to the information in quarterly earnings announcements is an increasing function of (a) the heterogeneity of investors’ prior beliefs, (b) differential interpretation, (c) the consensus effect, and (d) the informedness effect of quarterly earnings signals. Other reasons for trade include endowment differences, trading for liquidity, risk tolerance, tax, and portfolio rebalancing considerations. However, because we examine specific earnings announcements, it is unlikely that trading for these other reasons (other than volume effects of how the information in quarterly earnings announcements affects the above four fundamental determinants) will systematically affect our results.
Prior Studies
Ajinkya, Atiase, and Gift (1991) provide empirical evidence on the general relation between trading volume and belief heterogeneity for the continuous flow of information that analysts use in their periodic revisions of annual EPS forecasts. 3 Ajinkya et al. find a positive association between the dispersion in analysts’ forecasts of annual EPS and the volume of trading. However, Ajinkya et al. do not examine how differential interpretation, the consensus effect, or the informedness effect affect trading volume reactions to earnings news. Barron (1995) extends Ajinkya et al. and finds that trading volume is positively related to not only the dispersion in analysts’ forecasts but also the change in dispersion and the correlation between the relative positions of individual analysts’ current and prior earnings forecasts. However, like Ajinkya et al., Barron does not address how differential interpretation or the informedness effect influence trading volume reactions to earnings news. Kandel and Pearson (1995) suggest differential interpretation of public signals as a plausible explanation for the empirical observation that there is significant abnormal volume around anticipated public announcements even when prices do not change in response to the announcement. They also document that analysts interpret public signals differentially. However, their study does not address the relation between trading volume and differential interpretation (or heterogeneous prior beliefs, or the consensus effect, or the informedness effect).
Bamber, Barron, and Stober (1997) report that trading volume around earnings announcements is positively related to the complement of the correlation between relative positions of individual analysts’ pre- and post-forecasts, as well as the dispersion in prior beliefs and the change in dispersion. However, as they note, their complement of the analysts’ forecast correlation measure is quite distinct from the differential interpretation construct in this article. Thus, Bamber et al. (1997) do not address or control for the volume effects of differential interpretation or the informedness effect. Bamber, Barron, and Stober (1999) examine the relation between differential interpretation and trading volume but do not control for the effects of prior belief dispersion or the consensus effect or the informedness effect. 4 Atiase, Dontoh, and Gift (forthcoming, hereafter ADG) report that the three variables—heterogeneous prior beliefs, differential interpretation, and the consensus effect—are fundamental determinants of volume. Atiase, Ajinkya, Dontoh, and Gift (2011) extend ADG by comparing univariate models to a multivariate model with the three variables—heterogeneous prior beliefs, differential interpretation, and the consensus effect. However, like the prior studies, ADG and Atiase et al. (2011) do not control for, or address, the relation between trading volume and the informedness effect. Thus, prior research has not examined the relation between trading volume and the informedness effect. Furthermore, no prior study has examined the relation between trading volume and all four fundamental determinants advanced by financial economists—heterogeneous prior beliefs, differential interpretation, the consensus effect, and the informedness effect—in a multivariate setting to determine whether only a subset of the four variables or all four variables are empirically important.
Hypotheses
From the preceding discussion, we posit the following:
Research Methodology
Sample Design and Data Collection
Sample-firm observations must meet the following criteria: The firm must (1) be listed on the New York Stock Exchange or the American Stock Exchange; (2) have a December 31 fiscal year end; (3) be listed on the CRSP Daily Stock–Securities Database; (4) have actual first, second, or third quarter earnings information available on both the COMPUSTAT and Institutional Brokers Estimate System (I/B/E/S) and the corresponding quarterly earnings announcement date available on the COMPUSTAT 6 ; (5) have at least three analysts contributing to the mean quarterly EPS forecasts during the month immediately before each sampled quarterly earnings announcement; and (6) have at least three most current individual analysts’ new forecasts of annual EPS within 45 days before each sampled quarterly earnings announcement, and the same individual analysts that issued a forecast in the prior period must have a matching posterior forecast in the I/B/E/S database within 30 days following each quarterly earnings announcement whether or not their posterior forecast differed from their prior forecast. With respect to criteria (5) and (6), replication of the analysis with a minimum of five analysts resulted in a smaller sample but substantially similar inferences.
We impose criterion (1) to avoid a possible difference in information environment due to exchange listing or “exchange effect.” Criterion (2) facilitates matching COMPUSTAT quarterly earnings announcement dates with the most current I/B/E/S forecasts associated with the sampled quarterly earnings announcements. 7 Criteria (3) and (4) ensure access to data required for the study. Criterion (5) enhances the statistical stability of each mean quarterly EPS forecast. Criterion (6), perhaps the most restrictive criterion, minimizes the differential lag between the individual analysts’ prior and posterior annual EPS forecasts and enhances the precision of the measures of the prior dispersion in annual EPS forecasts, differential interpretation, and the consensus effect. In particular, our measures of differential interpretation and the consensus effect require prior and posterior forecasts of annual EPS by the same individual analysts. Also, in the implementation of criterion (6), we exclude stale forecasts to avoid the undesirable effects of stale forecasts on the measures of the dispersion in analysts’ forecasts and the other three determinants of trading volume (Brown & Han, 1992). The data set that meets all the above selection criteria consists of 25,957 observations associated with quarterly earnings announcements by 1,995 firms between 1985 and 2008, inclusive.
We obtain daily returns, daily excess returns, trading volume, and total shares outstanding (adjusted for stock splits and stock dividends) from the CRSP Daily Stock–Securities Database. We retrieve quarterly earnings announcements dates and actual quarterly earnings information from COMPUSTAT. The actual quarterly earnings figures per the COMPUSTAT-Merged Fundamental Quarterly File are cross-checked with the actual quarterly earnings figures from the I/B/E/S Summary Database for consistency. We retrieve data for computing the prior dispersion in analysts’ annual earnings forecasts, the differential interpretation of quarterly earnings signals, and the magnitude of quarterly earnings signals from the I/B/E/S Detail and Summary Database, the COMPUSTAT-Merged Fundamental Quarterly File, and the CRSP Daily Stock–Securities Database.
Variable Definitions
Trading volume reaction (TV)
We used two trading volume measures. The first measure of trading volume is based on the percentage of firm i’s shares traded on Day t (Vit) during the days surrounding each quarterly earnings announcement (Ajinkya et al., 1991; Atiase & Bamber, 1994). We cumulated the daily percentages of shares traded over two different windows and divided the sums by the number of trading days in each window to give the average daily percentage of shares traded in each of the two windows. We define the two windows as follows:
First window: from Day −1 to +1, relative to a quarterly earnings announcement, and
Second window: from Day −1 to +5, relative to a quarterly earnings announcement.
Although the bulk of the trading volume reaction occurs on Days −1 to 0, relative to the earnings announcement date, abnormally high trading persists up to 5 days after the announcement (Morse, 1981). Also, evidence in Berkman and Truong (2009) shows that the proportion of after-hours earnings announcements has increased and earnings-related volume occurs on Day +1 in recent years. By using average daily percentage of shares traded, we control for the differences in the length of the two windows. These (unadjusted) trading volume metrics are denoted APVOL3 and APVOL7 for the two windows, respectively.
The second (and principal) measure of trading, Vmadj it , adjusts for the overall market level of trading by dividing each firm i’s daily percentage of shares traded (Vit) by the daily percentage of shares traded on the overall market on Day t (Vmt). This yields each firm i’s daily percentage of shares traded relative to the daily percentage of shares traded on the overall market on Day t (i.e., Vmadj it = Vit / Vmt) as in Atiase et al. (2011). 8 Again, we cumulate the resulting daily market-adjusted percentage of firm i’s shares traded on Day t, Vmadj it , over the same two event windows defined above and divided the sums by the number of days in each window, denoted as MAVOL3, and MAVOL7 for the two windows, respectively.
In all our empirical analysis described below, the results based on the market-adjusted trading volume metrics (MAVOL) are essentially identical to the results based on the unadjusted trading volume metrics (APVOL). Also, our inferences are robust when we estimate each of our empirical models (specified below) with the unadjusted trading volume as the dependent variable and include the average daily percentage of shares traded on the overall market as an independent (control) variable, as well as when we use abnormal volume measures based on the event window volumes relative to a normal or baseline level of trading volume (based on the average volume over the pre-event window). Thus, for brevity, we only report results based on the market-adjusted trading volume metrics (MAVOL).
Prior and posterior dispersion in analysts’ annual EPS forecasts (PrD and PsD). 9
Our measure of prior dispersion, PrD, is the standard deviation across the individual analysts’ forecasts of annual EPS immediately before each quarterly earnings announcement (σprior), divided by the absolute value of the mean of the individual analysts’ forecasts of annual EPS immediately before each quarterly announcement, that is,


Similarly, our measure of posterior belief dispersion, PsD, is the standard deviation across the individual analysts’ forecasts of annual EPS made within 30 days after each quarterly earnings announcement, divided by the absolute value of the mean of the individual analysts’ forecasts of annual EPS immediately before each quarterly announcement (APrMAF). Similar metrics for PrD based on I/B/E/S summary data are employed in prior studies (e.g., Ajinkya et al., 1991; Elliott & Philbrick, 1990).
Differential interpretation of quarterly earnings signals (DI)
We measure differential interpretation (DI) as the standard deviation of the revision in individual analysts’ forecasts of annual EPS, SDrev, divided by the absolute value of the mean analysts’ annual EPS forecast immediately before each quarterly earnings announcement. Specifically, let

where i = 1, . . ., n.
The resulting differential interpretation metric, DI, is,

We also use a nonparametric measure of differential interpretation denoted DI2. We define DI2 as the variance of the differences in the rankings of analyst forecasts before and after each quarterly earnings announcement, scaled by the average rank before the announcement. An advantage of the nonparametric measure is that while the parametric measure implies a particular functional form of the differential belief revisions, the nonparametric measure, DI2, does not. However, a potential drawback of the nonparametric metric of differential interpretation, DI2, is that it would miss some true differences in analysts’ forecast revisions. For example, if the rankings in analysts’ forecasts of annual EPS before and after each quarterly earnings announcement do not change, DI2 will be 0, implying identical interpretation even when the variance in their revisions is greater than 0, which would imply differential interpretation.
Like all proxies, ours are subject to limitations. In particular, DI and DI2 reflect differential belief revisions across analysts. 11 In any case, prior research suggests that analysts’ earnings forecasts and forecast revisions are reasonable surrogates for investors’ beliefs and belief revisions. 12 We follow prior empirical capital market research in adopting analysts’ earnings forecasts and forecast revisions as the best available proxies for investors’ beliefs and belief revisions. Thus, the above-noted potential limitation notwithstanding, DI, and DI2 are reasonably good empirical proxies for the unobservable differential interpretation construct.
The consensus effect (CE)
Holthausen and Verrecchia (1990) define the consensus effect as the extent to which an information release causes investors’ beliefs to converge (increase in consensus) or diverge (decrease in consensus). Accordingly, we use the posterior belief dispersion (PsD) in analysts’ annual EPS forecasts immediately following each quarterly earnings announcement relative to the prior belief dispersion (PrD) as our proxy for the consensus effect (CE).
The informedness effect (IE)
As discussed in “Theory, Prior Studies, and Hypotheses” section, Holthausen and Verrecchia (1990) define the informedness effect (IE) as the degree to which an information release makes individual investors differentially more knowledgeable. As noted above, the intuition behind our empirical proxy for the informedness effect is as follows. Prior to an information release such as an earnings announcement, what each individual investor knows about the forthcoming earnings number is reflected in his or her predisclosure earnings expectation. The announcement of the actual earnings number provides a realization of this figure. Each investor’s correction from his or her expectation to the actual realization is a direct measure of the individual investor’s increased informedness or the degree to which an individual investor becomes more knowledgeable, and this is reflected in the individual investor’s earnings forecast error (i.e., the difference between the actual earnings number and his or her expected earnings number). The informedness effect is a measure of the differences in the forecast errors across individual investors. Consistent with this definition, we use the mean-squared error of individual analysts’quarterly earnings forecasts issued just before each quarterly earnings announcement, divided by the absolute value of the mean individual analysts’ quarterly EPS forecasts (APrMQF), denoted IEQ as our measure of the informedness effect. Specifically, let Q be the actual quarterly earnings, and let

The resulting informedness effect metric IEQ is given by,

As noted above, our informedness effect proxies capture differences in individual investors’ forecast errors and the effect of these differences on trading volume beyond unexpected earnings. 14
Quarterly earnings signal (QES)
We use two different proxies for the magnitude of quarterly earnings signals (QES). The first measure is the magnitude of the price reaction (i.e., the magnitude of the CRSP excess returns) to each quarterly earnings announcement. We employ two alternative excess returns metrics denoted ARES3 and ARES7, cumulated over the 3- and 7-day windows we use for trading volume reactions 15 :
ARES3: 3-day window from Day −1 to +1,
ARES7: 7-day window from Day −1 to +5.
The second measure is the magnitude of unexpected quarterly earnings (UQE). The unexpected quarterly earnings metric is defined as the absolute value of the difference between actual quarterly EPS and the mean analysts’ forecasts of the quarterly EPS immediately before each quarterly earnings announcement, deflated by the absolute value of the mean analysts’ forecasts of the quarterly EPS, denoted UQE.
Model Specification
The relation investigated in this study is of the form: TV = f(PrD, DI, CE, IE, CONTROL). We use logarithmic transformations of both the dependent and independent variables to reduce departures of the regression errors from normality as well as to reduce skewness in the data (e.g., Ajinkya & Jain, 1989). Evidence presented in Table 1 shows that the means of the raw dependent and independent variables are often greater than the 75th percentile values.
Descriptive Statistics: Distribution of Raw Dependent and Independent Variables (N = 25,957; 1985-2008).
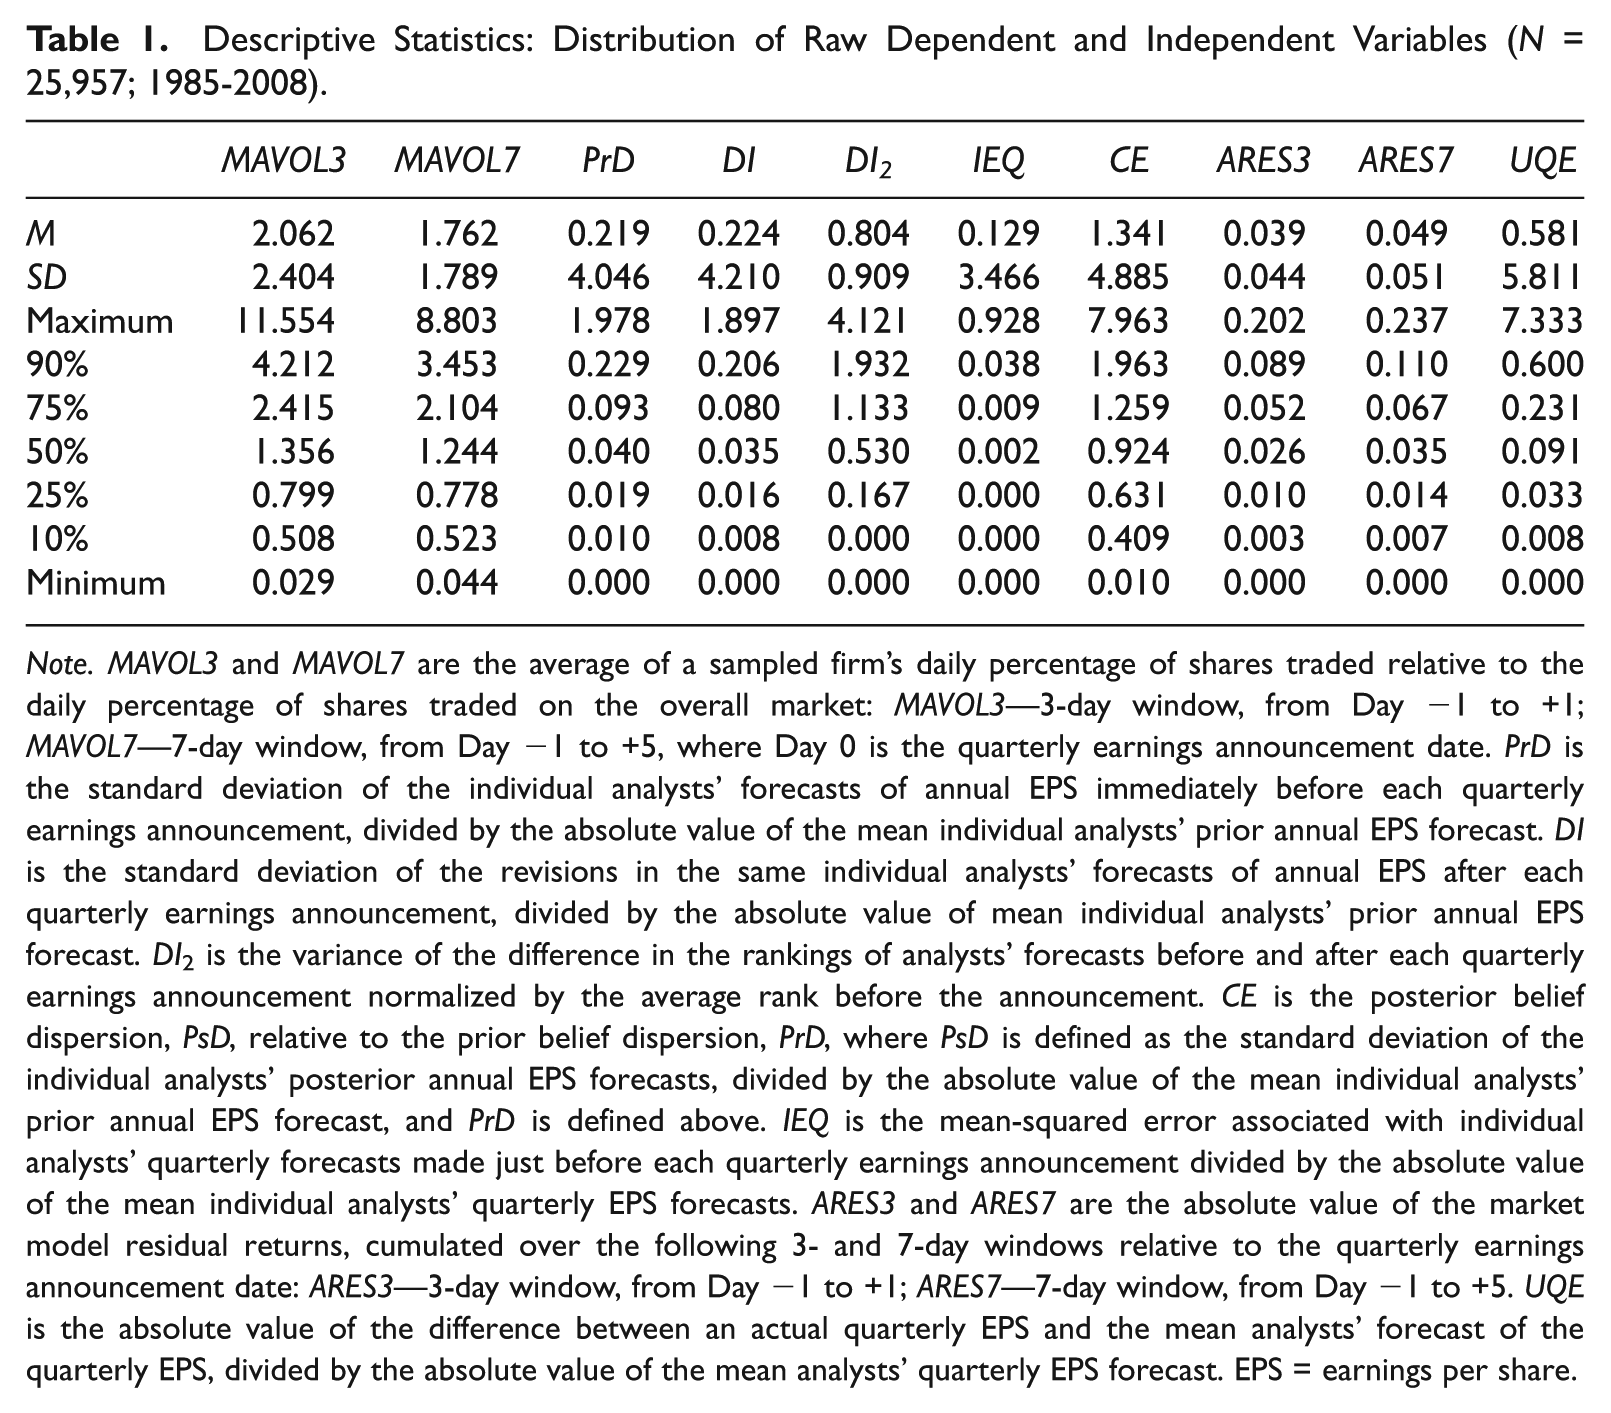
Note. MAVOL3 and MAVOL7 are the average of a sampled firm’s daily percentage of shares traded relative to the daily percentage of shares traded on the overall market: MAVOL3—3-day window, from Day −1 to +1; MAVOL7—7-day window, from Day −1 to +5, where Day 0 is the quarterly earnings announcement date. PrD is the standard deviation of the individual analysts’ forecasts of annual EPS immediately before each quarterly earnings announcement, divided by the absolute value of the mean individual analysts’ prior annual EPS forecast. DI is the standard deviation of the revisions in the same individual analysts’ forecasts of annual EPS after each quarterly earnings announcement, divided by the absolute value of mean individual analysts’ prior annual EPS forecast. DI2 is the variance of the difference in the rankings of analysts’ forecasts before and after each quarterly earnings announcement normalized by the average rank before the announcement. CE is the posterior belief dispersion, PsD, relative to the prior belief dispersion, PrD, where PsD is defined as the standard deviation of the individual analysts’ posterior annual EPS forecasts, divided by the absolute value of the mean individual analysts’ prior annual EPS forecast, and PrD is defined above. IEQ is the mean-squared error associated with individual analysts’ quarterly forecasts made just before each quarterly earnings announcement divided by the absolute value of the mean individual analysts’ quarterly EPS forecasts. ARES3 and ARES7 are the absolute value of the market model residual returns, cumulated over the following 3- and 7-day windows relative to the quarterly earnings announcement date: ARES3—3-day window, from Day −1 to +1; ARES7—7-day window, from Day −1 to +5. UQE is the absolute value of the difference between an actual quarterly EPS and the mean analysts’ forecast of the quarterly EPS, divided by the absolute value of the mean analysts’ quarterly EPS forecast. EPS = earnings per share.
We estimate models of the general form:


Model 1 is used to check on the consistency of our results with prior results and Model 2 is used to examine the main hypotheses examined in this article. Based on the discussion in “Theory, Prior Studies, and Hypotheses” section, we expect all the coefficients of the independent variables in all the models to be positive.
Empirical Tests and Results
Descriptive Statistics
Table 1 summarizes the distributions of the raw dependent and independent variables. For the dependent variable, trading volume, the mean market-adjusted daily percentage of shares traded are 2.062% and 1.762% for the metrics over the two windows MAVOL3 and MAVOL7, respectively. The mean consensus effect metric, CE, is 1.341, suggesting a decrease in consensus, on average, in reaction to the announcements. However, the median CE is 0.924. Indeed, 56.4% of CEs are less than 1.000, suggesting approximately 56% (44%) of the quarterly earnings signals are associated with an increase (a decrease) in consensus. The range for each dependent and independent variable is quite large, and each variable exhibits some degree of positive skewness. The logarithmic transformations significantly reduce the skewness. 16
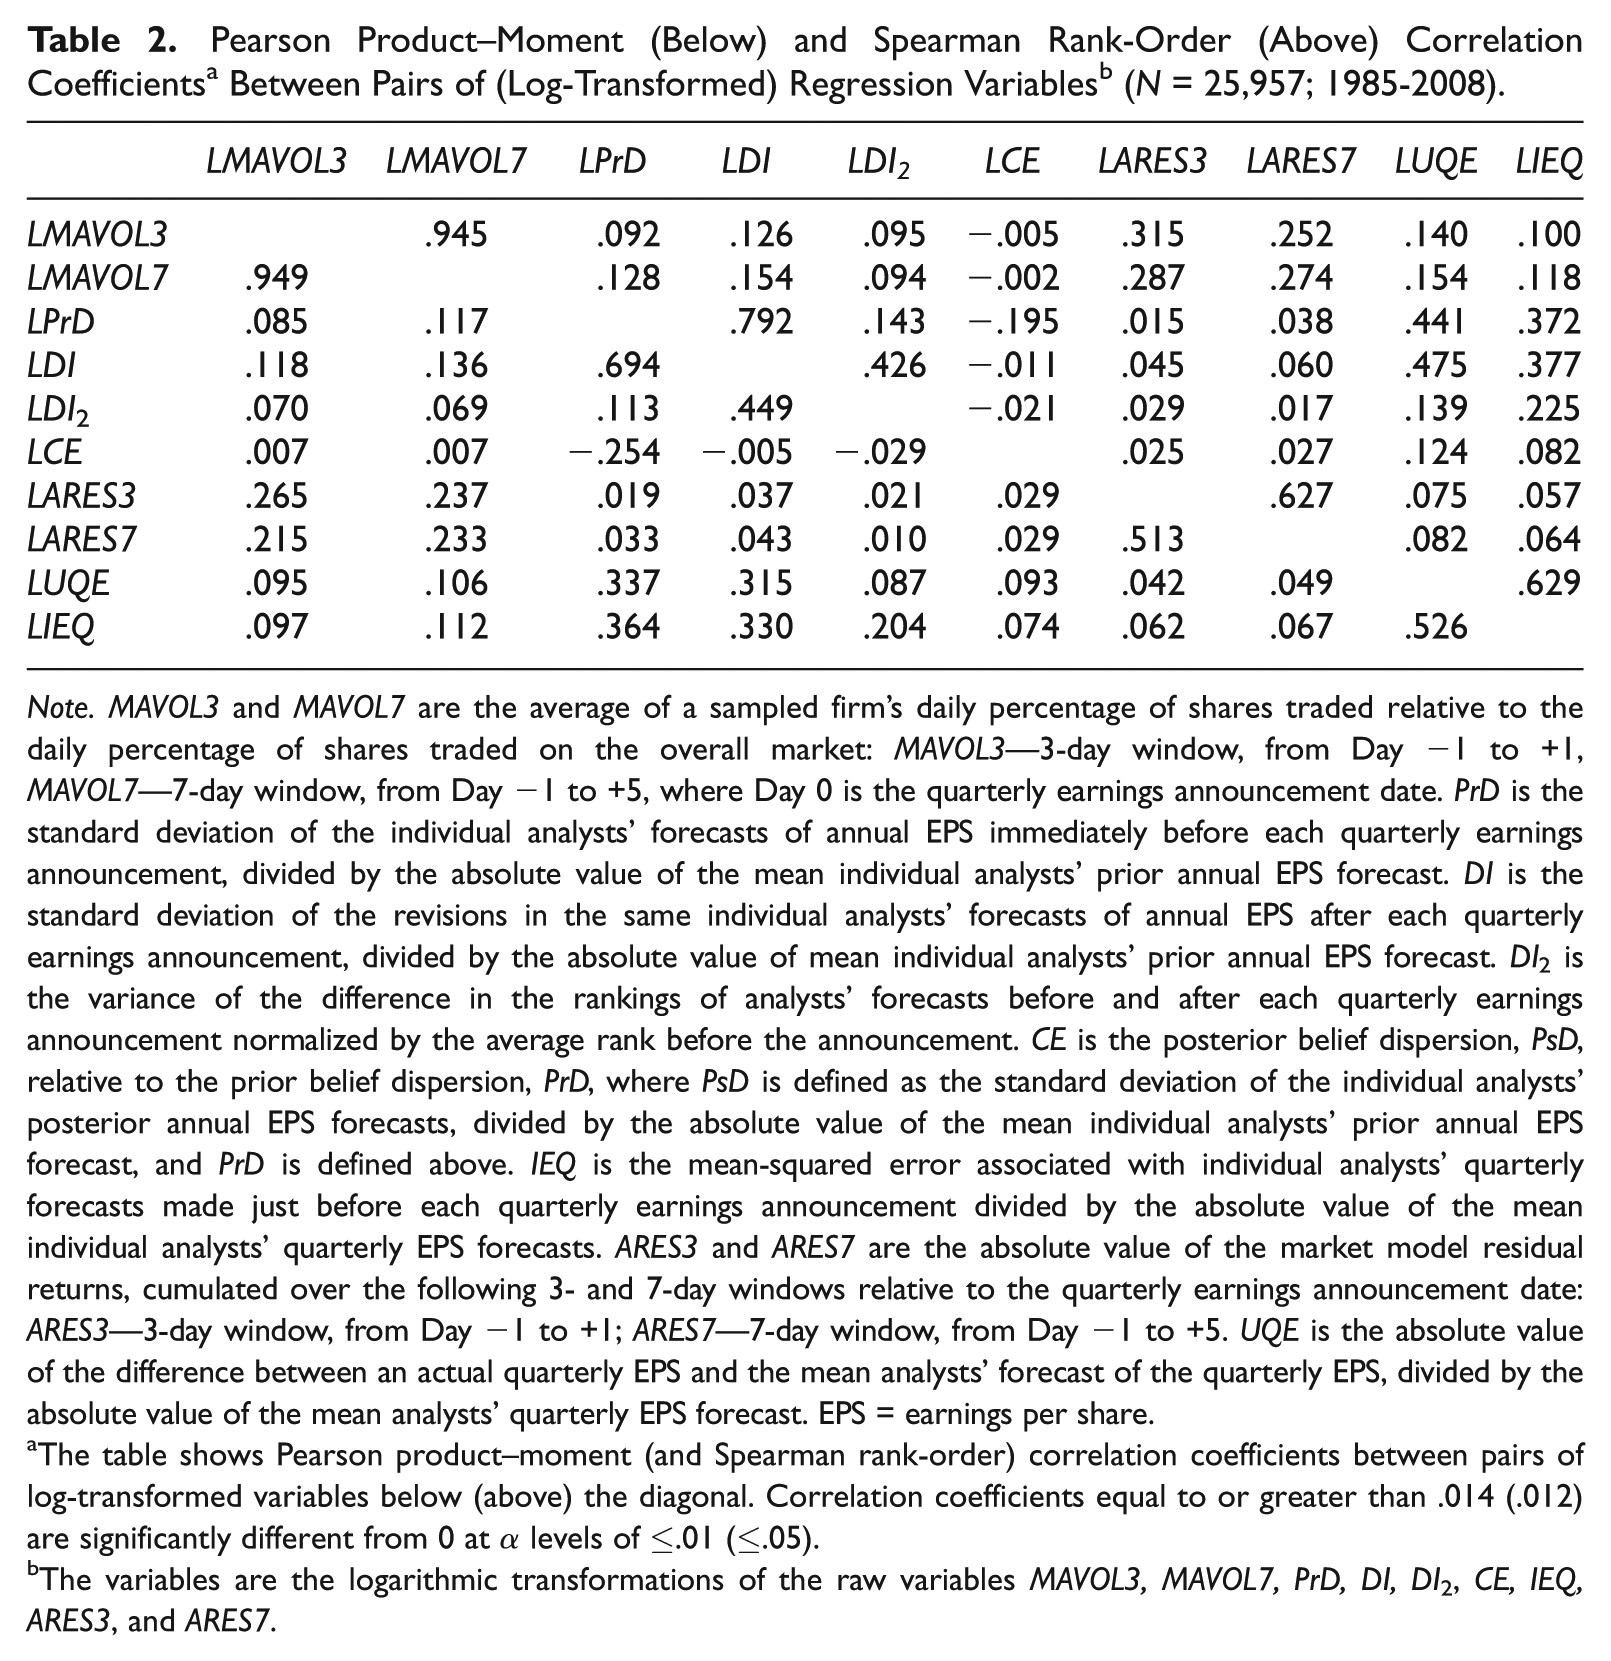
Univariate Analysis
Table 2 presents the pairwise correlations among the empirical proxies. The table shows the Pearson product–moment (Spearman rank-order) correlations below (above) the diagonal. As expected, the proxy for prior belief dispersion (LPrD) is significantly positively correlated with the measures of trading volume (α<.01). Also, the proxies for differential interpretation (LDI and LDI2) and the informedness effect (LIEQ) are significantly positively correlated with trading volume (α<.01). Table 2 also reveals that the proxies for the magnitude of quarterly earnings signals (LQES: LARES3, LARES7, and LUQE) are all significantly positively associated with trading volume reactions to quarterly earnings announcements (α<.01).
Note. MAVOL3 and MAVOL7 are the average of a sampled firm’s daily percentage of shares traded relative to the daily percentage of shares traded on the overall market: MAVOL3—3-day window, from Day −1 to +1, MAVOL7—7-day window, from Day −1 to +5, where Day 0 is the quarterly earnings announcement date. PrD is the standard deviation of the individual analysts’ forecasts of annual EPS immediately before each quarterly earnings announcement, divided by the absolute value of the mean individual analysts’ prior annual EPS forecast. DI is the standard deviation of the revisions in the same individual analysts’ forecasts of annual EPS after each quarterly earnings announcement, divided by the absolute value of mean individual analysts’ prior annual EPS forecast. DI2 is the variance of the difference in the rankings of analysts’ forecasts before and after each quarterly earnings announcement normalized by the average rank before the announcement. CE is the posterior belief dispersion, PsD, relative to the prior belief dispersion, PrD, where PsD is defined as the standard deviation of the individual analysts’ posterior annual EPS forecasts, divided by the absolute value of the mean individual analysts’ prior annual EPS forecast, and PrD is defined above. IEQ is the mean-squared error associated with individual analysts’ quarterly forecasts made just before each quarterly earnings announcement divided by the absolute value of the mean individual analysts’ quarterly EPS forecasts. ARES3 and ARES7 are the absolute value of the market model residual returns, cumulated over the following 3- and 7-day windows relative to the quarterly earnings announcement date: ARES3—3-day window, from Day −1 to +1; ARES7—7-day window, from Day −1 to +5. UQE is the absolute value of the difference between an actual quarterly EPS and the mean analysts’ forecast of the quarterly EPS, divided by the absolute value of the mean analysts’ quarterly EPS forecast. EPS = earnings per share.
The table shows Pearson product–moment (and Spearman rank-order) correlation coefficients between pairs of log-transformed variables below (above) the diagonal. Correlation coefficients equal to or greater than .014 (.012) are significantly different from 0 at
The variables are the logarithmic transformations of the raw variables MAVOL3, MAVOL7, PrD, DI, DI2, CE, IEQ, ARES3, and ARES7.
However, both correlations between the proxy for the consensus effect (LCE) and trading volume reactions are not significant. Notice, however, that the proxy for the consensus effect (LCE) is negatively correlated with the proxy for prior belief dispersion (LPrD, α≤ .01) and the differential interpretation proxy LDI2 but significantly positively correlated with the proxy for the informedness effect (LIEQ). Also, the proxies for prior belief dispersion (LPrD), differential interpretation (LDI), and the informedness effect (LIEQ) are all positively correlated. This suggests that any inference on the relation between consensus effect and volume of trade from the simple correlation between the proxies for the consensus effect and trading volume (without controlling for prior belief dispersion, differential interpretation, and the informedness effect) is misleading. Finally, all four main independent variables, LPrD, LDI, LCE, and LIE are significantly positively correlated with the LQES variables.
Given the inter-correlations among the independent variables, there are several reasons why one or more may be empirically unimportant. For example, the first three determinants: prior belief dispersion, the magnitude of differential interpretation, and the consensus effect are (various transformations or scalings of) the dispersion of prior beliefs, the dispersion of belief revisions, and the dispersion of posterior beliefs. An analyst’s posterior forecast is the prior forecast plus the revision. That is, if x is the prior forecast, y is the forecast revision, and z is the posterior forecast, then z = x+y and var(z) = var(x) + var(y) + 2cov(x, y). Thus, if cov(x, y) = 0, then the three variables var(x), var(y), and var(z) actually only contain two pieces of independent information, and var(z), the variance of the posterior forecast, which reflects the consensus effect, does not contain additional information beyond the variances of x and y. 17 In that case, given prior belief dispersion and the magnitude of differential interpretation, the volume effects of the consensus effect will be empirically unimportant. In general, given var(x) and var(y), belief divergence or convergence following an earnings signal depends on whether the change in forecast variance defined by var(y) + 2cov(x, y) is greater than 0, less than 0, or equal to 0. Beliefs converge (i.e., CEf<1) when var(y) + 2cov(x, y)<0. Beliefs diverge (i.e., CEf > 1) when var(y) + 2cov(x, y) > 0, and there is no divergence or convergence in beliefs (i.e., CEf = 1) when var(y) + 2cov (x, y) = 0. Thus, given prior heterogeneous beliefs and a given magnitude of differential interpretation, whether the consensus effect is empirically unimportant hinges on the var(y) + 2cov(x, y) term, and this is an empirical issue.
Also, as noted above, the proxies for prior belief dispersion (LPrD), differential interpretation (LDI), and the informedness effect (LIE) are positively correlated with each other. Furthermore, the proxies for the consensus effect (LCE) and the informedness effect (LIE) are positively correlated with each other. If the correlations among the proxies are high enough, then a subset of the variables could subsume the others. This, again, is an empirical issue. 18
Multivariate Analyses
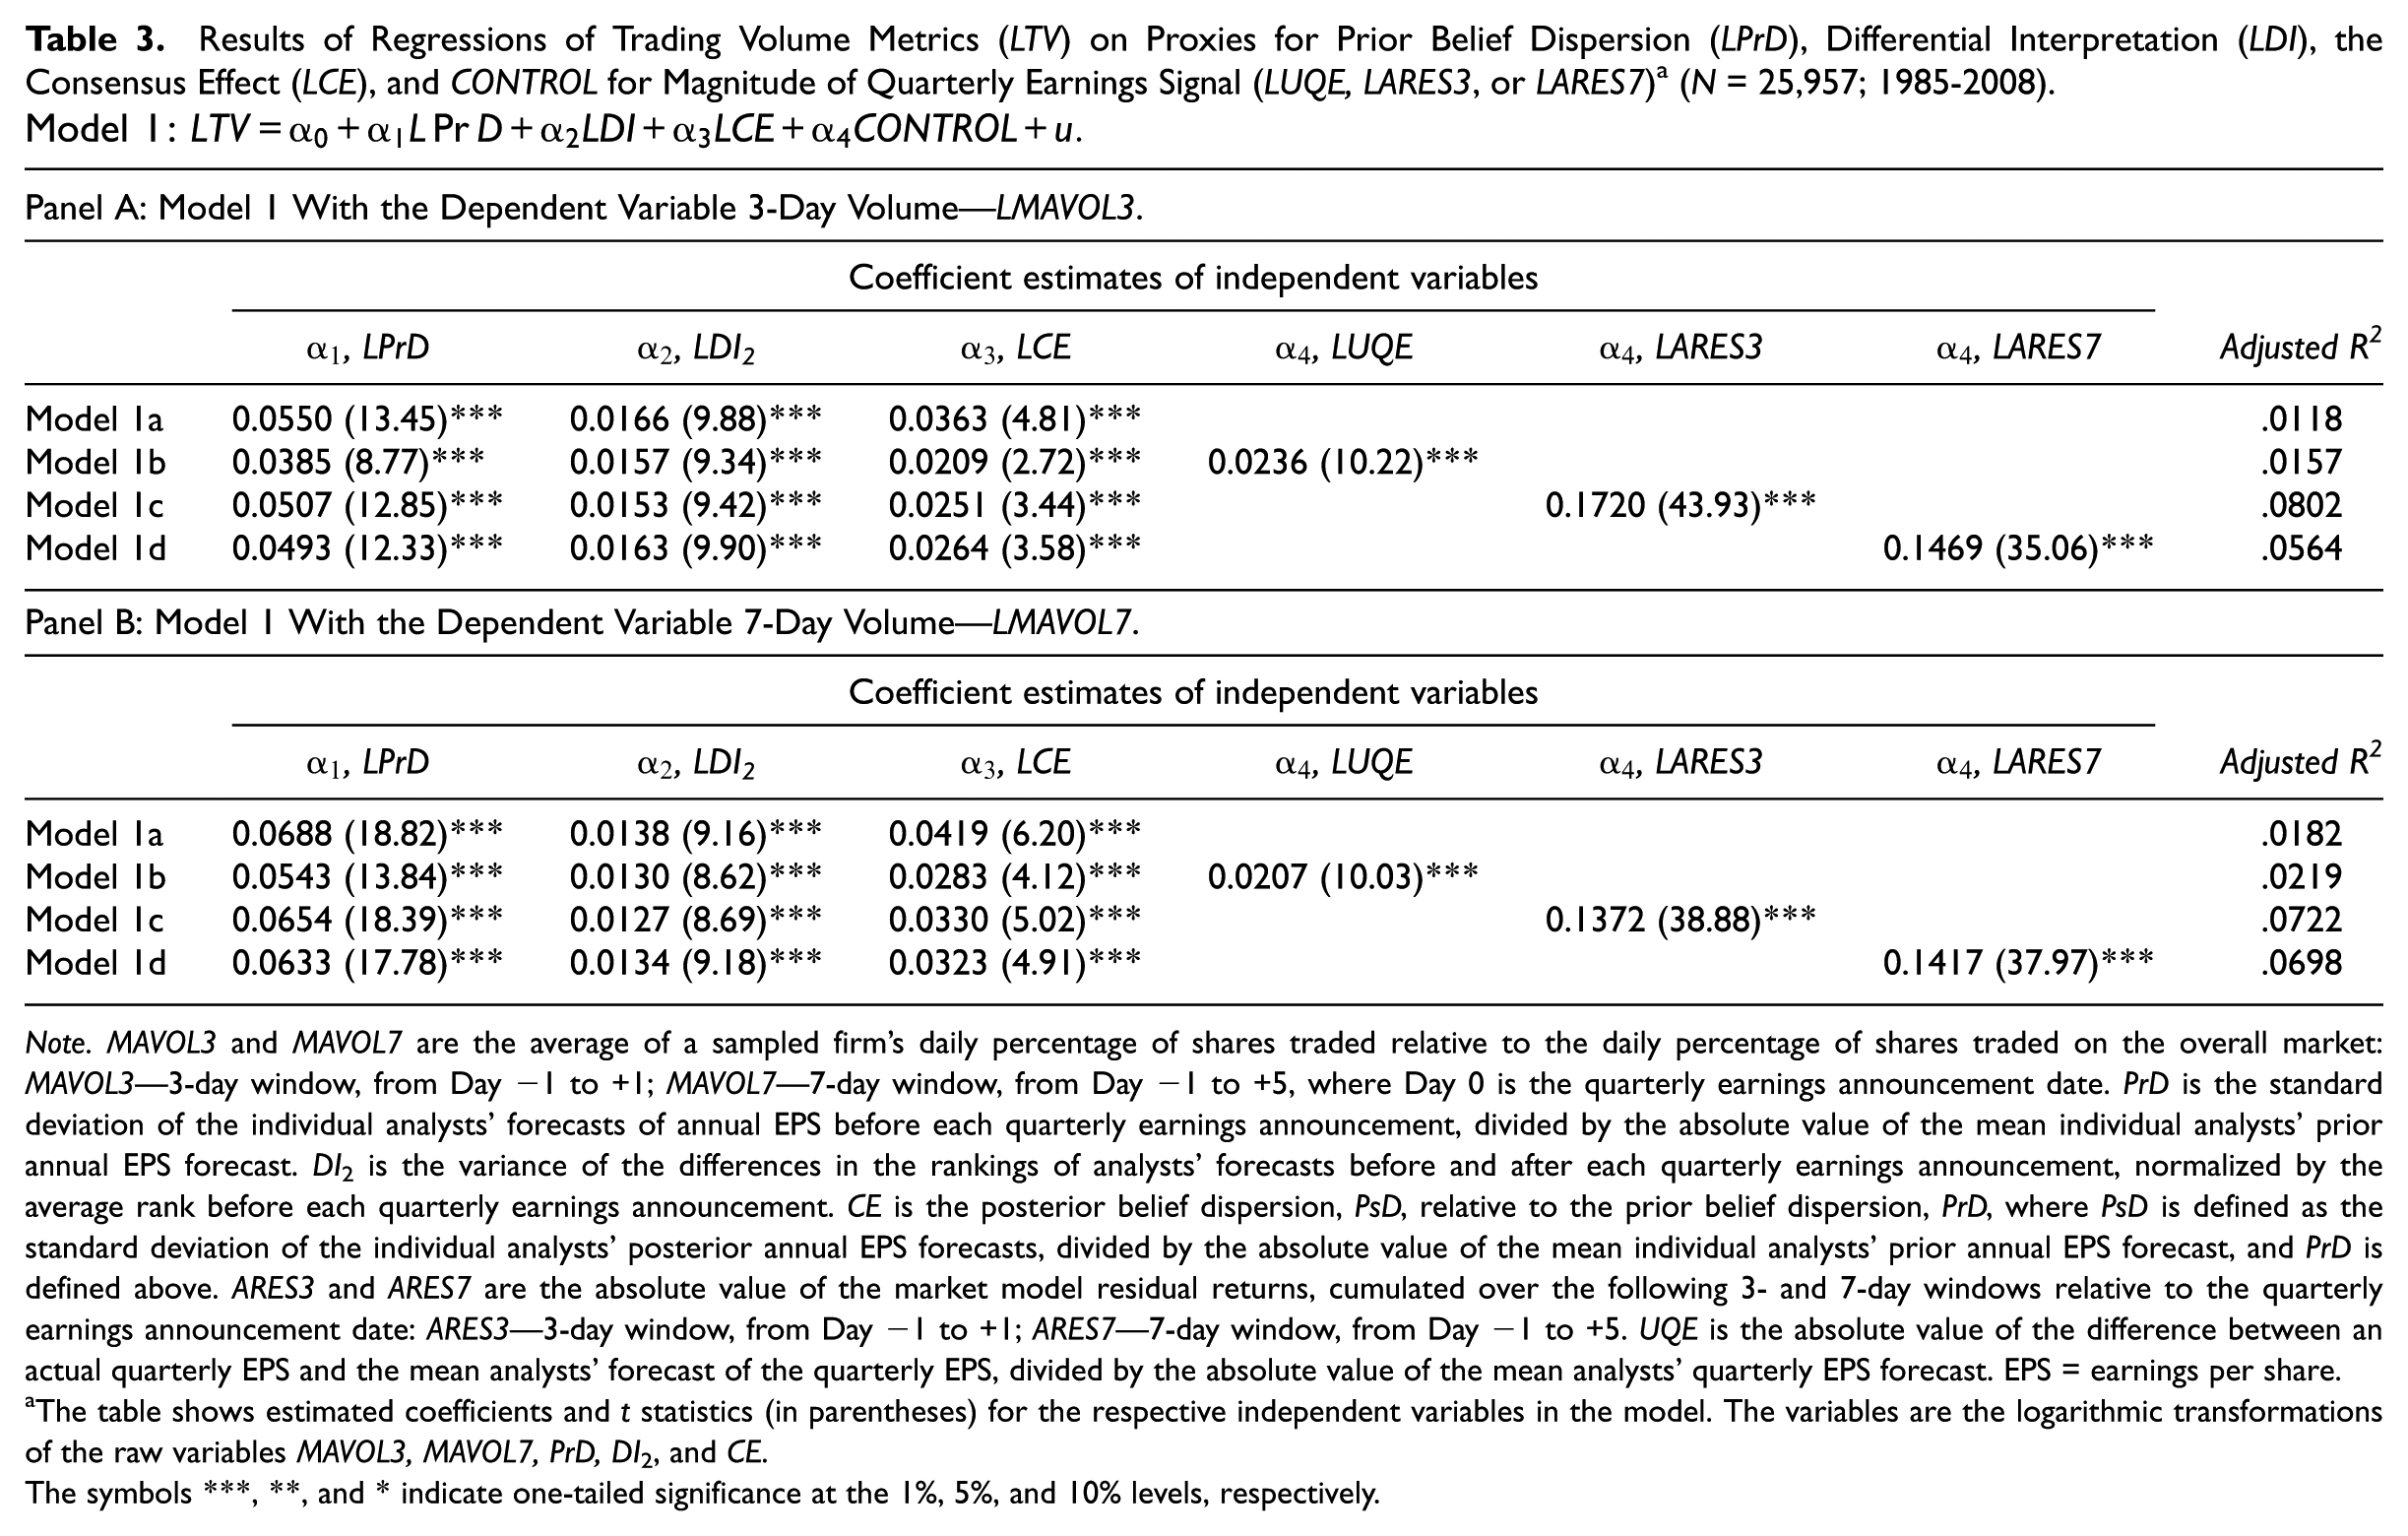
Table 3 presents the results for Model 1. 19 The results of estimating the model with the 3-day volume metric LMAVOL3 appear in Panel A, whereas the results of estimating the model with the 7-day volume metric LMAVOL7 appear in Panel B. In each panel, Model 1a estimates the model with no control for quarterly earnings signal, whereas Models 1b, 1c, and 1d estimate the model with the quarterly earnings signal control LUQE, LARES3, and LARES7, respectively. The results are consistent with prior empirical evidence. First, the coefficient of the proxy for prior belief heterogeneity, LPD, is positive and significant at α levels of <.01 in all eight estimations. This result extends the empirical result in Ajinkya et al. (1991) and Barron (1995) that trading volume is positively related to prior belief heterogeneity to a specific information event—quarterly earnings signals. Second, the conditional results on the estimated coefficients of LDI2 (the proxy for differential interpretation of quarterly earnings signals), and the estimated coefficient of LCE (the proxy for the consensus effect of quarterly earnings signals) are positive and statistically significant at α levels of <.01 in all eight estimations. In sum, the results of Model 1 reported in Table 3 are consistent with the prior empirical results in Atiase et al. (2011) that the three variables—heterogeneous prior beliefs, differential interpretation, and the consensus effect—are fundamental determinants of volume.
Results of Regressions of Trading Volume Metrics (LTV) on Proxies for Prior Belief Dispersion (LPrD), Differential Interpretation (LDI), the Consensus Effect (LCE), and CONTROL for Magnitude of Quarterly Earnings Signal (LUQE, LARES3, or LARES7) a (N = 25,957; 1985-2008).
Note. MAVOL3 and MAVOL7 are the average of a sampled firm’s daily percentage of shares traded relative to the daily percentage of shares traded on the overall market: MAVOL3—3-day window, from Day −1 to +1; MAVOL7—7-day window, from Day −1 to +5, where Day 0 is the quarterly earnings announcement date. PrD is the standard deviation of the individual analysts’ forecasts of annual EPS before each quarterly earnings announcement, divided by the absolute value of the mean individual analysts’ prior annual EPS forecast. DI2 is the variance of the differences in the rankings of analysts’ forecasts before and after each quarterly earnings announcement, normalized by the average rank before each quarterly earnings announcement. CE is the posterior belief dispersion, PsD, relative to the prior belief dispersion, PrD, where PsD is defined as the standard deviation of the individual analysts’ posterior annual EPS forecasts, divided by the absolute value of the mean individual analysts’ prior annual EPS forecast, and PrD is defined above. ARES3 and ARES7 are the absolute value of the market model residual returns, cumulated over the following 3- and 7-day windows relative to the quarterly earnings announcement date: ARES3—3-day window, from Day −1 to +1; ARES7—7-day window, from Day −1 to +5. UQE is the absolute value of the difference between an actual quarterly EPS and the mean analysts’ forecast of the quarterly EPS, divided by the absolute value of the mean analysts’ quarterly EPS forecast. EPS = earnings per share.
The table shows estimated coefficients and t statistics (in parentheses) for the respective independent variables in the model. The variables are the logarithmic transformations of the raw variables MAVOL3, MAVOL7, PrD, DI2, and CE.
The symbols ***, **, and * indicate one-tailed significance at the 1%, 5%, and 10% levels, respectively.
Table 4 reports the results for Model 2. Again, the results of estimating the model with the 3-day volume metric LMAVOL3 appear in Panel A, whereas the results of estimating the model with the 7-day volume metric LMAVOL7 appear in Panel B. In each panel of Table 4, Model 2a estimates the unconditional relation between the proxy for the informedness effect and trading volume with no control for quarterly earnings signal, whereas Models 2b, 2c, and 2d estimate the model with the quarterly earnings signal control LUQE, LARES3, and LARES7, respectively. Also, in each panel, Model 2e estimates the conditional relation between trading volume and the proxies for prior belief heterogeneity, differential interpretation, the consensus effect, and the informedness effect with no control for quarterly earnings signal, whereas Models 2f, 2g, and 2h estimate the conditional relation with the quarterly earnings signal control LUQE, LARES3, and LARES7, respectively. 20 The results strongly support our expectations. In all cases, the coefficients of LUQE, LARES3, and LARES7 are positive and significant (α<.01), indicating that the proxies for the magnitude of quarterly earnings signal are positively related to trading volume reactions to quarterly earnings announcements, 21 suggesting that the magnitude of quarterly earnings signals is an important control variable.
Results of Regressions of Trading Volume Metrics (LTV) on Proxies for Prior Belief Dispersion (LPrD), Differential Interpretation (LDI), the Consensus Effect (LCE), the Informedness Effect (LIE), and CONTROL for Magnitude of Quarterly Earnings Signal (LUQE, LARES3, or LARES7)a (N = 25,957; 1985-2008).

Note. MAVOL3 and MAVOL7 are the average of a sampled firm’s daily percentage of shares traded relative to the daily percentage of shares traded on the overall market: MAVOL3—3-day window, from Day −1 to +1; MAVOL7—7-day window, from Day −1 to +5, where Day 0 is the quarterly earnings announcement date. PrD is the standard deviation of the individual analysts’ forecasts of annual EPS before each quarterly earnings announcement, divided by the absolute value of the mean individual analysts’ prior annual EPS forecast. DI2 is the variance of the differences in the rankings of analysts’ forecasts before and after each quarterly earnings announcement, normalized by the average rank before each quarterly earnings announcement. CE is the posterior belief dispersion, PsD, relative to the prior belief dispersion, PrD, where PsD is defined as the standard deviation of the individual analysts’ posterior annual EPS forecasts, divided by the absolute value of the mean individual analysts’ prior annual EPS forecast, and PrD is defined above. IEQ is the mean-squared error associated with individual analysts’ quarterly forecasts made just before each quarterly earnings announcement divided by the absolute value of the mean individual analysts’ quarterly EPS forecasts. ARES3 and ARES7 are the absolute value of the market model residual returns, cumulated over the following 3- and 7-day windows relative to the quarterly earnings announcement date: ARES3—3-day window, from Day −1 to +1; ARES7—7-day window, from Day −1 to +5. UQE is the absolute value of the difference between an actual quarterly EPS and the mean analysts’ forecast of the quarterly EPS, divided by the absolute value of the mean analysts’ quarterly EPS forecast. EPS = earnings per share.
The table shows estimated coefficients and t statistics (in parentheses) for the respective independent variables in the model. The variables are the logarithmic transformations of the raw variables MAVOL3, MAVOL7, PrD, DI2, CE, IEQ, ARES3, ARES7, and UQE.
The symbols ***, **, and * indicate one-tailed significance at the 1%, 5%, and 10% levels, respectively.
More importantly, the results reported in Table 4 document the positive relation between the informedness effect and volume of trade and positive incremental relations between trading volume and the proxies for prior belief heterogeneity, differential interpretation, the consensus effect, and the informedness effect. In all eight estimations of Models 2a, 2b, 2c, and 2d, the estimated coefficient of the proxy for the informedness effect, LIEQ, is positive and significant at α<.01 suggesting that in the absence of controlling for the other three determinants, the informedness effect is positively related to trading volume with or without control for the magnitude of quarterly earnings signal.
The results of estimating Model 2e show that, in the absence of any controls for the magnitude of quarterly earnings signals, all four main independent variables, prior belief dispersion, differential interpretation, the consensus effect, and the informedness effect, provide significant explanation for trade. But even more persuasive, are the results of Models 2f, 2g, and 2h, which provide evidence on the positive incremental relations between trading volume and the proxies for prior belief heterogeneity, differential interpretation, the consensus effect, and the informedness effect even after controlling for the magnitude of quarterly earnings signals. First, the conditional results on the estimated coefficients of the proxy for prior belief heterogeneity, LPD, remain positive and statistically significant at α<.01 in all six estimations. Second, the conditional results on the estimated coefficients of LDI2, the proxy for differential interpretation, are still positive and statistically significant at α<.01 in all six estimations. Third, the conditional results on the estimated coefficients of LCE, the proxy for the consensus effect of quarterly earnings signals, also remain positive and statistically significant at α levels of <.05 in all six estimations (three are significant at α<.01). Fourth, the conditional results on the estimated coefficients of LIEQ, the proxy for the informedness effect, are also still positive and statistically significant at α<.01 in all six estimations. The positive and significant coefficients of the proxies for prior belief dispersion, differential interpretation, the consensus effect, and the informedness effect show that even after controlling for the magnitude of quarterly earnings signals, trading volume is significantly positively related to all four determinants. 22 These results are the first empirical evidence on the positive relation between the informedness effect and volume of trade, as well as the positive incremental effects of each of the four determinants on the volume of trade.
Summary and Conclusion
Theoretical models of trade (Dontoh & Ronen, 1993; Holthausen & Verrecchia, 1990; Karpoff, 1986; Kim & Verrecchia, 1997; Varian, 1989) show that information-based trading is a consequence of four fundamental determinants. First, investors’ prior heterogeneous beliefs cause them to take positions that must be unwound in the light of new information. Second, investors may interpret new information differently, thus revising their prior beliefs differentially and motivating a re-shuffling of assets to new owners. Third, given heterogeneous prior beliefs, a given magnitude of differential interpretation can result in a decrease or an increase in consensus, thereby inducing more or less trade. Fourth, individual investors may be differentially more informed by a new information release and these differences can induce further trading, all else equal. Although these effects are clear theoretically, there is no prior empirical evidence on the relation between the informedness effect and the volume of trade. Furthermore, there is no prior empirical evidence on the incremental effects of these four determinants because empiricists have tended to combine them, thereby masking their incremental effects on trading volume reactions to earnings news.
This study fills this void by providing empirical evidence on the relation between the informedness effect and the volume of trade as well as examining empirically whether trading in response to news generally reflects any one of these four determinants: heterogeneous prior beliefs, differential interpretation, the consensus effect, and the informedness effect or some combination of them in a multivariate setting. If a subset of these determinants dominates and the others are empirically unimportant, it would suggest that trade occurs primarily due to the dominant determinants. Conversely, evidence that all four determinants play significant incremental roles would empirically corroborate the theoretical literature and imply that empirical trading volume models should consider controlling for each of these determinants.
We find a positive relation between the informedness effect and trading volume reactions to quarterly earnings announcements. The results also indicate that the proxies for all four determinants—prior belief heterogeneity, differential interpretation, the consensus effect, and the informedness effect of quarterly earnings signals—play a significant incremental role in explaining trading volume reactions. These results hold even after controlling for the (positively associated) magnitude of the price reactions to quarterly earnings signals, as well as the magnitude of quarterly earnings surprise. This empirical evidence corroborates the theoretical results of Dontoh and Ronen (1993), Holthausen and Verrecchia (1990), Karpoff (1986), Kim and Verrecchia (1997), and Varian (1989) that these four determinants are fundamental explanators of trading volume. As determinants of trading volume, they are also determinants of trading volume reactions to financial and accounting information.
This article makes a number of contributions. First, it is the first article to provide empirical evidence on the positive relation between the informedness effect and trading volume reactions to earnings announcements. Second, it shows that the effects of heterogeneous prior beliefs, differential interpretation, the consensus effect, and the informedness effect are distinct determinants of trading volume reactions to news events, thereby corroborating the theoretical models of financial economists. Third, it presents a reasonable proxy for the informedness effect. Finally, an important implication of the empirical results is that empirical models of trade should consider controlling for each of these determinants.
Footnotes
Acknowledgements
We would like to thank Florence Atiase, Linda Bamber, Ed Cannon, John McInnis, Senyo Tse, Chris Yust, Yong Yu, and an anonymous referee for many helpful comments and discussions, and Jonathan Karpoff for many clarifying comments on the fundamental determinants of trading volume. Research assistance by Siming Yang is gratefully acknowledged. The authors gratefully acknowledge the contribution of I/B/E/S International, Inc., for providing earnings per share forecast data, available through the Institutional Brokers Estimate System. These data have been provided as part of a broad academic program to encourage earnings expectation research.
Declaration of Conflicting Interests
The author(s) declared no potential conflicts of interest with respect to the research, authorship, and/or publication of this article.
Funding
The author(s) disclosed receipt of the following financial support for the research, authorship, and/or publication of this article: The first author acknowledges financial support provided by the Department of Accounting and the McCombs School of Business at The University of Texas at Austin, and the Ernst and Young Foundation.