



Abstract
Using a proprietary database of institutional investors’ daily stock trading records in the post–Regulation Fair Disclosure (FD) period, this study examines whether transient institutions have the independent ability to correctly process small negative earnings surprise announcements, which management claims transient institutions have difficulty in interpreting. We find economically significant abnormal selling by transient institutions in response to small negative earnings surprises. Transient institutions’ selling in response to small negative earnings surprises is also associated with significant contemporaneous stock price declines. However, we find no evidence that transient institutions’ trading in response to small negative earnings surprises is an overreaction as there is no reversal of stock prices subsequent to transient institutions’ trading. More importantly, we show that transient institutions’ trading in response to small negative earnings surprises helps improve the informational efficiency of share prices.
Introduction
Transient institutions (i.e., institutions that trade frequently to maximize short-term profits) are not only a major consumer of financial information but also a dominant force in many financial markets whose trading significantly affects stock prices. 1 Thus, it is important to understand transient institutions’ trading behavior in reaction to publicly released financial information. In this study, we examine the degree of efficiency with which transient institutions react to announcements of small negative earnings surprises in the post–Regulation Fair Disclosure (FD) period during which management is prohibited from disclosing private information to selected investors, including institutional investors and sell-side analysts.
Our study is motivated by the long-standing debate on transient institutions’ independent information acquisition and processing ability. 2 The myopic investor view argues that transient institutions often misinterpret accounting information, resulting in the destabilization of stock prices and reduced stock market efficiency. In contrast, the sophisticated investor view posits that transient institutions are smart traders who know how to interpret accounting information and their trading helps increase the informational efficiency of stock prices.
Prior research examining transient institutions’ trading behavior has found mixed evidence (see the “Literature on Transient Institutions’ Use of Accounting Information” section for a detailed review). More importantly, there is little direct evidence on transient institutions’ independent information acquisition and processing ability, because most prior studies do not distinguish between transient institutions’ two sources of information: superior access to management’s private information versus independent information acquisition and processing ability. Notable exceptions are studies examining transient institutions’ trading behavior prior to important events such as a break in a string of consecutive earnings increases (e.g., Ke & Petroni, 2004; Ke, Petroni, & Yu, 2008) and announcements of accounting restatements (e.g., Li, Radhakrishnan, Shin, & Zhang, 2011). These studies generally find that transient institutions can predict the events in the pre–Regulation FD period but not in the post–Regulation FD period, suggesting that transient institutions’ information on the future events stems from their privileged access to management’s private information. Similarly, after analyzing the returns and stock holdings of institutional investors over 1980-2007, Lewellen (2011) concludes that institutional investors possess little stock picking skills, especially in the period after 2000, which coincides with the passage of Regulation FD. Therefore, these studies suggest that transient institutions may not have an independent information acquisition and processing ability, and they may not be able to correctly interpret public financial disclosures after Regulation FD eliminates their access to management’s private information.
Direct evidence on transient institutions’ independent information acquisition and processing ability is scarce also because institutional investors’ detailed trading records are not publicly available. For example, the most commonly used database to study institutional investors’ trading behavior, Spectrum, contains only institutional investors’ quarterly ownership changes. Hence, it is fairly difficult for prior researchers (e.g., Ke et al., 2008) to design convincing research experiments to test the degree of sophistication in transient institutions’ independent information acquisition and processing.
In this study, we utilize a proprietary database of institutional investors’ daily stock trading records to examine the degree of efficiency with which transient institutions react to announcements of small negative earnings surprises, defined as quarterly earnings per share that fall short of analysts’ consensus forecasts by one penny, in the post–Regulation FD period. For benchmarking purposes, we also test transient institutions’ trading reactions to earnings surprises adjacent to the small negative earnings surprise: −2 cents, 0 cent, +1 cent, and +2 cents. Because Regulation FD prohibits management of U.S. firms from disclosing nonpublic information to select investors including institutions and financial analysts (see, for example, Gintschel & Markov, 2004; Ke et al., 2008), we deliberately limit our sample period to the post–Regulation FD period to ensure that our results are not driven by transient institutions obtaining management’s private information directly or indirectly (e.g., via sell-side analysts). 3
We focus on small negative surprises because the extant academic literature (see, for example, Bhojraj, Hribar, Picconi, & McInnis, 2009; Donelson et al., 2009; Graham, Harvey, & Rajgopal, 2005; Grundfest & Malenko, 2009) and business press (see, for example, Opdyke, 2001) document that many CEOs of publicly traded U.S. firms are willing to sacrifice long-term firm value to avoid reporting small negative earnings surprises. One frequently cited explanation for management’s avoidance of small negative earnings surprises is the concern that transient institutions would misinterpret even an innocuous small negative earnings surprise as a sign of bad news (e.g., Fox, 1997; Frankel et al., 2010; Graham et al., 2005). Many CEOs fear that transient institutions’ indiscriminant selling upon small negative earnings surprises would cause unwarranted stock price drops and increased stock return volatility (Graham et al., 2005; Opdyke, 2001). Our study directly tests the validity of this common managerial allegation.
To determine the degree of sophistication with which transient institutions react to announcements of small negative earnings surprises, we examine three interrelated research questions. Our first question examines how transient institutions trade in reaction to announcements of small negative earnings surprises. To mitigate the effects of confounding events on institutional investors’ trading, we focus on transient institutions’ trading on the day immediately following the quarterly earnings announcement (denoted as Event Day 0). 4
Our second question examines whether transient institutions’ trading in reaction to small negative earnings surprises is positively associated with the abnormal stock return on Event Day 0. While it is difficult to directly demonstrate the causal impact of transient institutions’ trading on stock prices, a positive contemporaneous association between transient institutions’ trading and the abnormal return is a necessary condition for transient institutions’ trading to move stock prices.
Our third question examines whether transient institutions’ trading on Event Day 0 represents an overreaction or a rational response to announcements of small negative earnings surprises. If transient institutions’ trading on Event Day 0 is an overreaction that results in short-term stock undervaluation, future stock prices would reverse, and thus we should expect transient institutions’ trading on Event Day 0 to be negatively correlated with the subsequent abnormal stock return. However, if transient institutions’ trading on Event Day 0 represents a rational response, it should not be negatively correlated with the subsequent abnormal stock return. Furthermore, to the extent that contemporaneous stock prices do not fully reflect the private information contained in transient institutions’ stock trades on Event Day 0, transient institutions’ stock trading should be positively correlated with the subsequent abnormal stock return. This is because transient institutions’ private information should be gradually reflected in stock prices through future information revelation.
With regard to our first research question, we find the following main results. First, transient institutions do sell intensively in reaction to announcements of small negative earnings surprises. Second, transient institutions’ selling in response to small negative earnings surprises is almost twice as large as their selling in response to −2-cent earnings surprises. This finding is consistent with management’s allegation that transient institutions overreact to small negative earnings surprises. Third, transient institutions’ selling in reaction to small negative earnings surprises is primarily driven by growth (i.e., low book-to-market) firms. We find no evidence that transient institutions sell significantly in reaction to announcements of value firms’ small negative earnings surprises. Therefore, we focus on growth firms in the following tests of our second and third research questions. 5
With regard to our second research question, we find that transient institutions’ trading in reaction to small negative earnings surprises is positively correlated with contemporaneous abnormal stock returns. This evidence is consistent with the management’s perception that transient institutions’ trading has a material impact on contemporaneous stock prices.
With regard to our third research question, we find no evidence that transient institutions’ selling in reaction to small negative earnings surprises is an overreaction. Specifically, transient institutions’ trading on Event Day 0 is not negatively correlated with future abnormal stock returns in the 3 or 6 months subsequent to the earnings announcement dates. To the contrary, we find that transient institutions’ trading in reaction to small negative earnings surprises is positively associated with the subsequent abnormal returns, suggesting that transient institutions’ selling on Event Day 0 is informed, and stock prices on Event Day 0 do not fully incorporate the private information contained in transient institutions’ stock trades. 6 Overall, our results suggest that transient institutions have an independent information acquisition and processing ability and know how to correctly interpret small negative earnings surprises.
As part of our third research question, we assess the impact of transient institutions’ stock trading on Event Day 0 on the speed with which stock prices reflect the value implications of small negative earnings surprises. Specifically, for each small negative earnings surprise observation, we compute the ratio of abnormal return on Event Day 0 to the abnormal return from Event Day 0 up to 3 months subsequent to the earnings announcement date (denoted as RATIO). For the top (i.e., buy) and bottom (i.e., sell) deciles of transient institutions’ trading on Event Day 0 in reaction to small negative surprises, the median RATIO is 22% and 44%, respectively. In contrast, for the remaining deciles, the median RATIO is only 8%, significantly smaller than the median RATIO for the top and bottom deciles. This evidence suggests that transient institutions’ trading on Event Day 0 helps improve the efficiency of stock prices with regard to small negative earnings surprises. 7 Taken together, our findings suggest that transient institutions’ trading behavior in response to public financial disclosures plays an important role in improving market efficiency.
The rest of the article is organized as follows. The “Literature on Transient Institutions’ Use of Accounting Information” section provides a review of the literature on transient institutions’ use of accounting information. The “Data Sources, Sample Selection Procedures, and Descriptive Statistics” section discusses the data sources, sample selection procedures, and descriptive statistics. The “Transient Institutions’ Trading Reactions to Small Negative Earnings Surprises” section presents the analysis of transient institutions’ trading in reaction to small negative earnings surprises. “The Contemporaneous Association Between Transient Institutions’ Trading in Reaction to Small Negative Earnings Surprises and Abnormal Stock Returns on Event Day 0” section shows the results on the contemporaneous association between transient institutions’ trading and the abnormal stock returns on Event Day 0. “The Association Between Transient Institutions’ Trading in Reaction to Small Negative Earnings Surprises and Future Abnormal Returns” section discusses the results on the association between transient institutions’ trading in reaction to small negative earnings surprises and the abnormal stock returns subsequent to the earnings announcement dates. The “Further Analyses of Transient Institutions’ Trading Behavior” section reports transient institutions’ regression results using alternative definitions of transient institutions’ trading response to small negative earnings surprises. The “Conclusion” section concludes.
Literature on Transient Institutions’ Use of Accounting Information
As noted in the “Introduction” section, there are two contrasting views on transient institutions in the extant literature, referred to as the sophisticated investor view and myopic investor view, respectively. While the sophisticated investor view is fairly easy to understand, the myopic investor view deserves more explanations because it is contrary to the common perception of institutional investors.
The existing literature offers several nonmutually exclusive explanations for the alleged myopic trading behavior of transient institutions. One explanation is that many transient institutions are simply naïve traders who do not know how to interpret accounting information, and therefore they would always interpret all small negative earnings surprises as bad news. While strong, this view is shared by a significant number of corporate executives surveyed by Graham et al. (2005). Barras, Scaillet, and Wermers (2010) also find that a large percentage of the managers for actively managed U.S. domestic equity mutual funds are unskilled as evidenced by their funds’ significant underperformance even before considering fund management fees.
Another explanation for transient institutions’ myopic trading behavior is herding. 8 The extant literature suggests at least two nonmutually exclusive reasons why transient institutions herd. The first reason is transient institutions’ reputation concerns arising from the uncertainty about their investment skills (see Scharfstein & Stein, 1990). Because making a bold investment decision that turns out to be bad is costly to the reputation of transient institutions, especially those who are young and inexperienced (see, for example, Chevalier & Ellison, 1999), transient institutions have an incentive to herd to preserve the uncertainty about their investment skills and avoid being fired or adversely affected in annual performance evaluations. The second reason for transient institutions’ herding is lack of private information. Both Bikhchandani, Hirshleifer, and Welch (1992) and Graham (1999) show that herding decreases with the precision of a decision maker’s private information. The extant literature (e.g., Chevalier & Ellison, 1999; Choi & Sias, 2009; Graham, 1999; Sias, 2004; Wermers, 1999) finds that institutional investors herd, especially those who actively manage their investment portfolios (e.g., mutual fund managers). However, there is no clear consensus on whether institutional investors’ herding increases or decreases stock market efficiency (see, for example, Brown, Wei, & Wermers, 2013; Puckett & Yan, 2008; Wermers, 1999).
A third explanation for transient institutions’ myopic trading behavior is the destabilizing rational speculation hypothesis proposed by De Long, Shleifer, Summers, and Waldmann (1990). According to this hypothesis, transient institutions are sophisticated investors who know how to interpret publicly available financial information such as small negative earnings surprises. However, there are some noise traders (e.g., individuals) who overreact to publicly available financial information. Due to limits to arbitrage, transient institutions may find it costly to trade against the noise traders. Instead, they may find it optimal to jump on the bandwagon and sell ahead of the noise traders. Transient institutions’ early selling could create a stock price momentum that would trigger noise traders’ positive-feedback trading, thereby amplifying the stock price’s initial decline and subsequent reversal in reaction to the financial information. Brunnermeier and Nagel (2004) find evidence consistent with the destabilizing rational speculation hypothesis for a sample of hedge funds during the technology bubble in the later 1990s.
The extant literature provides mixed evidence on whether institutional investors help move stock prices toward fundamental value as predicted by the sophisticated investor view or drive stock prices away from fundamental value as predicted by the myopic investor view. Papers supporting the sophisticated investor view include Walther (1997); Wermers (1999); Bartov, Radhakrishnan, and Krinsky (2000); Ali, Durtschi, Lev, and Trombley (2004); Sias (2004); Ke and Petroni (2004); and Ke and Ramalingegowda (2005); among others. Papers supporting the myopic investor view of institutional investors include Harris and Gurel (1986); Bushee (2001); Dennis and Strickland (2002); Brunnermeier and Nagel (2004); Puckett and Yan (2008); Gutierrez and Kelley (2009); Dasgupta, Prat, and Verardo (2011); and Lewellen (2011); among others. Dasgupta et al. find that the myopic behavior of institutional investors appears to have become more severe in the second half of their sample period (1994-2004) than in the first half (1983-1993). They attribute this result to the unprecedented growth in the delegated portfolio management industry during their sample period. Similarly, after analyzing the returns and stock holdings of institutional investors over 1980-2007, Lewellen concludes that institutional investors possess little stock picking skills, in particular in the period after 2000, which coincides with the passage of Regulation FD.
With regard to earnings announcements, the extant literature (e.g., Hand, 2002; Kinney, Burgstahler, & Martin, 2002; Skinner & Sloan, 2002) finds no evidence that on average stock prices overreact to small negative earnings surprises. However, the sample periods considered in these earlier studies predate the passage of Regulation FD. It is possible that transient institutions are no longer able to correctly interpret small negative earnings surprises in the post–Regulation FD period when they lost access to management’s private information (Ke et al., 2008). In addition, these studies do not condition their analyses on transient institutions’ trades, which is important in assessing the price impact of transient institutions because transient institutions do not invest in all firms and may not always sell in reaction to small negative earnings surprises. Hence, we believe that it is an open question whether stock prices would overreact to small negative earnings surprises when there is significant selling by transient institutions.
One important limitation of the extant institutional investor literature is that most studies do not distinguish between two sources of transient institutions’ sophistication: superior access to management’s private information versus independent information acquisition and processing ability. Notable exceptions are Ke and Petroni (2004) and Ke et al. (2008). Using a sample period prior to the effective date of Regulation FD, Ke and Petroni show that transient institutions have the ability to predict a break in a string of consecutive quarterly earnings increases at least one quarter in advance of the break quarter. They further show that transient institutions’ predictive ability is limited to firms that hold regular conference calls with analysts and institutions. As conference calls are a common channel through which management communicate their private information to select investors such as analysts and institutions in the pre–Regulation FD period, their evidence suggests that transient institutions’ predictive ability is due to their access to management’s private information. Ke et al. use the same setting of earnings string breaks but investigate transient institutions’ predictive ability before versus after Regulation FD. While they find similar results to Ke and Petroni in the pre–Regulation FD period, they fail to document similar findings in the post–Regulation FD period. Ke et al.’s findings imply that Regulation FD has been effective in curtailing transient institutions’ access to management’s private information.
However, it is difficult to infer from Ke and Petroni (2004) and Ke et al. (2008) whether transient institutions possess an independent information acquisition and processing ability. This is because most prior studies including Ke and Petroni and Ke et al. only have access to the quarterly institutional ownership data from Spectrum. 9 As noted by Chen (2007) and Campbell et al. (2009), using the quarterly institutional ownership change as a proxy for institutional investors’ trading reactions to earnings announcements is problematic for two reasons. First, earnings announcement is not the only news event during a quarter, and thus any contemporaneous relation between quarterly earnings surprises and quarterly institutional ownership changes could be driven by institutional investors’ reaction to other correlated omitted events. Second and more importantly, the quarterly institutional ownership change does not distinguish institutional investors’ trading prior to an earnings announcement from their trading subsequent to the earnings announcement. While institutional investors’ selling subsequent to the announcement of a small negative earnings surprise may be an overreaction that could result in short-term mispricing, institutional investors’ trading prior to the earnings announcement could be due to their superior private information about the forthcoming earnings announcement and thus should not be viewed as an overreaction. We show in the “Further Analyses of Transient Institutions’ Trading Behavior” section that using transient institutions’ ownership change over the entire quarter of the earnings announcement as a proxy for their trading reactions to earnings announcements would lead to significantly different conclusions.
Data Sources, Sample Selection Procedures, and Descriptive Statistics
Data Sources and Sample Selection Procedures
Our initial sample of institutional investors’ stock trading records is provided by the Abel/Noser Corporation, a leading equity trading execution quality measurement service provider for institutional investors, for the period January 1, 1999, to December 31, 2005. 10 The Abel/Noser database includes all the trades of the included money managers. For each stock trade made by an institution, the Abel/Noser database discloses the clientcode (a numeric ID for the institution), date of execution, stock traded, number of shares executed, execution price, and whether the trade is a buy or sell. Although the Abel/Noser database contains the time stamps of the institutional stock trades, they are not reliable and thus not used to construct our institutional trading variable.
As the Abel/Noser database does not contain institutions’ stock holding data, we cannot rely on the Abel/Noser database alone to identify transient institutions. Hence, we use Bushee’s (1998, 2001) institutional investor classifications which are available for all institutions in Spectrum. Bushee (1998, 2001) classifies all institutional investors in Spectrum into three types, denoted as transient, dedicated, and quasi-indexing institutions. Transient institutions have high-portfolio turnover and a diversified portfolio. Dedicated institutions have low turnover and more concentrated portfolio holdings, whereas quasi-indexing institutions have low turnover and diversified portfolio holdings. By construction, transient institutions are expected to trade on short-term earnings news more frequently than the other two types of institutions (see Ke & Petroni, 2004), but this fact does not necessarily imply that transient institutions would misreact to earnings news. Bushee performs the institutional investor classification annually, but each institution’s classification is highly stable over time with a year-to-year correlation of greater than .80. Therefore, we assign each institution to the type that is the most frequent over the maximum available sample period 1979-2005 in Spectrum.
Unlike Spectrum, Abel/Noser does not disclose institutional investors’ stock holdings at any time. In addition, to protect the privacy of the firm’s clients, Abel/Noser does not disclose the names of its institution clients nor provide a link between the clientcode and mgrnum (the institution ID used in Spectrum). Therefore, we use a self-created algorithm to link the institution ID in the Abel/Noser database with the institution ID in Spectrum (see the Online Appendix for the details). As shown in Table 1, we are able to find matches for 103 institutions in the Abel/Noser database, representing approximately 70% of the Abel/Noser database in terms of either the dollar value of shares traded or the number of shares traded over 1999-2005.
Descriptive Statistics of the 103 Matched Institutions by the Institution Types Over the Period 1999-2005.
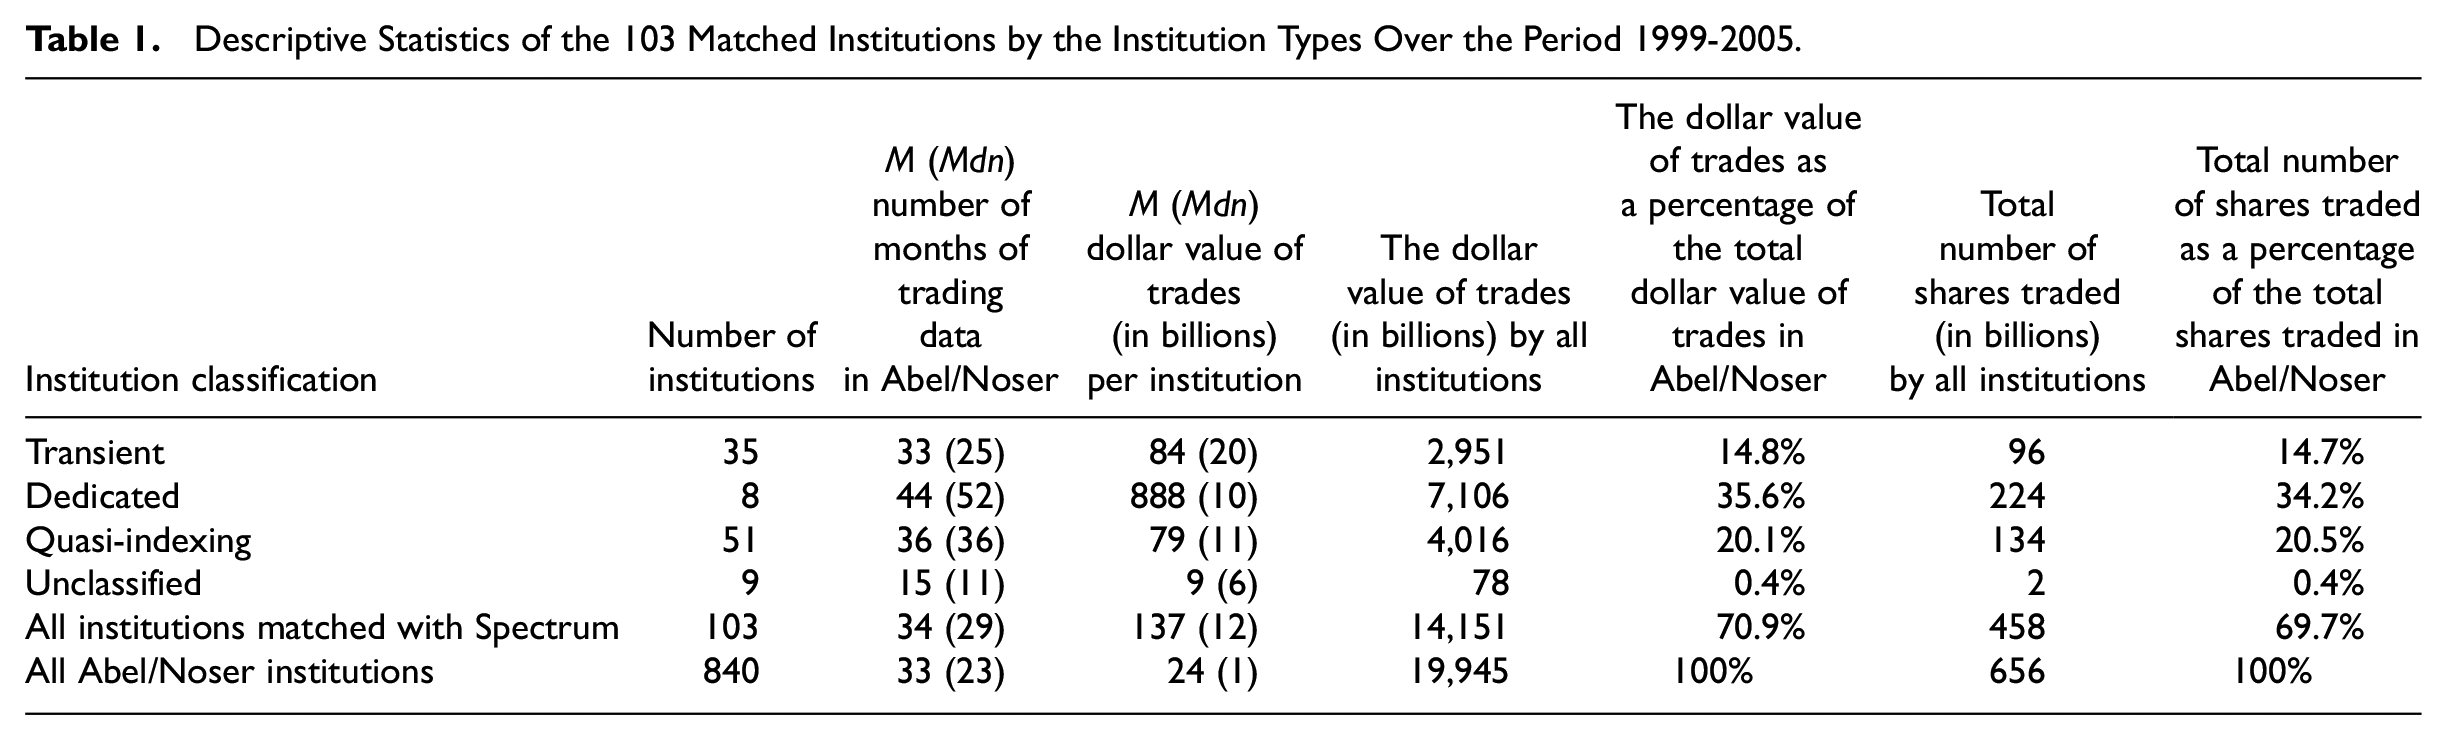
Among the 103 matched institutions, 35 are transient, eight dedicated, and 51 quasi-indexing (see Table 1). Nine of the 103 institutions do not have Bushee’s classifications and thus will be dropped in subsequent analyses. As shown in Table 1, the nine dropped institutions represent a negligent portion of our sample in terms of trading volume. 11
We obtain the quarterly earnings announcements over the same time period 1999-2005 (including the fourth fiscal quarter) from the Institutional Brokers’ Estimate System (IBES). We limit the sample to U.S. common stocks only (Center for Research in Security Prices [CRSP] share code = 10 or 11) that have made timely earnings announcements (i.e., within 45 days after the fiscal quarter-end for Fiscal Quarters 1 to 3 and within 90 days after the fiscal year-end for the fourth fiscal quarter), and have nonmissing analysts’ consensus (i.e., mean) earnings forecasts issued no later than approximately 1 calendar month prior to the earnings announcement date. We exclude non-U.S. firms because they are not subject to Regulation FD (though some foreign firms may be subject to similar rules in their home countries). We exclude delayed earnings announcements to avoid potential complications associated with such delays. Those restrictions result in a sample of 78,576 quarterly earnings announcements over 1999-2005.
Because we do not have reliable time stamps of institutional investors’ stock trades, we cannot determine the timing of institutional trades relative to the timing of the earnings announcements that occurred during the normal trading hours. Hence, we further require all the earnings announcements to occur either before the market opening or after the market closing. We obtain the time stamps of the earnings announcements from Thomson Financial’s StreetEvents database, which is also used by the Wall Street Journal. 12 We retained 44,665 (56.8%) out of the 78,576 earnings announcements from IBES after this sample restriction. We lost 31,708 earnings announcements due to missing earnings announcement time stamps from StreetEvents and 2,203 (about 4.7% of all earnings announcements with valid time stamps) earnings announcements that are made during normal trading hours. Although we lost almost half of the earnings announcements, our final sample does not appear to be severely biased because the distribution of the earnings surprises is similar for the retained observations and the lost observations (untabulated).
The Final Sample
We merge the institutional investor stock transaction data (the unit of observation is a firm–institution–day) with the earnings announcements (the unit of observation is a firm quarter) to create the final sample used to calculate institutional investors’ trading in response to earnings announcements. Specifically, we link each earnings announcement to each of the 103 institutions, including the institutions that have no trading records around the firm’s earnings announcement per Abel/Noser. That is, if an institution has no trading records around the earnings announcement in a firm quarter, we create new observations for the days around the earnings announcement and temporarily code the value of the stock trade to be missing for the new observations. The unit of observation in the merged sample is a firm–institution–day.
There are several reasons why not all of the 103 institutions have trading observations in the days around all the earnings announcements. First, some institutions entered the Abel/Noser database after 1999 (the first year of our sample) or exited the database before 2005 (the last year of our sample). Thus, these institutions’ trades prior to the entry or subsequent to the exit, even if they exist, are not recorded in the database. Clearly, it is incorrect to assume that there are no trades around the earnings announcements for those institutions. To control for this data truncation problem, we require each of the 103 institutions to have nonmissing trading observations in at least one firm in each of the 5 months centered around the earnings announcement month. The 5-month cutoff is arbitrarily selected, but we have no reason to believe that our inferences are sensitive to this cutoff.
Second, some firms are not on the radar screens of the 103 institutions, and thus we observe no stock trading records by the institutions in the days around those firms’ earnings announcements. Given the nature of our research questions, we believe that it is more appropriate to exclude such firm-quarter-institution observations from our analysis. As it is difficult to determine which firms are on an institution’s radar screen, we use the following sample restrictions as an approximation:
Delete the firm-quarter-institution trading observations associated with the earnings announcements whose total institutional ownership at the beginning of the earnings announcement quarter reported in Spectrum is less than 10% of the common shares outstanding. We assume that firms with low total institutional ownership are less likely to be watched by institutional investors.
Delete the firm-quarter-institution trading observations if the institutions never traded in the firm during our sample period per Abel/Noser. We assume that the firms that an institution never traded on during our entire sample period 1999-2005 are less likely to be on the watch list of that institution.
Third, for the remaining institutions whose stock trade values are missing for the days around the earnings announcements, we assume that the missing trading values are due to the institutions’ conscious decision not to trade and therefore are recoded as 0.
These additional sample restrictions reduce the sample from 44,665 to 42,779 earnings announcements. For firms that report negative earnings surprises, we further require each institution to have a nonzero stock ownership at the beginning of the earnings announcement quarter. We impose this restriction to mitigate the concern that institutions do not sell upon announcements of negative earnings surprises simply because they own no shares in those firms. This results in a final sample of 42,632 earnings announcements over the period January 1, 1999, to December 31, 2005, about 31,774 of which are announcements of nonnegative earnings surprises.
As the subsequent regression analyses will focus on transient institutions’ trading reactions to announcements of small negative earnings surprises in the post–Regulation FD period, we limit our regression sample of earnings announcements to the period January 1, 2001, to December 31, 2005, and exclude earnings surprises that are larger than 2 cents in magnitude. 13 The final sample used in later regression analyses contains 17,487 earnings announcements, 14,690 of which are announcements of nonnegative earnings surprises. 14
Descriptive Statistics of Institutional Ownership in Spectrum
Recall that the 103 institutions included in Table 1 represent only a portion of the institution population in Spectrum. To gain a sense of the economic significance of the institution population for our sample firms, Table 2 reports the descriptive statistics on the number of institutions (N), the stock ownership by all institutions (IO), and the average stock ownership per institution (AVE_IO) in Spectrum for our final regression sample of 17,487 earnings announcements over the period January 1, 2001, to December 31, 2005. The median number of institutions at the quarter-end is 41, 4, and 70 for transient, dedicated, and quasi-indexing institutions, respectively. The median total institutional ownership at the quarter-end is 14.94%, 6.79%, and 33.16% for transient, dedicated, and quasi-indexing institutions, respectively. The median of the average institutional ownership per institution is 0.38%, 1.36%, and 0.42% for transient, dedicated, and quasi-indexing institutions, respectively. These descriptive statistics suggest that both the number of institutions and total institutional stock ownership in a typical firm quarter in our sample are economically significant for transient institutions and quasi-indexing institutions. In addition, consistent with Bushee’s (2001) institution-type classification, the average quarter-end stock ownership per institution is lower for transient and quasi-indexing institutions than for dedicated institutions.
Descriptive Statistics of Institutional Ownership in Spectrum for the Firm Quarters in Our Final Sample Over 2001-2005 (N = 17,487).

Note. All the variables shown in this table are defined using the institutional investor data from Spectrum. N_TRANSIENT is the number of transient institutions at the end of a calendar quarter. IO_TRANSIENT is the stock ownership by all transient institutions at the end of a calendar quarter. AVE_IO_TRANSIENT is IO_TRANSIENT divided by N_TRANSIENT at the end of a calendar quarter. The other variables are defined in a similar fashion for dedicated institutions and quasi-indexing institutions, respectively.
Transient Institutions’ Trading Reactions to Small Negative Earnings Surprises
We first examine transient institutions’ trading on Event Day 0 (AVE_NETBUY) in reaction to announcements of small negative earnings surprises during the post–Regulation FD period (see the appendix for all variable definitions, including Event Day 0). 15 For benchmarking purposes, we also examine transient institutions’ trading responses to the following four adjacent earnings surprise categories: −2, 0, +1, and +2 cents. We do not consider the earnings surprises greater than +2 or less than −2 cents (referred to as large earnings surprises) because it is less meaningful to compare transient institutions’ trading reactions to small negative earnings surprises with their trading reactions to large earnings surprises. However, inferences are similar if we include the large earnings surprises in the analysis.
Panel A of Table 3 provides a univariate analysis of transient institutions’ average stock trading on Event Day 0 (AVE_NETBUY) across the five earnings surprise categories. To increase the readability of the descriptive statistics, AVE_NETBUY is multiplied by 1,000 in Table 3. We find that the mean AVE_NETBUY is significantly negative for both the −2-cent earnings surprises and small negative earnings surprises, and insignificantly different from 0 for the other three categories of earnings surprises. More importantly, the mean AVE_NETBUY is significantly more negative for the small negative earnings surprises than for the −2-cent earnings surprises (t test’s two-tailed p = .027). These univariate statistics are consistent with management’s allegation that transient institutions sell intensively in reaction to announcements of small negative earnings surprises.
Regression Results of Transient Institutions’ Trading in Reaction to Announcements of Small Earnings Surprises.
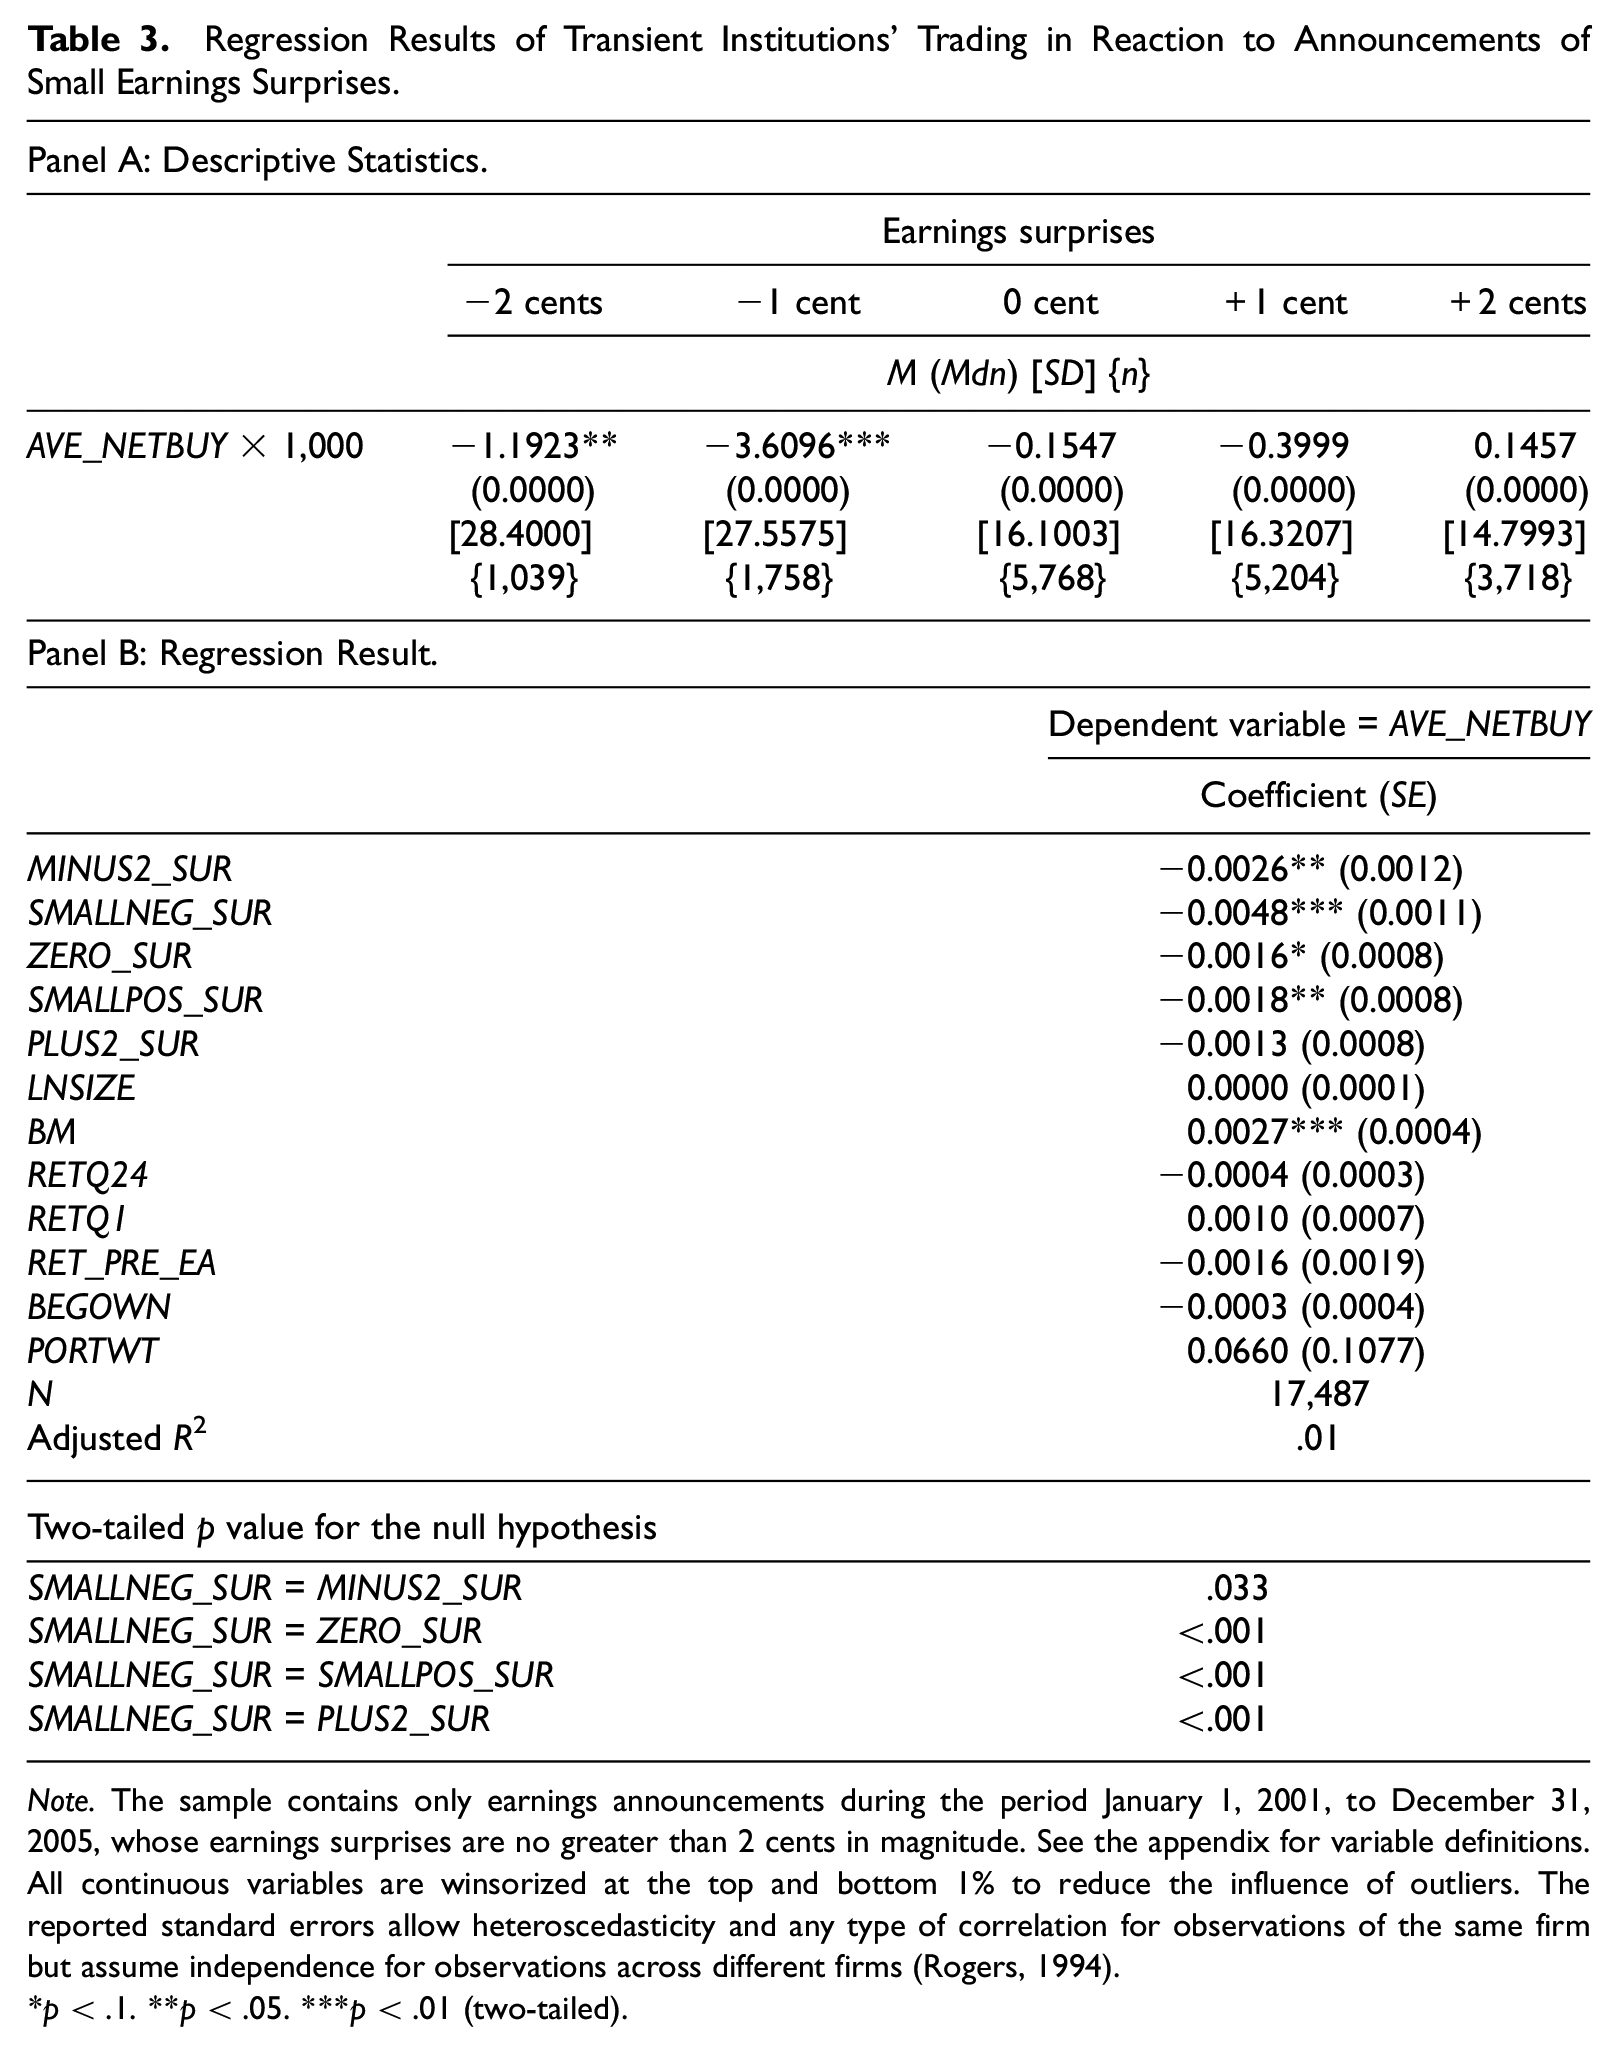
Note. The sample contains only earnings announcements during the period January 1, 2001, to December 31, 2005, whose earnings surprises are no greater than 2 cents in magnitude. See the appendix for variable definitions. All continuous variables are winsorized at the top and bottom 1% to reduce the influence of outliers. The reported standard errors allow heteroscedasticity and any type of correlation for observations of the same firm but assume independence for observations across different firms (Rogers, 1994).
p < .1. **p < .05. ***p < .01 (two-tailed).
To make sure that the differences in AVE_NETBUY between small negative earnings surprises and the other earnings surprise categories are due to the earnings announcement per se rather than other determinants of institutional trading, we also estimate the following ordinary least squares (OLS) regression model (firm and time subscripts are omitted for brevity):

We omit the intercept from Model 1 to avoid multicollinearity because the model includes all five earnings surprise categories. Following Ke and Petroni (2004), CONTROLS include LNSIZE, BM, and MOM, BEGOWN, PORTWT, RETQ1, and RETQ24 (see the appendix for detailed variable definitions). Following Easton and Zmijewski (1989), we also include RET_PRE_EA to control for the potential arrival of new information between analysts’ consensus forecast date and the earnings announcement date. All the continuous variables are winsorized at the top and bottom 1% to reduce the influence of outliers.
Panel B of Table 3 shows the regression results of Model 1. 16 The reported standard errors in this and subsequent tables allow heteroscedasticity and any type of correlation for observations of the same firm but assume independence for observations across different firms (Rogers, 1994). We also compute the standard errors and p values using the Fama and MacBeth (1973) method and obtain similar conclusion (untabulated).
Before discussing the regression results, we would like to note that the stand-alone coefficients on the five earnings surprise dummies are not meaningful to interpret because they represent the average transient institution selling for a very unique case (i.e., when all the control variables are set to 0). However, the coefficient difference between any two earnings surprise dummies can be easily interpreted. For example, the coefficient difference between SMALLNEG_SUR and MINUS2_SUR represents the difference in AVE_NETBUY between the two earnings surprise dummies after controlling for the other determinants of AVE_NETBUY. For this reason, we focus on the differences between the coefficient on SMALLNEG_SUR and the coefficients on the other earnings surprise dummies in the following discussion.
Consistent with the univariate results in Panel A of Table 3, the coefficient on SMALLNEG_SUR in Panel B of Table 3 is significantly more negative than the coefficients on the other four earnings surprise categories (two-tailed p = .033 or lower), suggesting that transient institutions sell significantly more in reaction to small negative earnings surprises than in reaction to the other four adjacent earnings surprises. 17 With the exception of the coefficient on BM, none of the coefficients on the control variables are significant.
Prior research shows that the stock market’s reactions to earnings surprises are stronger for growth firms than for value firms (see, for example, Skinner & Sloan, 2002). Hence, we also estimate Regression Model 1 for growth firms and value firms separately by dividing our sample into two halves based on the median BM. As shown in Table 4, transient institutions’ intensive selling in reaction to small negative earnings surprises in Table 3 is driven by growth firms. For growth firms, the differences in the coefficient on SMALLNEG_SUR and the coefficients on the other four earnings surprise dummies continue to be significant (two-tailed p < .001). For value firms, however, the differences are never significantly different from 0 (two-tailed p = .359 or higher). For this reason, we limit our subsequent empirical analyses to growth firms only, though inferences are similar if we use the full sample.
Regression Results of Transient Institutions’ Trading in Reaction to Announcements of Small Earnings Surprises: Growth Firms Versus Value Firms.

Note. The sample contains only earnings announcements during the period January 1, 2001, to December 31, 2005, whose earnings surprises are no greater than 2 cents in magnitude. Growth (value) firms refer to firms whose BM is less (greater) than the sample median. See the appendix for the other variable definitions. All continuous variables are winsorized at the top and bottom 1% to reduce the influence of outliers. The reported standard errors allow heteroscedasticity and any type of correlation for observations of the same firm but assume independence for observations across different firms (Rogers, 1994).
p < .1. **p < .05. ***p < .01 (two-tailed).
Prior research suggests that transient institutions often have advance knowledge of forthcoming earnings surprises and trade accordingly even prior to the earnings announcement date. Hence, there is a possibility that the differences in transient institutions’ trading response to small negative earnings surprises versus the other earnings surprise categories in Table 4 are due to the fact that transient institutions obtain private information about the other earnings surprises earlier and thus have traded prior to the earnings announcement date. To check this possibility, we run a model similar to Model 1 except that the dependent variable is transient institutions’ mean AVE_NETBUY over the calendar month prior to the earnings announcement date. As shown in Table 5, the coefficient on SMALLNEG_SUR is not significantly different from the coefficients on the other earnings surprise dummies. Therefore, there is no evidence that transient institutions learn of the news about the other four earnings surprises earlier than the news of the small negative earnings surprises. 18
Replication of Transient Institutions’ Regression in Column 1 of Table 4 Using AVE_NETBUY Defined Over the Month Prior to Event Day 0.
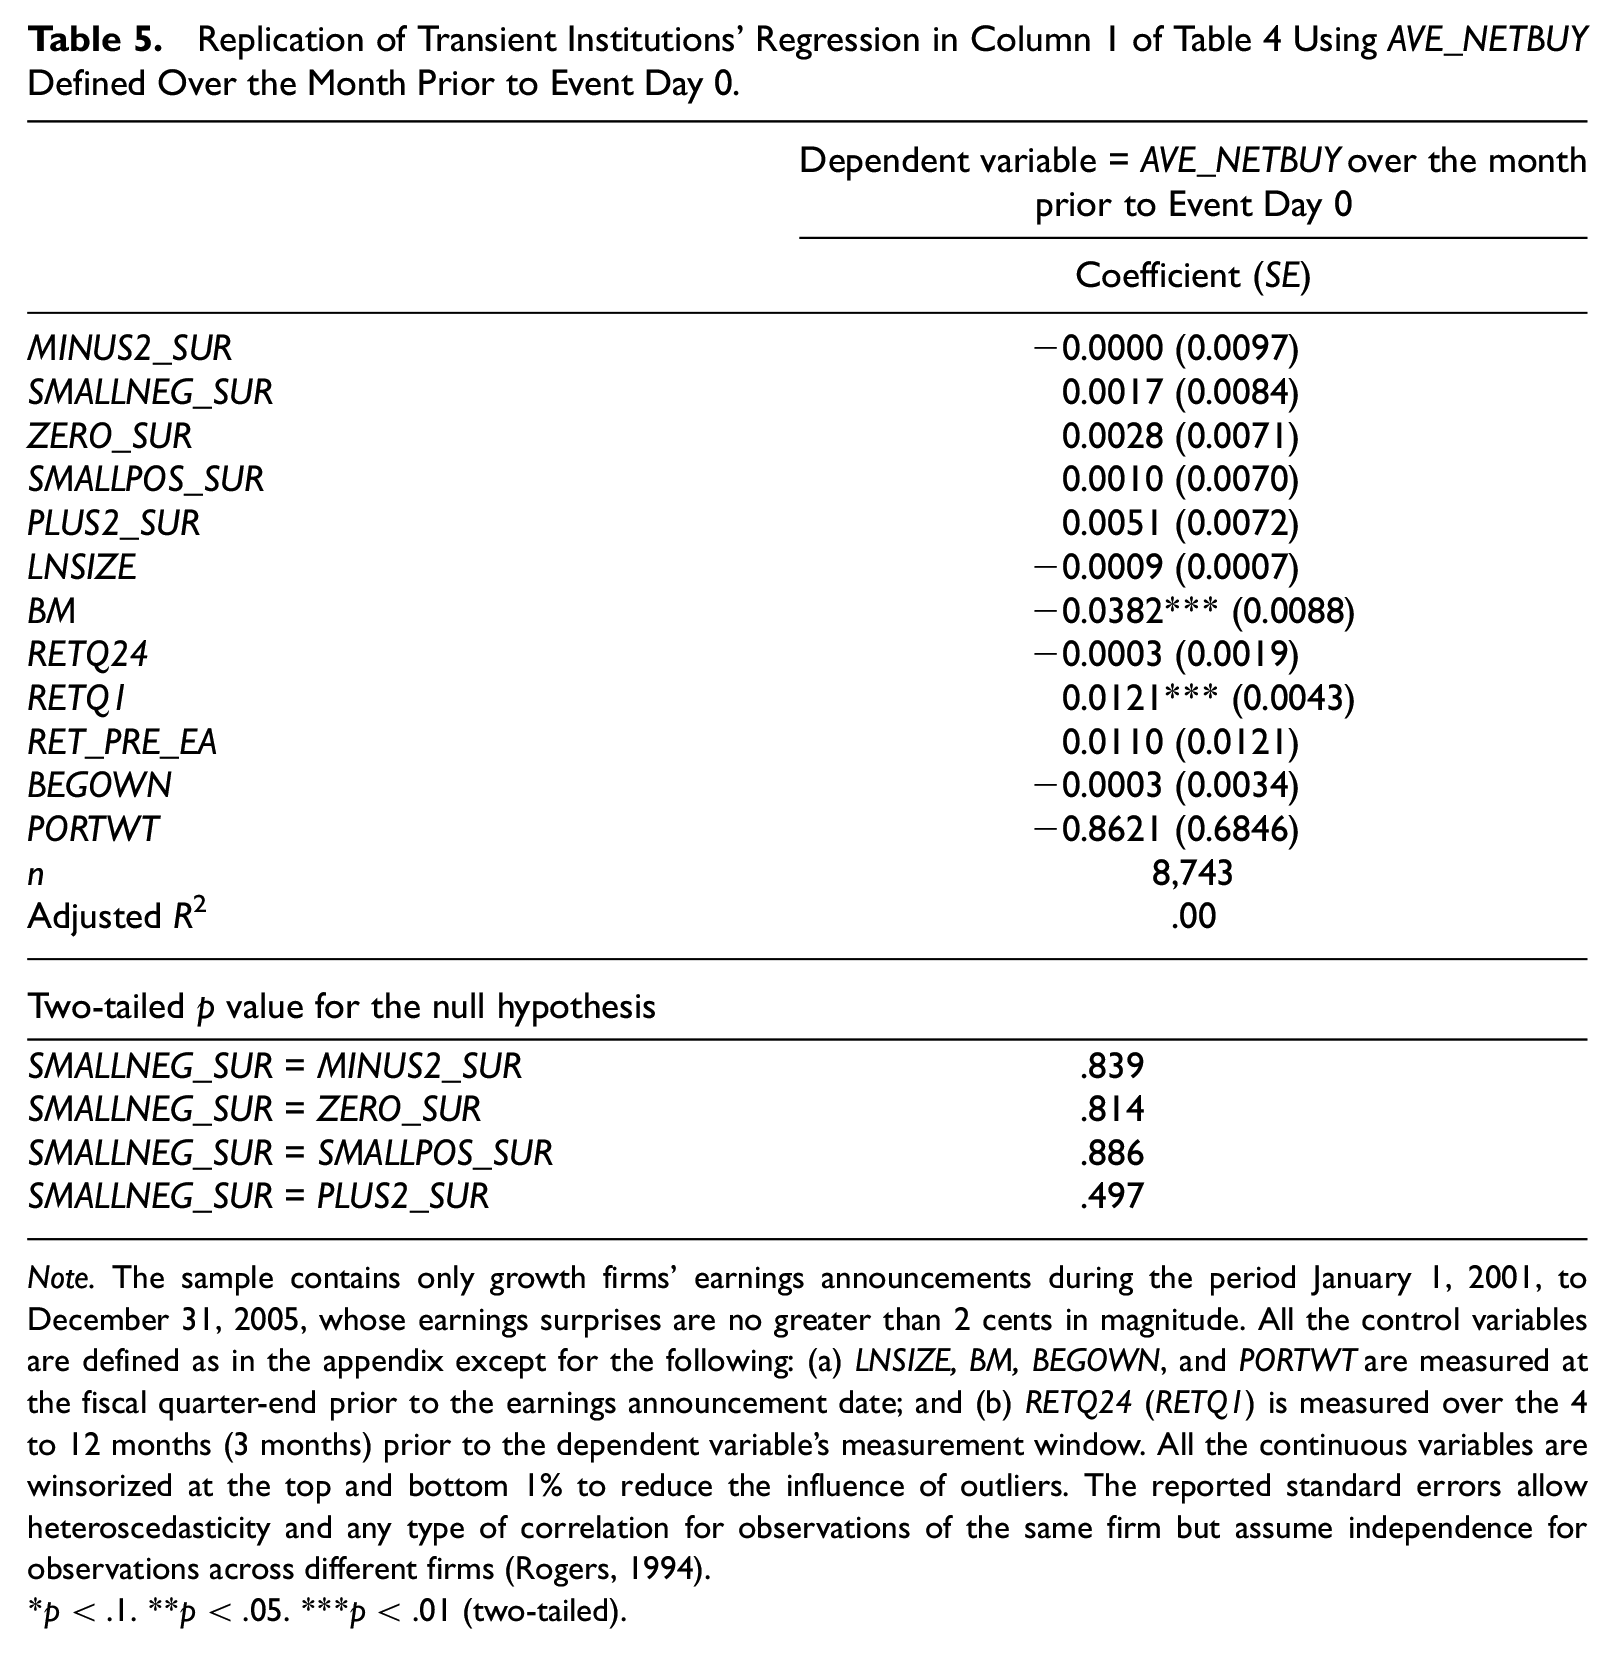
Note. The sample contains only growth firms’ earnings announcements during the period January 1, 2001, to December 31, 2005, whose earnings surprises are no greater than 2 cents in magnitude. All the control variables are defined as in the appendix except for the following: (a) LNSIZE, BM, BEGOWN, and PORTWT are measured at the fiscal quarter-end prior to the earnings announcement date; and (b) RETQ24 (RETQ1) is measured over the 4 to 12 months (3 months) prior to the dependent variable’s measurement window. All the continuous variables are winsorized at the top and bottom 1% to reduce the influence of outliers. The reported standard errors allow heteroscedasticity and any type of correlation for observations of the same firm but assume independence for observations across different firms (Rogers, 1994).
p < .1. **p < .05. ***p < .01 (two-tailed).
How economically significant is the selling by the population of transient institutions (including those not included in the Abel/Noser database) in reaction to small negative earnings surprises for growth firms in Table 4? To answer this question, we use two different benchmarks. First, for each transient institution included in the Abel/Noser database, we compute the institution’s net stock purchase in reaction to a small negative earnings surprise on Event Day 0 as a percentage of its stock ownership in the firm at the beginning of the quarter (denoted as NETBUY_PERCENTAGE). As a firm could be owned by multiple transient institutions, we compute the average NETBUY_PERCENTAGE across all transient institutions in the same firm quarter (denoted as AVE_NETBUY_PERCENTAGE). We assume that the distribution of AVE_NETBUY_PERCENTAGE based on the transient institutions included in the Abel/Noser database only is representative of the distribution of AVE_NETBUY_PERCENTAGE for the population of transient institutions who traded in these small negative earnings surprise quarters.
Second, for each of the growth firms’ small negative earnings surprise firm quarters in our sample, we directly estimate the total trading volume by the entire population of transient institutions (including those not in the Abel/Noser database) in reaction to a small negative earnings surprise as a percentage of the firm’s total trading volume on Event Day 0 (denoted as VOL_PERCENTAGE). Specifically, VOL_PERCENTAGE for a firm quarter is defined as the average daily trading volume of all the transient institutions included in the Abel/Noser database multiplied by the number of transient institutions in Spectrum (i.e., the population) divided by the firm’s entire daily trading volume. As we do not have the trading volumes of all transient institutions in the Spectrum population, we use transient institutions’ average daily trading volume in the Abel/Noser database as a proxy for the average daily trading volume for the transient institutions in Spectrum.
For all the growth firms’ small negative earnings surprise firm quarters, the mean AVE_NETBUY_PERCENTAGE is 13.3%. As a benchmark, the mean AVE_ NETBUY_PERCENTAGE is 9.99% for the −2-cent earnings surprises. The mean VOL_ PERCENTAGE is 22% for the growth firms’ small negative earnings surprise firm quarters. As a comparison, the mean VOL_PERCENTAGE on Event Day 0 is only 17% for the growth firms’ −2-cent earnings surprises. Overall, these two different comparisons suggest that transient institutions’ selling in reaction to growth firms’ small negative earnings surprises is economically significant.
The Contemporaneous Association Between Transient Institutions’ Trading in Reaction to Small Negative Earnings Surprises and Abnormal Stock Returns on Event Day 0
We use the following OLS regression model to test our second research question: whether transient institutions’ trading in reaction to small negative earnings surprises (AVE_NETBUY) is positively associated with the contemporaneous abnormal stock return on Event Day 0 (AR0):

See the appendix for all variable definitions. Consistent with Model 1, Regression Model 2 includes all five earnings surprise categories. 19 Accordingly, we omit the intercept to avoid perfect multicollinearity. The control variables in CONTROLS are the same as those for Model 1. All continuous variables are winsorized at the top and bottom 1% to reduce the influence of outliers.
As cautioned in the “Introduction” section, Regression Model 2 cannot be used to directly establish causality from transient institutions’ trading (AVE_NETBUY) to contemporaneous stock prices (AR0). However, if there is a causal effect of transient institutions’ trading on contemporaneous stock prices, we should observe a positive association between the two variables for each of the five earnings surprise categories. It is important to note that we do not expect the effect of transient institutions’ trading on contemporaneous stock prices to be different across the five earnings surprise categories, even though we focus on the coefficient on SMALLNEG_SUR × AVE_NETBUY in this article.
Panel A of Table 6 reports the descriptive statistics of AR0 by the earnings surprise categories. The mean AR0 is significantly positive (+0.93%) for the +2-cent earnings surprise category and significantly negative (−1.93%) for the −2-cent earnings surprise category. More importantly, the mean AR0 for the small negative earnings surprise category is also an economically significant −1.85%, comparable with the mean AR0 for the −2-cent earnings surprise category. The large negative AR0 for small negative earnings surprises may explain corporate managers’ belief that investors overreact to small negative earnings surprises. It is interesting to note that the mean AR0 is a significant −1.11% for the zero earnings surprise category. This finding is consistent with Hotchkiss and Strickland (2003) and Keung et al. (2010), and suggests that the stock market on average does not interpret meeting analysts’ consensus earnings forecasts as good news.
The Contemporaneous Association Between Transient Institutions’ Trading and the Abnormal Return on Event Day 0.

Note. The sample contains only growth firms’ earnings announcements during the period January 1, 1999, to December 31, 2005, whose earnings surprises are no greater than 2 cents in magnitude. See the appendix for variable definitions. All continuous variables are winsorized at the top and bottom 1% to reduce the influence of outliers. The reported standard errors allow heteroscedasticity and any type of correlation for observations of the same firm but assume independence for observations across different firms (Rogers, 1994).
p < .1. **p < .05. ***p < .01 (two-tailed).
Panel B of Table 6 shows the regression result of Model 2 for growth firms only. We cluster the standard errors by firm (Rogers, 1994). We also compute standard errors and p values using the Fama and MacBeth (1973) method and obtain similar conclusions (untabulated). Consistent with the hypothesis that transient institutions’ trading has a significant impact on stock prices, transient institutions’ trading on Event Day 0 is significantly positively associated with the contemporaneous abnormal return for all five earnings surprise categories. These results are consistent with management’s perception that transient institutions’ trading in reaction to earnings surprises (including small negative earnings surprises) moves contemporaneous stock prices.
The Association Between Transient Institutions’ Trading in Reaction to Small Negative Earnings Surprises and Future Abnormal Returns
We use the following OLS regression model to test our third research question: whether transient institutions’ selling in reaction to growth firms’ small negative earnings surprises on Event Day 0 represents an overreaction that would result in a reversal in future stock prices:

See the appendix for all the variable definitions. AVE_NETBUY refers to transient institutions’ net stock purchase on Event Day 0. The control variables are identical to those in Model 1. Again the intercept is omitted to avoid perfect multicollinearity. All continuous variables are winsorized at the top and bottom 1% to reduce the influence of outliers.
We measure FUTURE_AR over a 3-calendar month period starting 1 day after the earnings announcement date (i.e., Event Day 0) for two reasons. First, if there is a stock price overreaction on Event Day 0 that results in a subsequent reversal, we expect a significant portion (if not all) of the reversal to occur within 3 months. This is because U.S. companies are required to report earnings quarterly, and the arrival of new information should help correct the past overreaction. Second, if transient institutions’ trades on Event Day 0 contain private information that is not immediately reflected in stock prices on Event Day 0, the private information should be reflected (at least partially) in stock prices by the time of the next earnings announcement date. This is because prior research (e.g., Ali et al., 2004) shows that transient institutions’ private information is often short lived (e.g., next-quarter’s earnings). However, our inferences are robust to defining FUTURE_AR over 10-trading days or 6 calendar months (untabulated).
Our primary variable of interest is the coefficient on SMALLNEG_SUR × AVE_ NETBUY. If transient institutions have the independent ability to acquire and process private information regarding the quality of small negative earnings surprises, the coefficient on SMALLNEG_SUR × AVE_NETBUY should be either insignificant if contemporaneous stock prices fully reflect the private information contained in transient institutions’ AVE_NETBUY or significantly positive if contemporaneous stock prices do not fully reflect the private information contained in transient institutions’ AVE_NETBUY. However, if transient institutions’ trading on event day is an overreaction to small negative earnings surprises that results in short-term mispricing on Event Day 0, future stock prices would reverse, and thus the coefficient on SMALLNEG_SUR × AVE_NETBUY should be significantly negative. 20
Panel A of Table 7 reports the descriptive statistics of FUTURE_AR by the earnings surprise categories. To the extent that the mean AR0 reported in Panel A of Table 6 represents an overreaction, we should expect a significant reversal of the mean FUTURE_AR. Because the mean FUTURE_AR is never significantly different from 0 for any of the earnings surprise categories, we conclude that there is no evidence that stock prices on average overreact to small negative earnings surprises. As transient institutions do not always sell shares in response to all small negative earnings surprises, the mean FUTURE_AR may fail to detect transient institutions’ overreaction in some small negative earnings surprise cases where they sell significantly. Our Regression Model 3 directly addresses this concern by examining the association between transient institutions’ AVE_NETBUY and FUTURE_AR for the small negative earnings surprise category.
The Association Between Transient Institutions’ Trading Reactions to Small Negative Earnings Surprises on Event Day 0 and Future Abnormal Returns.
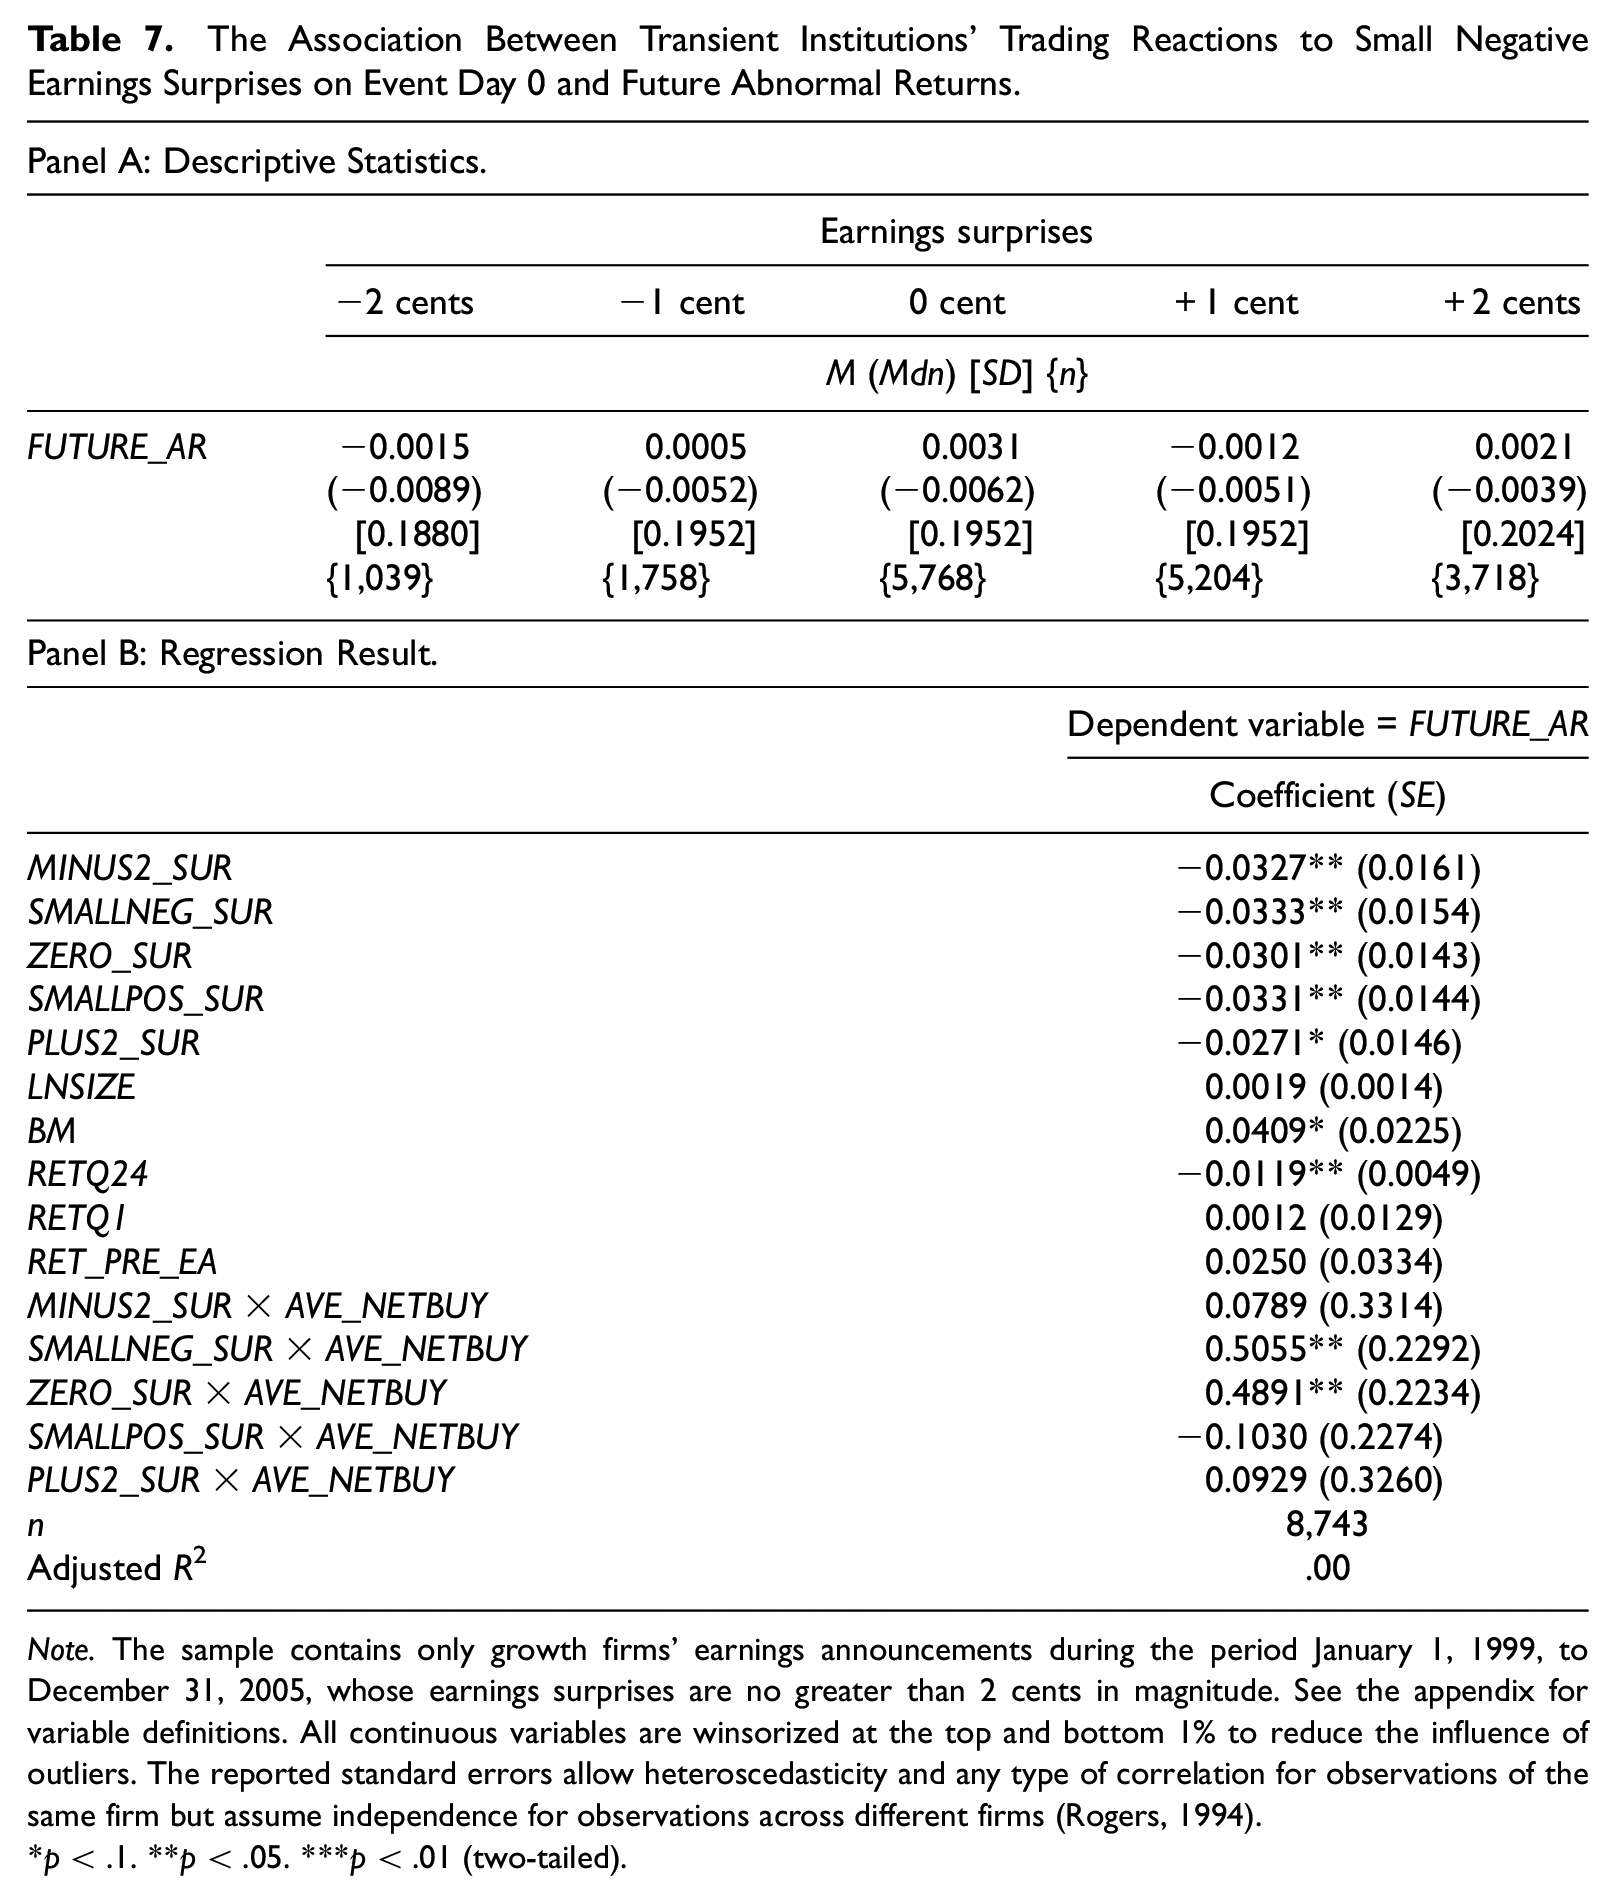
Note. The sample contains only growth firms’ earnings announcements during the period January 1, 1999, to December 31, 2005, whose earnings surprises are no greater than 2 cents in magnitude. See the appendix for variable definitions. All continuous variables are winsorized at the top and bottom 1% to reduce the influence of outliers. The reported standard errors allow heteroscedasticity and any type of correlation for observations of the same firm but assume independence for observations across different firms (Rogers, 1994).
p < .1. **p < .05. ***p < .01 (two-tailed).
Panel B of Table 7 shows the results of Regression Model 3 for growth firms only. We cluster the standard errors by firms (Rogers, 1994). We also compute standard errors and p values using the Fama and MacBeth (1973) method, and obtain similar conclusions (untabulated). There are three interesting findings. First, the coefficient on SMALLNEG_SUR × AVE_NETBUY is significantly positive, suggesting that transient institutions’ trading in reaction to small negative earnings surprises does not represent an overreaction as alleged by management. Rather, the positive coefficient on SMALLNEG_SUR × AVE_NETBUY suggests that transient institutions’ trades on Event Day 0 contain private information that is not fully reflected in the stock prices on Event Day 0. As noted before, such private information is unlikely to come from firm management because post–Regulation FD management of U.S. firms is barred from making selective disclosure. 21 In terms of economic significance, transient institutions’ 3-month mean buy-and-hold abnormal return weighted by the dollar value of AVE_NETBUY in reaction to small negative earnings surprises is a positive 2.6% (or approximately 10.2% annualized).
Second, the coefficient on ZERO_SUR × AVE_NETBUY is also significantly positive, suggesting that stock prices on Event Day 0 fail to fully reflect the private information contained in transient institutions’ stock trades on Event Day 0. The results for SMALLNEG_SUR × AVE_NETBUY and ZERO_SUR × AVE_NETBUY suggest that transient institutions carefully scrutinize both small negative and zero earnings surprises, and reply on their own independent information acquisition and processing ability to differentiate the quality of small negative and zero earnings surprises.
Third, the coefficients on the interactions between AVE_NETBUY and the remaining earnings surprise dummies are insignificant. Therefore, there is also no evidence that transient institutions’ trading in reaction to these earnings surprise categories is an overreaction. In addition, the evidence appears to suggest that stock prices fully reflect the private information (if any) contained in transient institutions’ AVE_NETBUY because there is no return drift subsequent to transient institutions’ trading.
The results in Table 7 suggest that transient institutions’ stock trading on Event Day 0 in reaction to small negative earnings surprises helps accelerate the speed with which stock prices reflect the value implications of small negative earnings surprise announcements. To directly quantify the impact of transient institutions’ trading reactions to small negative earnings surprises on stock price efficiency, we compute the ratio of abnormal return on Event Day 0 to the abnormal return from Event Day 0 up to 3 months subsequent to the earnings announcement date (denoted as RATIO) for each small negative earnings surprise observation. To limit the influence of extreme values, the values of RATIO are winsorized at 0 and 1. 22 The results are shown in Table 8 by the deciles of transient institutions’ trading on Event Day 0 (i.e., AVE_NETBUY). We combine the Deciles 2 and 9 into one because both the mean and median AVE_NETBUY is essentially 0 for the small negative earnings surprise observations in these combined Deciles 2 to 9. As the means could be influenced by outliers, we focus on the medians in the following discussions.
The Effect of Transient Institutions’ Trading on Event Day 0 on the Speed With Which Contemporaneous Stock Prices Reflect the Value Implications of Small Negative Earnings Surprise Announcements.

Note. The sample is limited to growth firms’ small negative earnings surprises in the period January 1, 1999, to December 31, 2005 (n = 818 earnings announcements). For each small negative earnings surprise observation, RATIO is defined as the ratio of abnormal return on Event Day 0 (i.e., AR0) to the abnormal return from Event Day 0 up to 3 months subsequent to the earnings announcement date (i.e., the sum of AR0 and FUTURE_AR). To limit the influence of extreme values, we limit the values of RATIO to be between 0 and 1. See the appendix for the other variable definitions.
For the top (i.e., buy) and bottom (i.e., sell) deciles of transient institutions’ trading on Event Day 0, the median RATIO is 22% and 44%, respectively. The median RATIO for the bottom decile is particularly striking, implying that transient institutions’ selling in reaction to small negative earnings surprises moves stock prices closer to fundamental value fairly quickly. In contrast, for the remaining combined Deciles 2 to 9 where there is little transient institutional trading, the median RATIO is only 8%, significantly smaller than the median RATIO for the top and bottom deciles. This evidence suggests that transient institutions’ trading on Event Day 0 helps accelerate the speed with which stock prices reflect the value implications of small negative earnings surprise announcements.
Further Analyses of Transient Institutions’ Trading Behavior
To reduce potential confounding events, our primary regression models focus on transient institutions’ trading on Event Day 0. As a robustness check, we replicate transient institutions’ regression results in Tables 4, 6, and 7 by redefining AVE_NETBUY over a 5-trading day window that starts from Event Day 0. As shown in Table 9, all of our inferences are qualitatively similar using this alternative AVE_NETBUY.
Replication of Regression Models 1, 2, and 3 for Growth Firms Using AVE_NETBUY Defined Over the Trading Days [0, +4] Around the Earnings Announcement Date.
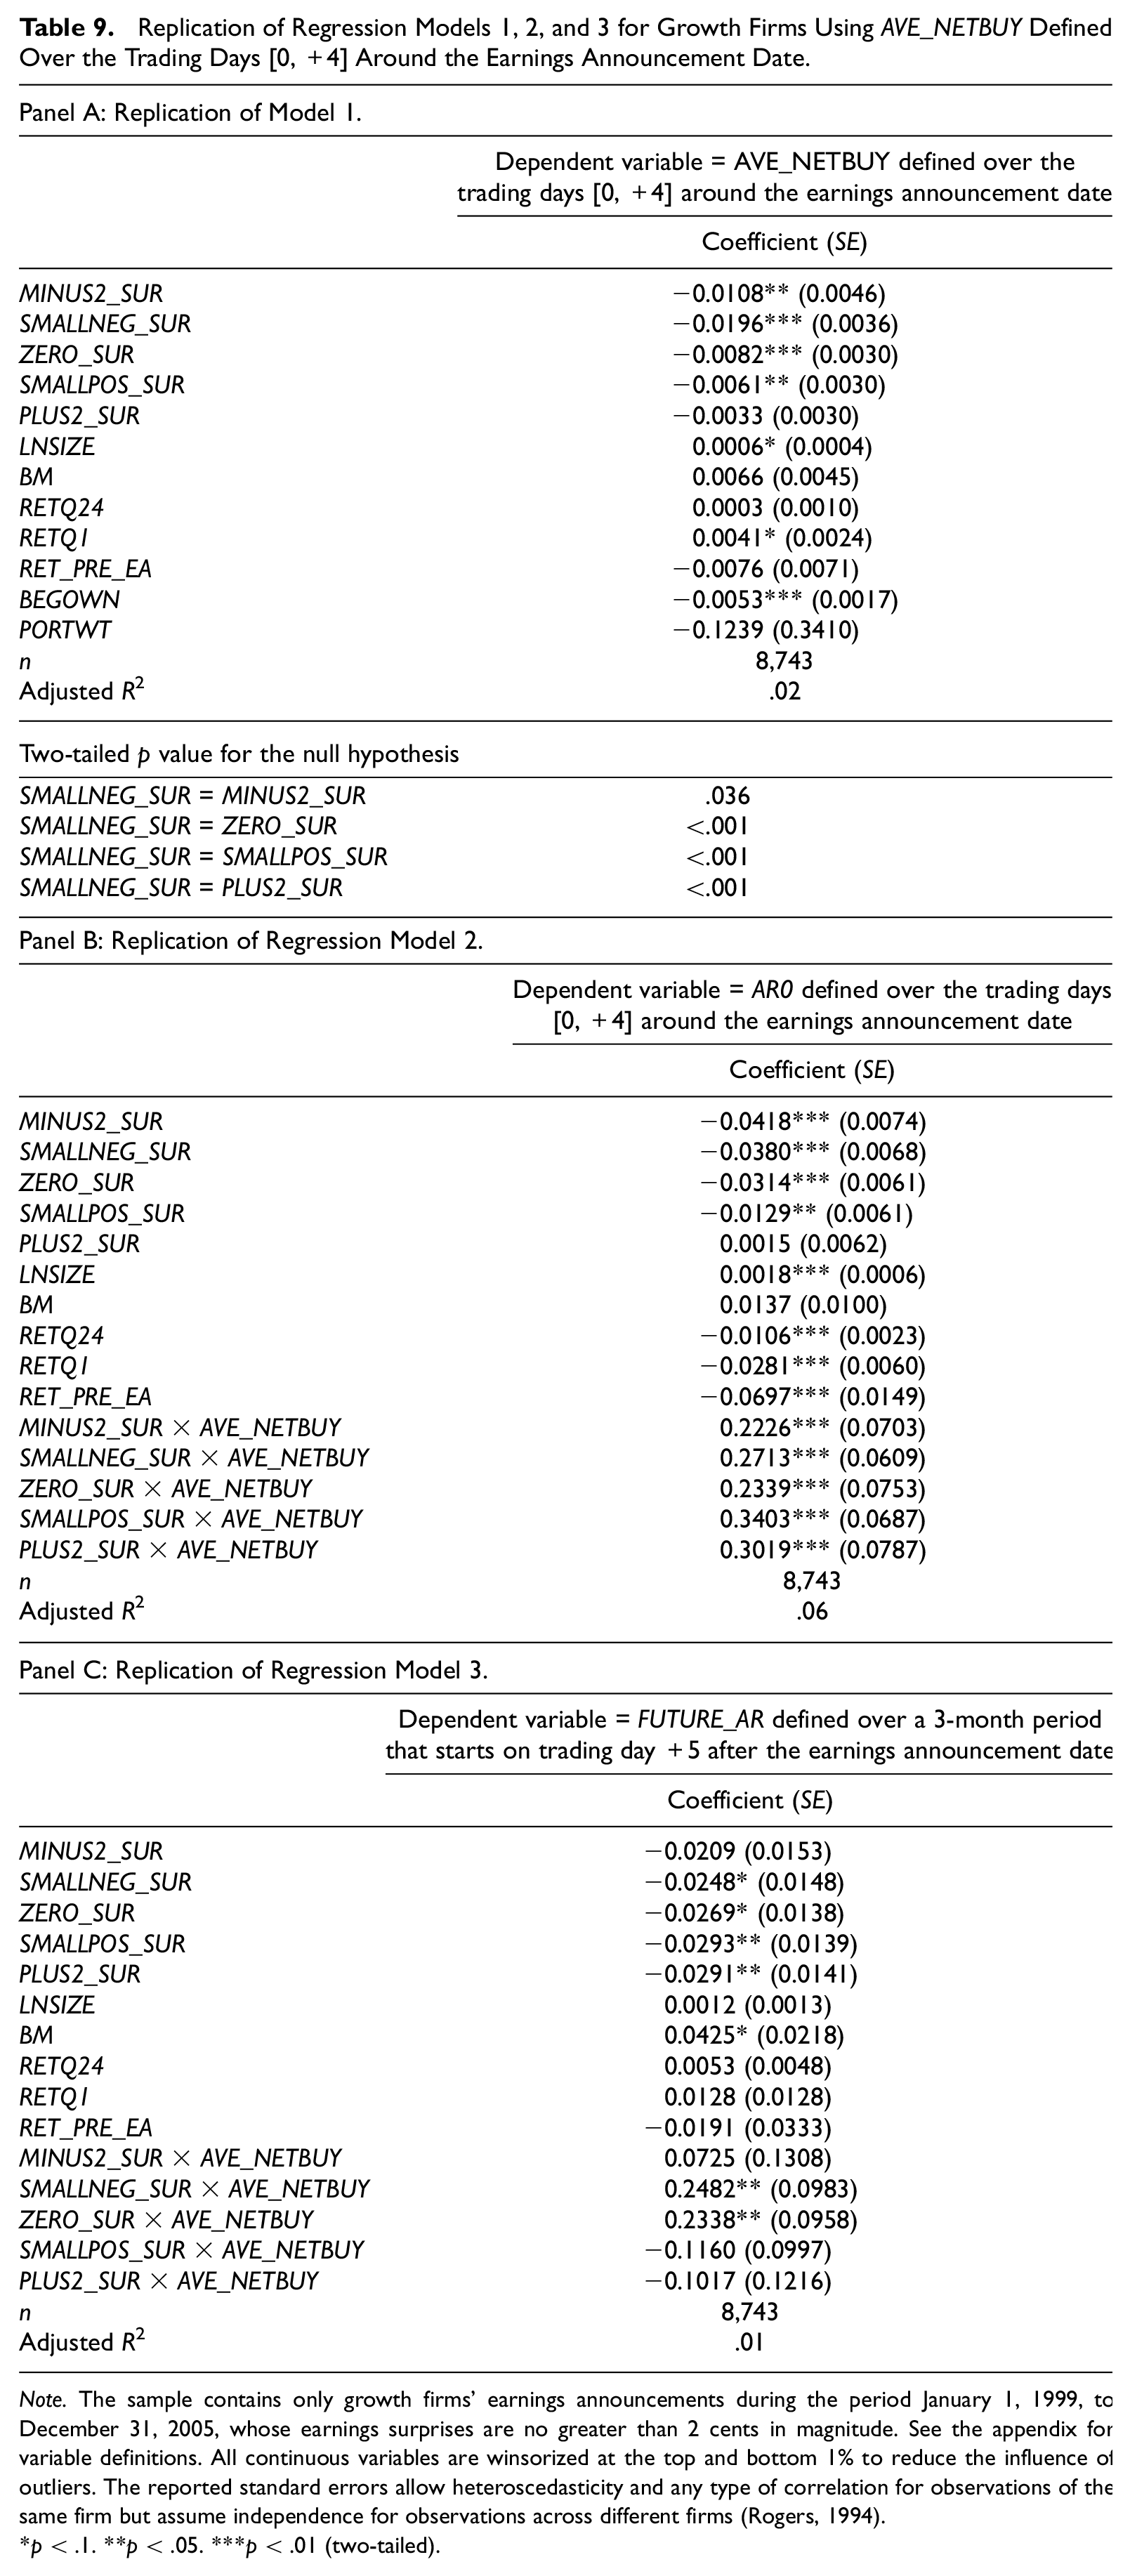
Note. The sample contains only growth firms’ earnings announcements during the period January 1, 1999, to December 31, 2005, whose earnings surprises are no greater than 2 cents in magnitude. See the appendix for variable definitions. All continuous variables are winsorized at the top and bottom 1% to reduce the influence of outliers. The reported standard errors allow heteroscedasticity and any type of correlation for observations of the same firm but assume independence for observations across different firms (Rogers, 1994).
p < .1. **p < .05. ***p < .01 (two-tailed).
We argue in the “Introduction” section that a key strength of this study is the availability of institutional investors’ daily stock transactions. Hence, a natural question one may ask is whether we can replicate transient institutions’ result for growth firms in Table 4 using AVE_NETBUY defined over the entire calendar quarter of the earnings announcement. As shown in Table 10, the coefficient on SMALLNEG_SUR using this alternative AVE_NETBUY definition is not significantly different from the coefficients on the other four earnings surprise dummies (two-tailed p = .342 or higher). These results are opposite to what we find in Table 4. Overall, the evidence in Table 10 suggests that using the quarterly transient institutional ownership change to measure transient institutions’ trading reactions to earnings surprise announcements is noisy at best and even leads to significantly different conclusions.
Replication of Regression Model 1 for Growth Firms Using AVE_NETBUY Defined Over the Calendar Quarter of the Earnings Announcement.
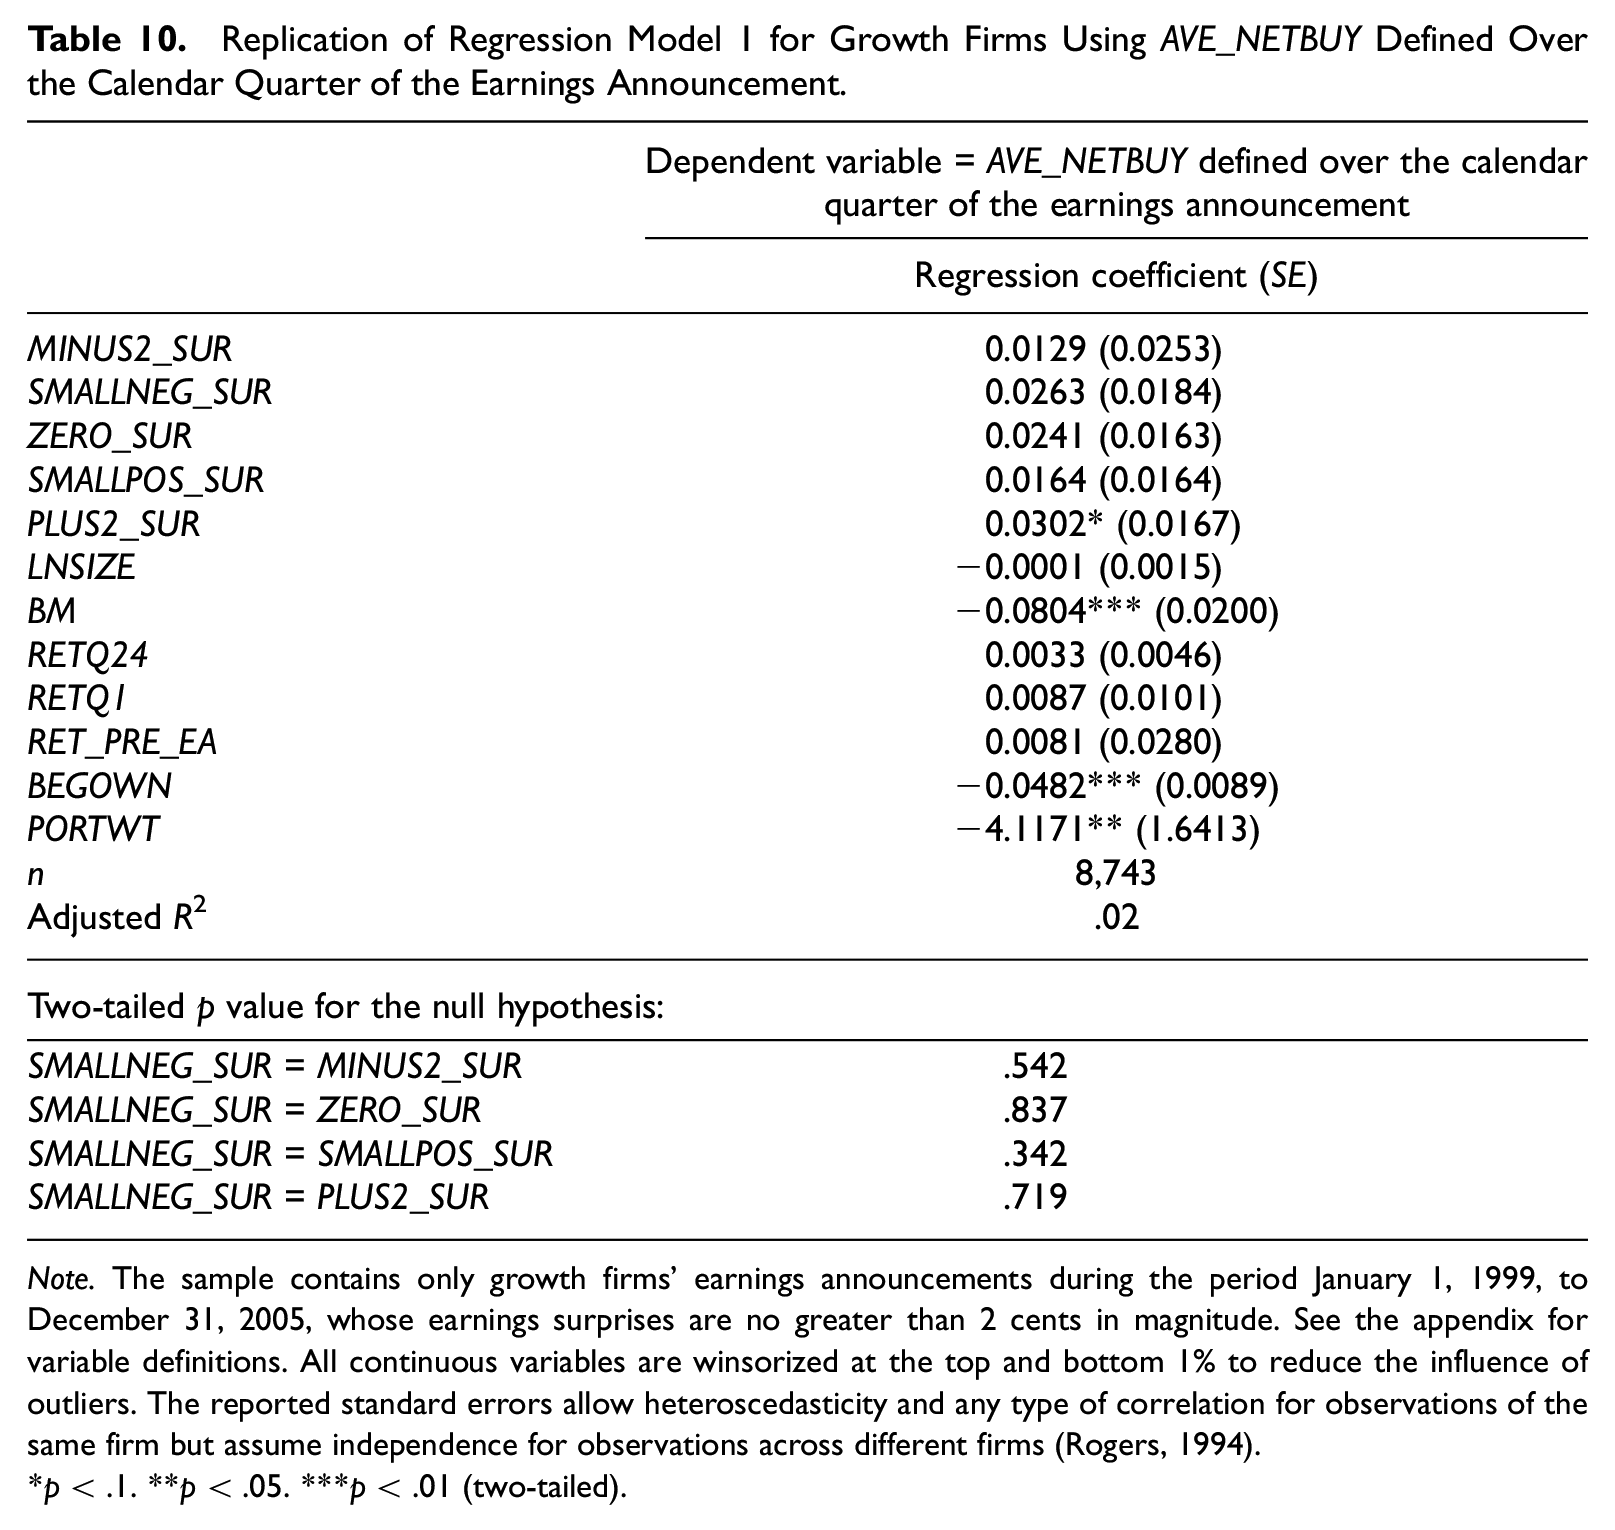
Note. The sample contains only growth firms’ earnings announcements during the period January 1, 1999, to December 31, 2005, whose earnings surprises are no greater than 2 cents in magnitude. See the appendix for variable definitions. All continuous variables are winsorized at the top and bottom 1% to reduce the influence of outliers. The reported standard errors allow heteroscedasticity and any type of correlation for observations of the same firm but assume independence for observations across different firms (Rogers, 1994).
p < .1. **p < .05. ***p < .01 (two-tailed).
Conclusion
The objective of this study is to use a proprietary database of transient institutions’ daily stock trading records to examine whether transient institutions have the independent ability to correctly interpret announcements of small negative earnings surprises in the post–Regulation FD period, during which firm management is prohibited from revealing nonpublic information to select investors such as analysts and institutions. Our research question is motivated by the conflicting views on transient institutions’ degree of sophistication, the lack of research on the extent of transient institutions’ independent ability to acquire and process financial information, and the common managerial allegation that transient institutions would dump a firm’s shares indiscriminatingly whenever there is a small shortfall of reported earnings versus analysts’ consensus forecasts, resulting in an increased risk of temporary stock undervaluation. Transient institutions’ alleged myopic trading behavior is often used by corporate management to justify sacrificing long-term firm value to avoid reporting small negative earnings surprises.
Our main findings are as follows. First, consistent with the common managerial allegation, transient institutions’ selling in response to small negative earnings surprises is significantly different from 0 and is greater than transient institutions’ selling in response to the −2 cent-earnings surprises, but the results are limited to growth firms only. Second, transient institutions’ trading in response to growth firms’ small negative earnings surprises is positively associated with the contemporaneous abnormal stock return, consistent with the managerial perception that transient institutions’ trading has a material impact on contemporaneous stock prices. Third, transient institutions’ trading in response to growth firms’ small negative earnings surprises is positively associated with the abnormal returns in the 3 and 6 months subsequent to the earnings announcements, suggesting that transient institutions’ trading response to small negative earnings surprises does not represent an overreaction that results in temporary stock mispricing. To the contrary, we show that transient institutions’ trading reactions to small negative earnings surprises accelerate the speed with which contemporaneous stock prices reflect the value implications of small negative earnings surprise announcements.
Our results provide new evidence to the ongoing debate on the role of institutional investors in improving or impeding financial market efficiency. Taken together, our results suggest that transient institutions’ trading improves market efficiency in assimilating information of small negative earnings surprises. Our evidence suggests that transient institutions are sophisticated traders who know how to correctly interpret reported small negative earnings surprises even in the absence of access to management’s private information. Our results should have direct implications for corporate managers and board directors who believe that transient institutions would overreact to announcements of small negative earnings surprises. Our evidence suggests that this belief is unwarranted, and therefore managers may wish to reconsider their reporting (e.g., earnings management) or other decisions (e.g., R&D investments) that aim to avoid perceived transient institutions’ overreaction to small negative earnings surprises.
Footnotes
Appendix
Acknowledgements
We wish to thank Agnes Cheng, Bill Kinney, Gregory W. Martin, John McInnis, Grace Pownall, Shiva Rajgopal, Bharat Sarath (Editor), Samir Trabelsi, and workshop participants at Baruch College, Nanyang Business School, University of Texas at Austin, George Washington University, the Financial Accounting and Reporting Section (FARS) midyear meeting, and the joint China Accounting and Finance Review (CAFR) and Journal of Accounting, Auditing & Finance (JAAF) conference for their helpful comments.
Declaration of Conflicting Interests
The author(s) declared no potential conflicts of interest with respect to the research, authorship, and/or publication of this article.
Funding
The author(s) received no financial support for the research, authorship, and/or publication of this article.
Supplementary Material
Supplementary Material is available for this article Online.
Notes
References
Supplementary Material
Please find the following supplemental material available below.
For Open Access articles published under a Creative Commons License, all supplemental material carries the same license as the article it is associated with.
For non-Open Access articles published, all supplemental material carries a non-exclusive license, and permission requests for re-use of supplemental material or any part of supplemental material shall be sent directly to the copyright owner as specified in the copyright notice associated with the article.
