



Abstract
This article examines whether the capitalization–amortization or the direct-expensing method for insurance acquisition costs and commissions better reflects the economic substance. We find that both the currently capitalized–amortized acquisition costs and the as-if asset balance of expensed commissions are positively associated with the market value of equity, and are closely related to the level and volatility of subsequent insurance premiums. Results also show that when explaining the market value of equity, the insurance commission is significantly negative if capitalized and amortized, but is insignificant if directly expensed. The authors are the first to examine how the insurance acquisition costs and commissions are related to subsequent economic benefits, and our results are consistent with IFRS 17 under which the acquisition costs shall not be immediately expensed.
Introduction
Insurance firms often incur significant costs in selling, underwriting, and initiating a new insurance contract, and these costs are commonly referred to as “acquisition cost.” 1 This cost usually consists of commissions and costs such as underwriters’ salaries and benefits, inspection and examination costs, and some fixed costs related to underwriting activities (Nissim, 2010). Substantial acquisition costs are typically incurred during early policy years to maintain or expand business, and commissions, which constitute one of the primary components of acquisition costs, are used as an incentive tool and set at very high levels ranging from 5% to over 100% of the premiums. 2 Under current U.S. GAAP (generally accepted accounting principles), some of the acquisition costs are capitalized and charged to expenses using a systematic approach (i.e., being amortized), whereas some are directly expensed when incurred. The capitalized–amortized commissions and other acquisition costs are commonly known as deferred acquisition costs (DAC) and are shown as an intangible asset. By contrast, the expensed commissions are presented separately as an expense in the income statement, whereas the expensed acquisition costs other than commissions are presented in combination with other operating expenses. This study aims to examine the value relevance of DAC and the directly expensed commissions. 3
This issue is important at least for two reasons. First, theoretically, to reflect correct profit margin, revenues and expenses associated with such acquisition costs should be presented over the coverage period 4 in line with the pattern of services provided under the contract, rather than when the costs are incurred. Accordingly, the direct-expensing method may not be fully reflective of economic reality. Because many insurance policies would be in force over a fairly long period of time, reflecting correct periodic profit margin is particularly emphasized by insurers, as indicated by Klumpes (2002), which documents that the U.K. and Australian life insurers provide information about future profit expectations by voluntarily reporting the present value of actuarially calculated earnings. Second, as will be detailed in “Institutional Backgrounds and Development of Hypotheses” section, IASB (International Accounting Standards Board) and FASB (Financial Accounting Standards Board) have varying viewpoints regarding the capitalization criteria applied to insurance acquisition costs, and the commissions expensed by U.S. insurance firms are very likely to meet the capitalization criteria of IASB. Hence, our research has direct policy implications. Notably, although we agree that the insurance acquisition cost could be recognized as an intangible asset, the intangible asset literature does not appear to address the issue that IASB and FASB have varying capitalization criteria. In fact, many studies that extensively discuss issues related to intangible assets even do not mention acquisition cost at all (Barth, Kasznik, & McNichols, 2001; Brown & Kimbrough, 2011; Gu & Wang, 2005; Jones, 2011; Matolcsy & Wyatt, 2006; Powell, 2003; Wyatt, 2005; Zeghal & Maaloul, 2011). 5
Based on data from U.S. stock insurance firms from 1995 to 2012, we conduct empirical analyses in the following ways. First, the as-if asset balance of currently directly expensed commissions is estimated using the amortization schedule derived from the Almon lag procedure. Then, we assess whether both the DAC and the as-if asset balance of expensed commissions contain relevant information about the market value of equity. The results indicate that (a) DAC is positively and significantly related to the market value, while the coefficient is roughly 1.622; (b) the as-if asset balance of expensed commissions also shows a significant positive association with the market value, with the coefficient being roughly 1.303. Importantly, the correlation between the as-if asset balance of expensed commissions and the existing DAC is low, implying that the capitalization–amortization of the currently expensed commissions provides incremental value relevance; (c) both the DAC amortization expense and as-if amortized commission expense are negatively associated with the market value, while the coefficient of the reported expensed commissions is insignificant in the market value regressions, implying that the direct-expensing approach is not consistent with the market’s expectation; and (d) Vuong’s Z-statistic confirms that the capitalization–amortization method makes the accounting metrics of the DAC or the expensed commissions more informative about the market value.
Several additional tests are carried out. First, both the coefficients of DAC and the as-if asset balance of expensed commissions are positively related to insurance revenues from premiums summed over the subsequent four, eight, or 12 quarters. Meanwhile, the coefficient of the as-if asset balance of expensed commissions is “less negative” than that of DAC in explaining the volatility of subsequent premiums, suggesting that the economic benefits from DAC are still more stable than those from expensed commissions. Besides, we find that the incremental value relevance of capitalizing–amortizing the directly expensed commissions is greater when the growth in such commissions is higher. The positive and significant associations of DAC (or the as-if asset balance of expensed commission) with market values are not affected when (a) the difference between life and nonlife firms are controlled, (b) we conduct the regressions based on observations partitioned by time periods, and (c) we alternatively amortize the expensed commissions using a straight line approach. Overall, our findings indicate that the currently expensed insurance commissions are closely related to future economic benefits, and hence applying the capitalizing–amortizing method is more appropriate.
Our study contributes not only to the literature on the value relevance of insurance acquisition costs, but also to the policy debate on the capitalization versus expensing of such costs. This study is the first to examine how the insurance acquisition costs are related to subsequent premiums and reflected in market values. Second, our findings are consistent with IFRS 17, 6 Insurance Contracts, under which the acquisition costs shall not be immediately expensed. Third, the study enriches the intangible asset literature by exploring customer acquisition costs, a type of outlay that receives less attention, but plays a key role in services industries. Fourth, our evidence sheds light on the accounting treatments for acquisition costs in other industries in which the cost of obtaining a contract may be substantial such as the telecom industry where these costs are rarely capitalized. 7
The remainder of this article proceeds as follows. “Institutional Backgrounds and Development of Hypotheses” section introduces important details about insurance commissions under U.S. GAAP and puts forward the testable hypotheses. “Research Design” section outlines the research design, including empirical models, sample selection, and data characteristics. “Empirical Results and Analyses” section presents the empirical analyses and findings. The article concludes with a summary in “Conclusions and Implications” section.
Institutional Backgrounds and Development of Hypotheses
Under current U.S. GAAP, FAS 60 stipulates in BC 28~31 that “commissions and other costs that are primarily related to insurance contracts issued or renewed shall be capitalized and charged to expense in proportion to premium revenue recognized.”
8
The capitalized–amortized balance of such cost is referred to as DAC. Because generally the commissions are incurred at decreasing ratios of premiums over the policy years, while an overwhelmingly large portion of such costs are paid during the first policy year,
9
the capitalization–amortization method ensures that the insurer’s profit margin is correctly reflected during the policy life. Besides, based on IFRS 17, insurance acquisition cost is termed as insurance acquisition cash flows. It states that: Cash flows arising from the costs of selling, underwriting and starting a group of insurance contracts that are directly attributable to the portfolio of insurance contracts to which the group belongs. Such cash flows include cash flows that are not directly attributable to individual contracts or groups of insurance contracts within the portfolio.
Also, BC 125 stipulates that: An entity shall determine insurance revenue related to insurance acquisition cash flows by allocating the portion of premiums that relate to recovering those cash flows to each reporting period in a systematic way on the basis of the passage of time. An entity shall recognize the same amount as insurance service expenses.
In other words, IFRS 17 proposes that insurance acquisition cash flows will not be immediately expensed when incurred; rather, it should be recognized as an expense over the coverage period. Notably, because the term “insurance acquisition cost” is still more common in the insurance practical discussions, we use the term “insurance acquisition cost” in our study.
No prior study has focused on the insurance acquisition costs, and hence little is known regarding their role in value creation. Although, the marketing literature extensively considers that the acquisition cost plays a key role in developing new customers, and hence is related to value creation (Chan, Wu, & Xie, 2011; Gupta, Lehmann, & Stuart, 2004; Min, Zhang, Kim, & Srivastava, 2016; Niraj, Gupta, & Narasimhan, 2001). Technically, for the outlays that met the deferral criteria, the insurance acquisition costs are deferred at inception, indicating the creation of long-term premium inflows, while being amortized as expenses to match the realization of subsequent benefits. Accordingly, the DAC ending balance, that is, the net amount of deferrals minus amortizations, represents the unexpired portions of acquisition costs, which are expected to relate to future premium inflows. Although some may consider such “unexpired claims” to be out-of-pocket expenditures, they effectively possess marketable values. On one hand, even if policyholders surrender policies prematurely, they would be subject to surrender charges to compensate insurers for up-front commissions. Although the practice of charging surrender charges is regulated, official authorities also specify that levying reasonable amounts of surrender charges to the extent needed to cover incurred commissions is permitted. On the other hand, in a typical reinsurance arrangement, the primary insurer usually pays the reinsurer its proportion of gross premiums it receives on a risk. Meanwhile, the reinsurer allows the company a ceding or direct commission on such gross premiums received, with that commission being large enough to reimburse the ceding firms for the commissions paid to agents (Wehrhahn, 2009). Hence, the DAC balance is considered closely related to future cash inflows when investment bankers value insurance firms (Casualty Actuarial Society, 2000) and is also part of the value of the in-force business under the embedded value system.
It should be noted that because FAS 60 tends to permit the capitalization of acquisition cost only when such cost is incremental at the individual contract level, some commissions are directly expensed by U.S. insurance firms. However, such commissions are very likely to meet the capitalization criteria of IFRS 17. So, the fundamental issue is whether such expensed commissions are related to future economic benefits. According to firms’ annual reports and practical notes issued by leading certified public accounting (CPA) firms, at least the following types are included: (1) acquisition costs that do not vary with the production of new business, such as commissions on group products which are generally level throughout the life of the policy; 10 (2) ultimate renewal commissions; 11 (3) overriding commissions; 12 and (4) contingent commissions. 13 Types (1) and (2) motivate the salespersons to maintain policyholders’ satisfaction if they want to receive subsequent commissions. Hence, these two types of commissions help ensure that subsequent premiums from existing policies will be realized. The overriding commissions, as the portion of commissions paid to the manager of salespersons that directly acquire policies, are value relevant at least due to the premiums arising from existing contractual relationships. In addition, because insurance policies are complicated and the market is highly competitive, the knowledge and customer relationship provided by the manager is usually critical for team members to acquire future policies. In other words, the payment of overriding commissions may maintain or reinforce the incentives of the manager of a sales team in assisting his or her team members and help to ensure the inflow of premiums from existing and future policies. As for contingent commissions, when they are paid if brokers or agents meet a particular rate of retention or renewal of policies in force with respect to the insurance firm, they will at least maintain brokers’ or agents’ incentives to ensure the premium inflows from existing policies. When they are paid if brokers or agents reach a particular number of policies or dollar value of premiums with the insurance firm, brokers or agents will be encouraged to bring in more future policies. As to contingent commissions paid according to the characteristics of policyholders, such commissions may motivate salespersons to bring in the kinds of customers that the insurance firm wishes to develop long-term relationships with. In sum, contingent commissions not only ensure “premiums from current contracts” but also promote “premiums from future contracts.” In sum, the following hypotheses are stated. 14
Research Design
Sample and Variable Measurements
The sample firms consists of both life and nonlife insurers and were initially identified on the basis of their primary NAICS code from COMPUSTAT, with those firms with the codes 524113, 524114, or 524126 in the 1995-2012 period being included 15 . Financial data, such as net incomes, total assets, and total liabilities, were obtained from COMPUSTAT. In addition, data on the acquisition costs and expensed commissions were manually collected from insurers’ annual or quarterly SEC filings because these items are not available in COMPUSTAT. To mitigate the effects of extreme values, observations with a value below (above) the 0.5 (99.5) percentile of net incomes and market value distributions were excluded from the final sample. The final sample consists of 451 observations. Details on the construction and distribution of the sample are reported in Table 1.
Sample Construction Process and Distribution.
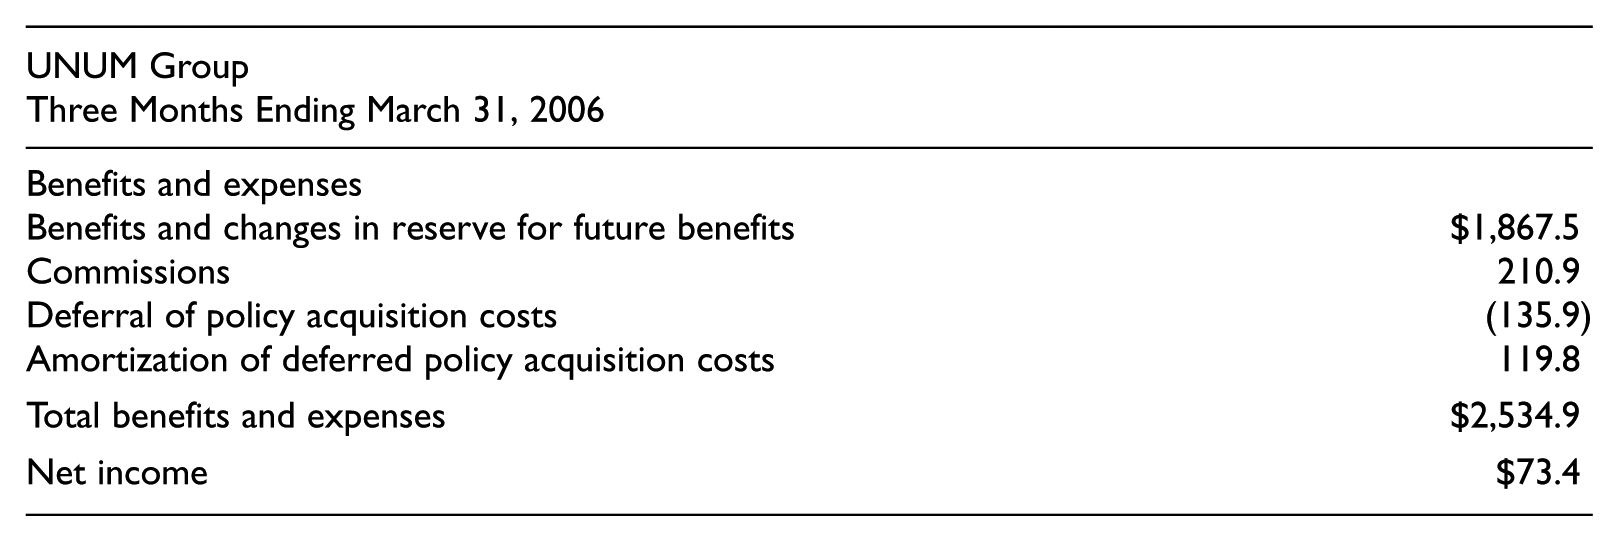
Note. Many of our sample firms are well-known insurers based on practical surveys (http://www.relbanks.com/top-insurance-companies/usa and https://www.doxo.com/g/united-states-of-america/insurance). For instance, Aflac Inc., CNA Corp., Torchmark Corp., Unum Group, and Safeco Corp; also, Aflac Inc., Torchmark Corp., and Unum Group are listed in S&P 500 component. Although the list of important insurers may differ depending on the market (e.g., life, annuity, health, property and casualty, etc.), it suggests that at least some of our sample firms have some market significance.
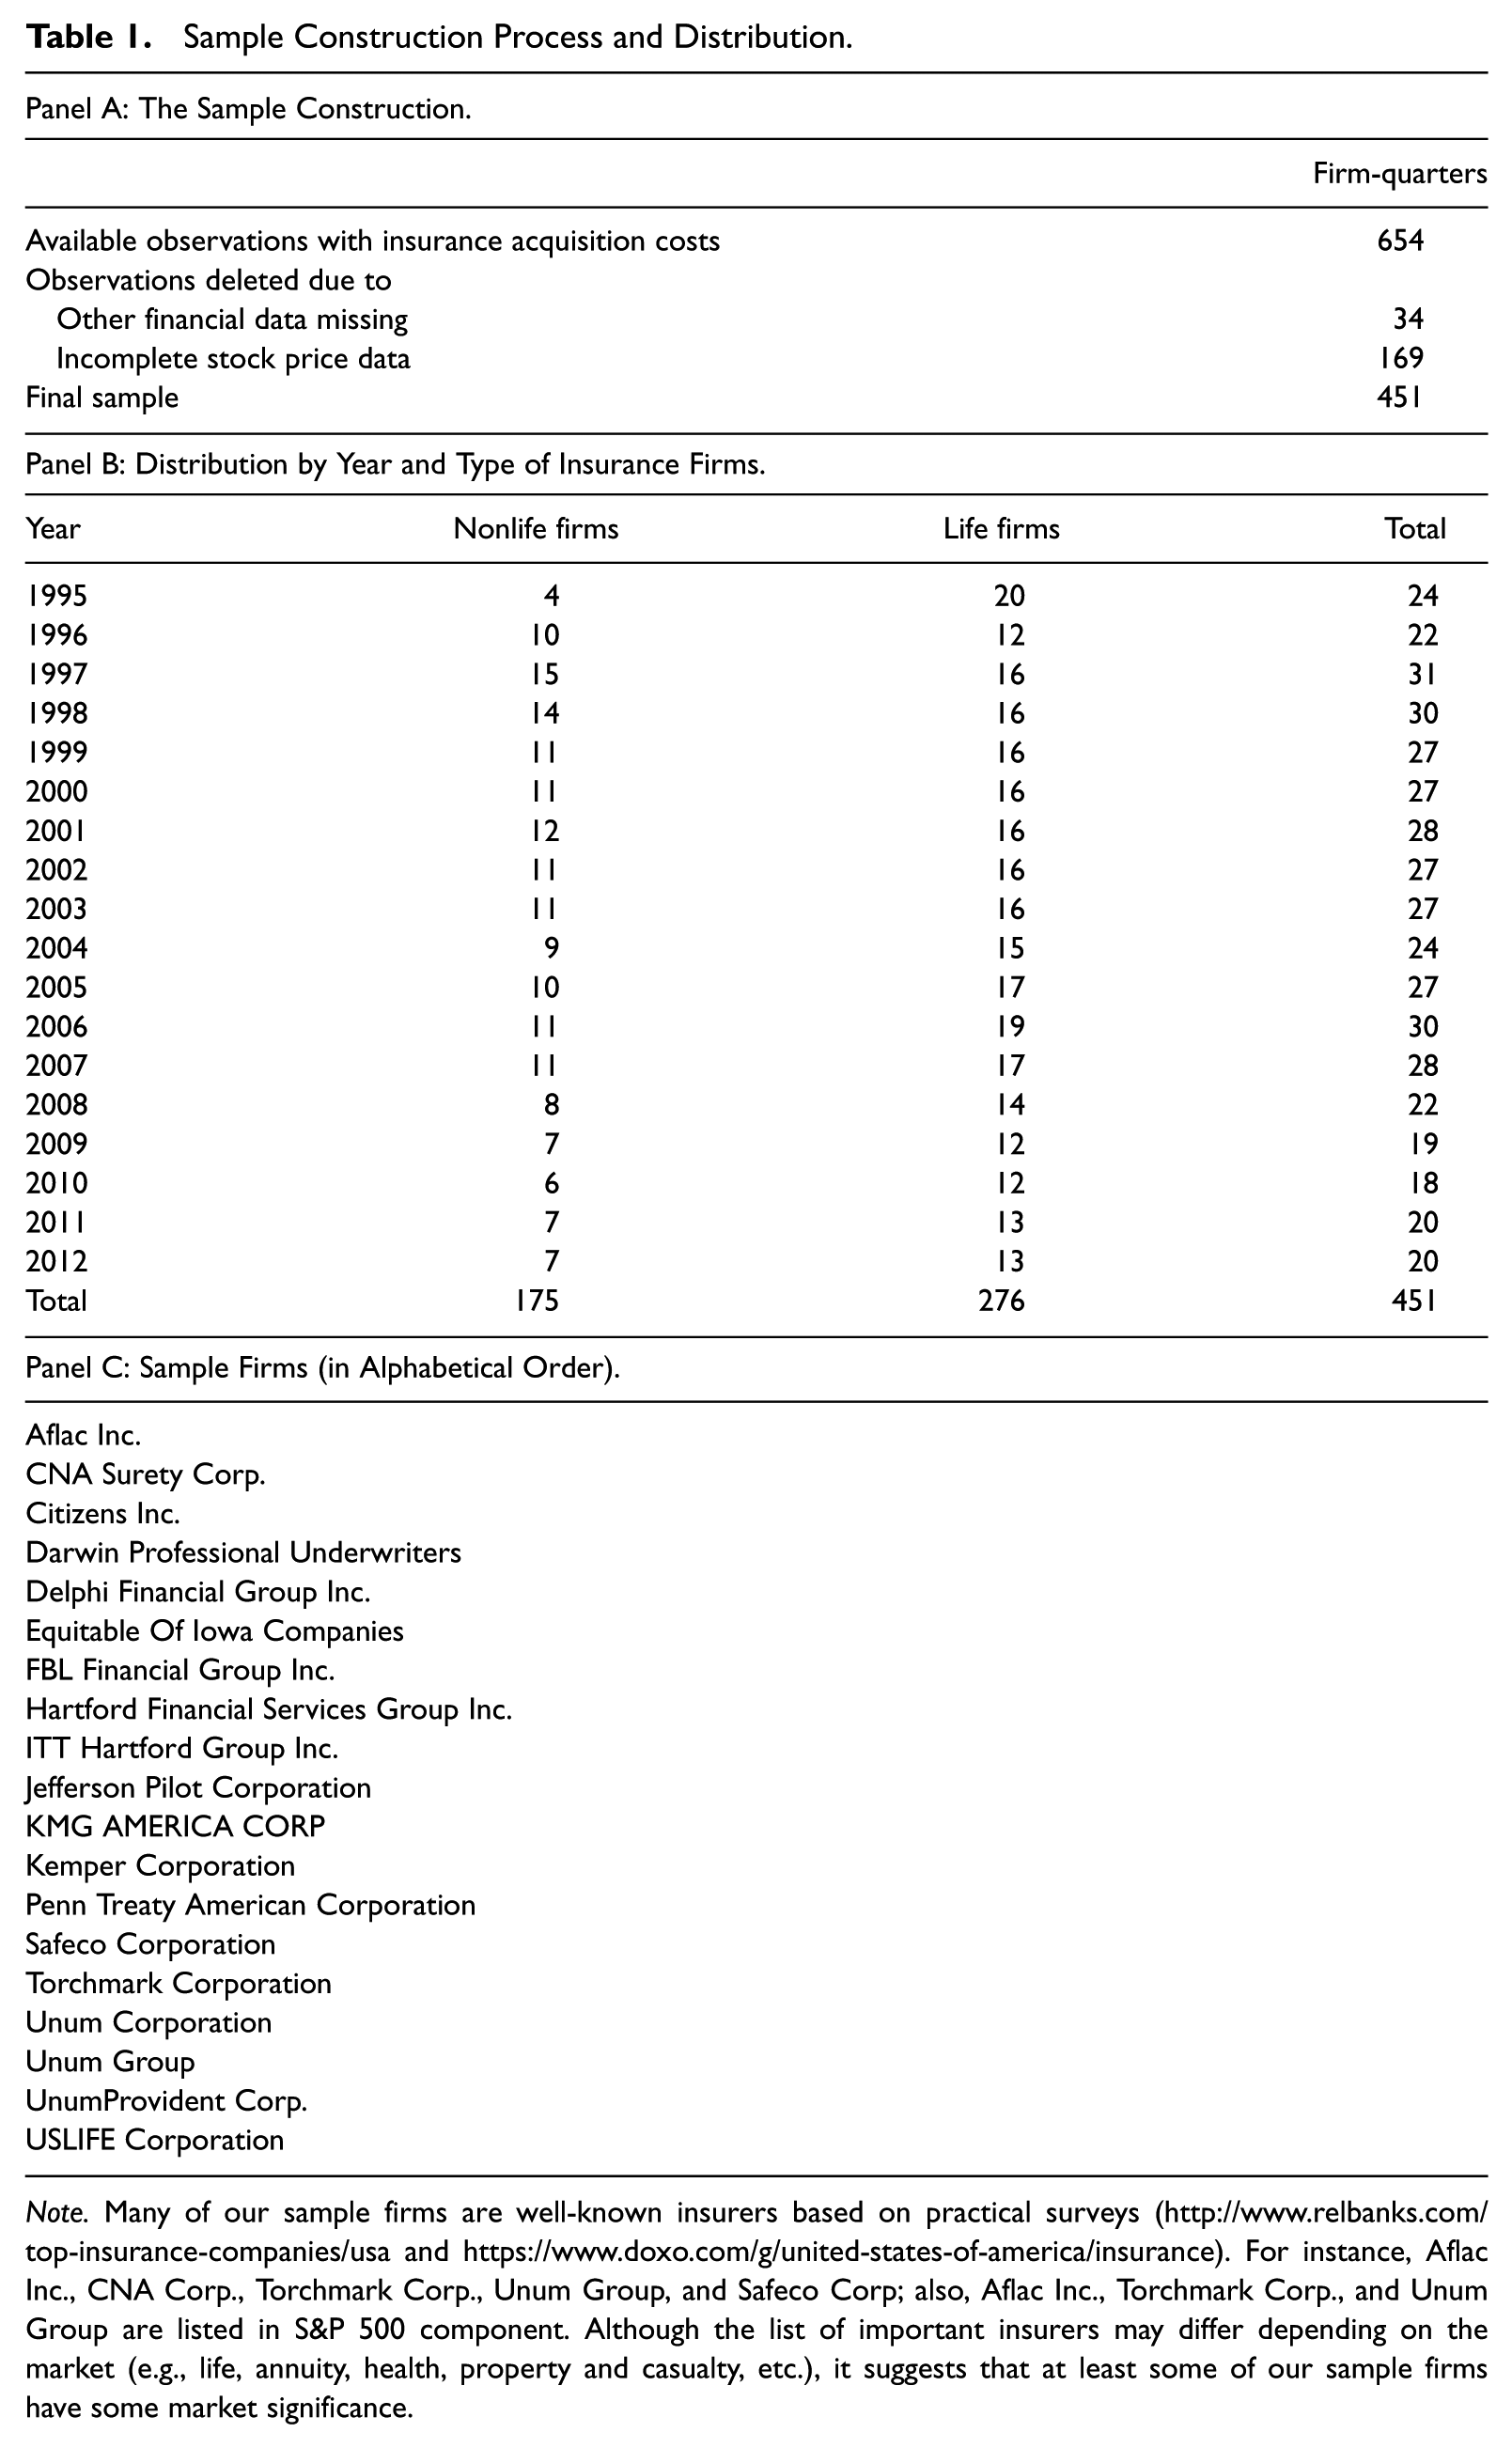
DAC amortizations and expensed commissions are mostly explicitly presented as one of the items in the income statement. An example disclosed by UNUM Group is presented below. As shown, the total commissions incurred during the first quarter of 2006 were US$210.9 whereas the amount deferred was US$135.9, suggesting that the expensed amount was US$75.0 (210.9 less 135.9).
Measuring the As-If Asset Metric for Expensed Commissions Under the Capitalization–Amortization Method
To assess the value relevance of the directly expensed commissions, the as-if asset metric should be estimated assuming that the capitalization–amortization method had been applied. We follow Lev and Sougiannis (1996) and perform the following steps. First, to account for simultaneity, firms’ scaled commission expenses are cross-sectionally regressed on the average of scaled commission expenses of other firms in the industry. The fitted value of commission expense is obtained and will be used in the second step. Specifically, the following model is estimated.

where NDC = the currently expensed insurance commission, S = insurance premiums, Industry NDC/S = the average of scaled commission expenses of other firms in the industry.
Second, to avoid the multicollinearity problem, we apply the Almon lag procedure when regressing the operating income before the insurance-expensed commissions on the several lag terms of expensed commissions 16 as shown below.

where OI = operating income before NDC, that is, the expensed commissions, TA = tangible assets, fitted_value_NDC/S = the fitted value of NDC obtained from Model A1.
For a specific year, the coefficients are estimated using the observations from the preceding 2 years. The estimated coefficients (i.e., α2, k ) allow us to obtain the amortization ratio for each year. Then, the periodic as-if amortization expense for insurance commission is the sum of current and past incurred commission, each multiplied by the appropriate amortization rate. The as-if commission asset is obtained by cumulating the unamortized portion of the incurred commission for each period.
Empirical Models and Variable Definitions
We apply the Ohlson model to assess the value relevance of insurance acquisition cost and expensed commissions (Barth, Beaver, & Landsman, 1998; Bryant, 2003; Chambers, Jennings, & Thompson, 1999; Francis & Schipper, 1999). In Model 1.1, the reported DAC balance (DAC) along with other control variables, including other assets (OTA), total liabilities (LIB), reported net incomes (NI), the dummy indicating whether the observation is a life insurance firm (Hoyt & Liebenberg, 2011), and quarter dummy variables, are used to explain the market value (MV). The models are estimated based on double-clustered (year and firm) standard errors to correct potential cross-sectional and serial correlation of the residuals and/or the independent variables in panel regressions (Petersen, 2009). As Hypothesis 1 posits that the DAC balance represents the unexpired portions of acquisition costs, which are expected to relate to future premium inflows, β1 is predicted to be positive. Then, in Model 1.2, the reported net income is decomposed into net income before reported DAC amortization expense and reported directly expensed commission (BNI), reported DAC amortization expense (AMT), and reported directly expensed commission (NDC). This model aims to first understand how the market values the “reported expenses” regarding DAC and directly expensed commissions. Because it is argued that the capitalization–amortization method is more reflective of business essence, β5 is predicted to be negative. Similarly, because Hypothesis 2 implies that the current direct expensing method is not appropriate, and hence the sign and significance of β6 is unclear.


where MVit = firm i’s market value of equity at the end of quarter t, deflated by the lagged total asset; DACit = firm i’s DACs at the end of quarter t, deflated by the lagged total asset; OTAit = firm i’s other asset at the end of quarter t, deflated by the lagged total asset, that is, the total asset less DAC; LIBit = firm i’s total liability at the end of quarter t, deflated by the lagged total asset; NIit = firm i’s reported net income during quarter t, deflated by the lagged total asset; this item stands for the net income that is actually reported by the firm; BNIit = firm i’s reported net income before DAC amortization expense and currently directly expensed commissions during quarter t, deflated by the lagged total asset; AMTit = firm i’s reported DAC amortization expense during quarter t, deflated by the lagged total asset; NDCit = firm i’s reported currently directly expensed commissions during quarter t, deflated by the lagged total asset.
To investigate whether the directly expensed commission is value relevant, the as-if metrics converted from the directly expensed commissions (as explained in “Measuring the As-If Asset Metric for Expensed Commissions Under the Capitalization–Amortization Method” section) are added. As shown, Model 2.1 differs from Model 1.1 in that (a) the as-if asset balance of the directly expensed commission (CP_NDC) is included and (b) the reported net income in Model 1.1 is replaced by the as-if net income (ANI) assuming that the expensed commission is capitalized and amortized. More specifically, ANI is calculated by adding the reported expensed commission to the reported net income and subtracting the as-if amortization expense for the expensed commission. Also, according to Hypothesis 2, expensed commissions are related to economic benefits from existing or future contracts, so β2 in Model 2.1 is predicted to be positive. Notably, it is ideal to separate commissions from other costs when evaluating the value relevance of capitalized–amortized and directly expensed acquisition costs. However, it is not attainable because (a) capitalized–amortized commissions and other costs are always presented together; (b) directly expensed acquisition costs other than commissions are always reported in combination with other operating costs. In other words, only “directly expensed commissions” are separately available, and this data limitation is likely to make it more difficult to find the value relevance of DAC because commissions will be paid only when policies are eventually acquired, while that may not be the case for other costs. 17 Finally, to ascertain whether the capitalization–amortization method provides more informative expense metrics, the as-if amortization expense for directly expensed commissions (EX_NDC) is separated from the reported net income in Model 2.2, and its coefficient (β7) is predicted to be negative and significant. Similarly, Models 2.1 and 2.2 are estimated based on double-clustered (year and firm) standard errors.


where CP_NDCit = firm i’s as-if asset value at the end of quarter t, deflated by the lagged total asset; this item represents the amount of “additional asset” that would be reported if the capitalization–amortization method had been applied to the currently directly commission, and the method for calculation is detailed in “Measuring the As-If Asset Metric for Expensed Commissions Under the Capitalization–Amortization Method” section.
ANIit = firm i’s adjusted net income during quarter t, deflated by the lagged total asset; this item represents the net income that would be reported if the capitalization–amortization method had been applied to the directly expensed commission, and is equal to NI plus NDC and minus EX_NDC.
EX_NDCit = firm i’s as-if amortization expense for directly expensed commission during quarter t, deflated by the lagged total asset; this item represents the amount of “amortization expense” for directly expensed commissions that would be reported if the capitalization–amortization method had been applied, and the details are in “Measuring the As-If Asset Metric for Expensed Commissions Under the Capitalization–Amortization Method” section.
Other variables are defined in the same way in Models 1.1 and 1.2.
Empirical Results and Analyses
Descriptive Statistics
Table 2 contains definitions and descriptive statistics for all the relevant variables. The mean and median values of DAC (deflated by total assets) are roughly 0.061 and 0.064, respectively, demonstrating the nontrivial financial statement effect of DAC. The mean values of new deferral of DAC and expensed commissions during a fiscal quarter, denoted as ADD and NDC are 0.007 and 0.006, as a percentage of total assets. Their totals have a mean 0.011, and all these statistics highlight the significance of insurance acquisition costs. The mean value of the expensing ratio, denoted as NDC divided by the sum of ADD and NDC, is 0.330, indicating that, on average, the portion of commissions deferred is greater than that expensed directly. Table 3 contains the Pearson correlations between the variables included in all the models. Consistent with our predictions, both the capitalized–amortized and the as-if asset values of directly expensed commissions (DAC and CP_NDC) are positively correlated with the market value of equity (MV).
Descriptive Statistics for All Variables (obs = 451).
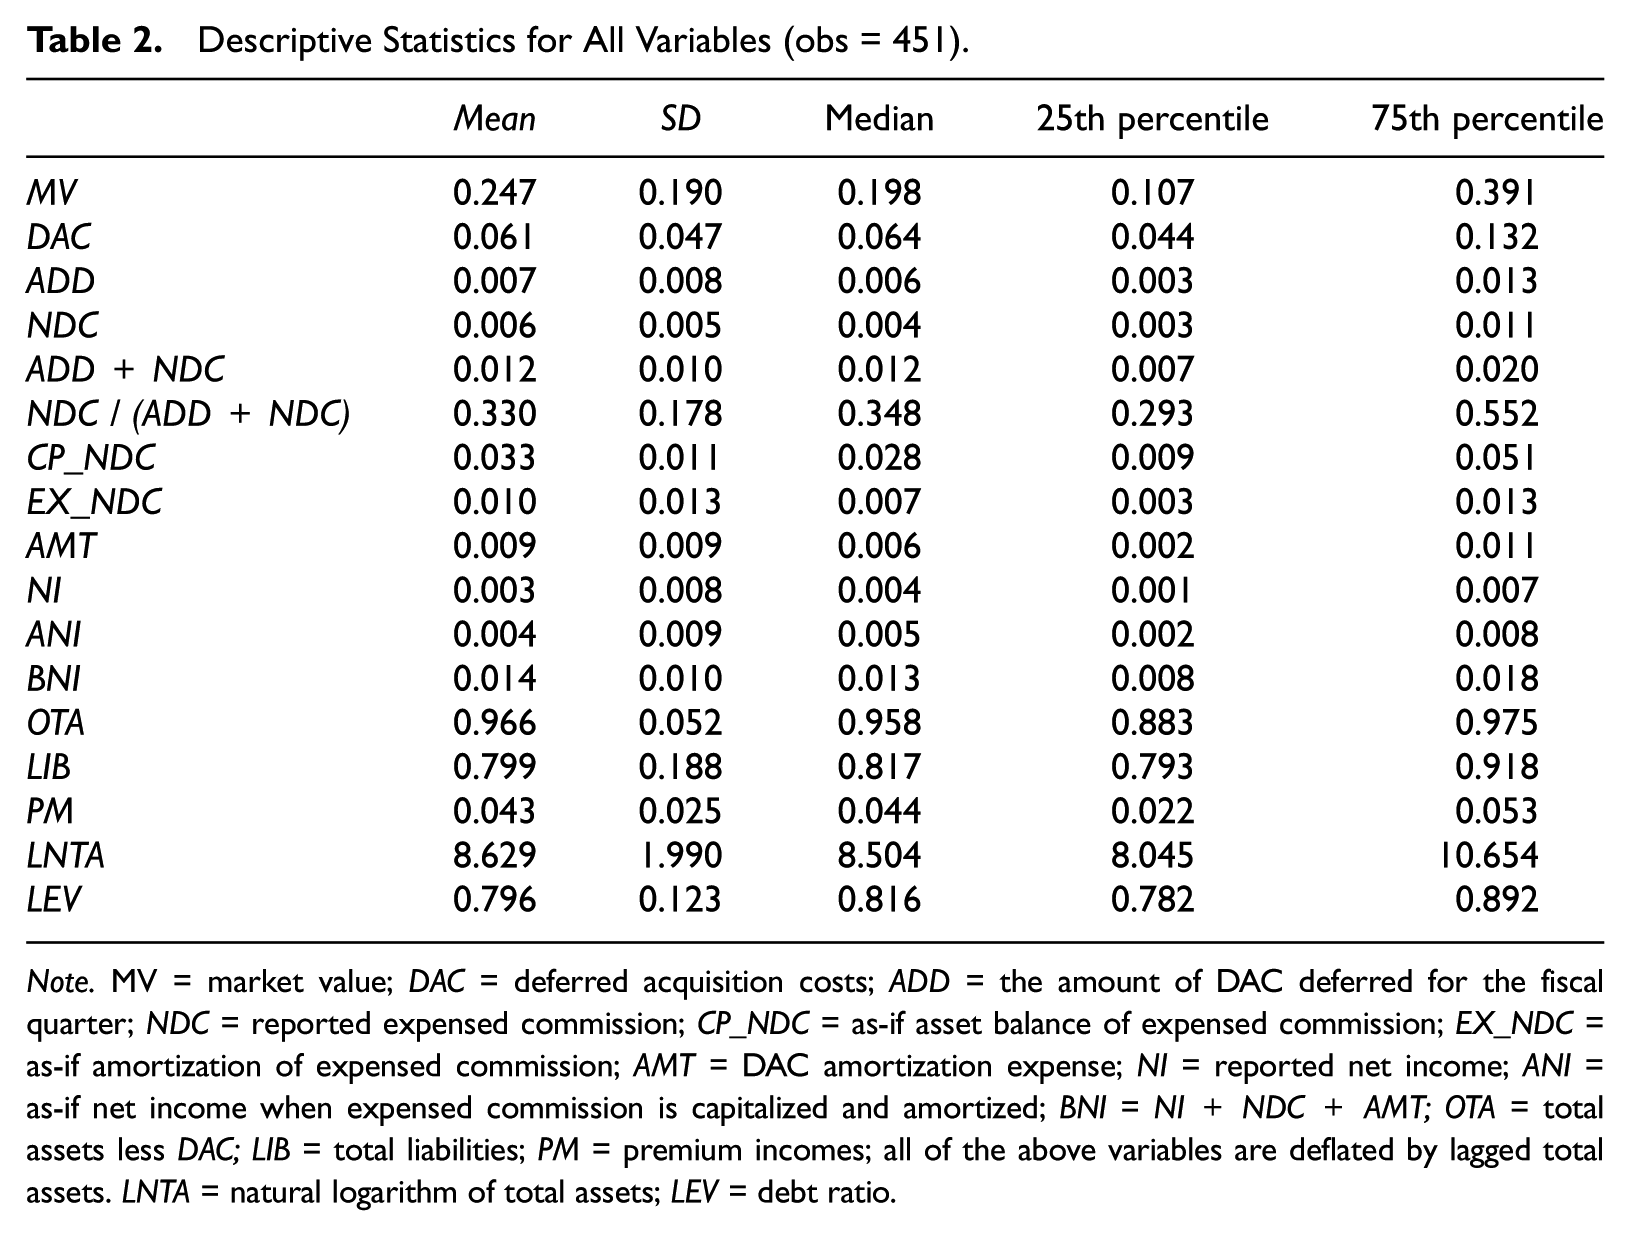
Note. MV = market value; DAC = deferred acquisition costs; ADD = the amount of DAC deferred for the fiscal quarter; NDC = reported expensed commission; CP_NDC = as-if asset balance of expensed commission; EX_NDC = as-if amortization of expensed commission; AMT = DAC amortization expense; NI = reported net income; ANI = as-if net income when expensed commission is capitalized and amortized; BNI = NI+NDC+AMT; OTA = total assets less DAC; LIB = total liabilities; PM = premium incomes; all of the above variables are deflated by lagged total assets. LNTA = natural logarithm of total assets; LEV = debt ratio.
Correlation Matrix (obs = 451).

Note. This table reports the Pearson correlation coefficients between variables; coefficients are shown in bold if significant at p < .05. See Table 2 for variable definitions.
Regression Results
Table 4 shows the estimation results, and we report t values based on standard errors clustered both by firm and by year to correct for time series and cross-sectional dependence (Petersen, 2009). In Panel A, we make a preliminary evaluation regarding the explanatory power of accounting metrics when DAC is directly expensed, rather than deferred and amortized. In that case, there is no DAC balance in the balance sheet, and the net income should be recalculated. NI_EXDAC equals the reported net income plus the DAC amortization and less the new DAC deferral during a specific quarter. The adjusted R2 reported in Panel A is 62.17%, and when it is compared with that reported in column (1) of Panel B, the Vuong’s Z-statistic is 8.30. This suggests that the current deferral-amortization method for DAC provides more informative metrics than the direct-expensing method. Panel B reports the results of Models 1 and 2. Column (1) presents the result of Model 1.1 in which only the value relevance of DAC is examined based on the Ohlson model. As shown, the coefficient on DAC (2.022) is significantly greater than 0 (t = 10.58; p < .001), suggesting that the market views the currently capitalized–amortized insurance acquisition costs as relating to future economic benefits. Hence, Hypothesis 1 is supported. The results of Model 2.1, in which the value relevance of the directly expensed commission is examined, are presented in column (2). The as-if asset balance for the directly expensed commission (CP_NDC) shows a positive and significant correlation with the market value (coefficient = 1.303; t = 7.14), indicating that the directly expensed commission is value relevant, controlling for the effect of DAC. The difference in the coefficients of DAC and CP_NDC is weakly significant (F = 1.66, p = 0.07), implying that more economic benefits are generated from one dollar investment in DAC than that in expensed commissions. The Vuong’s Z-statistic is 6.03, consistent with the capitalization–amortization method providing more informative accounting metrics about the market value.
The Value Relevance of DAC and Directly Expensed Commissions (obs = 451).
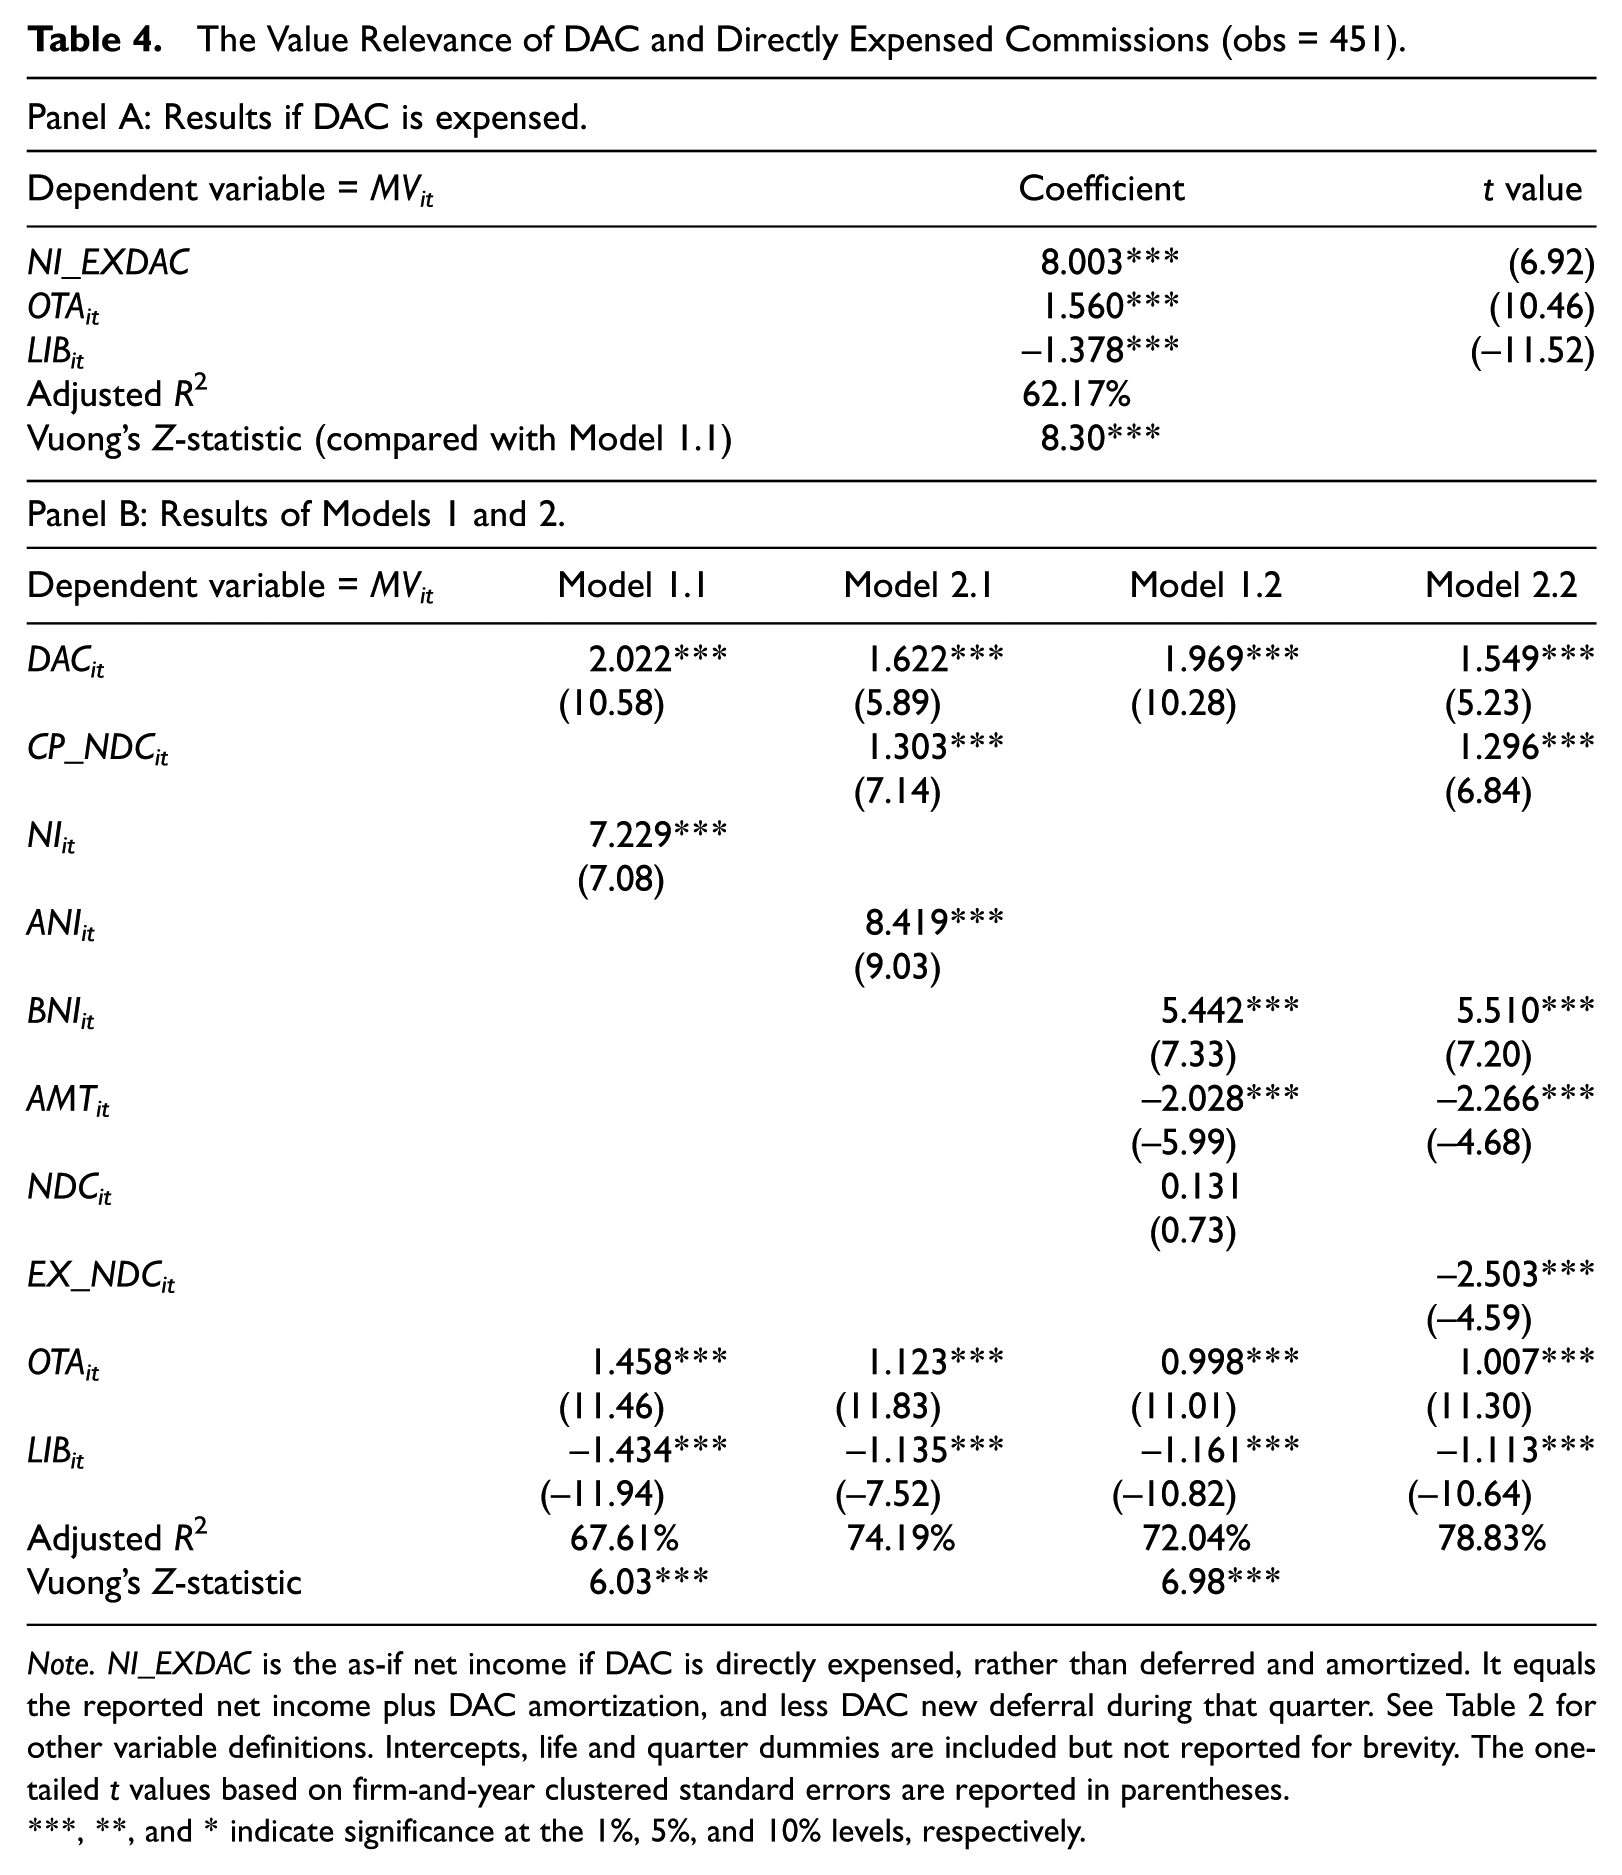
Note. NI_EXDAC is the as-if net income if DAC is directly expensed, rather than deferred and amortized. It equals the reported net income plus DAC amortization, and less DAC new deferral during that quarter. See Table 2 for other variable definitions. Intercepts, life and quarter dummies are included but not reported for brevity. The one-tailed t values based on firm-and-year clustered standard errors are reported in parentheses.
**, and * indicate significance at the 1%, 5%, and 10% levels, respectively.
In column (3), we provide the results of Model 1.2, in which the market valuations of the reported expense items of DAC and directly expensed commission are preliminarily inspected. Theoretically, if the capitalization–amortization method is suitable for DAC whereas the direct-expensing method is appropriate for the directly expensed commission, both coefficients on the reported DAC amortization expense (AMT) and the reported expensed commission (NDC) should be negative and significant. As presented, the reported DAC amortization expense is negatively and significantly associated with the market value (coefficient = –2.028, t = –5.99). As a contrast, the coefficient on the reported directly expensed commission (NDC) is insignificant (t = 0.73). Accordingly, the results reveal that investors do not consider directly expensed commissions to be mere periodic expense. It may also imply that some expensed commissions are not related to value creation, and it is possible that the full capitalization of insurance commissions is not appropriate. Therefore, it highlights that the directly expensed commission deserves more examination. Finally, in column (4), we report the result of Model 2.2, in which the incremental information of the as-if amortization expense for directly expensed commissions is investigated. Although the coefficient on DAC amortization remains negative (–2.266), the as-if amortization expense for directly expensed commission (EX_NDC) also has a negative influence on the market value (coefficient = –2.503; t = –4.59). Compared with the insignificant coefficient on reported expensed commission (i.e., NDC in column 3), the result indicates that the capitalization–amortization method provides more informative metrics, that is, Hypothesis 2 is supported. 18
Robustness Checks
We conduct several additional tests to check the robustness of the main findings. First, the sample includes both life and nonlife (i.e., property and casualty) insurance firms, and one may consider the commissions related to nonlife insurance policies to affect subsequent economic benefits to a smaller magnitude because the contractual inflow of premiums related to such policies usually occurs within 1 year. However, it is also possible that the premium inflows turn out to be stable and recurring because some types of nonlife insurance policies, such as automobile insurance, have the least customized features, and policyholders may repeatedly continue renewing once they have made the first purchase from one specific insurance firm. Hence, we do not have any ex ante expectation about whether the valuation multipliers of DAC (or directly expensed commissions) for life and nonlife insurance firms should vary. The results of adding the interaction terms to our original models are presented in Table 5. As shown, the interaction terms are not significant, whereas the estimated coefficients and statistical significance of the main variables (i.e., DAC or CP_NDC) show similar patterns to those reported in Table 4. For instance, the as-if asset balance of expensed commission is significantly and positively related to market values (coefficient = 1.303, t = 7.14) in column (2) of Table 4, whereas it shows a significant and positive sign (coefficient = 1.294, t = 5.39) in column (2) of Table 5 and the interaction term (CP_NDC×Life Dummy) is not significant (t = 0.38).
Robustness Checks: The Difference Between Life- and Nonlife Firms (obs = 451).

Note. Life Dummy is equal to 1 if the observation is a life firm, and 0 otherwise. The numbers of observations in life and nonlife firms are 276 and 175, respectively. See Table 2 for other variable definitions. Quarter, life dummies, and intercepts are included but not reported for brevity.
**, and * indicate significance at the 1%, 5%, and 10% levels (one-tailed), respectively.
As Penman (2009) indicated, earnings are no different under capitalization and amortizing versus immediate expensing if there is no growth in expenditures. We address this feature in the following way. First, the annual growth rate of expensed commissions (denoted as Growth_NDC) is measured by dividing the expensed commissions during the current year less expensed commissions during the previous year by expensed commissions during the previous year. Then GRNDC is equal to 1 if Growth_NDC is above the annual median value of Growth_NDC, and 0 otherwise. Similarly, we obtain the annual growth rate of DAC (denoted as Growth_DAC) by dividing DAC in the current year less DAC in the previous year by DAC in the previous year. Then GRDAC is equal to 1 if Growth_DAC is above the annual median value of Growth_DAC, and 0 otherwise. Related interaction terms are added to the regression when the market value serves as the dependent variable. Results are provided in Table 6. In column (1), the interaction term between GRNDC and NDC is insignificant (t = 1.60). In column (2), the interaction term between GRNDC and CP_NDC is positive and significant (coefficient = 0.883, t = 6.51), whereas the interaction term between GRNDC and EX_NDC is negative and significant (coefficient = –0.506, t = –6.78). In column (3), the sign and significance of the coefficients on GRNDC × CP_NDC and GRNDC × EX_NDC remain similar to those reported in column (2), whereas the coefficient on DAC × GRDAC is weakly significant (t = 1.66). In sum, when a firm’s growth in directly expensed commissions is higher, the incremental value relevance resulting from capitalizing–amortizing expensed commissions is greater. One possible explanation for such a result is that when salespersons are paid higher commissions by a specific insurer, they may be more devoted to maintaining existing customers or developing new customers for that insurer, similar to the finding reported by Livne, Simpson, and Talmor (2011) that customer acquisition costs in the wireless industry are positively associated with customer retention.
Robustness Checks: The Difference Between High- and Low-Growth Firms (obs = 451).

Note. GRNDC is equal to 1 if Growth_NDC is above the annual median, and 0 otherwise, whereas Growth_NDC is the annual growth rate of directly expensed commissions. GRDAC is equal to 1 if Growth_DAC is above the annual median, and 0 otherwise, while Growth_DAC is the annual growth rate of DAC. The number of observations whose GRNDC (GRDAC) equal to 1 is 248 (211). Life and quarter dummies are included but not reported for brevity. See Table 2 for other variable definitions.
**, and * indicate significance at the 1%, 5%, and 10% levels (one-tailed), respectively.
Furthermore, because our sample period is between 1995 and 2012, one may be concerned that the value relevance of DAC or expensed commissions is driven by only subsamples during some years. Hence, we conduct the analysis based on subsamples partitioned by time periods. Specifically, there are four subsamples: observations from the years 1995~1999, 2000~2004, 2005~2009, and 2010~2012. Untabulated results show that DAC and CP_NDC are positively and significantly related to market values in all the subsamples. The coefficients on DAC range from 1.245 to 1.701, and the corresponding t values are between 4.88 and 7.25. The coefficients on CP_NDC range from 0.913 to 1.566, and the corresponding t values are between 4.89 and 7.24. Overall, our results are robust to using subsamples from different periods of time.
In addition, as ASU 2010-26 becomes effective after 2012 and its primary objective is to limit the discretion involved in the capitalization decision of acquisition costs, some may conjecture that its adoption increases the value relevance of acquisition costs. Therefore, we define an indicator variable (POST) to be 1 if the observation is from the year 2012 or 0 otherwise. The indicator variable and its interaction term with DAC or non-DAC (DAC×POST or CP_NDC×POST) are added to our original regression. Untabulated results show that the t values are 1.13 for DAC×POST and 1.55 for CP_NDC×POST, and both are insignificant. Therefore, it appears that the adoption of ASU 2010-26 does not materially affect the value relevance of acquisition costs.
We also ascertain our main findings based on stock return specifications. Following Aboody, Hughes, and Liu (2005) and Larcker, Richardson, and Tuna (2007), the excess return (i.e., the quarterly stock return less the risk-free rate return) is regressed on the reported net income or the ANI assuming the currently expensed commission is capitalized and amortized, along with the Fama-French three factors and the momentum factor. 19 The net income for the t-4 quarter is included to account for the effect of expected net incomes (Gu & Lev, 2004; Kumar & Krishnan, 2008). Vuong’s Z-statistic is applied to assess the significance of the difference in the explanatory powers of reported and as-if earnings. Untabulated results show that both the reported and the ANI are positively related to the excess return. Whereas the adjusted R2 of the reported net income model is 23.41%, the adjusted R2 of the ANI model is 28.96%. Vuong’s Z-statistic is 4.80 (p = .000), indicating that the ANI significantly outperforms the reported net income in explaining the excess returns.
One potential alternative interpretation of our findings is that the dependent variable averages away more noise in the revenue stream as the time horizon lengthens and the main independent variable (CP_NDC) also averages away noise by capitalizing and amortizing (smoothing) past expenses into the current period, such that these two over-time averages are correlated as a result. To address this concern, we conduct the following additional analysis. First, the reported other operating expense 20 (labeled as OTHEXP) is measured by total operating expense less DAC amortization expense and reported expensed commission. Then, we calculate the value of the as-if asset balance (OEX_CAP) and as-if expense (OEX_EXP) if OTHEXP is capitalized and amortized in the same way as DAC. If only the alternative explanation that the noise averages way overtime accounts for our reported value relevance of CP_NDC, we should be able to observe a similar pattern for OEX_CAP. Using the market value as the dependent variable, we find that (a) the coefficient on the reported other operating expense (OTHEXP) is–1.033 and t = –4.81, suggesting that the market considers the reported metric to be an expense; (b) the coefficient on the as-if asset balance (OEX_CAP) is 0.096, and the t = 1.24; (c) the coefficient on the as-if expense (OEX_EXP) is –1.220, and t = –2.50. In sum, unlike directly expensed commissions, other operating expenses are not closely related to future economic benefits, and the market considers the direct expensing treatment of other operating expenses to be appropriate.
In addition, we employ another way of addressing the above issue by conducting the randomization test used in Landsman, Peasnell, and Shakespeare (2008). Specifically, NDC for firm j in year t is randomly assigned to firm k in year t, and so forth. Then, we calculate the as-if asset metric based on the “randomly assigned NDC” and repeat all the related empirical analyses. We find that after this random assignment, the coefficient on CP_NDC is not significantly related to market values (t = 0.75). In other words, our main findings are not merely driven by the smoothing effect of the capitalizing and amortizing methodology.
Another feasible way to amortize the directly expensed commissions is using an amortization period identical to the amortization period used for DAC. As detailed in “Institutional Backgrounds and Development of Hypotheses” section, because insurance premiums mostly remain level during the policy years, DAC amortization usually coincides with using the straight line approach. So, we should be able to estimate the DAC amortization period in a backward way. Specifically, assume that an insurance firm’s beginning balance of DAC is zero, the firm incurs new deferral which is $100 at the beginning of each year, and will amortize it within 4 years. Then, the amortization expense for the third year is $25 multiplied by three, that is, $75. The ending balance of DAC is $100 × 3/4 + $100 × 2/4 + $100 × 1/4 = $150. The ratio of DAC balance to the amortization expense is 2. So, it turns out that the original amortization period is equal to multiplying the ratio of DAC balance to the amortization expense by 2. More specifically, we obtain the ratio of DAC balance to the DAC amortization expenses, and then, that value is multiplied by 2, serving as the estimated DAC amortization period, and is used to amortize the directly expensed commissions. The following simplified numerical example explains the calculation process.
An Insurer Has the Following Expensed Commissions Reported During the Past 16 Quarters. Suppose the Reported Net Income of Y4Q4 is $52.

Assume that multiplying the ratio of DAC balance to DAC amortization expense by 2 results in an estimated amortization period which is 2 years. Because our empirical data is firm-quarter observations, we use 8 quarters to conduct this calculation. As a result, the as-if asset for Y4Q4 = 7/8 × $116 + 6/8 × $120 + . . . + 1/8 × $124 = $470.15. The as-if amortization for Y4Q4 = 1/8 × $116 + 1/8 × $120 + . . . + 1/8 × $96 = $115.25. Hence, the ANI = 52 + 116 – 115.25 = $52.75
Based on the above alternative way of amortization, we repeat all the regression analyses and find very similar results. For instance, for Model 2.2, the coefficient of CP_NDC is 1.129, and t value is 6.95 (p < .000). The coefficient of EX_NDC is –2.296, and t value is –5.68 (p < .000). In brief, our main results are not affected by using alternative amortization schedule.
Additional Analyses
An insurance contract is usually priced to recover commissions through premiums and through surrender charges. 21 So, we additionally evaluate whether DAC or directly expensed commissions are recovered from subsequent premiums, using the specification similar to that used by Kobelsky, Richardson, Smith, and Zmud (2008). Also, similar to prior studies on research and development and advertising costs (Gu & Li, 2010; Kothari, Laguerre, & Leone, 2002), we examine the relation between insurance acquisition costs and the uncertainty of future premiums. That relation informs the risk and reliability of future economic benefits associated with incurred commissions. In sum, the following regressions are estimated.

where n = 4, 8, or 12

where n = 4, 8, or 12; PMi = firm i’s earned insurance premiums plus policy fees, deflated by the lagged total asset.
Other variables are defined as in Models 1.1 and 1.2.
The empirical results based on Models 3.1 and 3.2 are presented in Table 7. Based on columns (1), (2), and (3), the coefficients on the as-if asset balance for directly expensed commissions (CP_NDC) are 3.408, 7.011, and 9.036 when the dependent variable is the sum of earned premiums for the subsequent four, eight, and 12 quarters, respectively. It appears that the positive effect of directly expensed commissions remain stable over time. The results in columns (4), (5), and (6) indicate that the as-if asset balance for directly expensed commissions (CP_NDC) is negatively related to the standard deviation of subsequent premiums. The coefficient on CP_NDC is “less negative” than that on DAC in explaining the volatility of subsequent premiums, suggesting that the economic benefits from DAC are still more stable than those from directly expensed commissions.
The Effect of DAC/Directly Expensed Commissions on Subsequent Level and Volatility of Premiums (obs = 451).

Note. This table presents the relation between DAC/the as-if asset balance of directly expensed commissions and the sum (or the standard deviation) of subsequent earned premiums. The one-tailed t values based on firm-and-year clustered standard errors are reported in parentheses. Life and quarter dummy variables are included but not reported for brevity. PM refers to the earned insurance premium; see Table 2 for other variable definitions.
**, and * indicate significance at the 1%, 5%, and 10% levels, respectively.
Finally, one may be concerned that the potential discretion involved in making the decision on capitalizing or expensing insurance acquisition costs may affect our results. However, even if managerial discretion exists, it will cause the reported DAC or directly expensed commissions to contain bias. Hence, the presence of such potential makes it more difficult for us to empirically find the valuation implication of insurance acquisition costs. In other words, our results showing the strong value relevance of insurance acquisition costs appear to remain even more robust after considering the potential presence of managerial discretion. Still, we test for the potential presence of discretion involved in the capitalization decision in the following ways. First, for a specific firm during a specific quarter, the expensing ratio was calculated as directly expensed commissions divided by the sum of directly expensed commissions and new deferral of DAC during the period, which is denoted as EXPR. Second, we obtain the mean of the expensing ratios measured within the previous eight quarters, which is denoted as MEXPR. Then, the “residual” portion of the expensing ratio for a specific firm during a specific quarter is defined as the difference between EXPR and MEXPR. Eventually, we conduct the t test and find that the difference between EXPR and MEXPR is not statistically significant (t = 0.2137). In summary, these results suggest that any concern regarding the effect of managerial discretion involved in the capitalization decision on our empirical findings may be unwarranted.
Conclusions and Implications
Insurance acquisition costs in the United States are capitalized–amortized when directly related to the sales volume of insurance policies, but in practice, are often expensed. We hypothesize that even though the expensed commissions may not be attributable to an individual policy, they are directly related to the generation of premiums at least at the portfolio level. Usually, the payment of such commissions is designed to maintain the premium inflows from existing policies as well as to promote the development of long-term customer relationships and the generation of future policies.
Based on data from U.S. stock insurance firms from 1995 to 2012, we assess the relative explanatory powers of accounting metrics when DAC is capitalized–amortized (as compared with when it is directly expensed), and the Vuong’s Z-statistic confirms that the current capitalization–amortization method of DAC provides more informative metrics than the direct-expensing method. Second, the currently directly expensed commissions are converted into capital assets based on the amortization schedule derived from the Almon lag procedure. Then, using the Ohlson model, we find robust evidence showing that (a) both DAC and the as-if asset balances of directly expensed commissions are positively related to the equity market value, and the difference in their coefficients is weakly significant. (b) DAC amortization is negatively associated with the market value, while the reported directly expensed commissions show an insignificant coefficient, implying that the immediate expensing treatment may not be appropriate for valuation purposes. Additional analyses indicate that both the coefficients on DAC and the as-if asset balance of directly expensed commissions are positively related to subsequent earned premiums, while the coefficient on DAC is slightly larger than that of the as-if asset balance of expensed commissions. Meanwhile, the coefficient on the as-if asset balance of expensed commissions is “less negative” than that of DAC in explaining the volatility of subsequent premiums, suggesting that the economic benefits from DAC are more stable than those from directly expensed commissions. In brief, the empirical results are consistent with the directly expensed insurance commissions contributing to the generation of subsequent economic benefits.
This study is the first to focus on the appropriateness of different accounting treatments for insurance acquisition costs. Because such cost represents a substantial outlay in obtaining insurance policies, the related financial statement effects caused by different accounting treatments have economic significance. A clear practical implication is that investors should note that expensed commissions may cause earnings to not accurately reflect profits. Second, we provide direct and timely policy implications. Notably, IFRS 17, Insurance Contracts, stipulates that “insurance acquisition cash flows will not be immediately expensed when incurred; rather, it should be recognized as an expense over the coverage period.” So, the IASB’s treatment will produce expense numbers identical to those produced by the capitalizing–amortizing method. Our evidence is consistent with the IASB’s proposed accounting treatments for insurance acquisition costs, and hence, the FASB may take it into consideration when revising regulations regarding insurance accounting.
Footnotes
Authors’ Note
Yi-Ping Liao is now affiliated to Department of Accounting, Fu Jen Catholic University.
Declaration of Conflicting Interests
The author(s) declared no potential conflicts of interest with respect to the research, authorship, and/or publication of this article.
Funding
The author(s) disclosed receipt of the following financial support for the research, authorship, and/or publication of this article: This research has been funded by the Ministry of Science and Technology (Grants MOST 103-C8658-2 and MOST 102-2410-H-130 -009). This work was also financially supported by the Center for Research in Econometric Theory and Applications (Grant no. 107L900202, 108L900202) from The Featured Areas Research Center Program within the framework of the Higher Education Sprout Project by the Ministry of Education (MOE) in Taiwan. Chi-Chun Liu acknowledges research support from the Ministry of Science and Technology, R.O.C (grant no. 107-3017-F-002-004).