




Abstract
This study examines the effect of stock liquidity on corporate risk-taking behavior. We find that stock liquidity has a positive and significant effect on corporate risk-taking. We find consistent results when we use the split share structure reform (SSSR) in China as an exogenous shock to stock liquidity. We also investigate the channels through which stock liquidity affects risk-taking and find that increases in stock liquidity lower the cost of capital and increase the pay-for-performance sensitivity of managers. Finally, we conduct cross-sectional tests to rule out privatization as an alternative explanation for our results. Our study sheds light on the real effects of stock liquidity and contributes to the understanding of capital market development.
Keywords
Introduction
Prior studies have shown that corporate risk-taking, generally defined as the undertaking of risky but value-enhancing investments by corporates, is an important factor in stimulating long-term economic growth (e.g., Acemoglu & Zilibotti, 1997; DeLong & Summers, 1991; John, Litov, & Yeung, 2008). In this article, we examine the effect of stock liquidity on corporate risk-taking behavior. Stock liquidity is one of the most important firm characteristics in the capital market (Fang, Noe, & Tice, 2009; Holmstrom & Tirole, 1993), and it can be altered by capital market regulations and securities laws. Investigating the effect of stock liquidity on corporate risk-taking can shed light on how to use capital markets to improve economic welfare, especially in developing countries. However, to date, no study has examined whether and how stock liquidity affects corporate risk-taking behavior. This may be due to the difficulty in finding an ideal setting to investigate the causal effect of stock liquidity on corporate risk-taking. 1
To examine the effect of stock liquidity on corporate risk-taking behavior, we use a quasi-natural experimental setting, the split share structure reform (SSSR) in China. Beginning from 2005, the SSSR eliminated selling restrictions on nontradable shares that accounted for two thirds of market capitalization in 2004 (Li, Wang, Cheung, & Jiang, 2011). Thus, the enactment of the SSSR produced a large and exogenous shock to firm stock liquidity. Moreover, in this setting, the shock was permanent. This permanence allows us to better identify the effects of liquidity on long-term risk-taking behavior. By taking the SSSR as the experimental setting for our analysis, we are also able to examine the effects of dynamic firm-level variations in liquidity on corporate risk-taking. Although the reform only removed selling restrictions, the liquidity level is ultimately determined by the market.
Stock liquidity likely has conflicting effects on risk-taking. Increases in stock liquidity may increase the information content of stock prices, lower transaction costs, and thus lower the cost of capital. Because firms make investment decisions by comparing a project’s returns (or risk) with the associated cost of capital (Bolton, Chen, & Wang, 2011; Copeland, Koller, & Murrin, 2000), a decrease in the cost of capital might ease a firm’s financial constraints, increasing its tolerance for failure and its likelihood of investing in riskier projects (e.g., Bruno & Shin, 2014; Edmans, Fang, & Zur, 2013; Fang et al., 2009; Paligorova & Joao, 2017; Tian & Wang, 2014). Bruno and Shin (2014), for instance, find that a greater increase in liquidity relaxes firms’ financial constraints and motivates them to undertake riskier corporate investments. They also find that liquidity impacts corporate risk-taking more in firms that are more dependent on external financing. Moreover, increases in liquidity may also affect managerial compensation such that managers are more willing to take risks (e.g., Fang et al., 2009; Jayaraman & Milbourn, 2012). For example, studies show that greater stock liquidity shifts the composition of executive compensation away from cash-based compensation and toward stock-based compensation (e.g., Jayaraman & Milbourn, 2012). This shift results in higher pay-for-performance sensitivity (PPS), which may encourage managers to undertake more risky projects to increase the probability of higher stock prices down the line. 2
On the contrary, increases in stock liquidity may lead to decreases in risk-taking. Higher stock liquidity can increase the probability of hostile takeover attempts (Fang, Tian, & Tice, 2014), which results in managerial myopia and reduction in long-term risky projects. In addition, high PPS that results from increased liquidity may give managers incentives to reduce their firms’ risk because managers are undiversified with respect to firm-specific wealth (e.g., Armstrong, Larcker, Ormazabal, & Taylor, 2013; Coles, Daniel, & Naveen, 2006; Efendi, Srivastava, & Swanson, 2007). These alternative effects of increases in stock liquidity can cause managerial myopia and lead to lower levels of long-term risk-taking, such as investment in R&D or innovation projects (Fang et al., 2014).
The effects of liquidity discussed above are drawn mainly from studies in the U.S. setting. Although the capital market in China is different from those in the United States and other developed countries, increased liquidity can generate similarly mixed effects in the Chinese setting. Although state-owned enterprises (SOEs) make up a large part of all listed firms in the Chinese market, Chinese firms’ investment behavior is also sensitive to the cost of capital (Xu & Tian, 2013). Detailed option data are not available, but some stock options or restricted stocks are granted to managers. Managers in China are generally compensated based on firm performance (Cao, Pan, & Tian, 2011; Conyon & He, 2011; Firth, Fung, & Rui, 2006; Wang & Xiao, 2011); some of them also own firm shares, which are sensitive to stock prices. Hence, whether stock liquidity affects corporate risk-taking and if so, through which channel(s), are essentially empirical questions.
We begin our analysis using ordinary least squares (OLS) models with a full sample. Our results show that firms with more liquid stocks are associated with higher levels of future risk-taking. This effect is both statistically and economically significant. Our results are robust to the inclusion of numerous controls, the use of alternative measures of stock liquidity and risk-taking, and the inclusion of firm fixed effects to control for time-invariant factors. To establish the causality of liquidity on risk-taking, we next use a difference-in-differences (DID) approach using an SSSR sample. The results of this approach support our previous conclusion: Firms experiencing higher increases in liquidity during the SSSR exhibit higher levels of risk-taking than do firms experiencing no increase in liquidity.
We then perform two additional tests to reinforce our conclusion. First, to mitigate the possible omitted variables concern, we follow Fang et al. (2014) and use a dynamic change model for SSSR firms to investigate whether larger liquidity increases lead to greater corporate risk-taking. We find that firms experiencing a larger liquidity increase after the SSSR exhibit higher future levels of risk-taking. Second, to ensure that there are no observable differences between trends in risk-taking outcomes between our treatment and control groups prior to the SSSR, we use a propensity-score matching (PSM) approach. Following Bertrand and Mullainathan (2003) and Fang et al. (2014), we construct treatment and control groups and conduct our analysis using the PSM sample. The results show that our conclusions are robust to this analysis.
We then explore possible underlying mechanisms through which stock liquidity affects risk-taking in firms. We find that increases in liquidity lead to lower costs of capital. Our earlier discussion suggests that decreases in cost of capital increase risk-taking, where the effect is stronger in firms that are more dependent on external financing. The results of our cross-sectional analysis also confirm that the effect of liquidity on the cost of capital is stronger when the level of financial constraint is higher. In addition, we find evidence consistent with the conjecture that increased liquidity leads to higher PPS, which is consistent with the findings in Jayaraman and Milbourn (2012). 3 Taken together, our findings suggest that stock liquidity affects risk-taking through its influence on both the cost of capital and managerial incentives.
Finally, we conduct cross-sectional tests to rule out privatization as an alternative explanation for our results. Privatization is an effect generated by the SSSR, as the reform allows previously nontradable shares, including the nontradable SOE shares, to be freely traded on the Chinese stock markets. Prior studies suggest that privatization leads to improved firm profitability, productivity, investment, and innovation (e.g., Gupta, 2005; Liao, Liu, & Wang, 2014; Tan, Tian, Zhang, & Zhao, 2015). If our main findings above were caused by privatization, we should expect to find a stronger effect for SOEs than for non-SOEs. However, our empirical results do not support this prediction.
Our study contributes to the literature in several ways. First, to the best of our knowledge, our study is the first to investigate the causal effect of stock liquidity on corporate risk-taking. Our analysis is made possible by use of the quasi-natural experimental setting of the SSSR in China. Second, we find that stock liquidity increases future corporate risk-taking by decreasing the cost of capital and increasing PPS. Our article thus sheds light on how the capital market can be used to stimulate long-term economic growth. Third, our study contributes to the understanding the effects of the SSSR in China. Studies in this area focus on the privatization effect (Liao et al., 2014; Tan et al., 2015) and the corporate governance improvement effect (Q. Chen, Chen, Schipper, Xu, & Xue, 2012; Hope, Wu, & Zhao, 2017) of the SSSR. 4 By eliminating a significant source of market friction, however, the reform also brought about an exogenous shock to firm stock liquidity, which has its own effect on corporate risk-taking behavior.
The rest of the article is organized as follows: In the section “Hypothesis Development,” we develop our hypotheses. In the section “Research Design, Sample, and Descriptive Statistics,” we discuss the research design and our sample. We present the empirical results in sections “Empirical Analyses” and “The Channels” and conclude in section “Conclusion.”
Hypothesis Development
The Positive Effect of Stock Liquidity on Corporate Risk-Taking
There are several mechanisms through which stock liquidity might enhance corporate risk-taking. First, studies show that higher stock liquidity decreases the risk of investment in the secondary market. Specifically, stock liquidity stimulates the entry of informed investors, who make stock prices more informative for stakeholders (Fang et al., 2009; Khanna & Sonti, 2004). Thus, higher liquidity can increase the information content of a stock price, making it such that investors bear lower risk and require less return. It follows that higher liquidity lowers the cost of capital by reducing secondary market investment risk (e.g., Edmans et al., 2013; Fang et al., 2009).
Second, less liquid stocks are associated with higher issuing and transaction costs. Investors demand compensation not only for the risks they bear but also for the transaction costs they incur when buying and selling shares of their stocks. Stoll and Whaley (1983) note that stock transaction costs need to be considered when valuing equity investments. They suggest that higher stock transaction costs may explain the higher required rate of return on small stocks, being relatively illiquid. Subsequent studies find that firms with lower liquidity have higher implicit costs of external financing, including higher investment banking fees (Butler, Grullon, & Weston, 2005) and higher costs of equity (Lipson & Mortal, 2009). Taken together, these studies suggest that higher liquidity leads to a lower cost of capital. Because firms facing external financing costs make investment decisions by comparing a project’s returns (risk) with the associated cost of capital (Bolton et al., 2011; Copeland et al., 2000), a decrease in the cost of capital can increase the firm’s tolerance for failure and its likelihood of investing in riskier projects. The literature confirms that less financially constrained firms have a greater tolerance for failure and are thus more willing to take on risky projects (e.g., Kuang & Qin, 2014; Tian & Wang, 2014). For example, Tian and Wang (2014) show that initial public offerings (IPO) firms backed by more failure-tolerant venture capital (VC) investors invest more in riskier innovations and that capital constraints can negatively distort a VC firm’s failure tolerance. Kuang and Qin (2014) suggest that firms troubled by their credit ratings tend to decrease the managerial incentives for risk-taking. The literature also shows that a lower cost of capital leads to higher levels of risk-taking along different specifications (e.g., Bruno & Shin, 2014; Moshirian, Tian, Wang, & Zhang, 2018). For example, Bruno and Shin (2014) show that accommodative credit conditions are associated with greater risk-taking by way of lower risk-adjusted lending rates. Moshirian et al. (2018) propose that financial liberalization stimulates innovation through the relaxation of financial constraints for the reason that innovative firms usually rely heavily on external financing. Focusing on a specific industry, Paligorova and Joao (2017) present evidence that banks take more risks (e.g., charge risky borrowers lower loan spreads compared with safe borrowers) in periods of easing monetary policy than they do in periods of tightening. Based on the findings in these studies, we expect that the overall level of risk-taking will increase with liquidity.
Xiong and Su (2014) investigate the relation between stock liquidity and corporate capital allocation efficiency in China and find that greater stock liquidity helps to improve investment efficiency. In another study, Xu and Tian (2013) find that firms in China’s emerging economy are sensitive to cost of capital when making investment decisions. Hao and Liu (2008) find that companies generally increase investment when they can raise more money through equity financing. High liquidity in the stock market plus increased liquidity after the SSSR might help companies get equity financing at a lower cost and may in turn increase the level and overall risk of their investments. Taken together, these studies suggest that even in China, where there are many SOEs, investment and risk-taking behaviors are affected by the cost of capital.
Third, increases in stock liquidity can affect managerial compensation such that managers are more willing to take risks. For example, Jayaraman and Milbourn (2012) show that greater stock liquidity shifts the composition of executive compensation in favor of stock-based compensation. More specifically, their study shows that as stock liquidity goes up, the proportion of equity-based compensation in total compensation increases, while the proportion of cash-based compensation decreases. As a result, managerial PPS with respect to stock prices increases with liquidity (e.g., Fang et al., 2009; Jayaraman & Milbourn, 2012). Studies also show that managerial incentives can encourage managerial risk-taking (e.g., Armstrong et al., 2013; Armstrong & Vashishtha, 2012; Coles et al., 2006; Efendi et al., 2007; Gormley, Matsa, & Milbourn, 2013; Hayes, Lemmon, & Qiu, 2012; Low, 2009). For example, Low (2009), Hayes et al. (2012), and Gormley et al. (2013) document that increased equity-based compensation and PPS can result in greater managerial risk-taking. In sum, these studies suggest that when liquidity is high, managers have more incentive to implement riskier investments promising greater compensation. This in turn forecasts a positive association between stock liquidity and managerial risk-taking.
In China, in 2003, the State-Owned Assets Supervision and Administration Commission of the State Council (SASAC) issued its “Interim Regulations on the Evaluation of the Top Executive Operating Performance” for SOEs affiliated with the central government, stating clearly that “top executive pay should be aligned to total profits and sales” (SASAC, 2003). In 2007 and 2008, the SASAC announced two supplementary provisions of this regulation, making further efforts toward aligning SOE executive pay to firm performance. In 2006 and 2010, the SASAC updated this regulation with additional rules concerning such things as “the punishment of top executives when they were underperforming” (SASAC, 2006, 2010). In 2005, the China Securities Regulatory Commission (CSRC) issued the “Trial Regulation for the Stock Options Grants in Public Firms,” providing a framework for introducing equity incentives for listed firms, and introduced a new rule that “allowed publicly traded firms that have successfully completed stock split structural reforms to offer restricted stocks or stock options plans to their top management members” (CSRC, 2005). Studies confirm that executive compensation is positively correlated to firm performance in China (Cao et al., 2011; S. Chen, Lin, Lu, & Zhang, 2015; Conyon & He, 2011; Firth et al., 2006; Wang & Xiao, 2011). These regulations and the evidence of prior studies suggest that in China, increased stock liquidity, an outcome of the SSSR, might have a positive impact on executive compensation and managerial risk-taking.
The Negative Effect of Stock Liquidity on Corporate Risk-Taking
Stock liquidity may impede corporate risk-taking for at least two reasons. First, in the presence of information asymmetry between managers and investors, takeover pressure could induce managers to sacrifice long-term performance for current profits to prevent the stock from becoming undervalued (Stein, 1988). Because high-liquidity increases the probability of a hostile takeover attempt, it can also exacerbate managerial myopia and lead to lower levels of investment in long-term projects that are both risky and value-enhancing, such as innovations (e.g., Fang et al., 2014). 5
Second, high PPS due to increased liquidity makes managers’ wealth more closely tied to firm performance. As managers also invest their human capital to the firm and are unable to diversify their portfolio, they are risk averse by nature. High PPS may make managers even more risk averse, which results in less risk taking (Armstrong et al., 2013; Coles et al., 2006; Efendi et al., 2007).
In sum, both whether and how increases in stock liquidity impact a firm’s risk-taking are empirical questions. We thus propose our main hypothesis in an alternative format:
Research Design, Sample, and Descriptive Statistics
To examine whether market liquidity influences corporate risk-taking, we estimate the following model using data from a set of firms that completed the SSSR:

Following John et al. (2008) and Faccio, Marchica, and Mura (2011), we use two measures to proxy for corporate risk-taking. Our primary measure of corporate risk-taking is the volatility of industry-adjusted earnings, which is equal to

where

The second measure we use is the industry-adjusted earnings range, which is equal to

In both measures, EBITit is the earnings before interest and taxes of firm i at year t; ASSETSit is the total assets of firm i at year t; ROAit is the ratio of earnings before interests and taxes to the total assets of firm i at year t; adj_ROAit is the industry-adjusted ROA for firm i at year t; Nd, t is the number of firms within industry d at year t; and T represents 5-year overlapping windows (0 to +4, +1 to +5, +2 to +6, +3 to +7, +4 to +8, and so on).
We use two measures to characterize stock liquidity. Following Jayaraman and Milbourn (2012), our first measure of stock liquidity is the tradable turnover ratio (TOVER), defined as the average daily turnover ratio (the total shares traded in a day divided by total tradable shares) for a firm throughout the year. Our second measure of liquidity is the Amivest liquidity ratio (LR), following Amihud, Mendelson, and Lauterbach (1997) and Amihud (2002). The LR is defined as follows:

where Ritd and Vitd are stock i’s return and dollar volume (in millions), respectively, on day d at year t. Dit is the total number of trading days for stock i at year t. If increases to stock liquidity lead to a higher level of risk-taking, we expect α1 to be positive in Equation 1.
Following John et al. (2008), Faccio et al. (2011), and Li et al. (2011), we control for a variety of factors that have been found to affect corporate risk-taking behavior. Among these, we include firm size (Size), measured as the natural logarithm of total assets; leverage (Leverage), measured as the ratio of total debt to total assets; Tobin’s Q (Tobin’s Q), defined as the sum of the market value of tradable shares, the book value of nontradable shares, and liabilities scaled by the book value of total assets; profitability (ROA), defined as earnings before interest and taxes divided by total assets; and firm age (Ln_age), defined as the natural log of (1 + the number of years since IPO). We also include several variables (State, Ownership, and NTS) to control for the effect of ownership. State is an indicator variable equaling one for SOEs and zero otherwise. Ownership is the total cash flow rights of controlling shareholders on record with the company. NTS equals the number of nontradable shares divided by the total number of shares outstanding before the reform. All variables are defined in the appendix. All control variables are measured at the end of the first year of the sample period over which the volatility of earnings is measured. We include industry and year fixed effects and use standard errors that are robust to heteroskedasticity and clustered at the firm level in the regression.
Our sample period begins in 2003 and ends in 2009 because controlling shareholder data are not available before 2003 and measurements of risk-taking require 5-year overlapping periods. We obtain financial and stock price data and ownership information from the China Stock Market and Accounting Research (CSMAR) database. Our initial sample includes all Chinese A-share companies that completed the SSSR and were listed on the Shenzhen and Shanghai stock exchanges. Because the SSSR started in 2005 and we require the firms in our sample to have at least 1 year of observation prior to the SSSR, we require each firm to have been listed before December 31, 2004. We also exclude financial firms from the sample. Our final sample consists of an unbalanced panel of 1,284 firms, with a total of 7,987 firm-year observations (total sample hereafter).
Table 1, Panel A presents the distribution of our sample by year, showing that our sample firms are distributed almost evenly across the sample period. Panel B of Table 1 presents the industry distribution and shows that manufacturing firms account for the greater part of the sample (56.13 %). Panel C of Table 1 reports the descriptive statistics of our main variables. To mitigate the undue influences of outliers, we winsorize all continuous variables at the bottom and top one percentiles. The means of RiskT and RiskT2 are 0.050 and 0.110, with interquartile ranges of 0.040 and 0.095, respectively. The averages of TOVER and LR are 0.027 and 2.042, respectively. On average, 46.8% of the sample firms’ shares are nontradable (NTS), and 69.9% of sample firms are SOEs (State). The mean firm size (Size) is 21.410 (about RMB 1,987.21 million). Typical firms in the sample are not highly leveraged, with an average (median) leverage ratio of 53.5% (52.3%). The average return on assets (ROA) is 4.6%, indicating that the sample firms are in relatively good financial condition. The mean of Ownership is 32.95%, suggesting that the ownership structure in our sample is highly concentrated. In general, the values of these variables are reasonably distributed, and the descriptive statistics are comparable with what have been documented in prior studies (Hope et al., 2017; Li et al., 2011; Liao et al., 2014). In an untabulated correlation analysis, the correlation coefficients show that our stock liquidity measures (TOVER, LR) are positively associated with our risk-taking measures (RiskT, RiskT2).
Summary Statistics.
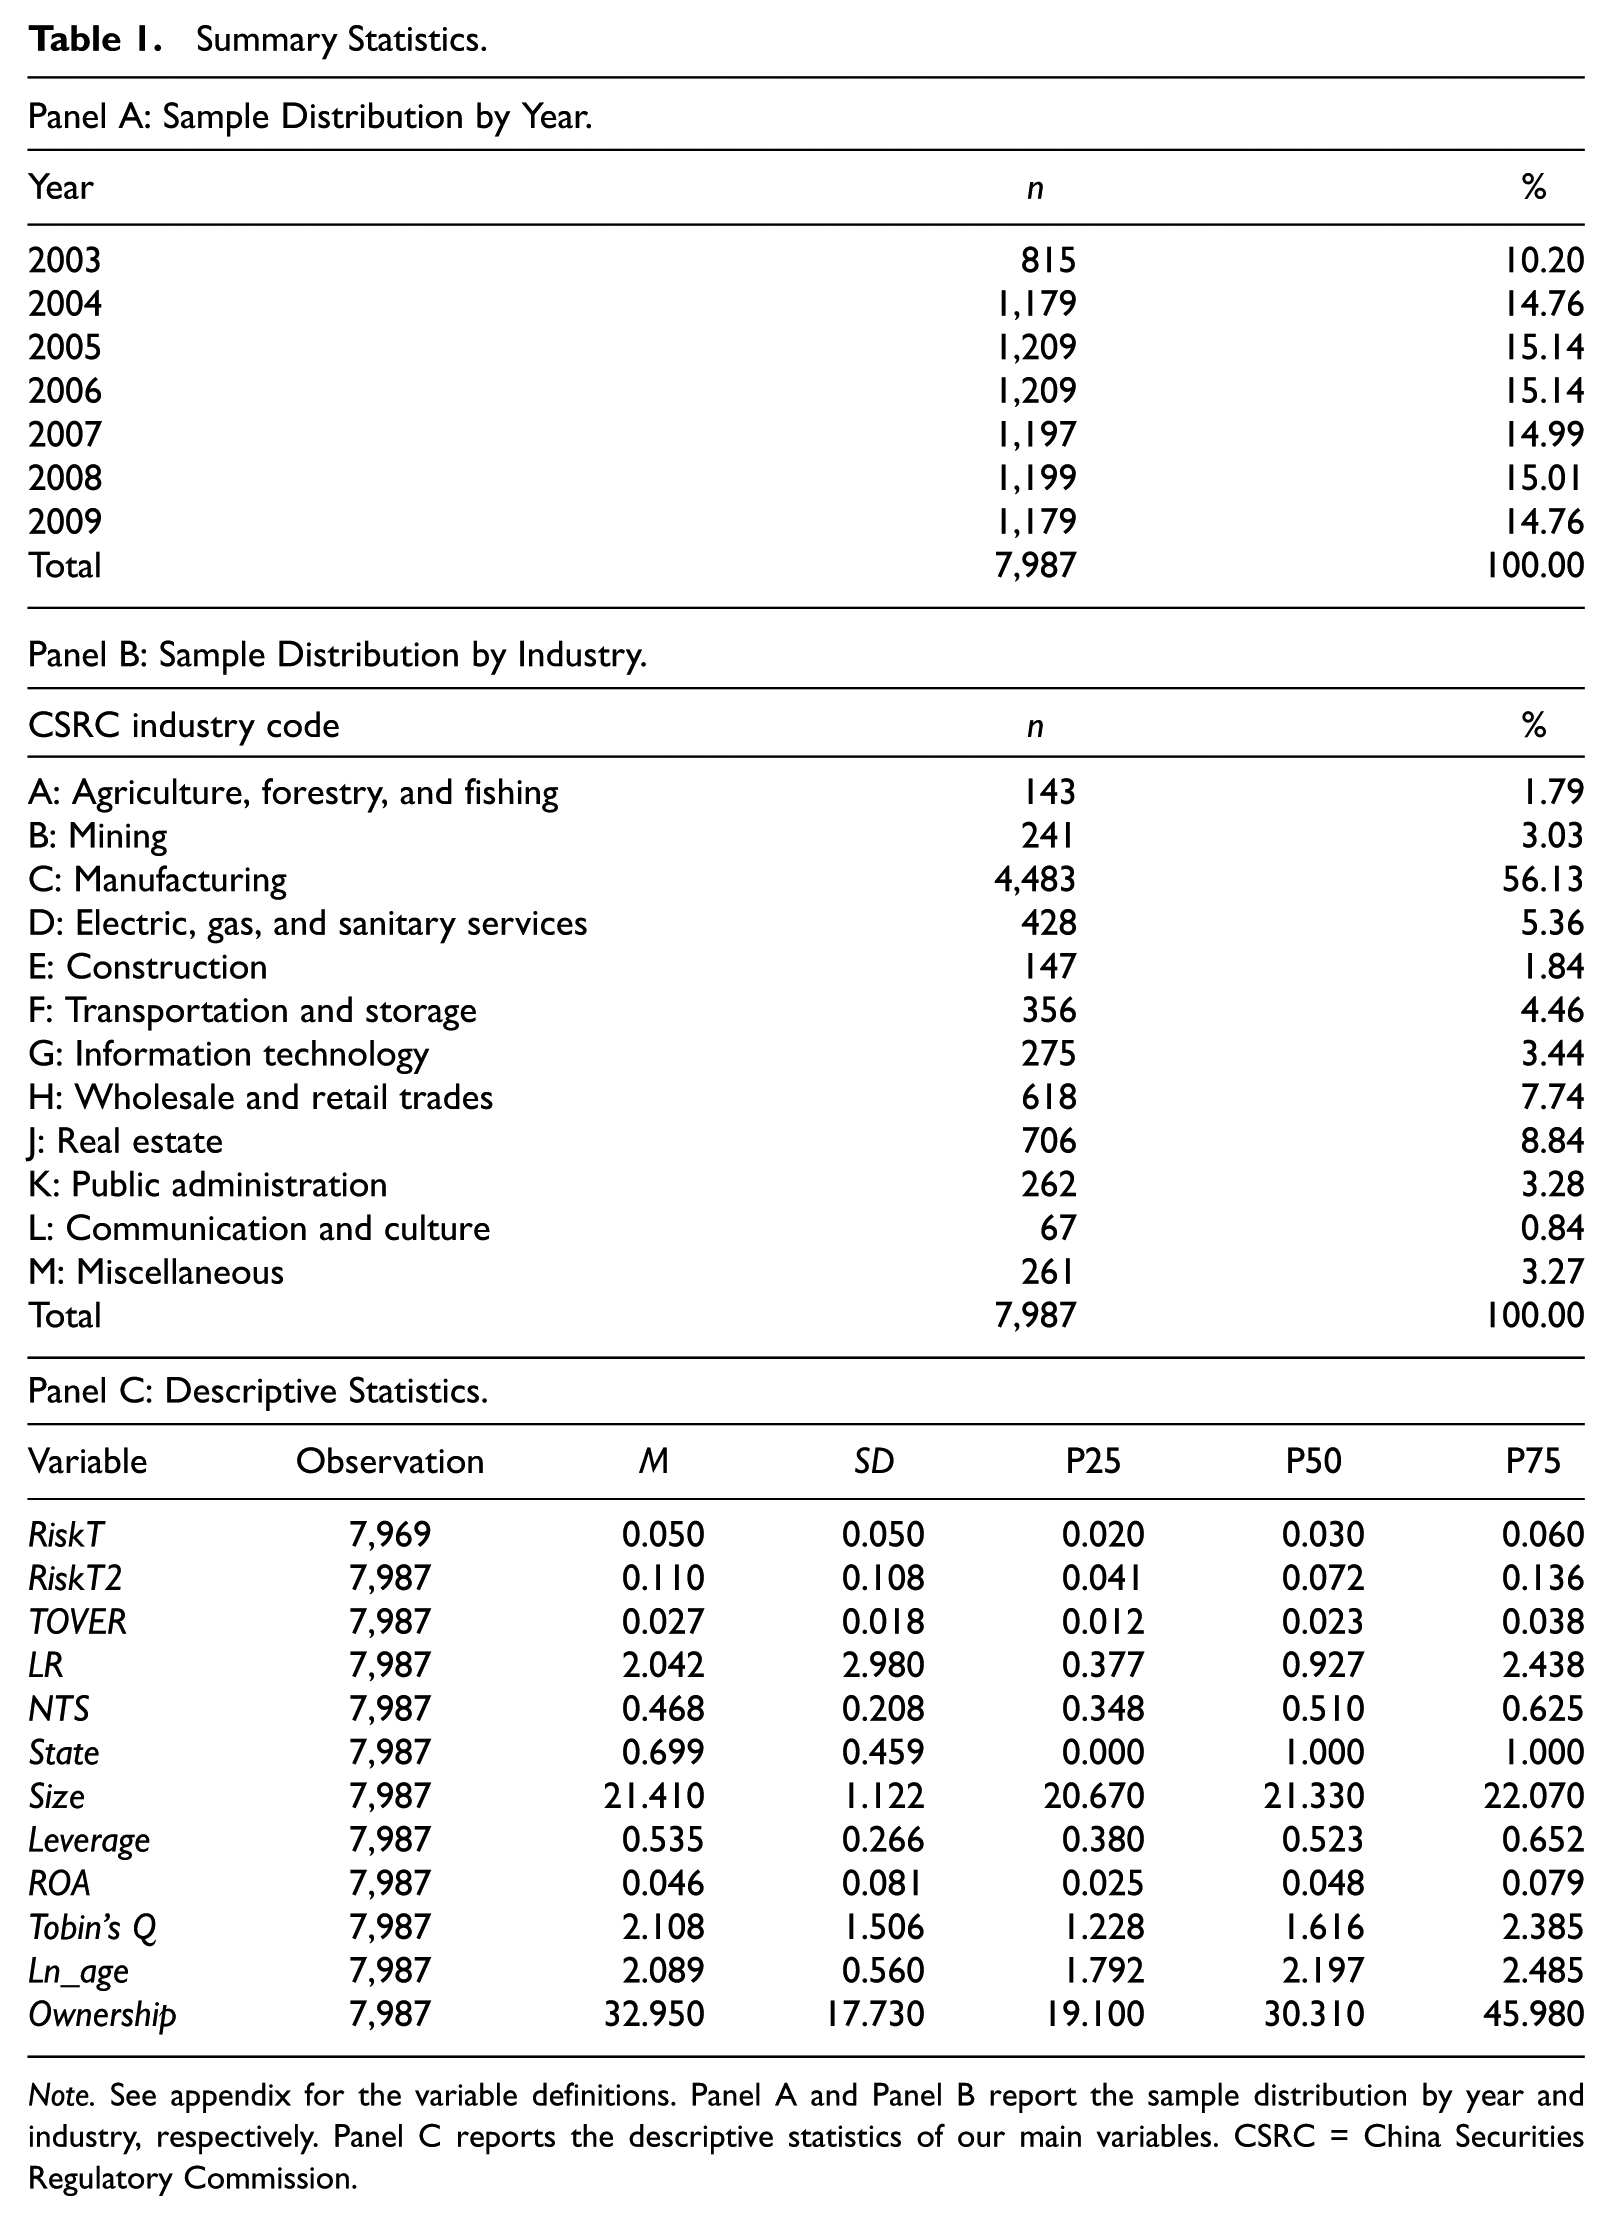
Note. See appendix for the variable definitions. Panel A and Panel B report the sample distribution by year and industry, respectively. Panel C reports the descriptive statistics of our main variables. CSRC = China Securities Regulatory Commission.
Empirical Analyses
Baseline Regressions
Table 2 reports the regression results of Equation 1, which examines the effect of stock liquidity on risk-taking. Columns 1 and 3 show the effects of TOVER on RiskT and RiskT2, respectively. The coefficients on TOVER are both positive and significant, 0.095, t = 2.84 in column 1; 0.235, t = 2.93 in column 3, indicating that firms with higher stock liquidity will take more risks in the future. The effect of stock liquidity on risk-taking is also economically significant. The results in columns 1 and 3 indicate that a one-standard-deviation increase in stock liquidity (TOVER) increases RiskT by 9.5% and RiskT2 by 13.45%. Columns 2 and 4 show the results for LR on RiskT and RiskT2, respectively. The coefficients on LR are both positive and significant, 0.001, t = 6.20 in column 2; 0.003, t = 6.02 in column 4, supporting Hypothesis 1.1 that firms with higher stock liquidity will take more risks in the future. The coefficients on the control variables are generally consistent with those in prior studies (John et al., 2008; Li et al., 2011). For instance, both large firms and more profitable firms are associated with lower levels of risk-taking.
The Effect of Stock Liquidity on Risk-Taking.
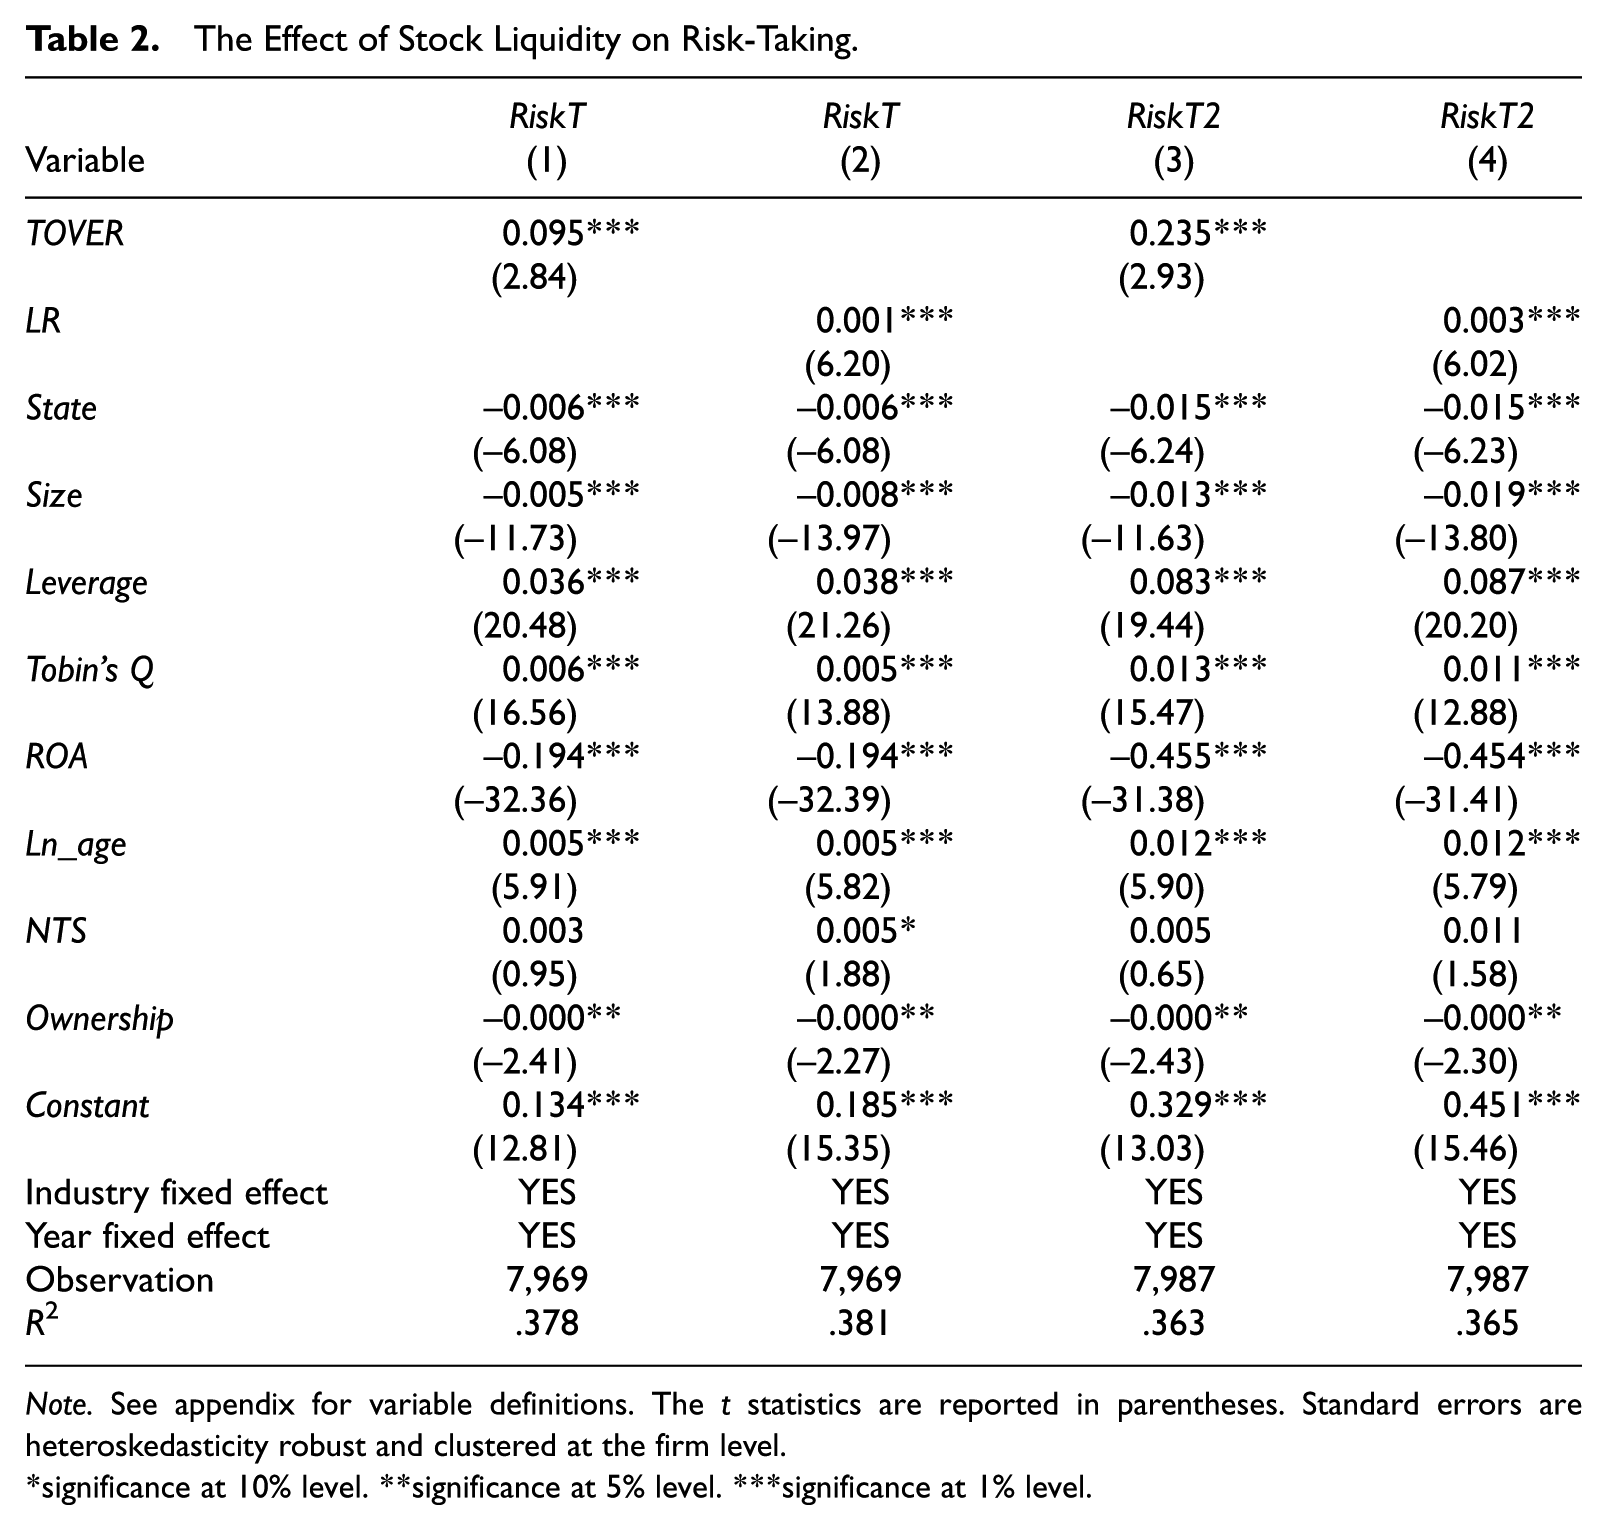
Note. See appendix for variable definitions. The t statistics are reported in parentheses. Standard errors are heteroskedasticity robust and clustered at the firm level.
significance at 10% level. **significance at 5% level. ***significance at 1% level.
Although the baseline specification model includes a list of common determinants of risk-taking, it may still omit some unknown firm characteristics that could explain the observed results. To ease this concern, we run fixed-effect regressions to control for the influence of unknown firm-level factors. We report the results of controlling for firm fixed effects in Table 3. These results are consistent with those derived from the baseline specification model. Both measures of liquidity (TOVER and LR) are significantly and positively related to risk-taking, suggesting that the baseline regression results are not seriously plagued by any omitted firm-level factors.
The Effect of Stock Liquidity on Risk-Taking: Firm Fixed Effect.
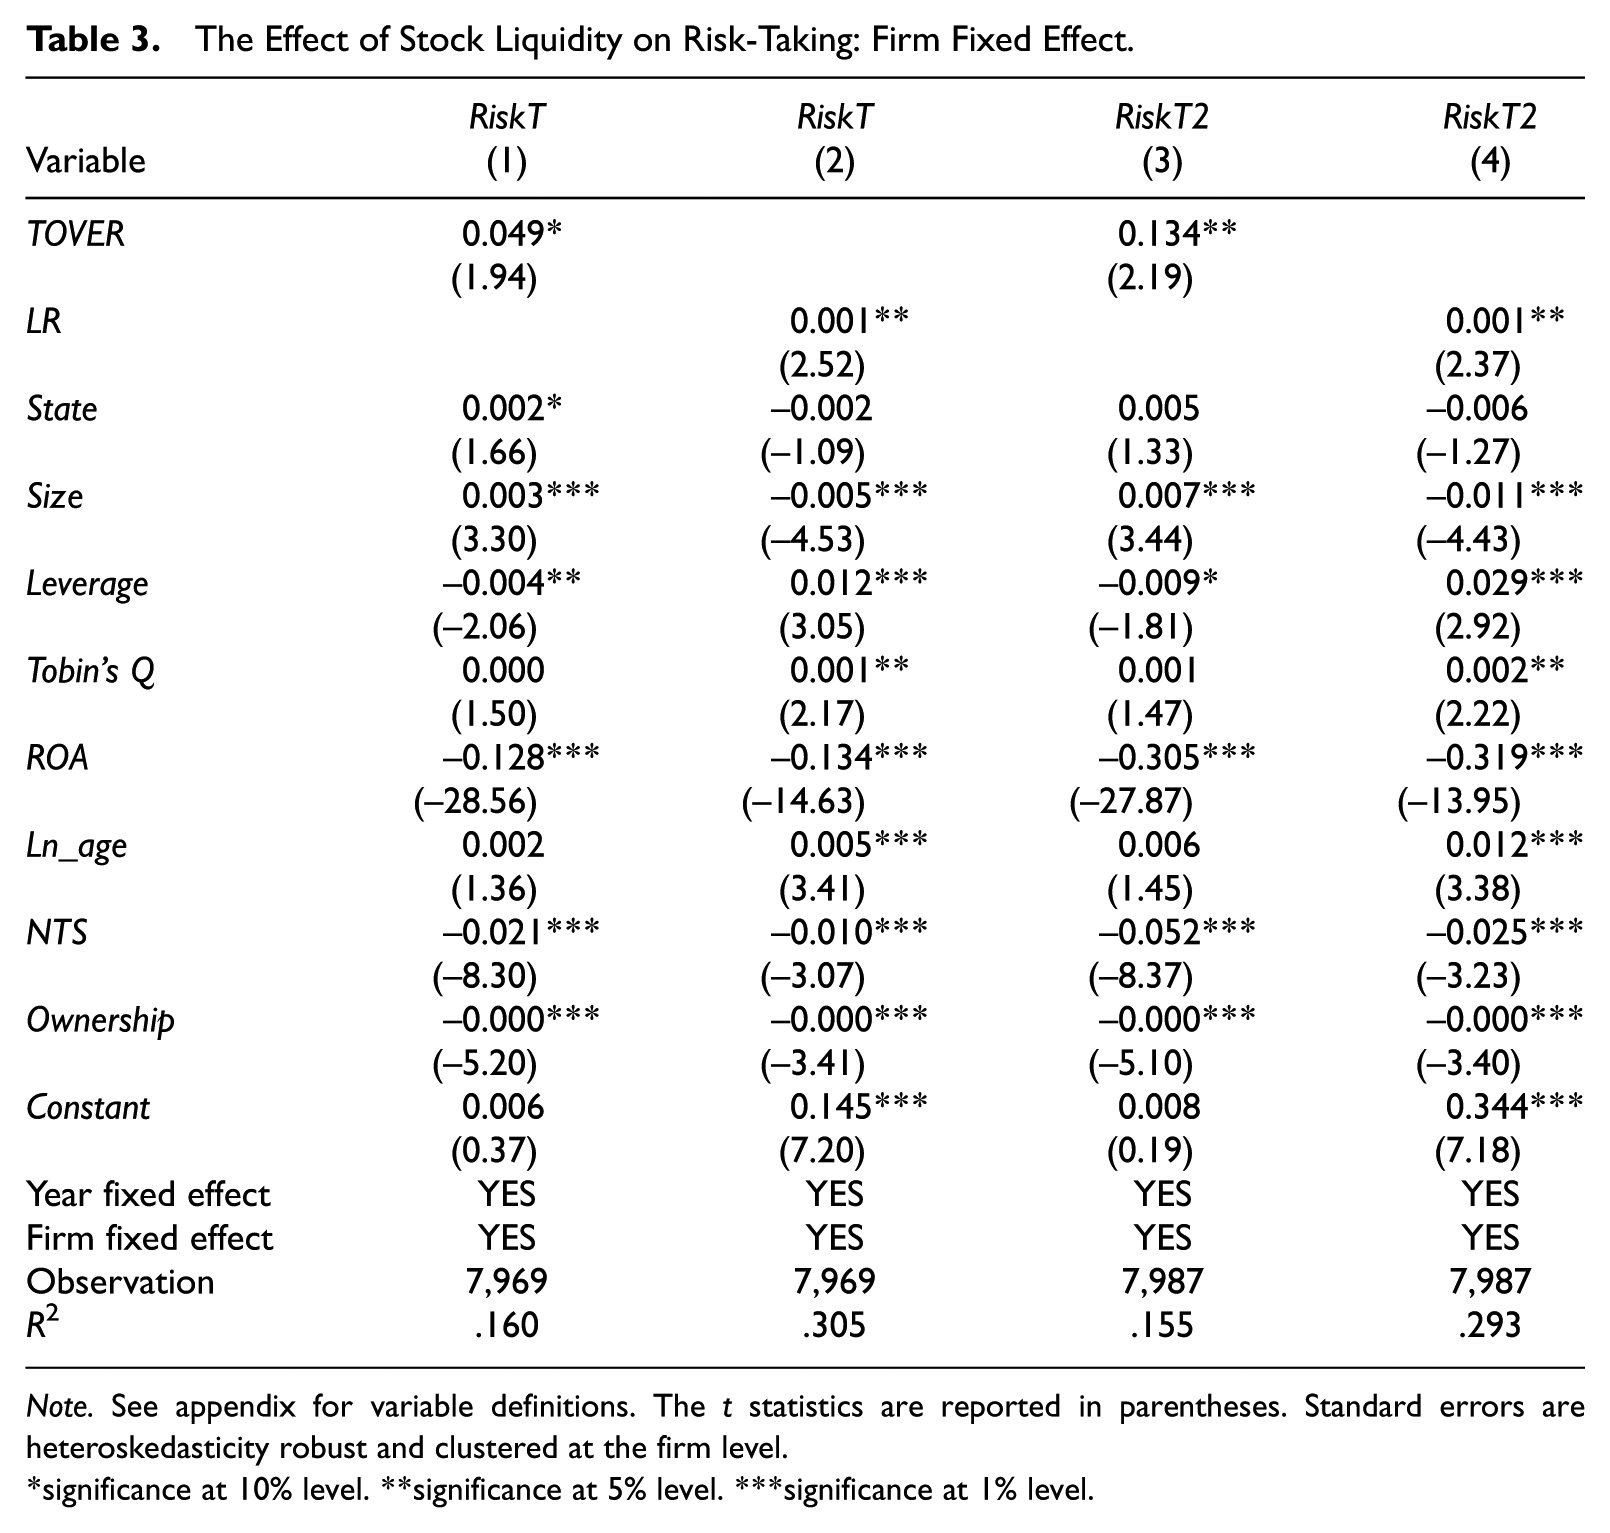
Note. See appendix for variable definitions. The t statistics are reported in parentheses. Standard errors are heteroskedasticity robust and clustered at the firm level.
significance at 10% level. **significance at 5% level. ***significance at 1% level.
Identifying the underlying causal relation is critical to the study of the effect of stock liquidity on corporate risk-taking behavior. One might argue that omitted variables could simultaneously affect both stock liquidity and risk-taking behavior. For example, studies show that better corporate governance could lead both to higher risk-taking (John et al., 2008) and higher stock liquidity (e.g., Chung, Elder, & Kim, 2010; Edmans et al., 2013). To establish causality, we exploit a quasi-natural experiment setting, the SSSR, enforced in China in 2005, which mandatorily converts nontradable shares on stock exchanges into freely tradable shares. The SSSR provides us with a plausibly exogenous variation in liquidity with which to evaluate the above endogeneity problem. The reform did not take place at the same time for every firm; it ranged over the period from 2005 to 2009 and was concentrated in the years 2005, 2006, and 2007. 6 This enables us to identify a treatment group and a control group. We use the firms that completed the reform in 2005 as our treatment group and the firms that completed it in 2007 or later as our benchmark group. 7 We then estimate the following regression using the data that consist of both treatment and benchmark firms from 2004 (i.e., prereform) and 2006 (i.e., postreform) (SSSR sample hereafter):

where Treat is an indicator variable that equals 1 if the reform occurred in year 2005 and 0 if the reform occurred in year 2007 or later and Post is a time indicator that equals 1 for the year 2006 and 0 for 2004. 8 All of the other variables are defined as in Equation 1. We include industry fixed effects and use standard errors that are robust to heteroskedasticity and clustered at the firm level in the regression.
Table 4, Panel A presents the detailed distribution of our SSSR sample. As shown in Panel A, we have 228 treatment firms with 445 observations and 169 control firms with 338 observations. Panel B reports the summary statistics for the variables used in our DID analysis. Panel C shows the change in stock liquidity around the SSSR. Specifically, the change is calculated as the difference in stock liquidity proxies (TOVER and LR) between the prereform and postreform values. The results in Panel C show a large increase in liquidity after the reform, suggesting that the SSSR does indeed create a shock in market liquidity. Panel D presents the change in risk-taking from before to after the reform for the control and treatment groups. Our results indicate an increase in risk-taking for treatment firms after the reform along with a parallel decrease in risk-taking for control firms. The differences in temporal change to the risk-taking variable between the treatment group and the control group are significant for both risk-taking measures.
The Effect of Stock Liquidity on Risk-Taking: The DID Approach.
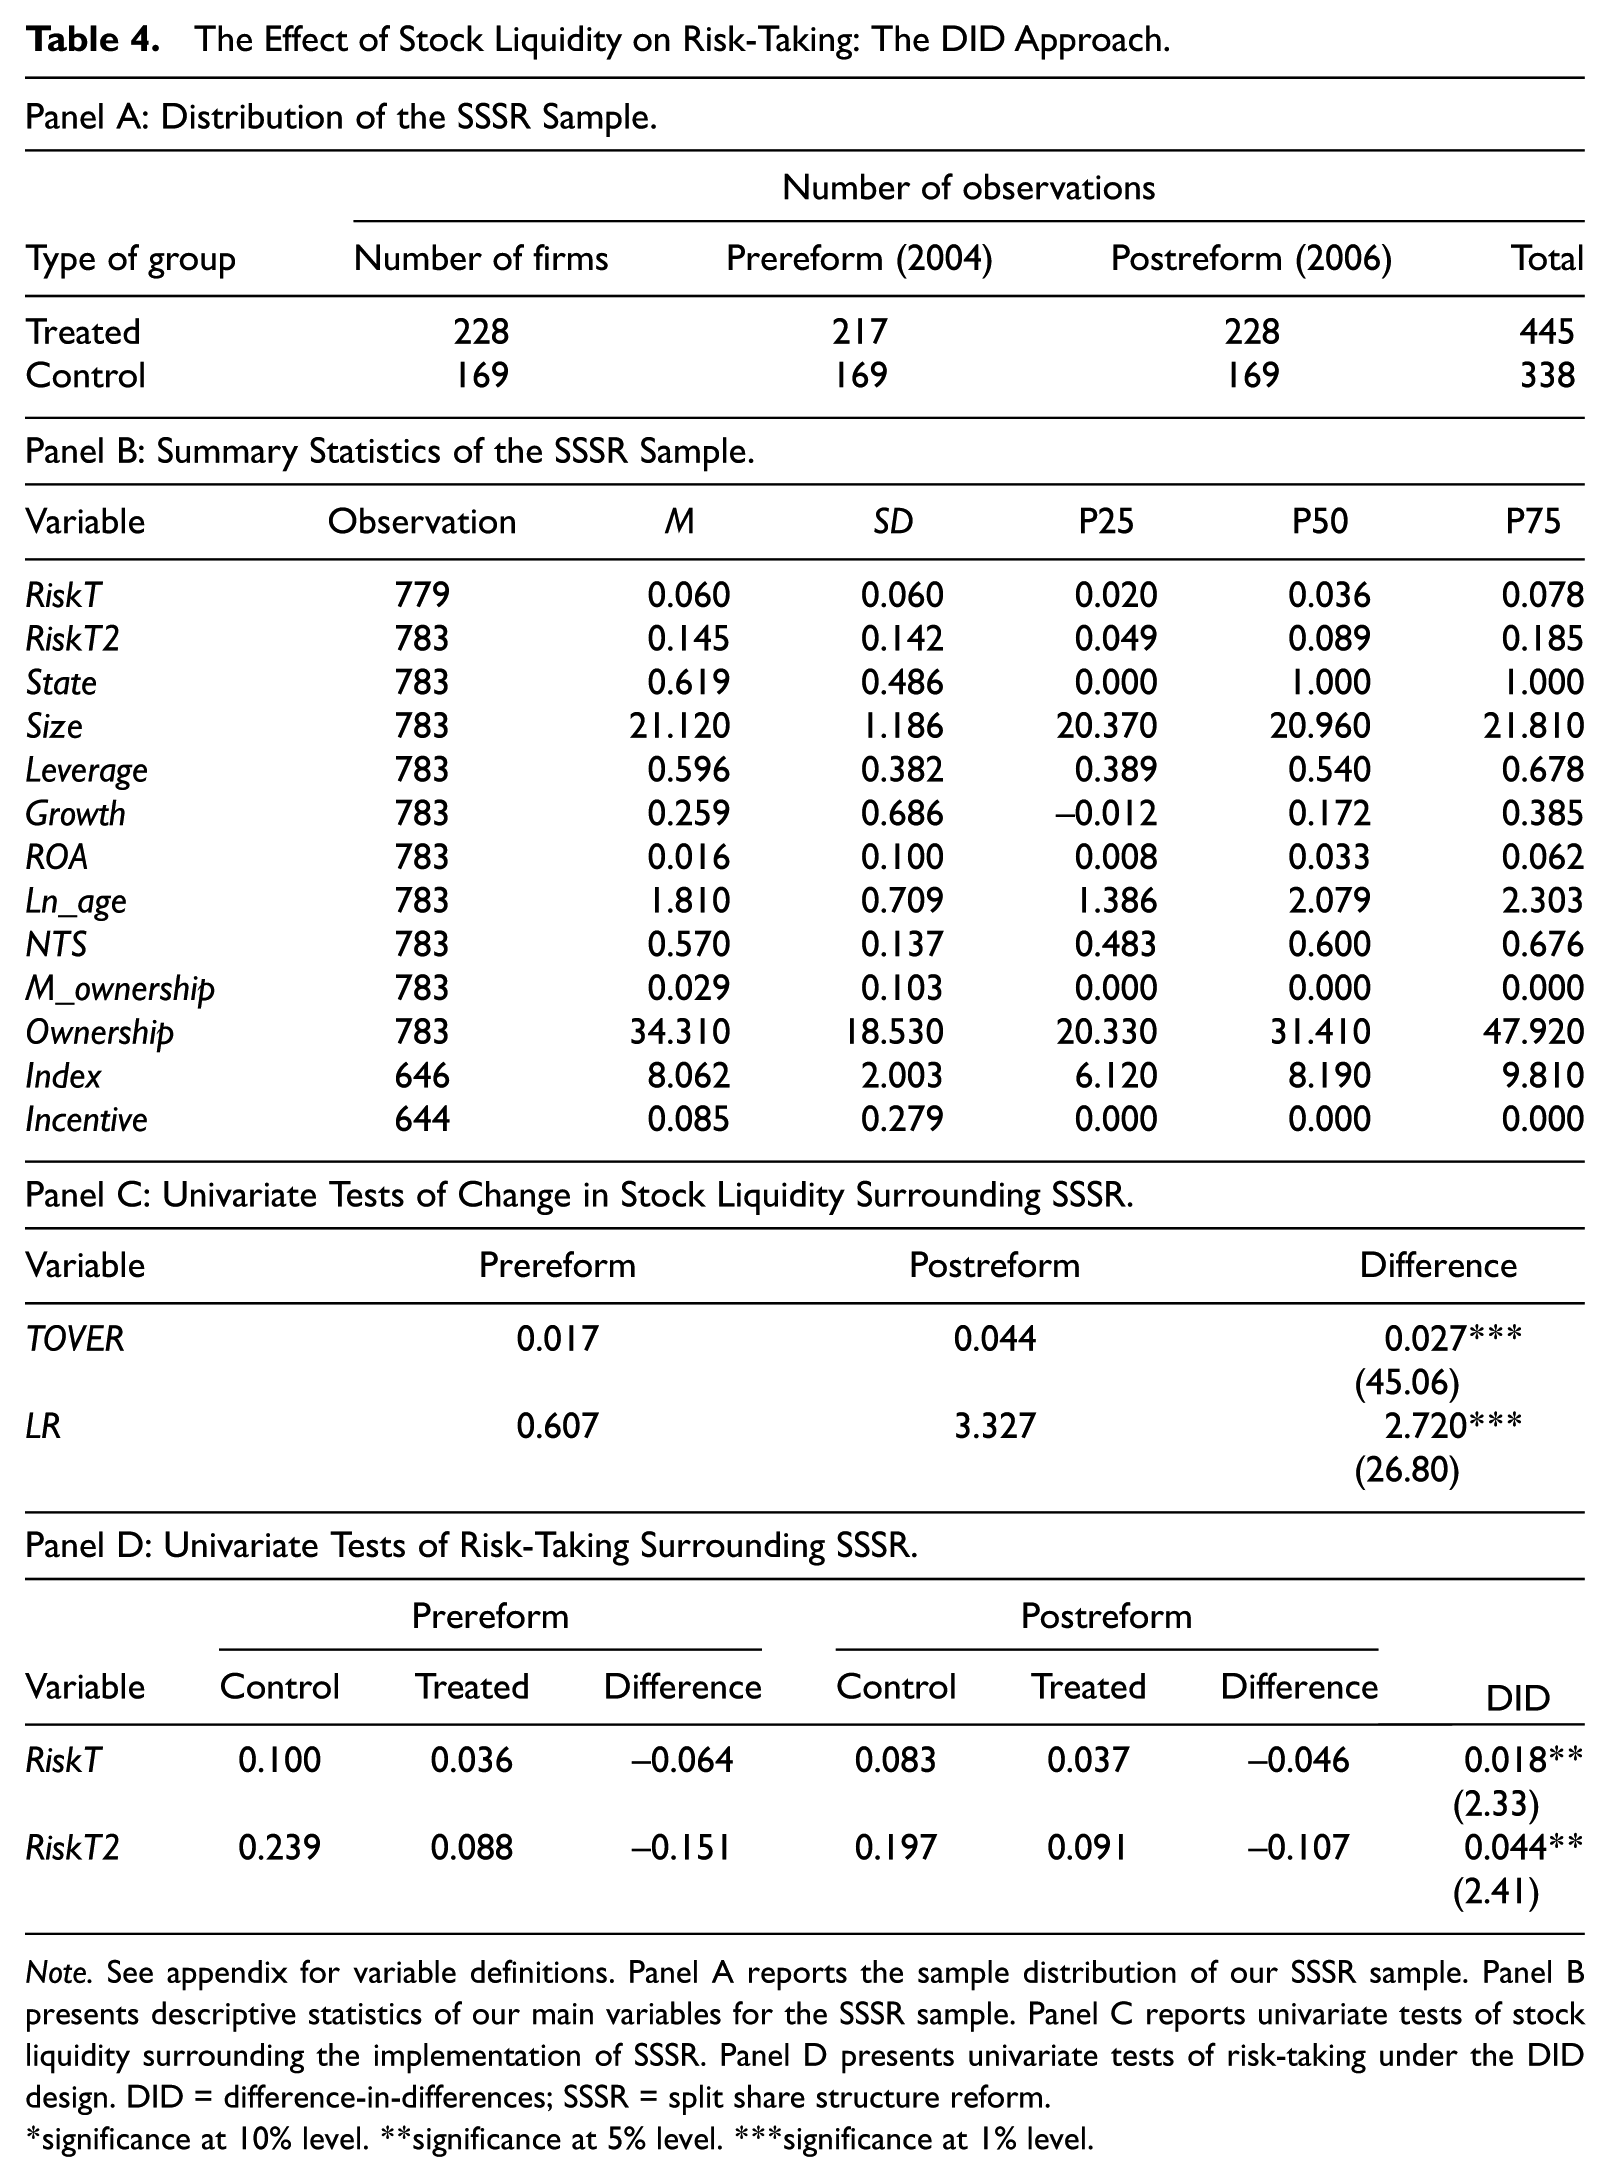
Note. See appendix for variable definitions. Panel A reports the sample distribution of our SSSR sample. Panel B presents descriptive statistics of our main variables for the SSSR sample. Panel C reports univariate tests of stock liquidity surrounding the implementation of SSSR. Panel D presents univariate tests of risk-taking under the DID design. DID = difference-in-differences; SSSR = split share structure reform.
significance at 10% level. **significance at 5% level. ***significance at 1% level.
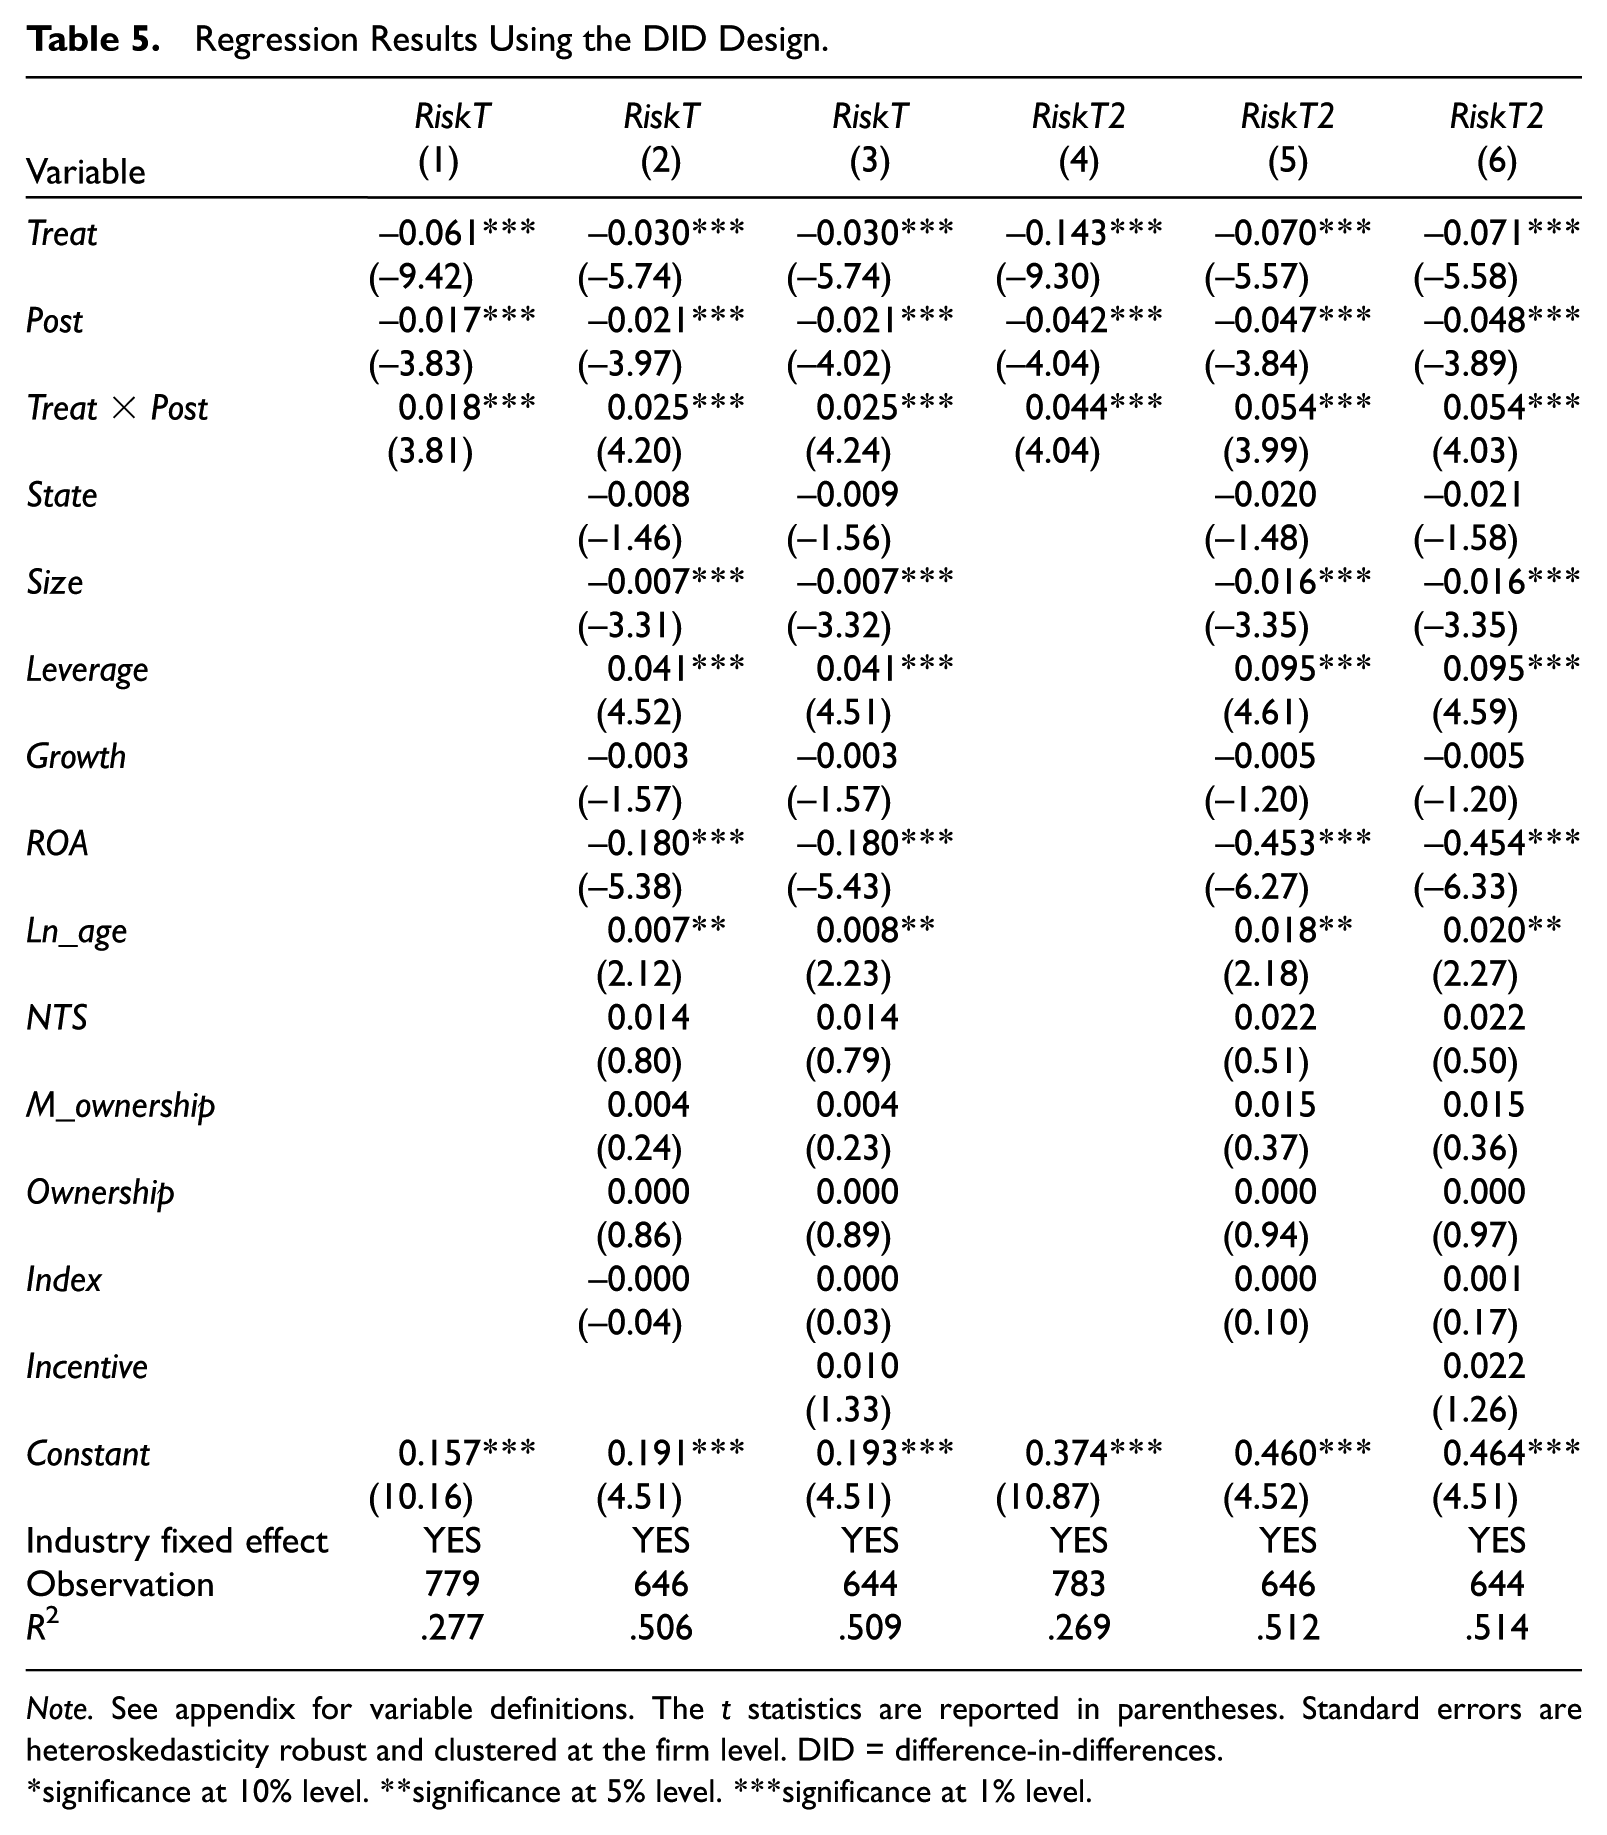
Table 5 reports the estimation results of Equation 2. 9 The coefficients on Treat and Post are all negative and significant, consistent with those reported in Panel D of Table 4. The coefficients on the interaction term (β3) are all positive and significant from column 1 to column 6, suggesting that the increase in liquidity caused by the reform leads treatment firms to become more risk-taking than firms that do not experience such a shock. That is, we document a relative increase in risk taking following the reform in the treatment group as compared with the control group. Our findings are also economically significant. For example, the estimated coefficients in column 2 and column 5 suggest that the SSSR leads to 2.53% (e0.025– 1) and 5.54% (e0.054– 1) increases in corporate risk-taking, respectively.
Regression Results Using the DID Design.
Note. See appendix for variable definitions. The t statistics are reported in parentheses. Standard errors are heteroskedasticity robust and clustered at the firm level. DID = difference-in-differences.
significance at 10% level. **significance at 5% level. ***significance at 1% level.
Robustness Checks
The change model
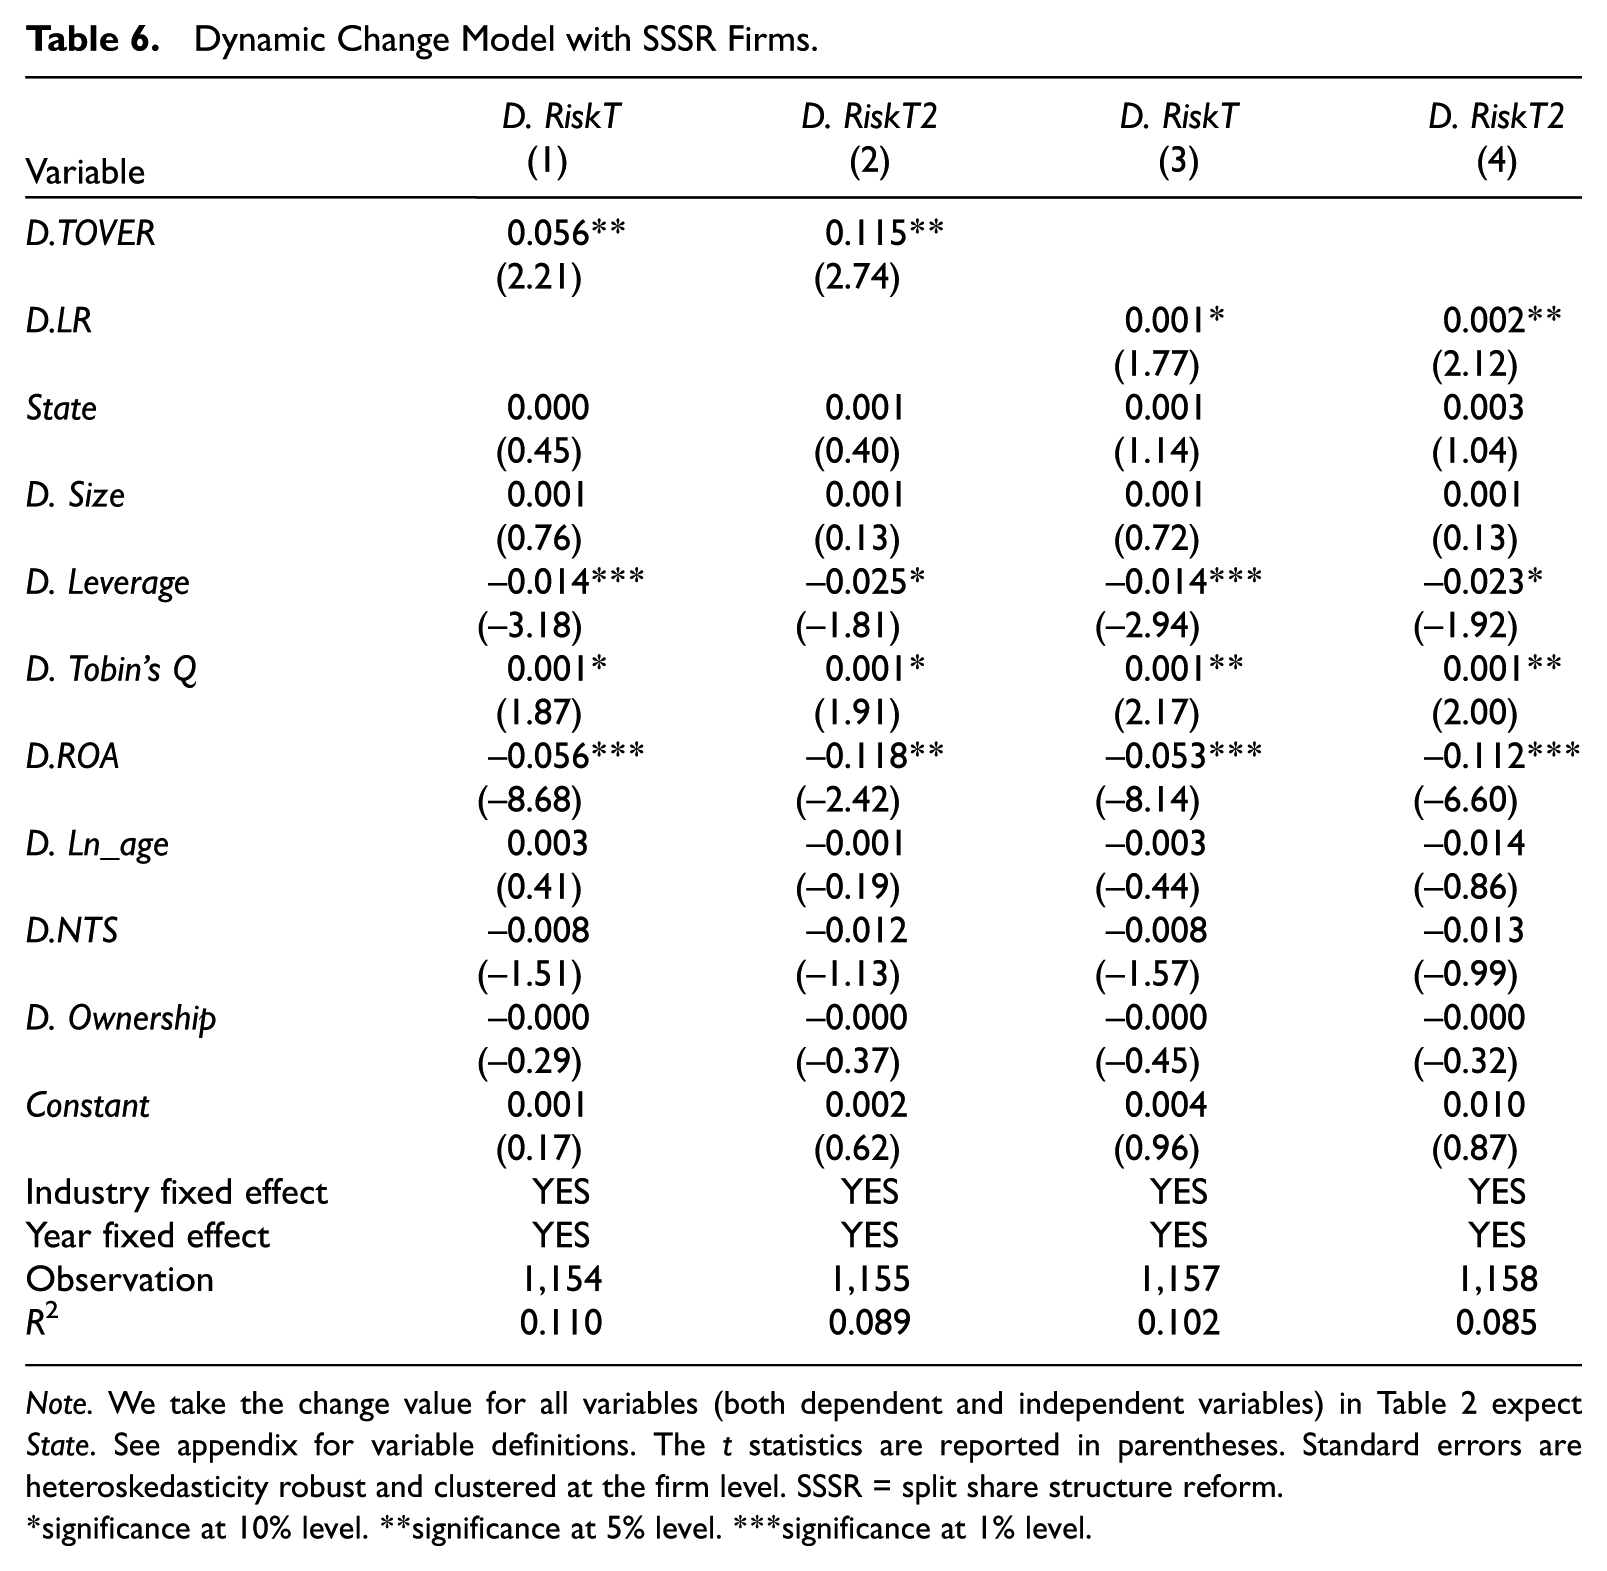
To mitigate the possible omitted variables concern, following Fang et al. (2014), we also use a dynamic change model tracking only SSSR firms to test whether larger liquidity increases lead to greater risk-taking. Specifically, we compare the level of risk-taking in the prereform year and the postreform year for each SSSR firm, requiring that there be observations for each firm in both years. The change model results are shown in Table 6. The coefficients on change of liquidity (D.TOVER and D.LR) are positive and significant in all columns, treating changes in risk-taking (D. RiskT and D. RiskT2, respectively) as dependent variables. Thus, our main results are robust to this alternative approach.
Dynamic Change Model with SSSR Firms.
Note. We take the change value for all variables (both dependent and independent variables) in Table 2 expect State. See appendix for variable definitions. The t statistics are reported in parentheses. Standard errors are heteroskedasticity robust and clustered at the firm level. SSSR = split share structure reform.
significance at 10% level. **significance at 5% level. ***significance at 1% level.
The PSM approach
To verify that there are no observable different trends in risk-taking outcomes between the treatment group and control group prior to the SSSR, we use a PSM approach. Following Bertrand and Mullainathan (2003) and Fang et al. (2014), we use the PSM approach to construct treatment and control groups and conduct the analysis within the PSM sample. We estimate a logistic regression using Treat as the dependent variable and include all control variables used in the baseline OLS regressions before the reform. The logistic regression estimates the likelihood that a firm completes the reform in a given year. Specifically, a firm is defined as a treatment firm (Treat = 1) in year t if the firm completes the reform in that year. Otherwise, it is defined as a control firm (Treat = 0) in year t. Using the predicted propensity score from this logistic regression, we then match each treatment firm with a control firm in year t using the closest propensity score. For both treatment and control firms in year t, we retain their observations from 1 year before (year t– 1) and 1 year after the event year (year t+ 1) to create the PSM sample. We also ensure that each control firm in year t does not have the SSSR event in year t– 1 and year t+ 1 to ensure that the observations in the control group are not affected by the SSSR event. Similar to Tables 4 and 5, we do not include the event year (i.e., year t) in the PSM sample. We get 3,228 observations in this sample. As discussed, the reform did not take place at the same time for every firm. The year of reform varied from 2005 to 2009, and most reforms took place in 2005, 2006, and 2007. This helps to avoid the common identification challenge that omitted variables can coincide with a single shock and directly affect risk-taking.
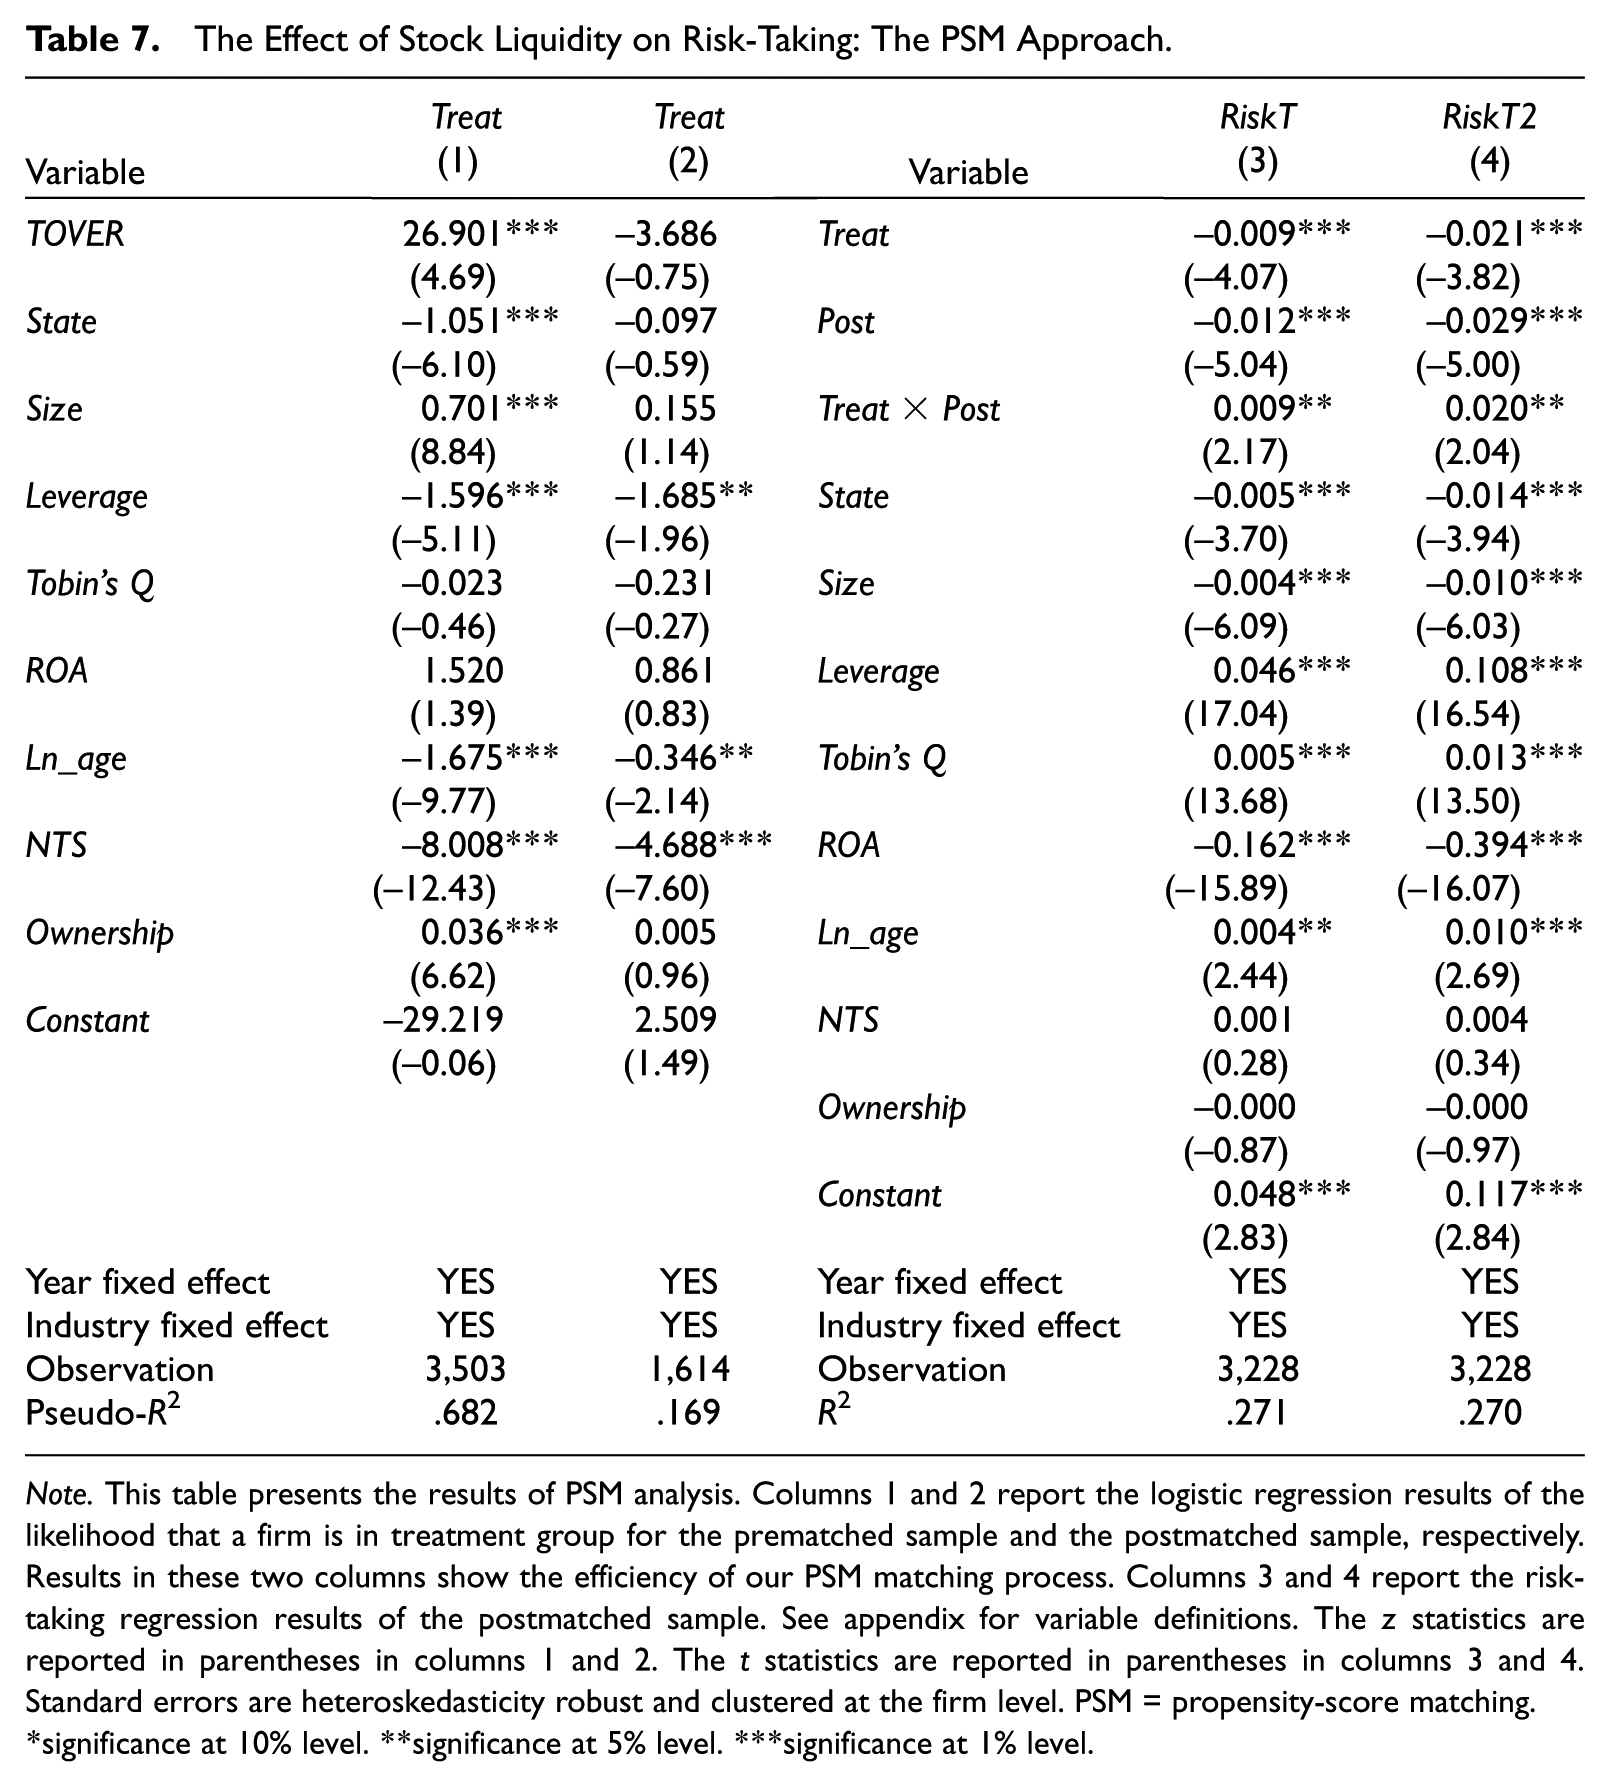
We present the results of the PSM method in Table 7. Column 1 and column 2 show the efficiency of the matching process. We report the logistic model results for the prematched sample in column 1. We then reestimate the logistic model using the postmatched sample and report the estimation results in column 2. As shown in column 2, there is no significant difference in the key characteristics between firms in the treatment and control groups, suggesting that the matching process is efficient. The regression results in columns 3 and 4 indicate that the coefficients on the interaction term (Treat×Post) are positive and significant at the 5% level, 0.009, t = 2.17 in column 3; 0.020, t = 2.04 in column 4, using RiskT and RiskT2, respectively, as dependent variables. These findings suggest that firms affected by the SSSR (treatment firms) take more risks after the reform compared with matched control firms unaffected by the SSSR.
The Effect of Stock Liquidity on Risk-Taking: The PSM Approach.
Note. This table presents the results of PSM analysis. Columns 1 and 2 report the logistic regression results of the likelihood that a firm is in treatment group for the prematched sample and the postmatched sample, respectively. Results in these two columns show the efficiency of our PSM matching process. Columns 3 and 4 report the risk-taking regression results of the postmatched sample. See appendix for variable definitions. The z statistics are reported in parentheses in columns 1 and 2. The t statistics are reported in parentheses in columns 3 and 4. Standard errors are heteroskedasticity robust and clustered at the firm level. PSM = propensity-score matching.
significance at 10% level. **significance at 5% level. ***significance at 1% level.
Note that our PSM sample in Table 7 is drawn within the total sample to improve the matching efficiency. 10 The increase in matching efficiency helps rule out omitted trends that are correlated with liquidity and risk taking in both the treatment and the control groups. We also repeat our DID analysis by drawing the sample from within the SSSR sample used in Tables 4 and 5. Our results, untabulated, are similar to those reported in Table 7.
Alternative measures
In a different set of robustness tests, we reestimate our models in Tables 2 and 5 using alternative measures of risk-taking and stock liquidity. First, we use two alternative measures of risk-taking, RiskT3 and RiskT4, following John et al. (2008) and Faccio et al. (2011). Specifically, RiskT3 is the standard deviation of industry-adjusted firm-level profitability over a given 5-year period, where profitability is measured as a firm’s earnings before interest, tax, depreciation, and amortization (EBITDA) divided by total assets. RiskT4 is the difference between the minimum and maximum EBITDA/Assets over the 5-year period. Our results (untabulated) are similar to those reported in Tables 2 and 5. Second, we also use the standard deviation of market-adjusted stock returns and the range of market-adjusted stock returns as two alternative return-based risk-taking measures, following John et al. (2008) and Faccio et al. (2011). Our main results continue to hold. Third, we use the percentage of zero returns during the fiscal year to measure stock liquidity following Lesmond (2005). The untabulated results show that our main results are robust. 11
In our DID analyses, we use earnings volatility from year t to t+ 4 to measure corporate risk-taking following prior literature. One concern about this construct is that some postreform data are used in calculating prereform risk-taking. However, to the extent the reform leads to an increase in risk-taking, using some postreform data in calculating prereform risk-taking likely works against us finding the significant results in our DID analysis. This is because the overlap of the two periods likely reduces the difference in risk taking between the two periods, especially in the treatment group. Nonetheless, we conduct two additional tests to address this concern. First, we use 3-year earnings volatility (t to t+ 2) as an alternative risk-taking proxy and reestimate our regressions in Table 5. Using 3-year instead of 5-year window to calculate risk-taking measure reduces the overlap between pre- and postreform periods. The untabulated results show that our results are unaffected. Second, we use the 2000 to 2004 period to measure the prereform year’s (i.e., 2004s) risk taking and find similar results. This is a reasonable approach if firms’ risk taking behavior is reasonably stable in the prereform period.
The Channels
Cost of Capital
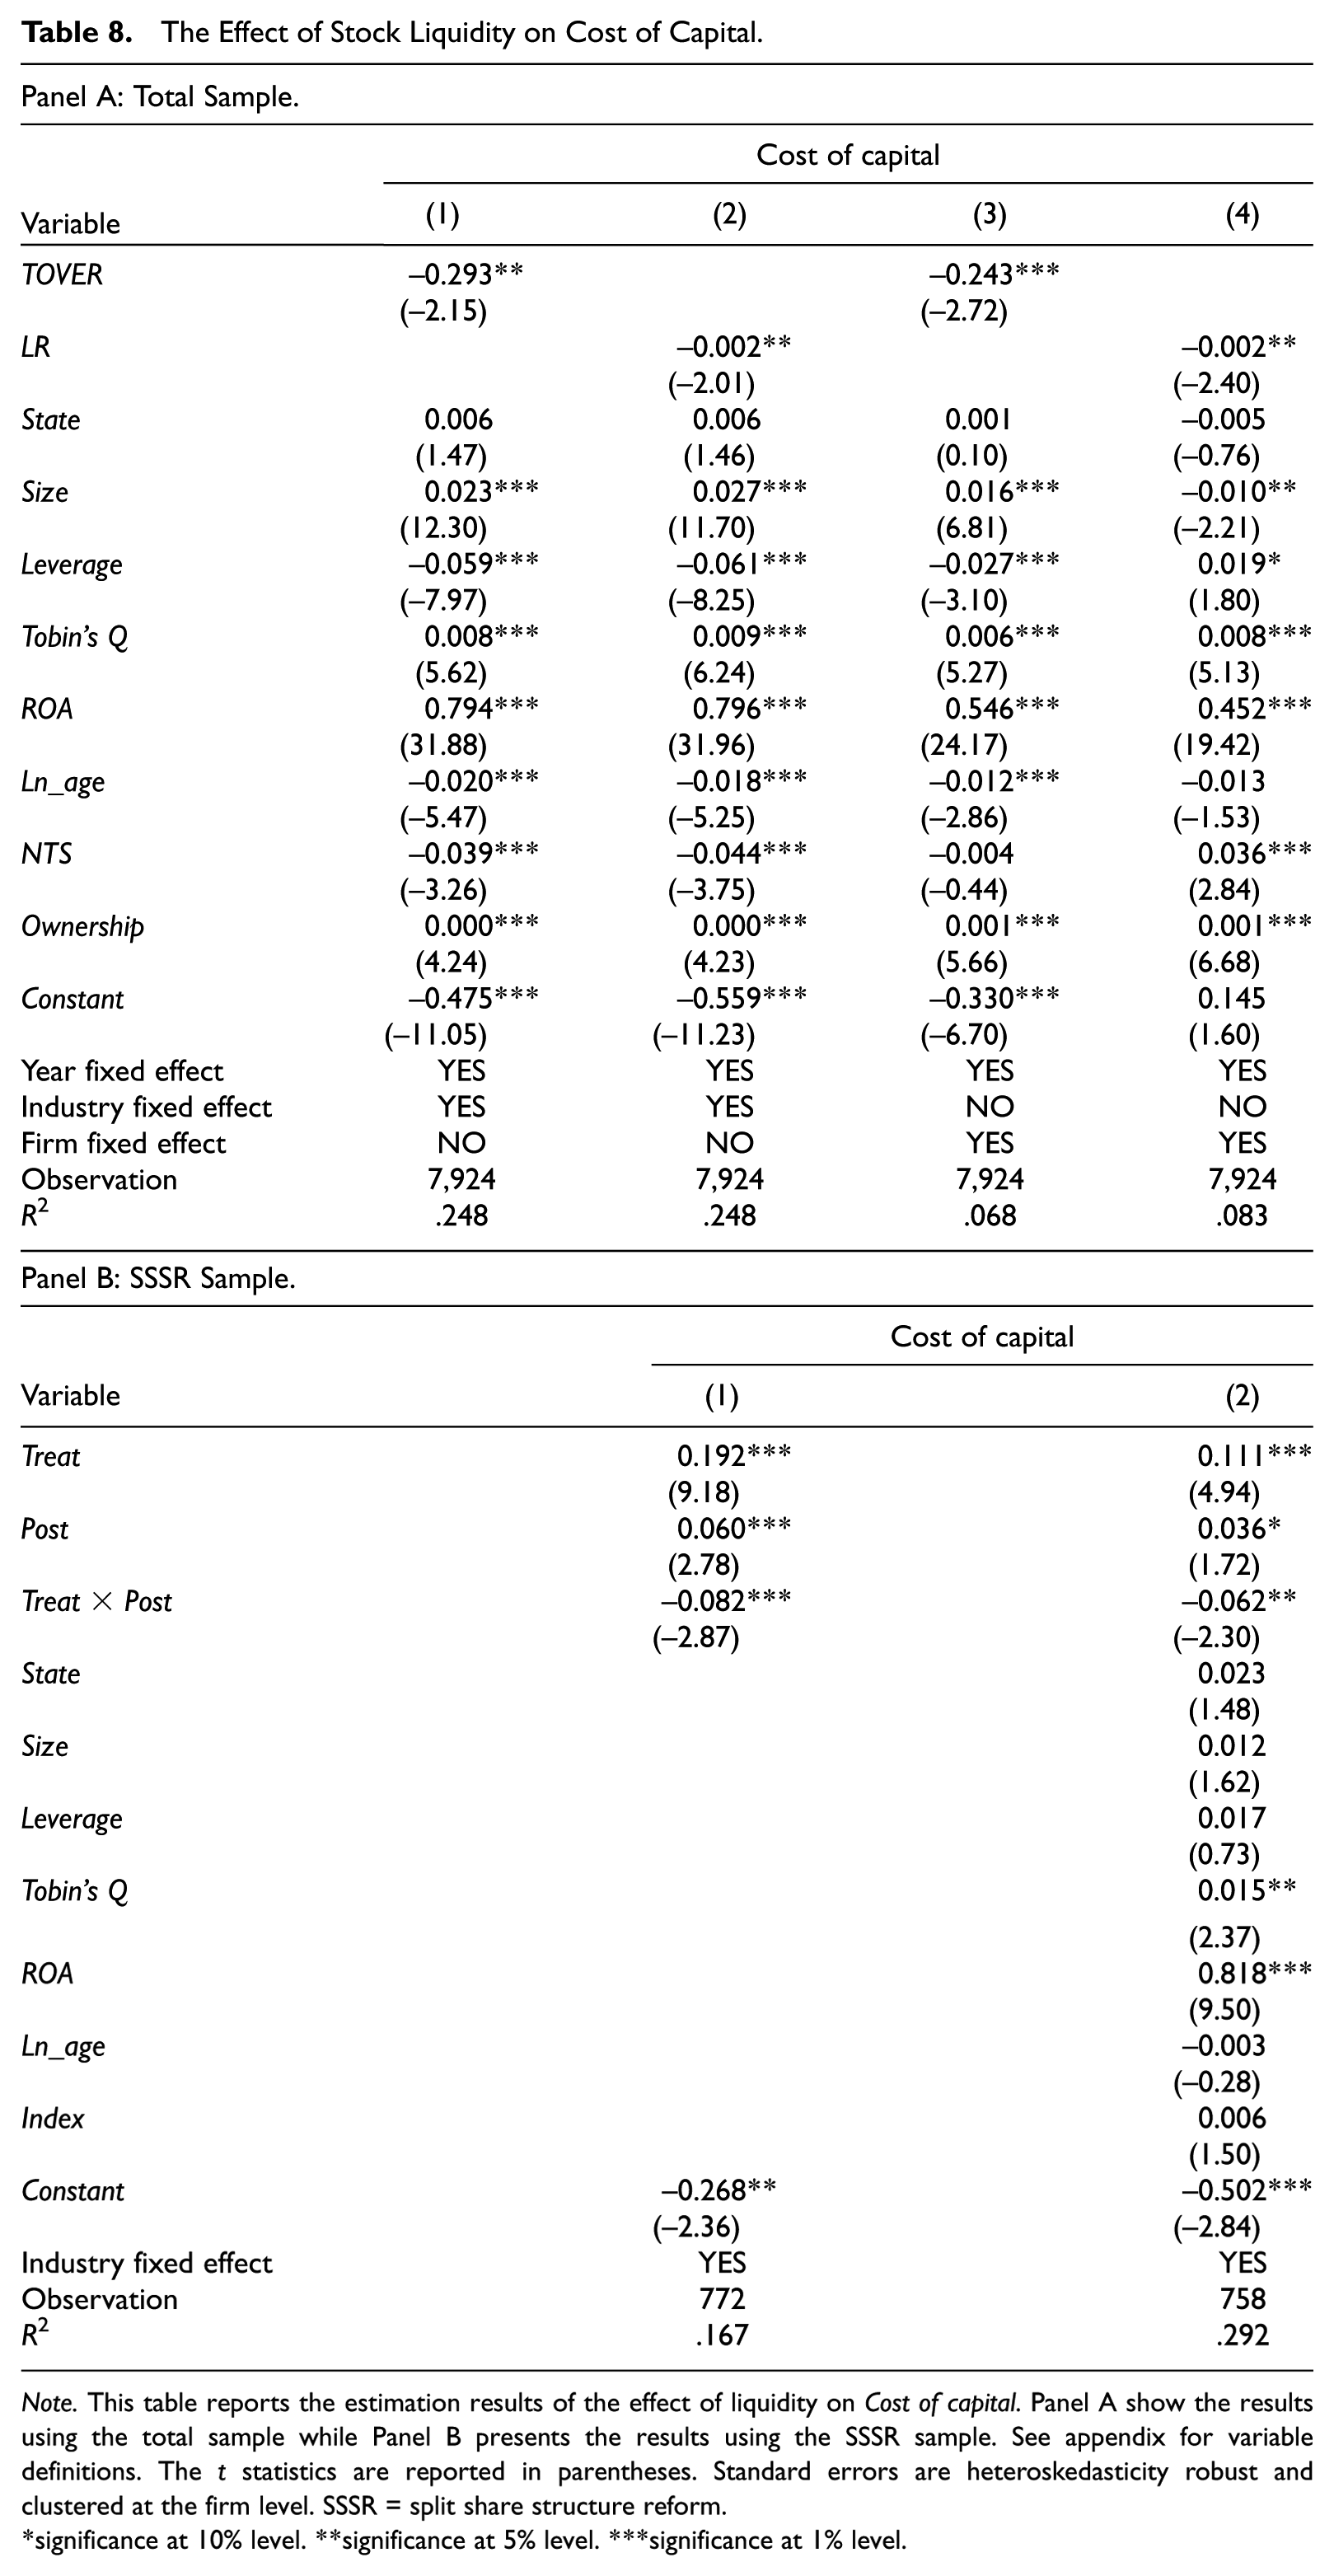
Next, we explore some potential underlying mechanisms through which stock liquidity increases corporate risk-taking. If an increase in market liquidity can decrease risk level and decrease the transaction costs of a firm’s stock, we expect that the cost of capital will decrease. As discussed earlier, this effect will be greater for firms facing more stringent financial constraints. We first reestimate Equations 1 and 2 with the cost of capital as the dependent variable using our total sample and the SSSR sample, respectively. We define the cost of capital (Cost of capital) as the firm-specific cost of equity capital under the price/earnings to growth ratio (PEG ratio) approach following Easton (2004) and H. Chen, Chen, Lobo, and Wang (2011). The results are shown in Table 8. 12 In Panel A, our results based on the total sample show that high-liquidity firms are generally associated with a low cost of capital. In Panel B, our results based on the DID design show that the coefficients on Treat×Post are both negative and significant, −0.082, t = −2.87 in column 1; −0.062, t = −2.30 in column 2, suggesting that the cost of capital for treatment firms decreases after the shock compared with benchmark firms.
The Effect of Stock Liquidity on Cost of Capital.
Note. This table reports the estimation results of the effect of liquidity on Cost of capital. Panel A show the results using the total sample while Panel B presents the results using the SSSR sample. See appendix for variable definitions. The t statistics are reported in parentheses. Standard errors are heteroskedasticity robust and clustered at the firm level. SSSR = split share structure reform.
significance at 10% level. **significance at 5% level. ***significance at 1% level.
We then examine whether the effect of market liquidity on cost of capital is more pronounced for firms that face more stringent financial constraints. Earlier studies suggest that non-SOEs and firms located in lower marketization regions face more severe financial constraints and have more difficulty obtaining external financing (Hope et al., 2017; Li, Yue, & Zhao, 2009; Liao et al., 2014). Accordingly, we partition our total sample (as well as the SSSR sample) into two subsamples based on whether the firms are SOEs or non-SOEs or whether the firms come from high- or low-marketization regions. We then reestimate the regressions (Equations 1 and 2) within each subsample. Table 9 presents the cross-sectional results by financial constraints. Panel A and Panel B show the results from the total sample and SSSR sample, respectively. The results in Panel A (Panel B) show that the effect of the liquidity (SSSR) on the cost of capital is larger for non-SOEs and for firms coming from low-marketization regions, which is consistent with the above conjecture. We thus conclude that the reduction of the cost of capital is a channel through which liquidity affects risk-taking behavior.
The Effect of Stock Liquidity on Cost of Capital Conditional on Financial Constraints.
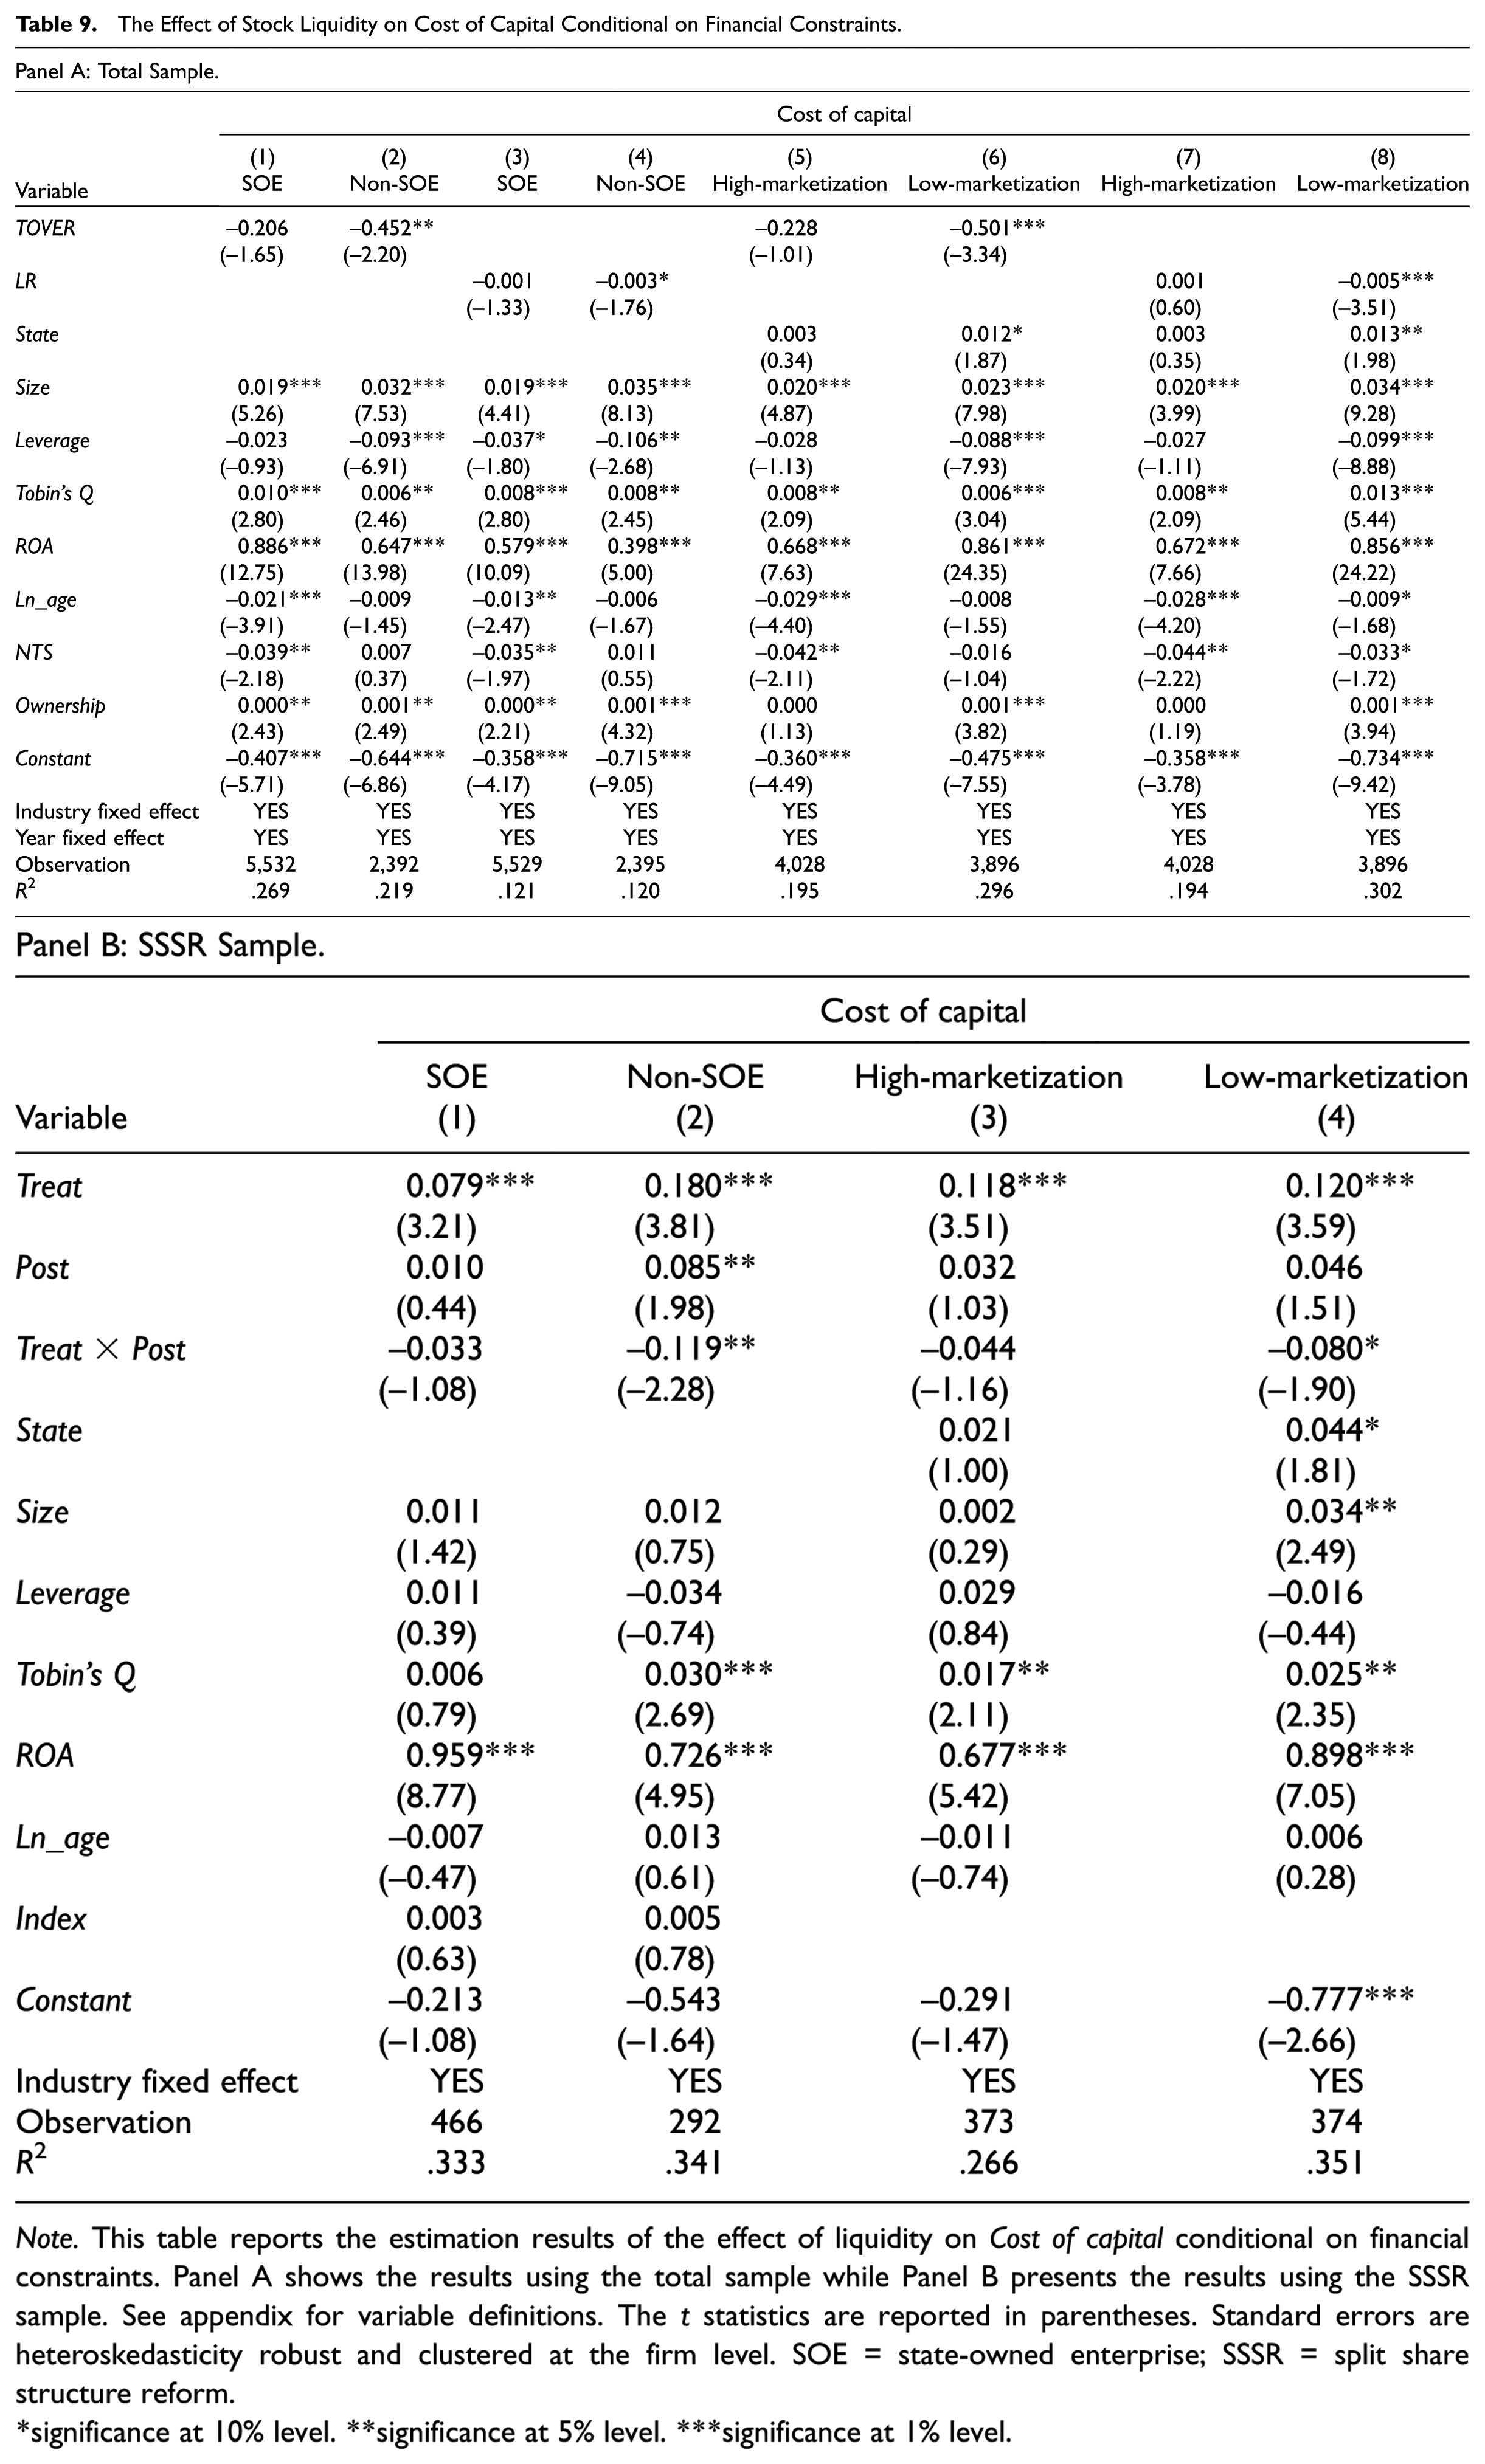
Note. This table reports the estimation results of the effect of liquidity on Cost of capital conditional on financial constraints. Panel A shows the results using the total sample while Panel B presents the results using the SSSR sample. See appendix for variable definitions. The t statistics are reported in parentheses. Standard errors are heteroskedasticity robust and clustered at the firm level. SOE = state-owned enterprise; SSSR = split share structure reform.
significance at 10% level. **significance at 5% level. ***significance at 1% level.
Management Incentives
We also investigate whether managerial incentive is a mechanism through which liquidity affects corporate risk-taking. In our sample period, some stock options and restricted stocks were granted to managers, although such practices are not popular in China. Managers also own firm shares that are sensitive to stock prices. Because detailed data on option-based compensation plans are not available before 2007, 13 we cannot test the effect of liquidity on managerial option-based compensation directly. As an alternative, we investigate the effect of liquidity on management incentive by examining the effect of liquidity on the sensitivity of cash-based compensation for firm performance. Jayaraman and Milbourn (2012) show that PPS (cash-based compensation for performance) increases (decreases) with stock liquidity. We estimate the following regression:

where Ln(Salary) is the natural logarithm of cash compensation (the sum of base cash salary and bonus) for a firm’s Top 3 highest-paid executives. Return is a stock-based performance measure defined as the annual stock return over the fiscal year following Firth et al. (2006). 14 HIGHLIQ is an indicator variable that equals one if the liquidity of the stock (TOVER and LR) is higher than the annual sample median and zero otherwise. The idea behind our design is that if managerial PPS is greater when liquidity is higher, the association between firm performance and managerial cash compensation should be lower when stock liquidity is higher (i.e., γ3 in Equation 3 should be negative).
Table 10 shows the results. We report the total sample results in columns 1 and 3 and the SSSR sample results in columns 2 and 4. The estimated coefficients of the interaction term HIGHLIQ×Return are negative and significant in all columns. 15 Our results indicate that the sensitivity of managerial cash-based compensation (i.e., Salary) to performance (i.e., Return) is lower when stock liquidity is higher. These results show that the sensitivity of managerial compensation to stock-based performance is positively associated with stock liquidity.
The Effect of Liquidity on PPS.
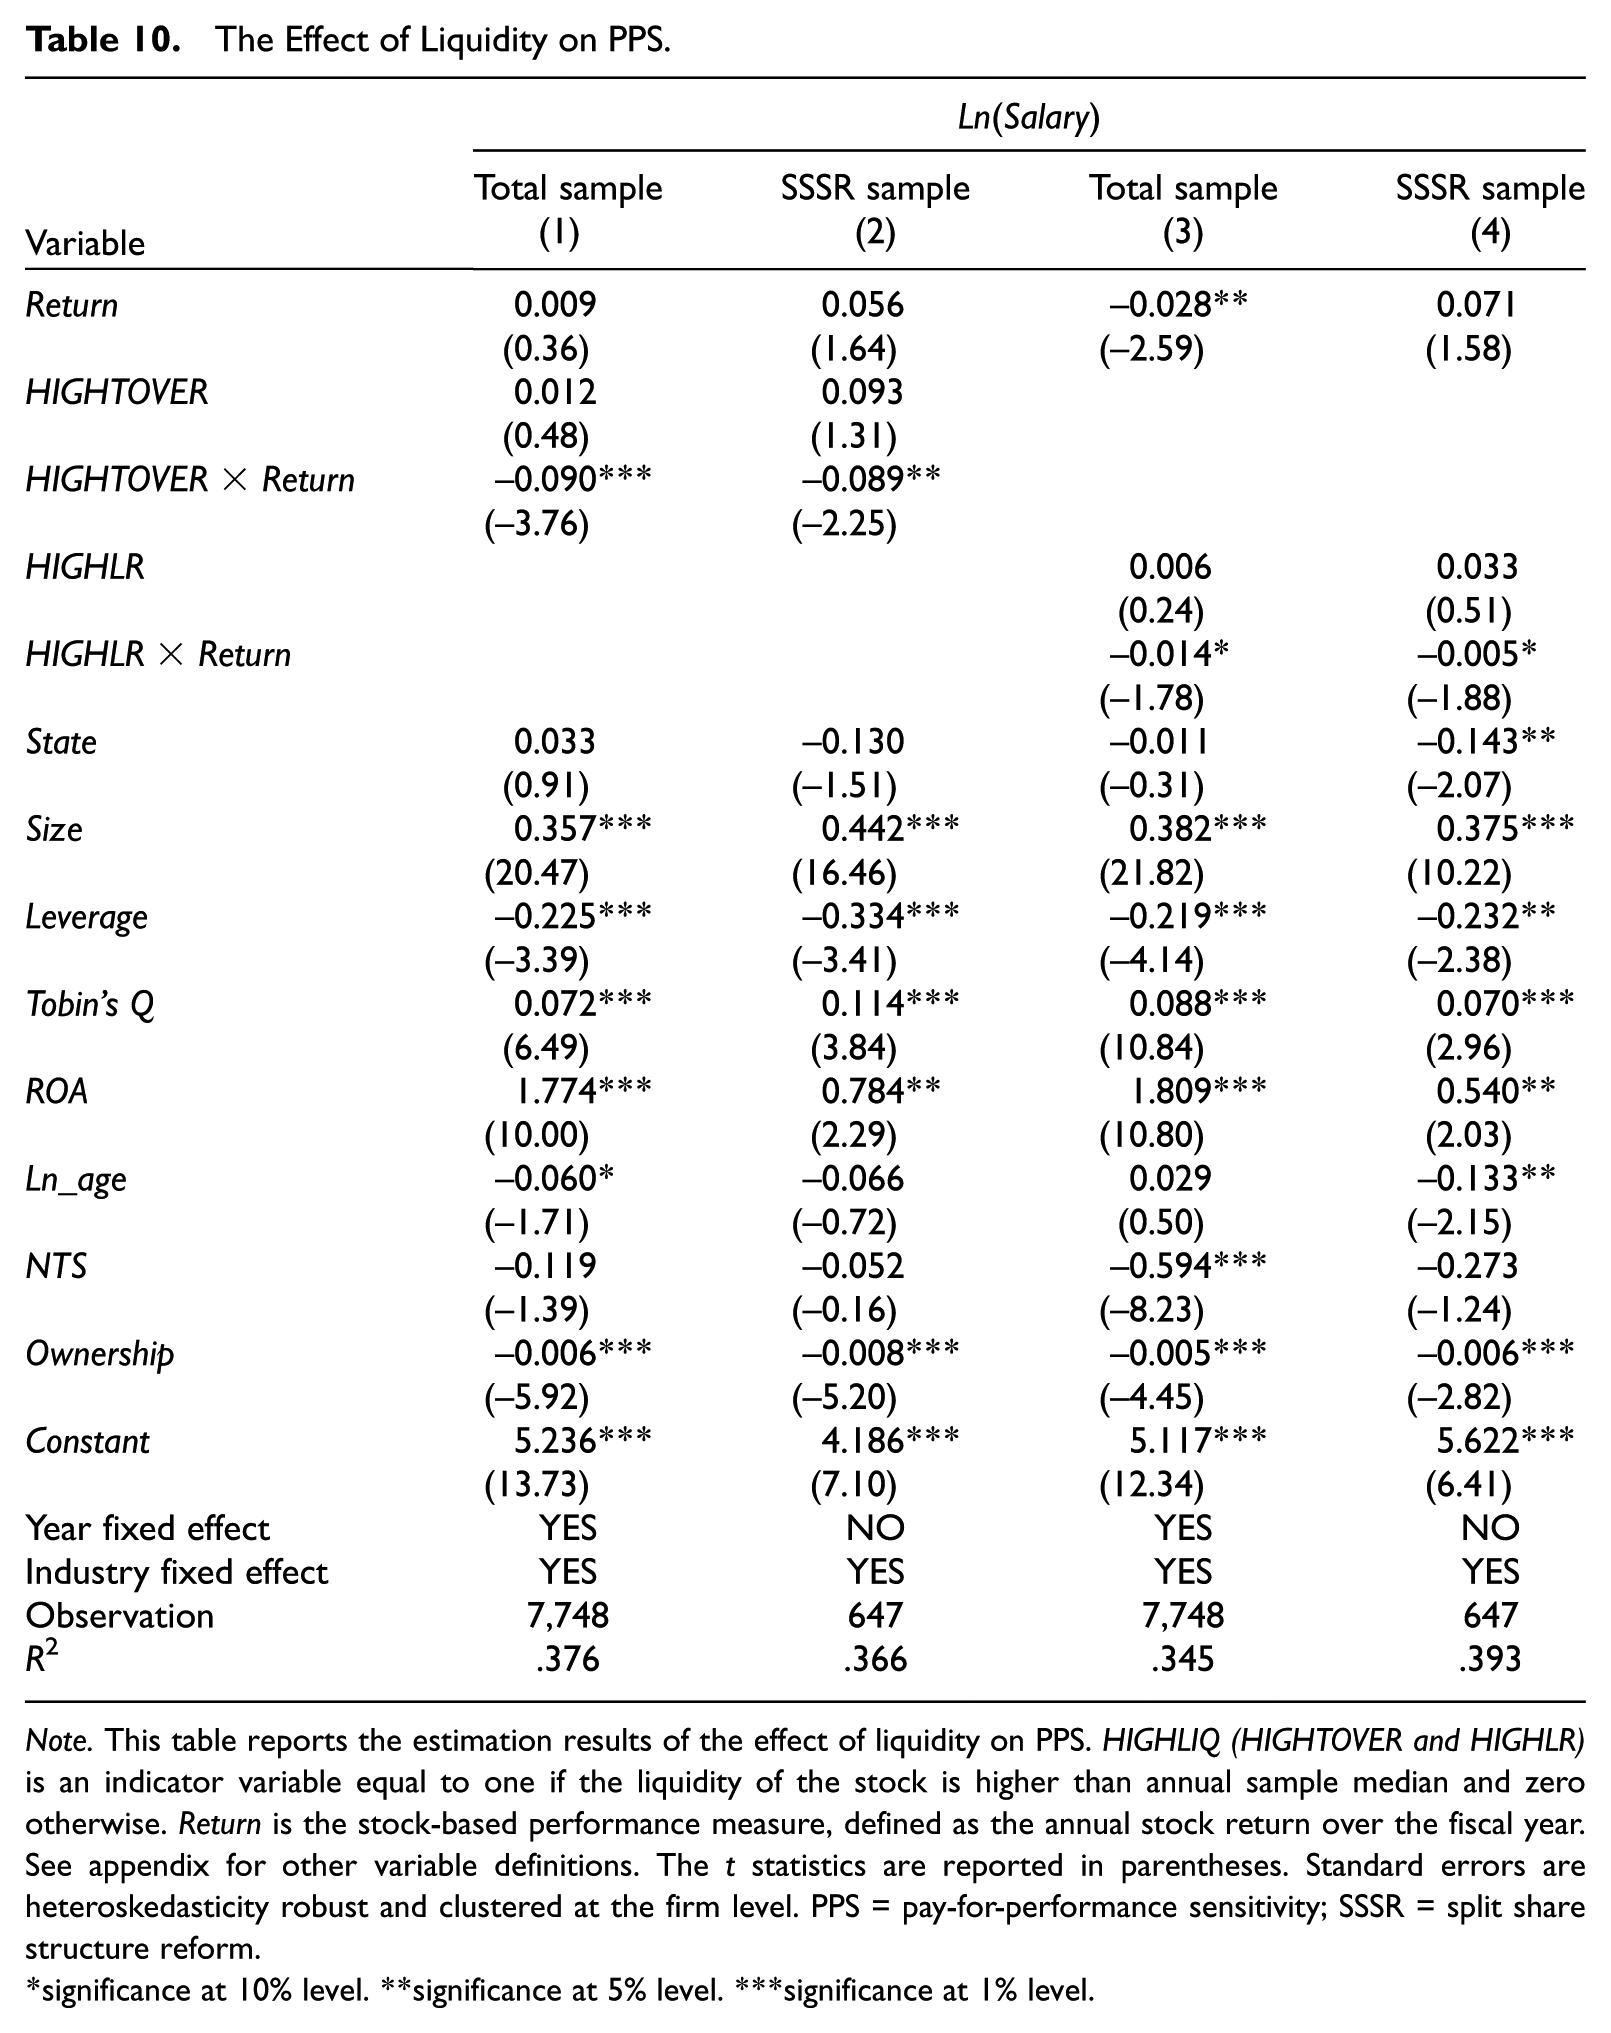
Note. This table reports the estimation results of the effect of liquidity on PPS. HIGHLIQ (HIGHTOVER and HIGHLR) is an indicator variable equal to one if the liquidity of the stock is higher than annual sample median and zero otherwise. Return is the stock-based performance measure, defined as the annual stock return over the fiscal year. See appendix for other variable definitions. The t statistics are reported in parentheses. Standard errors are heteroskedasticity robust and clustered at the firm level. PPS = pay-for-performance sensitivity; SSSR = split share structure reform.
significance at 10% level. **significance at 5% level. ***significance at 1% level.
Ruling Out Privatization as an Alternative Explanation
We also conduct tests to rule out privatization as an alternative explanation for our results. The privatization perspective regards the SSSR as part of China’s share issue privatization (SIP) process for SOEs (Liao et al., 2014; Tan et al., 2015). If privatization is responsible for our main results, we should find the effect to be more pronounced for SOEs, as there is no privatization effect for non-SOEs. Thus, we partition our SSSR sample into two subsamples according to firm ownership before the reform. 16 We then reestimate Equation 2 within each subsample. Columns 1 and 3 present the non-SOE subsample results (treating RiskT and RiskT2 as the dependent variable, respectively), and columns 2 and 4 present the SOE subsample results. The results shown in Table 11 indicate that the coefficients of the interaction term (Treat×Post) are significant only in non-SOE subsamples. In sum, the results in Table 11 do not support the competing story described above, giving us more confidence in our conclusion regarding the causal effect of liquidity on corporate risk-taking.
Ruling Out the Privatization Explanation.

Note. This table reports the risk-taking estimation results based on the SOE and Non-SOE subsamples. Columns 1 and 3 show the results within the non-SOE subsample with RiskT and RiskT2, respectively, as dependent variables, while columns 2 and 4 show the results within the SOE subsample. See appendix for variable definitions. The t statistics are reported in parentheses. Standard errors are heteroskedasticity robust and clustered at the firm level. SOE = state-owned enterprise.
significance at 10% level. **significance at 5% level. ***significance at 1% level.
Conclusion
This study examines the effect of stock liquidity on corporate risk-taking. First, we use a conventional OLS approach to find that firms with more liquid stocks are associated with greater risk-taking. Next, we exploit the SSSR in China as an exogenous event and use a DID approach to probe the causal relation between liquidity and risk-taking. The DID results confirm that stock liquidity has a positive and significant effect on corporate risk-taking. Our additional analyses reveal that increases in liquidity decrease the cost of capital and that this effect is more pronounced for firms facing more stringent financial constraints. Our results also suggest that liquidity can affect managerial risk-taking by influencing PPS and management incentives. Finally, we conduct tests to rule out the possibility that our results can be explained by privatization, an effect of SSSR. Our study sheds light on the real effects of stock liquidity and contributes to the understanding of financial development.
Footnotes
Appendix
Variable Definitions.

| Variable | Definition |
|---|---|
| RiskT | Industry-adjusted earnings volatility which is equal to ; , where EBITit is the earnings before interest and taxes of firm i in year t; ASSETSit is the total assets of firm i in year t; ROAit is the ratio of earnings before interests and taxes to total assets for firm i at year t; adj_ROAit is industry-adjusted ROA for firm i at year t. Nd, t is the number of firms within industry d and year t; T over (0 to +4, +1 to +5, +2 to +6, +3 to +7, +4 to +8, etc.) |
| RiskT2 | Industry-adjusted earnings range, calculated as |
| RiskT3 | Standard deviation of industry-adjusted firm level profitability over a given 5-year period, where profitability is measured as a firm’s EBITDA/Assets |
| RiskT4 | Difference between the maximum and minimum EBITDA/Assets over the 5-year period |
| TOVER | Tradable turnover ratio, which is the average daily turnover ratio (total shares traded in a day divided by total tradable shares) for a firm during the year. |
| LR | The liquidity ratio defined as follows: , where Ritd and Vitd are stock i’s return and dollar volume (in millions) on day d in year t, respectively. Dit is equal to the total number of days traded for stock i in year t. |
| Treat | Indicator variable which equals one if the reform happens in 2005 and zero otherwise. |
| Post | Indicator variable which equals one for year 2006, and zero for year 2004. |
| NTS | Number of nontradable shares divided by the total number of shares outstanding before the reform. |
| Incentive | Indicator variable which equals one if the firm granted stock-based incentive compensation plan, including stock options or restricted stock, to managers in the reform, and zero otherwise. |
| Cost of capital | Firm-specific cost of equity capital estimated using the PEG ratio approach following Easton (2004), which is measured as the square root of the inverse of price-earnings-growth ratio. |
| SEO | Indicator variable which equals one if the firm undertakes seasoned equity offerings (SEO) in a certain year, and zero otherwise. |
| InvIneff | Following Richardson (2006), we use the residuals from the expected investment model as the firm-level proxy for investment inefficiency. |
| State | Indicator variable which equals one for state-owned enterprises, and zero otherwise. |
| Ownership | The total cash flow rights of the controlling shareholder on record with the company following Faccio, Marchica, and Mura (2011). |
| Deviation | The separation between cash flow rights and voting rights of the controlling shareholder on record with the company following Faccio et al. (2011). |
| M_ownership | Percentage of shares held by the executives. |
| Size | The natural logarithm of total assets. |
| Leverage | The ratio of total debt to total assets |
| Growth | The annual growth rate of sales. |
| ROA | EBIT divided by total assets. |
| Tobin’s Q | Tobin’s Q, defined as the sum of market value of tradable shares, book value of nontradable shares, and liabilities, scaled by book value of total assets. |
| Ln_age | The natural log of (1 + the number of years since IPO). |
| Index | National Economic Research Institute (NERI) Index of Marketization of China’s Provinces, which is a comprehensive marketization index that serves as a proxy for the institutional development of a province in China (Fan & Wang, 2012). |
Note. EBITDA = earnings before interest, tax, depreciation, and amortization; IPO = initial public offerings.
Acknowledgements
We are grateful to two anonymous reviewers, C. S. Agnes Cheng (associate editor), Tarun Chordia (associate editor), and workshop participants at Xiamen University for their valuable comments and suggestions.
Authors’ Note
Kaitang Zhou’s is now affiliated with Wuhan University, Wuhan, China.
Declaration of Conflicting Interests
The author(s) declared no potential conflicts of interest with respect to the research, authorship, and/or publication of this article.
Funding
The author(s) disclosed receipt of the following financial support for the research, authorship, and/or publication of this article: Kaitang Zhou acknowledges financial support from the School of Economics and Management at Wuhan University.