
Abstract
This paper studies the determinants behind Chinese companies’ decisions to make seasoned equity offerings (SEO). Probit regressions are employed and a Monte Carlo simulation method is used to confirm the non-existence of the spurious correlation problem found in traditional models of capital structure. Evidence is found to confirm the privilege of state-controlled enterprises to access equity. A corporate governance indicator based on the completion of the Split Share Structure Reform is also introduced. However, no evidence to support the importance of corporate governance is found. The results of this study imply that in a country where the state dominates the intermediation of capital, investors and thus companies are less sensitive to the quality of corporate governance. Different factors have been observed to affect Chinese firms’ SEO decisions prior to and post the Split Share Structure Reform. The influence from the state has also been weakened after the reform, particularly after the global financial crisis.
Keywords
1. Introduction
Motivated by MacKie-Mason (1990) and Graham (1996), this paper studies Chinese companies’ incremental financing decisions through their seasoned equity offerings (SEOs). Probit regression models, which are immune to the spurious correlation problem of the traditional multivariate capital structure model using ratios, are employed to test the determinants behind Chinese companies’ SEO issuances. The Split Share Structure Reform beginning in 2005 provides a good opportunity to investigate Chinese firms’ equity financing behaviours when significant institutional changes occur, especially when such changes lead to further changes in corporate governance and investor protection. 1 Determinants of Chinese SEO issuances before and after the Split Share Structure Reform are investigated separately.
With significant government intervention in the financial market, it is a common belief that it is the government that dominates the allocation of capital in the Chinese financial market (Branstetter, 2007), which leads to unusual investment and financing behaviours. Indeed, a mysterious phenomenon in the Chinese financial market is the high level of equity-raising activities despite the low level of corporate governance and investor protection. Shleifer and Vishny (1997) deem this phenomenon to be a puzzle of external equity finance and attribute the irrational behaviour to investors’ overconfidence in managers’ and firms’ self-constraints – arising from their concerns for good reputation. However, Chinese investors and companies might be insensitive to the quality of corporate governance and investor protection because of the dominance of the state in the intermediation of capital. In addition, the scarcity of investment choices might also contribute to Chinese investors’ insensitivity to corporate governance. The consistently high price-to-earnings ratios in the Chinese share market indirectly prove the scarcity of investment choices available to domestic investors (Branstetter, 2007). Limited investment opportunities influence investment decisions in China. According to Cheng et al. (2009), Chinese investors prefer stock dividends over cash dividends due to limited investment opportunities. The scarcity of investment choices is also determined by government policies and regulations to a large extent.
This paper investigates the importance of corporate governance to Chinese companies’ financing behaviours by examining the relationship between corporate governance and SEO decisions, with the influence of the state also taken into account. I also introduce a corporate governance indicator based on the completion of the Split Share Structure Reform that was initiated in 2005.
When the Chinese stock market was first established, shares were divided into two categories: tradable and non-tradable shares. 2 Non-tradable shares accounted for more than two-thirds of total shares in the market and were owned mostly by the state and state-related entities. Tradable shares were fully tradable in the share market, while non-tradable shares were non-tradable in the share market, although some non-tradable shares, such as legal person shares, could be traded through auction or private placement at very high discounts and with little reference to the market share price (see Branstetter, 2007; Chen and Xiong, 2001). Therefore, non-tradable shareholders, who in most cases are large shareholders, were insensitive to share price movements, which contributed to different interests between large shareholders and minority shareholders. Thus, the division between non-tradable and tradable shares created serious agency problems between large shareholders and the minority shareholders. Gao and Kling (2008) analyse asset appropriation by large shareholders in China from 1998 to 2002 and find high levels of operational tunnelling in China, with an asset embezzlement rate of around 4%. They also find that tunnelling declined in 2001, when an attempt similar to the 2005 Split Share Structure Reform was made (although the 2001 attempt eventually failed).
I expect that the Split Share Structure Reform improved reformed companies’ corporate governance substantially by aligning large shareholders with minority shareholders by removing the division between tradable and non-tradable shares. In addition, the reform also improved corporate governance and investor protection in a number of other aspects, such as facilitating the development of the market for corporate control, and preventing price manipulation and insider trading. 3 Liao et al. (2008) construct a corporate governance index that incorporates factors such as controlling shareholders, board of directors, managers and information disclosure. They investigate the impact of the Split Share Structure Reform on the corporate governance index. They find that the reform had significantly positive effects on corporate governance, especially through the controlling shareholders. Tseng (2012) observes that the reform has mitigated the free cash flow and overinvestment problems in China, which are an indication of the reform’s impact on alleviating agency problems and the strengthening of corporate governance. Therefore, if corporate governance matters to investors, reformed companies (that is, companies with full liquidity), will display different equity issuance behaviours compared to unreformed companies (companies with partial liquidity).
The problem of employing traditional measures of capital structure to study firms’ financing behaviours is addressed in this paper. Capital structure, which is measured by a debt ratio or an equity ratio, represents the cumulative effects of companies’ past financing decisions and share price movements. As pointed out by MacKie-Mason (1990) and Graham (1996), the traditional measures for capital structure are only cumulative measures of companies’ financing decisions to date. In addition, Welch (2004) further indicates that a large fraction of changes in capital structure come from share price movements, with some variables affecting capital structure through their influence on share price. Thus, a study on capital structure provides limited insight into the managerial factor driving companies’ financing behaviours. This paper investigates Chinese firms’ incremental managerial equity financing decisions through examining the determinants behind their decisions to make a SEO by using an alternative probit regression.
There is a considerable amount of literature that attempts to explain companies’ financing behaviours. Modigliani and Miller (1958) state that a company’s capital structure is irrelevant to its value in a perfect market. As a result, managers are indifferent to the way the company is financed. However, due to imperfections in the real world, companies self-select into particular financing sources according to their own situations. The dominant theories for financing behaviours in the literature include the Trade-off Model (Kraus and Litzenberger, 1973), the Agency-Cost-Based Model (Grossman and Hart, 1982; Jensen and Meckling, 1976), the Pecking Order Hypothesis (Myers and Majluf, 1984) and the Market Timing Theory (Baker and Wurgler, 2002). A number of firm-level characteristics have been shown to be theoretically and empirically relevant to companies’ financing policies. Most empirical studies focus on capital structures, while some studies pay particular attention to changes in capital structure. 4
In addition, a small body of literature has examined the determinants behind companies’ decisions to issue equity or debt. MacKie-Mason (1990) studies US companies’ debt–equity choice by employing a probit regression model with an emphasis on the effects of tax on companies’ financing behaviours. They find that tax is an important factor behind companies’ debt–equity choice, with some of their findings consistent with the Trade-off Model and the Agency-Cost-Based Model. Leary and Roberts (2005) examine the motivation behind incremental financing decisions while taking into account costly adjustments. They study both leverage-increasing and leverage-decreasing events and find that the motivation behind leverage-adjustment events is consistent with maintaining a target capital structure. Further, they find some evidence to support the Trade-off Model and Pecking Order Hypothesis as theories behind financing decisions.
However, previous theories and empirical studies were mainly formed in the context of developed and mature financial markets, which may not be applicable to developing financial markets. This paper, therefore, intends to investigate the compatibility of the existing theories in explaining financing behaviours of companies in the developing world (in comparison with their counterparts in the developed world). In this way, the current study will contribute to the small but burgeoning literature on financing behaviours in the developing world (see Booth et al., 2001; Fan et al., 2012).
In addition, through examining the importance of corporate governance to a company’s decision to issue equity, this study also contributes to the literature of law, investor protection and finance (Himmelberg et al., 2002; La Porta et al., 1997, 1998, 2000, 2002; Shleifer and Vishny, 1997). Furthermore, the literature on political connection and government ownership (Boardman et al., 1986; Faccio, 2006; Fan et al., 2007; Shleifer and Vishny, 1994) will also be enriched by the focus of this study on the impact of state ownership on Chinese companies’ equity issuance decisions. Meanwhile, as the development levels of regions where SEO issuers are registered are also controlled, this facilitates the study of the geographical differences in financing behaviours. This will contribute to the literature on the proximity and geography of finance (He et al., 2009; Loughran, 2008; Petersen and Rajan, 2002).
The results in the current study suggest that corporate governance does not affect Chinese firms’ decisions to make SEOs, and confirms the expectation that Chinese investors, and thus companies, are insensitive to the level of corporate governance when making their investment and financing decisions. A negative relationship is found and persists between state ownership and SEO issuances. Although the majority of SEO issuers in the sample are controlled by the state, there are even more companies with a state background in the sample of non-issuers. Therefore, while state-controlled enterprises have priority in accessing equity, equity is not the preferred source of finance for these enterprises, with bank loans offered by state-controlled banks being the major alternative fund source in China. 5
Furthermore, consistent with expectations, different firm-level characteristics are observed to affect SEO issuances before and after the Split Share Structure Reform. In addition, while state-controlled companies dominate SEO issuances over most of the period, such dominance is decreasing over time. Before the reform, nearly 70% of SEO issuers in the sample were state-controlled companies. After the reform, the number of state-controlled issuers is only slightly greater than the other issuers in the sample. The negative impact of state ownership persists after the reform, but has vanished over recent years – especially after the global financial crisis (GFC) in 2008. These findings imply an alleviation of government intervention in China.
The remainder of the paper is organized as follows. Section 2 presents the methodology used in the paper. Section 3 discusses the determinants tested in the study. Section 4 describes the data source and sample selection process. Section 5 provides the results from statistical analyses and Section 6 concludes the paper.
2. Methodology
The majority of the studies in the literature examine firms’ financing behaviours from the perspective of their capital structures. A multivariate regression model using ratios is commonly employed to explain companies’ capital structures. The dependent variable is generally the companies’ debt levels or equity levels, and independent variables are a mixture of internal and/or external factors that affect capital structures. Several common or highly correlated divisors such as total assets and total sales are normally applied to both sides of the regression model to remove size effects, which leads to a potential spurious correlation problem (See Barraclough, 2008; Powell et al., 2009; Zhu, 2012). That is, the dependent and independent variables might be correlated with each other because of the common or highly correlated divisors.
In this paper, probit regressions are employed to study the determinants behind SEOs. Probit regressions are considered as a solution to the spurious correlation problem. The dependent variable is 1 for equity issuers and 0 for non-issuers, while the independent variables include ratios. In theory, a probit model is immune from the spurious relation problem because no common divisor is shared by both sides of the regression equation. The probit model employed in this paper is as follows
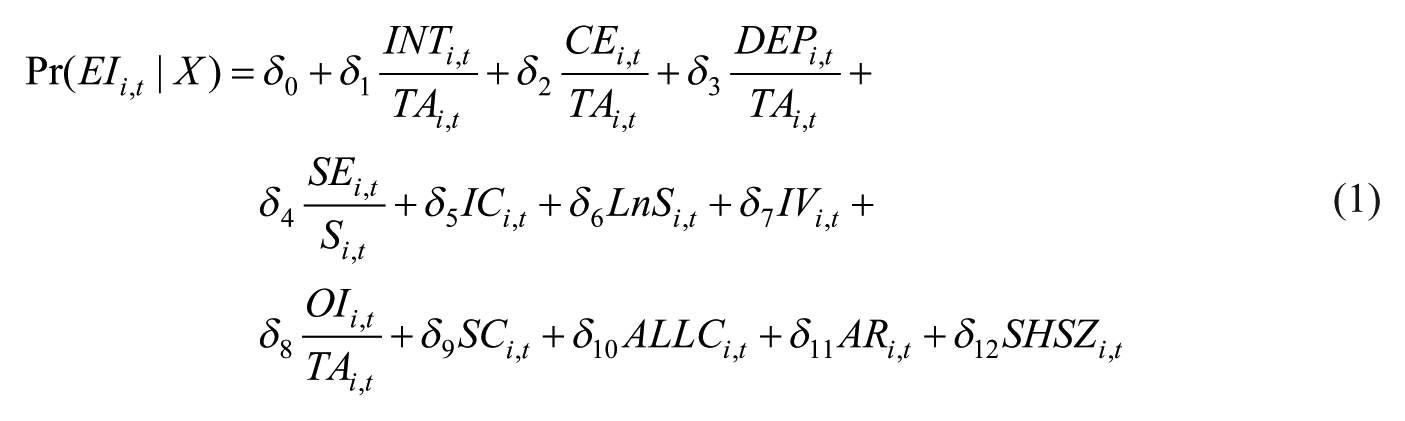
where EIi,t is equal to 1 if firm i makes equity issue announcements at time t, and is 0 otherwise. X is a vector of determinants of post-IPO equity issuance, which differentiates equity-issuing firms from non-issuers. Variables are discussed in detail in Section 3. To employ the probit model, I refer to the matched firm approach of Barber and Lyon (1996) to construct a matching sample of non-issuers. That is, each issuer is matched with a non-issuer of the year of the equity issue according to industry and size.
Barraclough (2008)’s Monte Carlo simulation is applied to the basic model, see equation (1), with only firm-level characteristic variables included to confirm that the spurious correlation problem does not exist with the probit regressions. The generation of the dependent variable is slightly different because it is a 1, 0 dummy variable, and is drawn from a Bernoulli distribution with the probability of returning a 1 equal to 50%. INTi, CEi, DEPi, SEi, ICi, lnSi, IVi, OIi, lnTA i and lnS i are generated based on the process

where μi is the sample mean of the real data and εi follows a multivariate normal distribution with 0 mean and a variance covariance matrix of the sample data. TAi and Si are then generated by the exponential of the generated lnTAi and lnSi. The next step of the Monte Carlo simulation is to run the regression using the simulated data, and perform 1000 simulations. The critical values of the coefficients, the t-statistics and R-squared values are then obtained by ranking the simulated coefficients, t-statistics and R-squared values in ascending order. For coefficients and t-statistics, the critical values are the 25th and 975th values. For R-squared values, the critical value is the 950th value.
A probit model also addresses the problem of traditional capital structure measures. The traditional measures of capital structure study the cumulative effects of companies’ past financing policies and share price movements (see Graham, 1996; MacKie-Mason, 1990; Welch, 2004). A company’s equity level or debt level, regardless of whether it is scaled or not scaled, represents the aggregate effects of the company’s past financing policies and share price movements if the market value of equity is used to express capital structure. Thus, a model with cumulative measures such as equity ratio or debt ratio on the left-hand side actually investigates the determinants behind companies’ cumulative financing policies and cumulative share price movements (while the determinants incorporated into the model are often spot measures). Following MacKie-Mason (1990), this paper employs a probit regression to study incremental managerial financing decisions.
3. Determinants behind SEO issuance decisions
Determinants tested in this paper are timed at the announcement of SEOs to determine the drivers behind Chinese companies’ equity issuance decisions. Table 1 summarizes the determinants used in this paper.
Summary of variables.
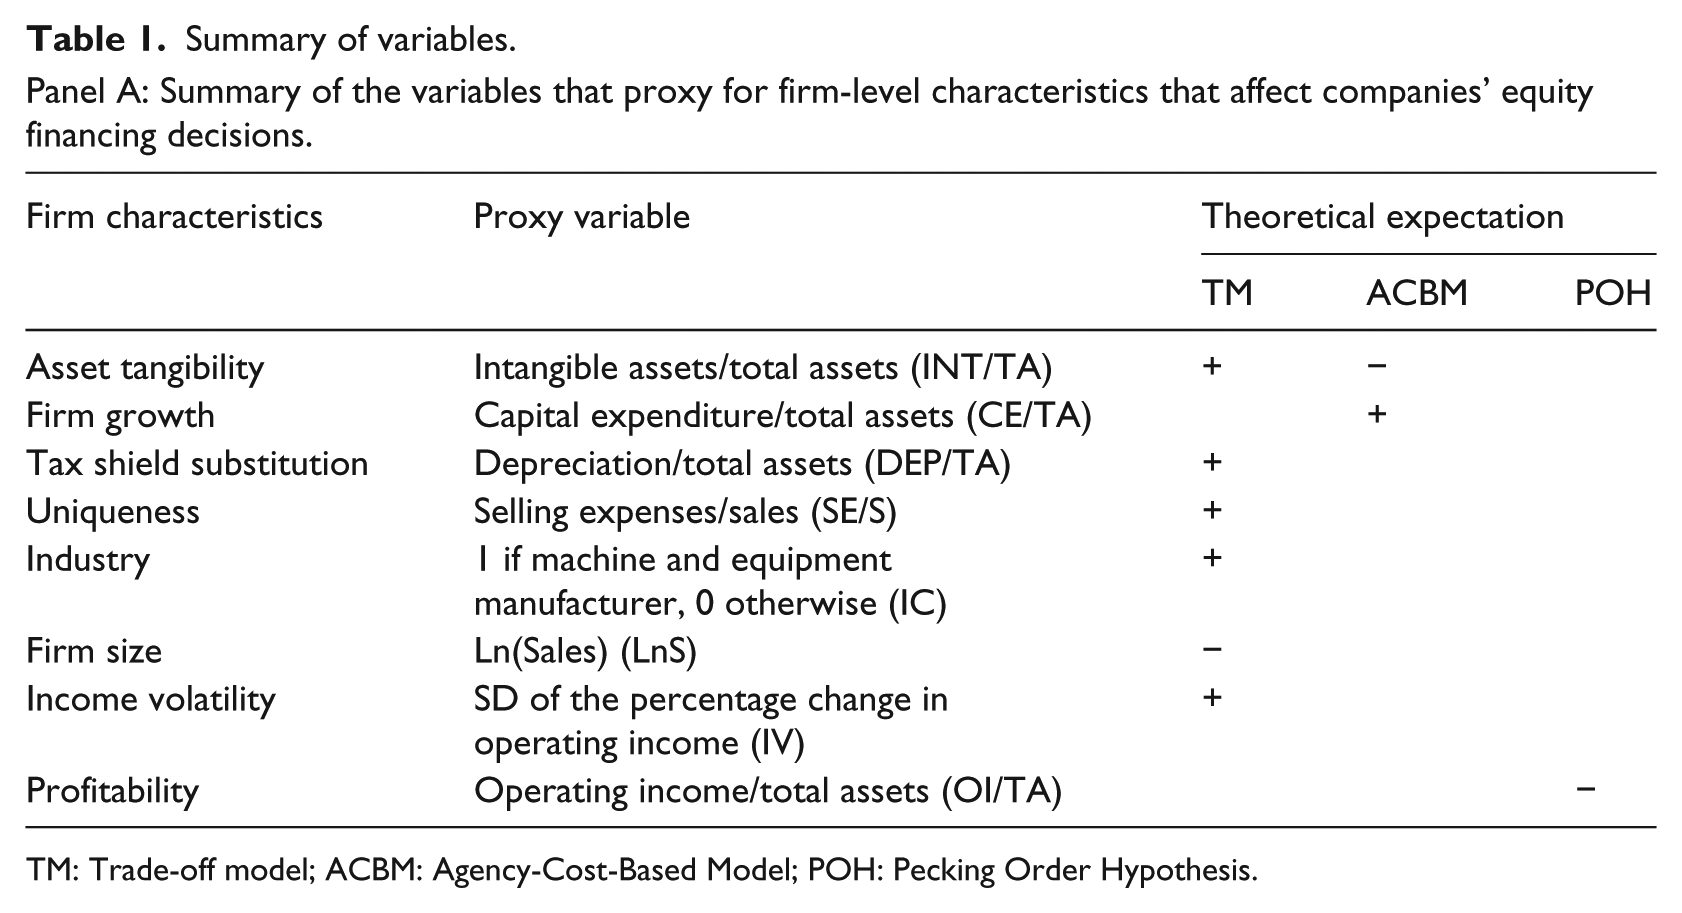
TM: Trade-off model; ACBM: Agency-Cost-Based Model; POH: Pecking Order Hypothesis.

3.1. Firm-level characteristics to test the main theories
The Agency-Cost-Based Theory explains companies’ financing policies, based on the trade-off between the benefits of debt finance in alleviating the agency problem between shareholders and mangers and the agency costs of debt finance itself (Grossman and Hart, 1982; Jensen, 1986; Jensen and Meckling, 1976). Asset Intangibility is often used to proxy for the benefits of debt in mitigating the agency problem, while Firm Growth often represents the agency costs of debt finance (Booth et al., 2001; Titman and Wessels, 1988). INT/TA, i.e. intangible assets scaled by total assets (Titman and Wessels, 1988), and CE/TA, i.e. capital expenditure scaled by total assets 6 (Leary and Roberts, 2005; Titman and Wessels, 1988), are used to represent Asset Intangibility and Firm Growth, respectively. According to the Agency-Cost-Based Theory, a positive effect of Asset Intangibility is expected on debt usage, confirmed by Leary and Roberts (2005), which in turn implies a negative effect on equity usage. However, Leary and Roberts (2005) find a significantly negative effect of asset tangibility (that is, positive effects of asset intangibility) on equity issuance, which contradicts the implications from the Agency-Cost-Based Theory. In addition, it is expected that Firm Growth is negatively correlated to debt usage, with a considerable amount of evidence supporting this (Baker and Wurgler, 2002; Faulkender and Petersen, 2006; Rajan and Zingales, 1995). Thus, a positive relation between Firm Growth and equity usage is expected.
The Trade-off Model is another stream of theory developed in the literature, which connects companies’ financing policies to the trade-off of tax benefits associated with debts and the potential financial distress costs due to high leverage (Kraus and Litzenberger, 1973). In addition to the direct test of the relation between companies’ financing behaviours and tax expenses (Graham, 1996; Welch, 2004), non-debt tax shields such as depreciation and investment tax credits are often regarded as substitutes for debts in terms of tax benefits (DeAngelo and Masulis, 1980), and thus are incorporated into the test for the Trade-off Model. Depreciation scaled by total assets, i.e. DEP/TA (Leary and Roberts, 2005; Titman and Wessels, 1988) is used to represent non-debt tax shields. The Trade-off Model indicates a negative relation between non-debt tax shields and debt usage, which has been confirmed by evidence found in the literature (Leary and Roberts, 2005; Titman and Wessels, 1988). Therefore, a positive effect of non-debt tax shields is expected on companies’ equity issuance decisions.
Furthermore, Asset Intangibility, Uniqueness, Industry, Firm Size, and Income Volatility are factors often adopted in the literature to represent potential financial distress costs related to high leverage (Booth et al., 2001; Leary and Roberts, 2005; Titman and Wessels, 1988). Referring to previous studies (Leary and Roberts, 2005; Titman and Wessels, 1988), INT/TA, i.e. intangible assets scaled by total assets, SE/S, i.e. selling expenses scaled by total sales, 7 an industry dummy variable for machine and equipment manufacturer (1 if the first two or three digits of the China Securities Regulatory Commission (CSRC) industry classification are C5, C7, G81 or G83), 8 lnS, i.e. the natural log of total sales, and IV, i.e. the SD of the percentage change in operating income, are employed to proxy for Asset Intangibility, Uniqueness, Industry, Firm Size and Income Volatility, respectively. Based on the Trade-off Model, a negative relation is implied between Asset Intangibility and debt usage, which is confirmed by a number of studies (Faulkender and Petersen, 2006; Rajan and Zingales, 1995), indicating a positive relation between Asset Intangibility and equity usage. In addition, Uniqueness is believed to be negatively correlated to debt usage (Faulkender and Petersen, 2006; Titman and Wessels, 1988), which implies a positive correlation between Uniqueness and equity usage. Further, Titman and Wessels (1988) argue that companies in industries that require specialized parts and services, such as machine and equipment manufacturing, are faced with potentially higher financial distress costs. Thus, companies in such industries are expected to prefer equity to debt. In terms of Firm Size, large companies have easier access to debt finance and lower chances of going bankrupt (Titman and Wessels, 1988). This leads to a positive relation between Firm Size and debt usage (Alti, 2006; Hovakimian et al., 2001) and a negative relation between Firm Size and equity usage (Leary and Roberts, 2005). As expected, Income Volatility is positively related to the chance of bankruptcy and thus potential financial distress costs. Therefore, a negative relation is expected between Income Volatility and debt usage, which implies a positive relation between Income Volatility and equity usage.
The Pecking Order Hypothesis states that companies tend to prefer internal finance – that is, retained earnings – followed by debt and equity (Myers, 1984; Myers and Majluf, 1984). Profitability is the factor used to test for the Pecking Order Hypothesis. Referring to Titman and Wessels (1988) and Leary and Roberts (2005), OI/TA, i.e. operating income scaled by total assets, is employed to proxy for profitability. Based on the Pecking Order Hypothesis, a negative relation is expected between equity usage and Profitability.
3.2. Institutional factors
As mentioned above, improvements in the overall corporate governance and investor protection environment in China were brought in by the Split Share Structure Reform in 2005. Indeed, a series of corporate governance problems, arising from the split between tradable and non-tradable shares, were alleviated. This study develops a corporate governance indicator (ALLC) based on the completion of the reform. ALLC is equal to 1 if all of the companies’ shares are freely tradable in the share market, and is 0 otherwise. If corporate governance is important to investors, I expect that improved corporate governance increases companies’ equity-raising capacity, which implies its positive effect on companies’ choice of equity finance.
In addition, I define a state-control variable (SC) that is equal to 1 if the ultimate controlling shareholders of a company are either government or state-controlled enterprises or both, and is 0 otherwise. This variable serves to investigate the influence from the state on companies’ choice of finance. Despite the privilege of state-controlled enterprises to raise equity, the net effect of state control on SEO decisions is still unclear given the similar privilege to access alternative funding sources (such as bank loans).
3.3. Control variables
Geographical difference in development is a well-known feature of China. The World Bank conducted a study of regional development in China, 9 which provides a general ranking from first to sixth for all provinces (excluding Xizang) (The World Bank, 2006). I control this factor in the current study by categorizing companies into two categories: companies registered in provinces ranked from the first to third ranking, and companies registered in provinces with the fourth to sixth ranking. A dummy variable is created accordingly, with 1 assigned to companies in a more developed regional group and 0 for companies in a less developed regional group.
In addition, this study controls for the impact of the stock exchange. There are two stock exchanges in China: the Shanghai Stock Exchange and the Shenzhen Stock Exchange, which were established in 1990. The Shanghai Stock Exchange tilts to large capitalisation companies while the Shenzhen Stock Exchange tilts to small-to-medium capitalization companies. I define a SHSZ variable, which is equal to 1 when a company is listed on the Shanghai Stock Exchange, and 0 if listed on the Shenzhen Stock Exchange.
4. Data
4.1. Issuers
The sample period is from 1999 to 2010. SEO issuances are sourced from the CCER rights issue database and the CCER SEO database. Financial statement data is sourced from the CSMAR China Stock Market Financial Statements Database. If an equity issuance announcement occurs at year t, financial statement data is collected from the annual statement released at the end of year t − 1 (that is, the annual statement prior to, but closest to, the announcement date). Titman and Wessels (1988) define an industry dummy, IC, which is equal to 1 if the firm is a machine and equipment manufacturer, i.e. Standard Industrial Classification (SIC) code is from 3400 to 4000, and 0 otherwise. I adopt Titman and Wessels’ (1988) definition but use the CSRC industry classification to define the IC dummy variable, which equals 1 if the first two or three digits of the CSRC industry classification are C5, C7, G81 or G83, and is 0 otherwise. Data for the CSRC industry classification is available from both the CCER and GTA database. Income Volatility is the SD of the percentage change in operating profit, which is calculated using all available annual operating profit and is constant across years for each issuer.
Data of equity issuers’ ultimate controlling shareholder is derived from the GTA China Listed Firm’s Shareholders Research Database. The ultimate controlling shareholder data is available only from 2003. However, before the Split Share Structure Reform, transfers of state-owned shares were subject to strict regulation and government supervision; therefore, I expect insignificant changes in state ownership of Chinese public companies before the Split Share Structure Reform. Therefore, if a company was state-controlled in 2003, I expect it was also controlled by the state before 2003. In addition, in cases where 2003 data is unavailable, I consider 2004 data to determine the status of state control before 2004. The SEO issuers’ sample is dominated by state-controlled enterprises. However, such dominance is much weaker in the post-2005 sample, which indicates that the level of government intervention has been decreasing over time.
The completion dates of the Split Share Structure Reform for issuers are sourced from the GTA China Stock Market Equity Division Reform Research Database. The Split Share Structure Reform, initiated on 29 April 2005, aims to eliminate the division between tradable and non-tradable shares. However, in addition to a one-year frozen period that is applicable to all non-tradable shareholders, large non-tradable shareholders cannot freely trade their shares until three years after the completion of the reform. 10 Therefore, if an issuer goes public before the start of the Reform, I define its shares as fully circulatable three years after the completion of its reform. If an issuer goes public after the Split Share Structure Reform, there is no division of tradable and non-tradable shares; however, the frozen periods of up to three years are applied to founder shareholders. 11 Thus, for issuers going public after the reform, I consider them as fully liquid three years after their listing dates. Companies categorized as S shares are companies that have not finished their Split Share Structure Reform and their shares are deemed to be not fully circulatable at the time of the issuance announcement. Moreover, if the announcement date is before the start of the Split Share Structure Reform, the issuer’s shares are considered as being not fully circulatable. In addition, equity issuers’ registration addresses are sourced from the CCER database or hand-collected from stock exchange websites where data is missing.
I apply the following data selection criteria. First, I only look at A share companies; second, companies categorized as I, J and D according to CSRC industry classification, i.e. financial, real estate and utility companies, are excluded; third, companies registering in Xizang are not included; fourth, companies with repeated equity issue announcements in one year are excluded; fifth, any equity issue announcements with other significant events occurring thirty days around the announcement are excluded from the sample. Significant events include debt issuances, dividend announcements, equity division reform announcements, release of financial statements, and merger and acquisition announcements. With the exception of data for debt issuances that is sourced from Thomson Reuters SDC Platinum, data for all events is sourced from the GTA database. Finally, equity issues with missing data are deleted. These data selection criteria lead to 1127 firm-year observations. However, the issuers’ sample reduces to 642 firm-year observations because only 642 issuances can be matched with a non-issuer. The summary statistics for the SEO issuers’ sample over the entire sample period are displayed in Panel A of Table 2. The summary statistics for the SEO issuers’ sample before and after the Split Share Structure Reform are displayed in Panel A of Tables 3 and 4, respectively. Table 5 lists the SEO issuance in China by year.
Summary statistics: 1999 to 2010.
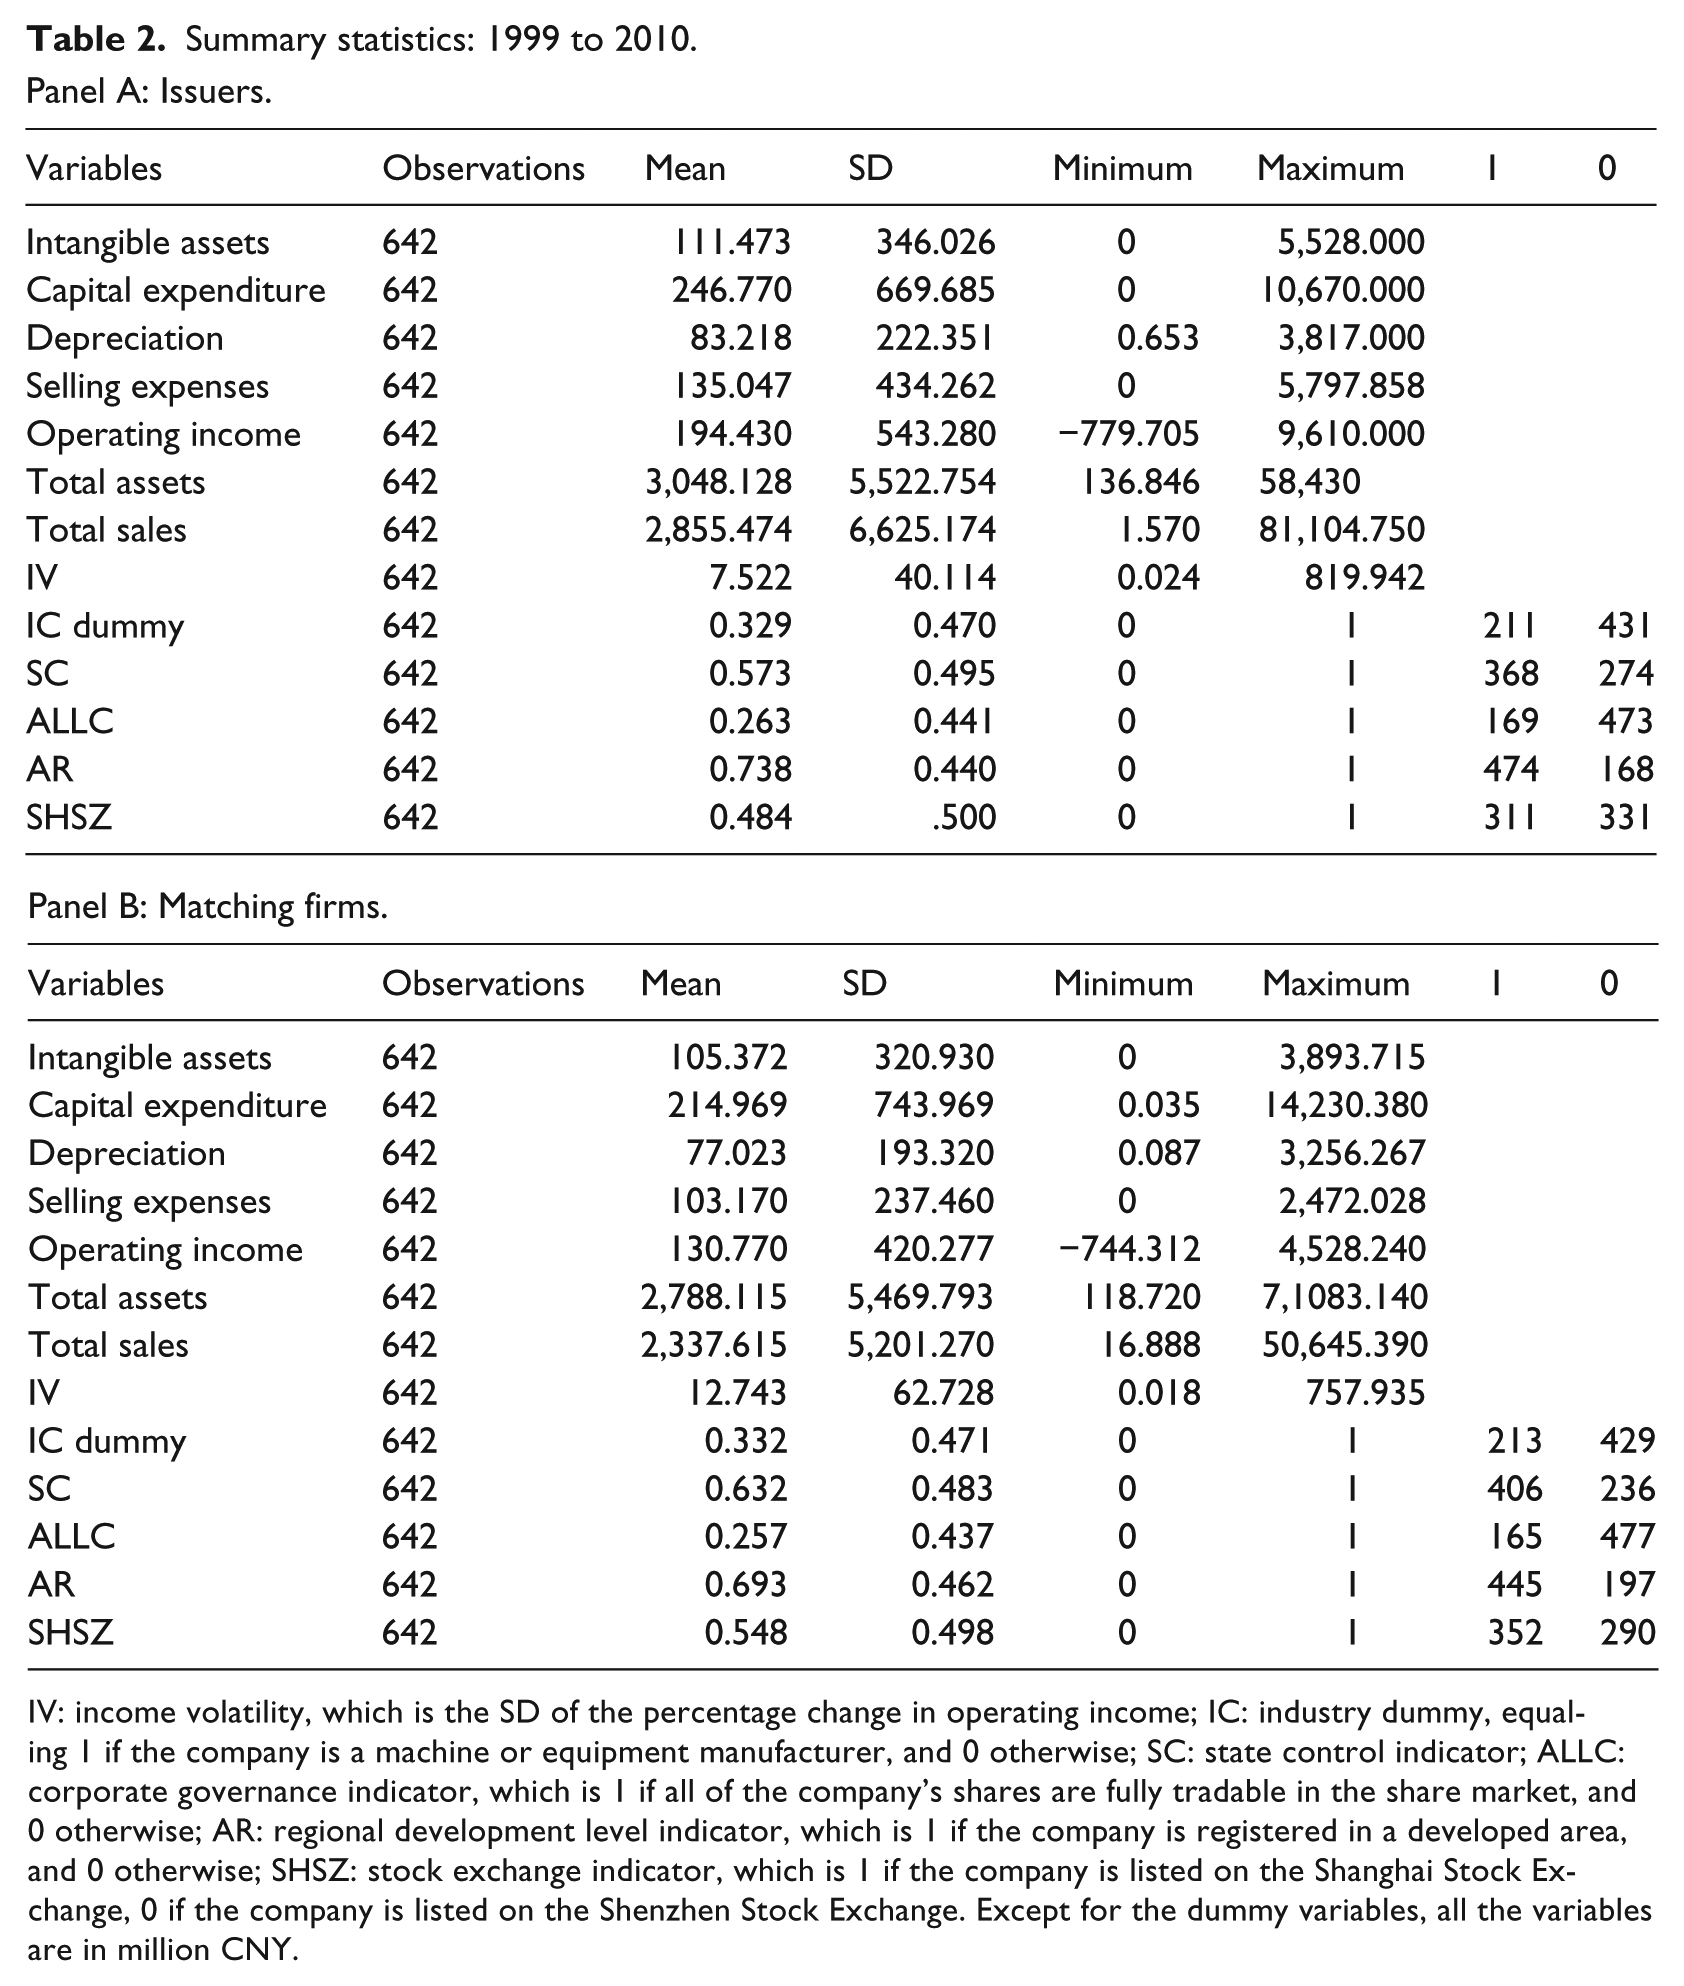
IV: income volatility, which is the SD of the percentage change in operating income; IC: industry dummy, equaling 1 if the company is a machine or equipment manufacturer, and 0 otherwise; SC: state control indicator; ALLC: corporate governance indicator, which is 1 if all of the company’s shares are fully tradable in the share market, and 0 otherwise; AR: regional development level indicator, which is 1 if the company is registered in a developed area, and 0 otherwise; SHSZ: stock exchange indicator, which is 1 if the company is listed on the Shanghai Stock Exchange, 0 if the company is listed on the Shenzhen Stock Exchange. Except for the dummy variables, all the variables are in million CNY.
Summary statistics: 1999 to April 2005.

IV: income volatility, which is the SD of the percentage change in operating income; IC: industry dummy, which 1 if the company is a machine or equipment manufacturer, and 0 otherwise; SC: state control indicator; AR: regional development level indicator, which is 1 if the company is registered in a developed area, and 0 otherwise; SHSZ: stock exchange indicator, which is 1 if the company is listed on the Shanghai Stock Exchange, and 0 if the company is listed on the Shenzhen Stock Exchange. Except for the dummy variables, all the variables are in million CNY.
Summary statistics: May 2005 to 2010.

IV: income volatility which is the SD of the percentage change in operating income; IC: industry dummy, which is 1 if the company is a machine or equipment manufacturer, and 0 otherwise; SC: state control indicator; ALLC: corporate governance indicator, which is 1 if all of the company’s shares are fully tradable in the share market, and 0 otherwise; AR: regional development level indicator, which is 1 if the company is registered in a developed area, and 0 otherwise; SHSZ: stock exchange indicator, which is 1 if the company is listed on the Shanghai Stock Exchange, and 0 if the company is listed on the Shenzhen Stock Exchange. Except for the dummy variables, all the variables are in million CNY.
SEO issues by year.

4.2. Matching firms
A matching non-issuer is selected for each equity issuance in the sample defined in Section 4.1. A number of criteria are employed to determine a matching non-issuer for a given issuance: first, the matching non-issuer is not in the CCER rights issue or SEO database, i.e. it had not previously had any post-IPO equity issue; second, it is an A share company; third, the data for the CSRC industry classification and total assets is available; fourth, it is in the same industry as the issuer – i.e. the first three digit of the CSRC Industry Classification Code is matched, with the exception of companies in the categories of manufacturing industry and miscellaneous, where the first two digits and first digit are matched, respectively; fifth, the size of the non-issuer is similar to the issuer in the year of announcement, i.e. total assets of the non-issuer were within the [60%, 140%] range of the total assets of the issuer. 12 Because a non-issuer is matched with an issuer based on size range and not an exact size, a size factor represented by sales can still be included in the regression. As shown by the summary statistics in Tables 2 to 4, SEO issuers are in general larger than non-issuers. The issuers’ total assets are on average higher and their total sales are even more significantly higher than non-issuers. This means the matching non-issuers selected are non-issuers that are closest to issuers in size but still generally smaller than the issuers. This implies that size is a factor that affects financing behaviour.
The above matching-firm sample selection process results in some SEO issuances matched with unique matching firms and some issuances matched with more than one matching firm. I adopt Zhu’s (2013) method: each issuance with more than one match is randomly matched with its first match. The entire process is repeated 500 times to ensure that the maximum number of matches is obtained. The application of the above criteria results in 726 matches. The following criteria lead to a final sample of the non-issuer sample: companies registering in Xizang are excluded and firm-year observations with missing data are deleted. The application of the data selection criteria leads to 642 matches and 1284 observations in the sample. The summary statistics for the non-issuers’ sample over the entire sample period are displayed in Panel B of Table 2. The summary statistics for the SEO non-issuers’ sample before and after the Split Share Structure Reform are displayed in Panel B of Tables 3 and 4, respectively.
5. Empirical results
5.1. The spurious correlation problem and the Monte Carlo simulation
Because the left-hand side of the probit regression is either 1 or 0, it does not share a common divisor with any variables on the right-hand side. Theoretically, then, the problem of spurious correlation does not exist. I apply the Monte Carlo simulation method developed by Barraclough (2008) to the basic model, i.e. equation (1), with only firm-level variables to confirm the non-existence of the spurious correlation problem. The simulation is based on the entire sample.
The results of the Monte-Carlo simulation are shown in Table 6. Critical values for the t-statistics of the coefficients at 95% significance level are from the narrowest [−1.947, 1.920] for Depreciation to the widest [−2.113, 2.064] for Selling Expenses. In general, critical values for the t-statistics are close to the 95% standard cut-off values for t-tests, i.e. [−1.96, 1.96]. The critical value for the pseudo R-squared value at the 95% level is 0.0090, which is less than the pseudo R-squared value in the original model (0.0215). Therefore, the application of Barraclough (2008)’s Monte Carlo simulation confirms that there is no spurious correlation problem in the probit regression used here.
Monte Carlo simulation for probit regression of equity issues: 1999 to 2010.
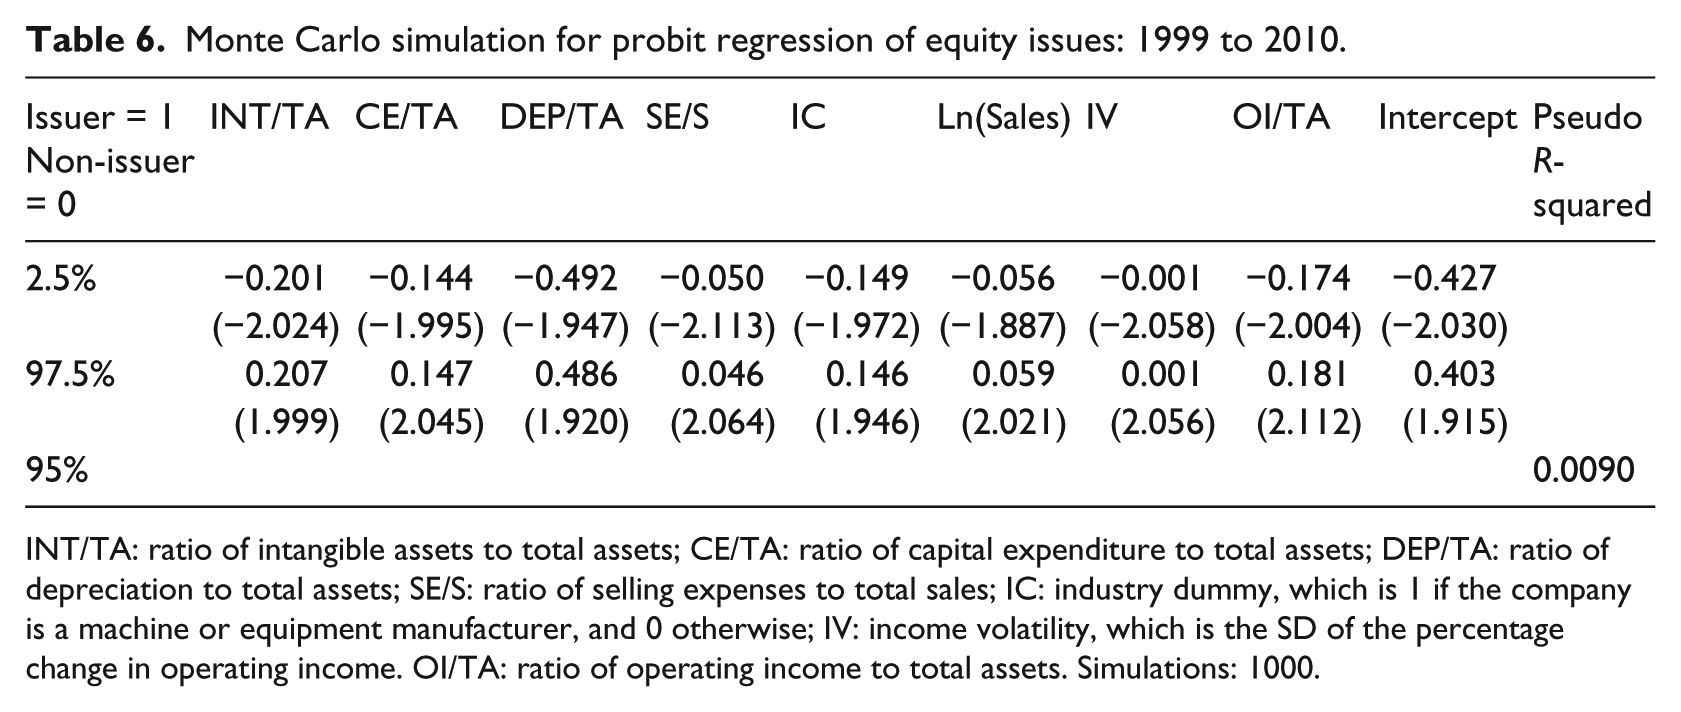
INT/TA: ratio of intangible assets to total assets; CE/TA: ratio of capital expenditure to total assets; DEP/TA: ratio of depreciation to total assets; SE/S: ratio of selling expenses to total sales; IC: industry dummy, which is 1 if the company is a machine or equipment manufacturer, and 0 otherwise; IV: income volatility, which is the SD of the percentage change in operating income. OI/TA: ratio of operating income to total assets. Simulations: 1000.
5.2. Determinants behind SEO issuance decisions from 1999 to 2010
I begin with the entire sample to investigate the determinants behind Chinese companies’ SEO issuance decisions over the period of 1999 to 2010.
Table 7 displays the empirical results of equation (1) run over the sample period from 1999 to 2010. The first regression results in Table 7 are from an estimation of equation (1), with only firm-level characteristics included. Only Capital Expenditure and Ln(Sales) are found to be statistically significant. Capital Expenditure proxies for companies’ growth opportunities, and is used to represent the potential agency costs of debt finance that are associated with suboptimal investments. The positive and significant coefficient of Capital Expenditure confirms that companies with high growth prefer equity compared to debt, consistent with the expectation of the Agency-Cost-Based Model. The positive and significant coefficient sign of Ln(Sales) indicates that large companies tend to issue equity when they are in need of finance, which is in contrast to the Trade-off Model. Indeed, the Trade-off Model states that large companies face lower potential financial distress costs and tend to utilize debt capital. Operating Income is insignificant but shows a positive coefficient sign in contrast to the Pecking Order Hypothesis.
Probit regression of equity issues: 1999 to 2010.

INT/TA: ratio of intangible assets to total assets; CE/TA: ratio of capital expenditure to total assets; DEP/TA: ratio of depreciation to total assets; SE/S: ratio of selling expenses to total sales; IC: industry dummy, which is 1 if the company is a machine or equipment manufacturer, and 0 otherwise; IV: income volatility, which is the SD of the percentage change in operating income; OI/TA is the ratio of operating income to total assets; SC: state control indicator; ALLC: corporate governance indicator, which is 1 if all of the company’s shares are fully tradable in the share market, and 0 otherwise; AR: regional development level indicator, which is 1 if the company is registered in a developed area, and 0 otherwise; SHSZ: stock exchange indicator, which is 1 if the company is listed on the Shanghai Stock Exchange, and 0 if the company is listed on the Shenzhen Stock Exchange. Observations: 1284. t statistics in parentheses ( ). Standard errors in parentheses [ ]. *p < 0.1, **p < 0.05, ***p < 0.01.
The second regression results in Table 7 are from an estimation of the whole of equation (1). The firm-level variables do not show significantly different coefficients compared to the first regression. ALLC is insignificant, implying that corporate governance does not affect Chinese companies’ decisions to make SEO issuances. Meanwhile, as indicated by the regression results, state ownership negatively affects companies’ equity issuance decisions. Although the majority of SEO issuances in this sample have state backgrounds, which implies that state-controlled enterprises have the privilege of accessing equity finance, equity finance is not a preferred source of finance for state-controlled enterprises. This special phenomenon might be associated with the dominating position of banks in the Chinese financial market. Companies with a state background have a similar privilege of accessing bank loans, which are the dominating fund sources in China, and are mostly offered by state-controlled banks. This makes equity finance less attractive to state-controlled enterprises. In addition, the results suggest that listing on the Shanghai Stock Exchange has a negative effect on SEO issuance decisions. The Shanghai Stock Exchange tends to list value companies with large capitalizations while the Shenzhen Stock Exchange tends to list growth companies with small-to-medium capitalizations. Thus, companies listed on the Shanghai Stock Exchange are more likely to be at a stable phase and less likely to issue new shares.
The evidence found over the sample period of 1999 to 2010 shows some support for the Agency-Cost-Based Model. Evidence is found to confirm the agency cost of debt to be an influential factor behind companies’ financing decisions. No evidence is found for the Trade-off Model nor the Pecking Order Hypothesis. Corporate governance has been found to be of little importance to Chinese companies’ equity issuance decisions, while the influence of the state on SEO issuance has been observed. Capital expenditure, Ln(Sales), State Control and SHSZ are found to be significant, implying that a firm’s growth, size, state ownership and stock exchange listing are determinants behind Chinese companies’ post-IPO equity issuance decisions.
5.3. Equity issuance decision prior to the Split Share Structure Reform
The start of the Split Share Structure Reform on 29 April 2005 signalled a new era for the Chinese stock market, with significant improvements in corporate governance and the investor protection environment. Therefore, it is expected that Chinese companies would show different corporate financing behaviours after the Split Share Structure Reform. I run equation (1) over the sample period of 1999 to April 2005 to investigate the key factors behind Chinese companies’ SEO issuance before the reform. The results are displayed in Table 8.
Probit regression of equity issues: 1999 to April 2005.

INT/TA: ratio of intangible assets to total assets; CE/TA: ratio of capital expenditure to total assets; DEP/TA: ratio of depreciation to total assets; SE/S: ratio of selling expenses to total sales; IC: industry dummy, which is 1 if the company is a machine or equipment manufacturer, and 0 otherwise; IV: income volatility which is the SD of the percentage change in operating income; OI/TA: ratio of operating income to total assets; SC: state control indicator; AR: regional development level indicator, which is 1 if the company is registered in a developed area, and 0 otherwise; SHSZ: stock exchange indicator, which is 1 if the company is listed on the Shanghai Stock Exchange, and 0 if the company is listed on the Shenzhen Stock Exchange. Observations: 434. t statistics in parentheses ( ). Standard errors in parentheses [ ]. *p < 0.1, **p < 0.05, ***p < 0.01.
The first regression in Table 8 estimates equation (1) with only firm-level variables included over the sample period of 1999 to April 2005. More variables are significant compared to the results of Table 7, which is based on the sample period of 1999 to 2010. Ln(Sales) still maintains a positive and significant coefficient, contradicting with the Trade-off Model. However, deferring to the results in Table 7, asset intangibility has a positive and significant impact on companies’ equity issuance decision. This is consistent with the Trade-off model, while contrary to the Agency-Cost-Based Model. The positive and significant coefficient of Capital Expenditure is consistent with the previous results and expectations from the Agency-Cost-Based Model. In addition, contradicting evidence is found for the Pecking Order Hypothesis, as Operating Income shows a positive and significant coefficient.
The second regression in Table 8 estimates the whole of equation (1) over the sample period of 1999 to April 2005. Before April 2005, the equity division reform had not started and shares of almost all listed companies could not be freely traded. Thus, I remove the ALLC variable. The firm-level variables do not differ significantly from the results of the first regression, with the exception of the Asset Intangibility variable, which becomes insignificant. State ownership maintains its significant and negative effect on companies’ SEO issuance decisions. In addition, consistent with the full sample results, listing on the Shanghai Stock Exchange has a significant and negative effect on companies’ SEO issuance decisions.
In general, mixed evidence is found for the Trade-off Model and the Agency-Cost-Based Theory in explaining Chinese companies’ SEO issuance decisions before the Equity Division Reform. No evidence is found for the Pecking Order Hypothesis. Equity finance is not a preferred source of finance for state-controlled enterprises before the reform, even though they have priority access to equity. Capital Expenditure, Ln(Sales), Operating Income, State Control and SHSZ are found to be significant, which implies that a firm’s growth, size, profitability, state ownership and stock exchange on which the company is listed are determinants behind Chinese companies’ post-IPO equity issuance decisions before the Equity Division Reform.
5.4. Equity issuance decision after the Split Share Structure Reform
Similarly, equation (1) is also run over the sample period of May 2005 to 2010 when corporate governance and investor protection have been improved by the Split Share Structure Reform. The first regression results in Table 9 are from an estimation of equation (1), with only firm-level variables over the sample period of May 2005 to 2010. Ln(Sales) is no longer significant. The coefficient of Selling Expenses becomes negative and significant, in contrast to the Trade-off Model. In addition, capital expenditure maintains its significant and positive coefficient in support of the Agency-Cost-Based Model. Operating Income is insignificant, but shows a negative coefficient, which is consistent with the Pecking Order Hypothesis.
Probit regression of equity issues: May 2005 to 2010.

INT/TA: ratio of intangible assets to total assets; CE/TA: ratio of capital expenditure to total assets; DEP/TA: ratio of depreciation to total assets; SE/S: ratio of selling expenses to total sales; IC: industry dummy, which is 1 if the company is a machine or equipment manufacturer, and 0 otherwise; IV: income volatility, which is the SD of the percentage change in operating income; OI/TA: ratio of operating income to total assets; SC: state control indicator; ALLC: corporate governance indicator, which is 1 if all of the company’s shares are fully tradable in the share market, and 0 otherwise; AR: regional development level indicator, which is 1 if the company is registered in a developed area, and 0 otherwise; SHSZ: stock exchange indicator, which 1 if the company is listed on the Shanghai Stock Exchange, and 0 if the company is listed on the Shenzhen Stock Exchange. Observations: 850. t statistics in parentheses ( ). Standard errors in parentheses [ ]. *p < 0.1, **p < 0.05, ***p < 0.01.
The second regression results in Table 9 are from an estimation of the whole of equation (1) over the sample period May 2005 to 2010. Weaker evidence is found here for the Agency-Cost-Based Theory. Both Capital Expenditure and Asset Intangibility are insignificant, but have signs consistent with the Agency-Cost-Based Model. Selling Expenses still maintains its significantly negative correlation with companies’ equity issuance decision, in contrast to the Trade-off Model. Moreover, the significantly positive coefficient of Ln(Sales) also conflicts with the Trade-off Model. Operating Income still maintains its insignificant and negative coefficient. In addition, state ownership maintains its significant and negative effect on Chinese companies’ SEO issuance decisions, while no evidence is found to support the importance of corporate governance to Chinese companies’ issuance decisions. Finally, Stock Exchange no longer significantly affects companies’ equity issuance behaviour.
In summary, companies display different equity issuing behaviours after the Split Share Structure Reform. Intangible assets, selling expenses, industry dummy and operating income have different coefficient signs to the results based on the sample before the Split Share Structure Reform. No evidence is found to support either the Trade-off Model or the Pecking Order Hypothesis as explanations for Chinese companies’ equity issuance behaviours after the Split Share Structure Reform. Further, weaker evidence has been found for the Agency-Cost-Based Model after the reform. The negative relation between state ownership and equity usage persists after the Split Share Structure Reform. There is no evidence to support the importance of corporate governance behind Chinese companies’ financing decisions. Selling Expenses, Ln(Sales), and State Control are found to significantly affect companies’ equity issuance decisions.
5.5. SEO issues before and after the 2008 global financial crisis
I further divide the post-reform sample into a pre-2008 GFC sample, i.e. 2005–2007, and a post 2008–GFC sample, i.e. 2008–2010. The results suggest different equity financing behaviours pre- and post GFC. Before the GFC, asset intangibility negatively affects Chinese companies’ SEO decisions, while no similar phenomenon is observed after the GFC. Operating income is found to be positively correlated with SEO issuance before the GFC, but is negatively correlated with SEO issuance after the GFC. The negative effect of state ownership vanishes after the GFC, which implies the alleviation of government intervention in China. In addition, corporate governance remains an unimportant factor over time.
Another interesting phenomenon observed is the active equity-raising activities after 2006, despite the 2008 GFC. As shown in Table 5, the number of SEO issuances increased significantly after 2006, from 59 issuances in 2006 to 347 issuances in 2010 – in contrast to the decreasing trend of SEO issuances before 2006. Even during the 2008 GFC, equity-raising activities were still very active in China and only slightly slowed in activity. The halt of SEO issuance in 2005, during the Split Share Structure Reform, might partly explain the increased number of SEO issuances after the reform. However, the main reason behind such dramatic increases in equity issuance activities is closely connected to the introduction of private placement in China from 2006. Private placement, as a way to issue equity, was not permitted in China until after the 2005 Split Share Structure Reform, and it became the main equity issuance method immediately following its introduction to the Chinese financial market in 2006 (Zhang, 2008). The main advantages of private placement includes a lower profitability requirement on issuers, simpler issuing procedures and flexible pricing (Zhang, 2008). These advantages made equity issuance much easier and cheaper than in previous times.
6. Conclusions
This paper employs probit regression models to investigate the determinants behind Chinese companies’ SEO issuances, considered to be incremental managerial financing decisions. Changes in institutions are taken into account by analysing the determinants before and after the Split Share Structure Reform in 2005. Probit regressions also provide a solution to the spurious correlation problem inherent in the traditional models for capital structure. Indeed, Monte Carlo simulations confirm the non-existence of the potential spurious correlation problem in probit regression models.
I posit that the Split Share Structure Reform improved corporate governance and investor protection substantially in China by removing the division between tradable and non-tradable shares. A corporate governance indicator based on the completion of the reform, i.e. the extent of liquidity of a company’s shares, is introduced here. If corporate governance and investor protection are of importance to Chinese investors, and thus Chinese companies’ financing policies, post-reform companies, i.e. companies with full liquidity, will display different equity financing behaviours compared to pre-reform companies, i.e. companies with partial liquidity. However, the empirical evidence suggests that corporate governance does not affect Chinese companies’ SEO decisions. Meanwhile, the influence of the state on Chinese companies’ equity issuance decisions is confirmed. The majority of equity issuers in the sample are controlled by the state, that is, state-controlled enterprises have privileges in accessing equity finance. The above empirical findings provide a potential explanation to Shleifer and Vishny (1997)’s puzzle of external equity finance. The reason behind active equity-raising behaviour in a country such as China, where corporate governance and investor protection are weak, might be associated with investors’ insensitiveness to corporate governance and the dominating role played by the state in capital allocation. However, the results further suggest that although state-controlled enterprises are more able to acquire equity finance, equity is still not a preferred source of capital to them. This phenomenon might be attributed to the dominance of bank loans and state-controlled enterprises’ similar privilege of accessing bank loans in China.
In addition, the investigation of SEO decisions before and after the Split Share Structure Reform shows that different factors are affecting Chinese firms’ equity financing behaviours before and after the reform. The negative effect of state ownership remains strong and consistent after the Split Share Structure Reform, but vanishes after the 2008 GFC – confirming the weakening of government intervention over time. In addition, while state-controlled enterprises dominate SEO issuers in number before the reform, they are only slightly more than the other issuers after the reform. This further confirms the alleviation of government intervention in the Chinese financial market.
Finally, some weak evidence is found for the Agency-Cost-Based Model as a theoretical explanation for Chinese companies’ SEO issuance decisions both before and after the Split Share Structure Reform.
Footnotes
Acknowledgements
This paper is based on part of my PhD thesis. I would like to express my gratitude to my supervisor Professor Tom Smith for his consistent support, encouragement and stimulating suggestions. I would also like to thank Professor Jing Shi, Professor Garry Twite, Associate Professor Jun Xiao, Dr Elizabeth Zhu, the editor and an anonymous referee for their useful advice and comments. I would also like to thank Professor Stephen Brown, Miss Evy Mulyani, Associate Professor Gregory Schwann and participants of the 2012 AFAANZ Doctoral Symposium for their helpful comments.
Final transcript accepted 8 April 2014 by Kathy Walsh (AE Finance).
Funding
This research received no specific grant from any funding agency in the public, commercial, or not-for-profit sectors.
1.
Almost all Chinese public companies are required to undergo the reform, but with different dates of completion. The reform is believed to have improved corporate governance, and such improvements were systematic after 2005, which led to an overall improvement in the investor protection environment in China.
2.
See Branstetter (2007) and ![]() for detailed background information about the Split Share Structure Reform as well as the Chinese financial market.
for detailed background information about the Split Share Structure Reform as well as the Chinese financial market.
3.
See Li et al. (2011) for a brief summary, based on a speech by a bureaucrat, of the problems caused by the division of tradable and non-tradable shares. ![]() also summarize a similar list of problems as a consequence of the high percentage of illiquid shares in China.
also summarize a similar list of problems as a consequence of the high percentage of illiquid shares in China.
4.
See Titman and Wessels (1988), Rajan and Zingales (1995), Welch (2004), Zhu (2012), Akhtar (2005), Gatward and Sharpe (1996) and Pindado and De La Torre (2011) for studies on capital structure decisions, and see Graham (1996) and ![]() for work on changes in capital structures.
for work on changes in capital structures.
6.
Companies with high growth tend to have higher capital expenditures.
7.
8.
Industry classification data used in this paper is based on 2001 CSRC Industry Classification. CSRC amended the 2001 CSRC Industry Classification in 2012.
9.
10.
Such a requirement is imposed by the Measures for Administration of the Split Share Structure Reform of Listed Companies. This policy was released by CSRC in September 2005.
11.
One year and three years’ frozen periods apply to normal founder shareholders and controlling shareholders respectively, which are specified in the 2006 People’s Republic of China Company Law and the listing rules of the Shanghai Stock Exchange and the Shenzhen Stock Exchange.
12.
Barber and Lyon (1996) use the [70%, 130%] range and when the total assets of a potential matching firm fall outside of this range, they choose the firm with closest total assets. ![]() amend Barber and Lyon (1996)’s method and employ a [60%, 140%] range for total assets and exclude potential matching firms once its total assets fall outside of the range. I adopt Zhu (2013)’s method in this paper.
amend Barber and Lyon (1996)’s method and employ a [60%, 140%] range for total assets and exclude potential matching firms once its total assets fall outside of the range. I adopt Zhu (2013)’s method in this paper.