
Abstract
Firms with internal control weakness (ICW) problems are less likely to provide managers with timely and precise information useful for internal resource management. The real options theory implies that managers in ICW firms, faced with information uncertainty, are more likely to postpone downward adjustments of slack resources by exercising an option to wait until more information about future business prospects becomes available. Based upon this theory, we hypothesize and find that selling, general, and administrative (SG&A) costs are stickier for ICW firms than for non-ICW firms. We also find that the effect of ICW on SG&A cost stickiness is primarily attributable to internal information control problems, and becomes weakened significantly after firms remediate previously reported ICW. This impact of ICW on SG&A cost stickiness is robust to controlling for the possible influence of omitted variables, accounting for potential endogeneity in the presence of ICW, and using a firm-specific measure of cost stickiness. Our results are consistent with the prediction of the real options theory in that poor information quality associated with ICW incents managers to postpone downward adjustments of SG&A resources until the information uncertainty is resolved.
Keywords
Introduction
Cooper and Kaplan (1992) and Noreen and Soderstrom (1997), among others, challenge traditional cost models that assume mechanical and symmetric changes in costs with respect to the changes in activity level. Subsequent studies by Anderson, Banker, and Janakiraman (2003) and Balakrishnan, Petersen, and Soderstrom (2004) provide strong evidence that costs are sticky or asymmetric, meaning that costs increase as sales increase but costs decrease, to a lesser extent, when sales decrease. Specifically, Anderson et al. provide the first large-sample evidence of cost stickiness using selling, general, and administrative (SG&A) cost data. They attribute the underlying cause of cost stickiness to managers’ deliberate decisions on resource adjustment in response to demand fluctuation, and claim that managers’ decisions on downward adjustment depend on the trade-off between downsizing costs and retainment costs of slack resources. 1 When demand falls temporarily, managers would retain slack resources because the costs associated with downward resource adjustments are greater than the costs of retaining slack resources. However, when demand falls permanently, managers have to remove idle capacities and unutilized resources because the costs of retaining slack resources exceed the costs of downsizing such resources.
While emphasizing the role of the adjustment cost in explaining the sticky cost phenomenon, previous studies have, in large part, ignored the influence of informational uncertainty faced by managers on resource adjustment decisions. In this article, we view downward resource adjustments as investments 2 and apply the real options theory to investigate the effect of internal information quality on the sticky cost phenomenon. According to the real options theory, a firm with an ability to invest is holding an option analogous to a financial call option, and its ability to delay an irreversible investment due to uncertainty has a profound impact on its decision of whether and when to invest (e.g., Arya & Glover, 2001; Dixit & Pindyck, 1994; Mauer & Ott, 1995; McDonald & Siegel, 1986). Under the real option framework, managers’ investment decisions involve the choice between investing immediately and postponing investment to the future until a substantial portion of the uncertainty about the investment is resolved. Applying the real options theory, we posit that when a firm cuts its slack resources, it gives up the real option to wait for the arrival of new information that might affect the desirability or timing of downward resource adjustments. Anderson et al. (2003) underscore the role of the real option to wait in managerial resource adjustments by arguing that “managers facing a downturn in sales may wait to obtain information that enables them to assess the permanence of the demand reduction before making decisions to cut resources” (p. 50, emphasis added). Therefore, the costs of postponing downward resource adjustments, or retaining slack resources, must be weighed against the benefits of waiting for new information. That is, it is optimal to retain idle capacities and unutilized resources if the option value of waiting exceeds the net present value (NPV) of reduction in future costs from downward resource adjustments. Because the option value of waiting increases with the level of uncertainty (McDonald & Siegel, 1986), downward resource adjustments are expected to be delayed further as the uncertainty about future benefits from resource adjustments increases. 3 Therefore, the informational uncertainty that managers face in relation to their resource adjustment decisions is likely to increase the degree of cost stickiness. An important insight from the real options theory is that the quality of internal information that managers use to make resource adjustments plays a central role in determining the degree of cost stickiness because internal information quality directly influences the level of uncertainty.
Building on the crucial role of timely and accurate information in managerial decisions to adjust corporate resources, we investigate the effect of internal information quality on the asymmetric behavior of SG&A costs. 4 Specifically, we hypothesize that SG&A costs are stickier or more asymmetric in response to sales changes for firms with weaker internal controls. Following Kim, Song, and Zhang (2011) and Gallemore and Labro (2015), we use internal control weakness (ICW) disclosed under the Section 404 of the Sarbanes–Oxley Act (SOX 404) as an inverse measure of internal information quality. Feng, Li, and McVay (2009) assert that ICW firms tend to provide their managers with low-quality internal information because the internal reporting systems under weak internal controls yield inaccurate, incomplete, and untimely internal management reports. Consistent with this notion, Feng et al. (2009) find that managers relying on internal information generated by inadequate internal control systems tend to issue less accurate earnings guidance. More important, Feng, Li, McVay, and Skaife (2015) provide evidence that managers relying on ineffective internal control systems act on low-quality internal information when making operational decisions. They further provide an explicit link between ICW and operating performance by showing that firms with inventory-related ICW tend to have lower inventory turnover ratios and less profitable operations. The results of these studies suggest that managers of ICW firms are more likely to base their decisions on untimely, imprecise, and unreliable internal information than those of non-ICW firms.
Given noisy signals collected from delayed and imprecise management reports, managers do not have to reduce committed resources immediately in response to sales decrease. Instead, managers are likely to postpone the downward adjustment by exercising an option to wait for more information until they become convinced of whether the observed sales decrease is temporary or permanent. Therefore, the poor-quality information produced by ineffective internal control systems would delay managers’ decisions about whether to reduce or retain committed resources in response to sales decrease. In contrast, the low-quality internal information is less likely to deter managers from adding new resources in response to sales increase. The economics and strategy literature documents that when there exist first-mover advantages, firms have an incentive to take preemptive actions to gain a better competitive position (Lieberman & Montgomery, 1988; Porter, 1980; Shapiro, 1989). 5 The literature finds that firms make strategic decisions to act early in many competitive circumstances with uncertainty such as capacity investment, research and development (R&D) competition, and patent races (Dasgupta & Stiglitz, 1980). We thus argue that first-mover advantages are likely to mitigate managers’ incentives to wait for more information in response to sales increase and, hence, the effect of internal information quality on managerial resource adjustments is more pronounced for downward adjustments than for upward adjustments. In other words, poor-quality internal information is more likely to delay managerial decisions to reduce existing resources in response to sales decrease than their decisions to add new resources in response to sales increase. Consequently, the degree of SG&A cost stickiness is expected to be higher for ICW firms than for non-ICW firms.
Using a sample of firms that disclosed ICW under SOX 404 provisions, we find that firms with ineffective internal controls exhibit stickier SG&A costs than other firms. In other words, our results reveal that when sales decrease, ICW firms tend to decrease SG&A costs, to a lesser extent, than non-ICW firms. Specifically, we find that whereas non-ICW firms exhibit a 0.31% decrease in SG&A costs per 1% decrease in sales revenue, ICW firms exhibit only a 0.19% decrease in SG&A costs per 1% decrease in sales revenue. However, when sales increase, we find no significant difference in the change in SG&A costs between ICW firms and non-ICW firms, consistent with our prediction that first-mover advantages weaken managerial incentives to postpone their decisions to add resources in the presence of information uncertainty. In addition, when we partition ICWs into internal information control problems and other control problems, we find that the degree of SG&A cost asymmetry is significantly associated with internal information control problems but not with other control problems. This finding is consistent with the view that low-quality internal information arising from weak internal controls delays managers’ decisions to adjust SG&A costs downward in response to sales decrease. Moreover, we find that the effect of ICW on cost stickiness weakens significantly after firms remediated previously reported ICW. Our finding of the inverse relation between internal control quality and SG&A cost asymmetry remains robust to controlling for the potential influence of omitted variables such as the economic determinants of SG&A cost asymmetry and those of ICW incidences, accounting for potential endogeneity with respect to the presence of ICW by applying the propensity score–matching analysis, and employing a firm-specific measure of cost stickiness following Weiss (2010).
Our study is closely related to two studies, which examine the relation between uncertainty and cost behavior. Kallapur and Eldenburg (2005) analyze the role of uncertainty in determining the cost structure in the context of Medicare reimbursement for hospitals. Applying the real options theory, Kallapur and Eldenburg (2005) provide evidence that as uncertainty increases, firms choose technologies with low fixed and high variable costs. Banker, Byzalov, and Plehn-Dujowich (2014) focus on demand uncertainty, and show that greater demand uncertainty results in a more rigid short-run cost structure with higher fixed and lower variable costs. Although both papers analyze the relation between uncertainty and cost behavior, they do not examine the effect of internal information uncertainty on asymmetric cost behavior. Our study extends and complements both studies by showing the implications of the real options theory for the relation between informational uncertainty and cost stickiness.
Our study makes two primary contributions. First, it adds to the growing body of literature on cost stickiness. An understanding of cost behavior is important for managers who make decisions for cost management as well as for investors and analysts who are interested in predicting firm performance. A better understanding of factor(s) determining managerial decisions on resource adjustments is essential in building a more complete model of cost behavior. Whereas Anderson et al. (2003) and its follow-up studies are predominantly concerned with economic factors and managerial incentives influencing the adjustment of committed resources as main drivers of cost stickiness, our study focuses on internal control quality and its implication on the quality of internal information that managers rely on to make resource adjustment decisions. Given the importance of the internal control systems as a means to improve internal information quality, our study contributes to the literature on cost stickiness by providing evidence that effective internal controls facilitate a timely downward adjustment of slack resources during a period of weak demand.
Second, we extend the literature on the economic consequences of ICW. A large body of accounting studies has examined the potential benefits of effective internal controls in terms of financial reporting quality (Ashbaugh-Skaife, Collins, Kinney, & LaFond, 2008; Doyle, Ge, & McVay, 2007), a firm’s cost of equity and debt capital (Ashbaugh-Skaife, Collins, Kinney, & LaFond, 2009; Beneish, Billings, & Hodder, 2008; Costello & Wittenberg-Moerman, 2011; Dhaliwal, Hogan, Trezevant, & Wilkins, 2011; Kim et al., 2011; Ogneva, Subramanyam, & Raghunandan, 2007), the accuracy of management guidance (Feng et al., 2009), and the degree of tax avoidance (Gallemore & Labro, 2015). As these studies have mainly examined the economic consequences of internal control problems from the perspective of external users of accounting information, they have paid less attention to the effect of internal control problems from the perspective of internal users. 6 Our study fills this void by documenting that a firm’s internal control quality affects managers’ (i.e., internal users’) operating decisions, as reflected in the asymmetry of SG&A costs with respect to the changes in sales activities.
The article proceeds as follows. Section “Hypothesis Development” reviews the relevant literature and develops hypotheses. Section “Research Design” explains the measurement of variables and specifies empirical models, whereas section “Sample and Data” describes the sample and data. Section “Empirical Results” presents our regression results and tests our hypotheses. The final section concludes the article.
Hypothesis Development
Prior empirical research shows that costs increase, to a greater extent, when activity rises than they decrease when activity falls by an equivalent amount. Anderson et al. (2003) document the first large-sample evidence of this cost asymmetry using SG&A cost data. They conjecture that SG&A cost asymmetry reflects the managers’ deliberate decisions on resource commitment in the presence of adjustment costs (e.g., hiring, training, and firing costs for labor or installation and disposal costs for equipment). Anderson et al. further claim that SG&A cost asymmetry arises mainly from asymmetric frictions in making managerial resource adjustments: The downward adjustment is more costly than the upward adjustment. 7 Given these asymmetric adjustment costs, managers can restrain the downward adjustment during a period of weak demand, to a greater extent, than the upward adjustment during a period of strong demand.
Since Anderson et al.’s (2003) study, the phenomenon of cost asymmetry (also labeled “cost stickiness”) has increasingly received much attention in recent accounting literature. This cost stickiness literature documents that firm-specific factors, including capacity utilization (Balakrishnan et al., 2004), operational criticality (Balakrishnan & Gruca, 2008), firm-specific cost structure (Balakrishnan, Larbo, & Soderstrom, 2014), the time-series pattern of sales changes (Banker, Byzalov, Ciftci, & Mashruwala, 2014), and the asymmetric adjustment of selling prices (Cannon, 2014), contribute to the cross-sectional variation in asymmetric cost behavior. 8 Another line of recent research shows that managerial incentives to engage in empire building (Chen, Lu, & Sougiannis, 2012) and earnings management (Dierynck, Landsman, & Renders, 2012; Kama & Weiss, 2013) also influence SG&A cost stickiness.
While emphasizing the role of resource adjustment costs in explaining SG&A cost asymmetry or stickiness, the existing literature has paid relatively little attention to the quality of internal information for the resolution of uncertainty on resource adjustments. According to the real options theory, investment decisions involve a choice between investing immediately and postponing investment to the future to gain more information about the value of the investment and to take advantage of any improvements in business conditions that occur in the meantime (Arya & Glover, 2001; Dixit & Pindyck, 1994; Mauer & Ott, 1995; McDonald & Siegel, 1986). Because costly resource adjustments (either upward or downward) can be viewed as investments in a broad sense, the real options theory can be applied to this setting. We argue that when a firm cuts its resource commitment, it exercises its option to remove slack resources by giving up the option to wait until new information arrives, which helps managers resolve uncertainty about future business prospects. This lost option value of waiting is an opportunity cost that must be included as part of the cost of the downward resource adjustments. That is, it is optimal to retain idle capacities and unutilized resources if the option value of waiting exceeds the value of reduction in future costs from downward resource adjustments.
In sum, the real options theory suggests that cost stickiness can arise from information uncertainty about future benefits from downward resource adjustments, and, thus, the quality of internal information that managers use to make resource adjustment decisions should play a central role in determining the degree of cost stickiness. Specifically, if internal management reports provide a noisy signal about future demand, managers do not need to exercise an option to reduce committed resources immediately in response to sales decrease. Instead, managers are likely to postpone the downward adjustment by exercising an option to wait until the arrival of new information that helps them resolve uncertainty about whether the observed sales decrease is temporary or permanent. As the uncertainty caused by poor internal information quality increases the option value of waiting, managers become more cautious in making downward resource adjustments and prefer to wait until the uncertainty is resolved (McDonald & Siegel, 1986). In other words, when managers face high uncertainty driven by low-quality internal information, they are likely to delay their decisions about whether to reduce or retain committed resources in response to sales decrease. Therefore, poor-quality internal information increases the degree of cost stickiness.
As noted by Kinney (2000), an effective internal control process is essential for providing information useful to support management decision processes. We postulate that weak internal controls affect SG&A cost stickiness by generating low-quality internal information. We expect ineffective control systems to generate erroneous and stale internal management reports. Inadequate internal controls hinder management from dealing with rapidly changing economic and competitive environments, shifting customer demands and priorities, and restructuring for future growth (Committee of Sponsoring Organizations of the Treadway Commission, 2013). The absence of effective internal controls makes it difficult to generate timely and accurate operating and financial information, which, in turn, constrains effective internal communication. As a result, internal information relevant to managerial decisions is less likely to flow down, across and up the organization.
For example, 3D Systems Corp. disclosed material weaknesses in internal control related to its enterprise resource planning (ERP) system in 10-K filing for fiscal year 2006: As a result of the disruptions resulting from the implementation of our ERP system, our supply chain staffing issues and our outsourcing activities and the discovery of these errors in our financial statements, we determined and disclosed that deficiencies exist relating to the design and implementation of our internal controls with respect to the following matters: The timeliness and accuracy of our period-end financial statement closing process and our procedures for reconciling and compiling financial records; Our processing and safeguarding of inventory; Our invoicing and processing of accounts receivable and applying customer payments; and The timeliness and accuracy of the monitoring of our accounting function and oversight of financial controls.
This example suggests that ICW firms may lack internal information technology (Li, Peters, Richardson, & Watson, 2012; Masli, Peters, Richardson, & Sanchez, 2010) and/or personnel with adequate expertise (Choi, Choi, Hogan, & Lee, 2013) to generate the information needed by management on a timely basis and to facilitate effective communication between operating and financial departments. 9
Consistent with ineffective internal controls causing errors and delays in internal management reports, Feng et al. (2009) find a positive association between internal control quality and the accuracy of management guidance. They argue that material weaknesses in internal control are likely to induce erroneous internal management reports that are seldom detected by audit committees but subsequently increase errors in management guidance. Moreover, Feng et al. (2015) provide evidence that managers relying on lax internal controls act on delayed and inaccurate internal information when making inventory management decisions.
Anderson et al. (2003, pp. 50) underscore the role of timely information in managerial resource adjustments by arguing that “managers facing a downturn in sales may wait to obtain information that enables them to assess the permanence of the demand reduction before making decisions to cut resources” (emphasis added). Delayed and inaccurate management reports provide a noisy signal about future demand. The real option theory expects that higher uncertainty increases the option value of waiting and thus deters managers from adjusting SG&A expenditure downward in a timely manner in response to sales decrease.
The following excerpt from Krispy Kreme Doughnuts Inc.’s 2005 10-K filing shows that material weakness in the company’s returned goods policy resulted in untimely and erroneous accounting information for customer returns: Sales department and warehouse department failed to follow the policy of returned goods to timely handle the returned goods from customers, which was a material weakness. This weakness relating to the failure to follow company’s returned goods policy was based primarily on the lack of clarity among the company’s financial personnel as to their respective assignments and duties with respect to the company’s returned goods policy. As a result, there was a breakdown in communication between the warehousing and financial departments, and no person made an accounting of returned goods when those goods were returned by customers.
If customer returns are not recorded on a timely basis, net sales data in internal management reports will be overstated and net sales data may not be consistent with other data in the management reports. Due to this untimeliness and inconsistency, it is highly likely that ineffective internal control systems create uncertainty about future demand and, consequently, increase the option value of waiting. Therefore, managers become more cautious in reducing committed resources in response to sales decrease and prefer to wait until the uncertainty is resolved. In contrast, the poor-quality internal information is less likely to delay managers’ decisions to add new resources in response to sales increase. The economics and strategy literature has explicitly recognized that competitive forces may provide managers with incentives to act early in an expanding market, emphasizing the first-mover advantages of early commitment. The existence of the first-mover advantages suggests that managers should consider the trade-off between commitment and flexibility when making resource allocation decisions in response to sales increase (Smit & Trigeorgis, 2017). Consequently, the effect of internal information quality on managerial resource adjustments is more pronounced for downward adjustments than for upward adjustments. Therefore, the degree of cost stickiness is expected to be higher for ICW firms with low internal reporting quality than for non-ICW firms.
An important implication from the above discussions is that the lack of effective internal controls is likely to increase the degree of SG&A cost asymmetry. To provide systematic evidence on this underresearched issue, we propose and test the following hypothesis in alternative form:
Research Design
Measurement of Internal Control Quality
The effectiveness of internal control that facilitates managerial SG&A spending decisions is unobservable to corporate outsiders including researchers. We thus measure internal control quality by the presence of material weakness in internal control over financial reporting under SOX 404 provisions. SOX 404 mandates management to identify and document internal control deficiencies over financial reporting, and further requires auditors to test and opine on internal control effectiveness in their audit reports. According to SOX 404, ICW discovered and not remediated by the report date must be publicly disclosed (Securities and Exchange Commission 2003). We obtain the SOX 404 disclosures from Audit Analytics to identify the material weakness in internal controls. We define ICW firms as firms that received an adverse internal control audit opinion under SOX 404 provisions and non-ICW firms as firms that received an unqualified internal control audit opinion.
This measurement of internal control quality can be justified for two reasons. First, managers rely on internal information generated from the internal control system to manage operations, monitor performance, create forecasts, and report results to shareholders, and, therefore, internal control quality is likely to affect various management decisions (Cheng, Goh, & Kim, 2018; Feng et al., 2009; Feng et al., 2015; Li et al., 2012). Higher quality information and better internal controls over financial reporting influence managers’ real decisions within the firm such as SG&A spending decisions, and have an impact on the quality of operating decisions (Ashbaugh-Skaife et al., 2009). Second, material weakness detected by external auditors reflects more serious control problems than those raised by corporate insiders (Kim et al., 2011; Skaife, Veenman, & Wangerin, 2013). The internal reports generated by such faulty control systems are likely to deter managers from making timely decisions in relation to SG&A cost management.
To further test the effect of internal information quality on SG&A cost asymmetry, we partition ICW cases into two distinct categories, that is, (a) internal information control problems and (b) other control problems, depending on the underlying reasons of ICW. 10 We classify ICWs as internal information control problems if they arise from (a) information technology, software, security, and access issue; (b) accounting personnel resources, competency, training, experience, and/or adequacy; (c) inadequate disclosure controls in terms of timeliness, accuracy, and completeness; or (iv) untimely or inadequate account reconciliations. 11 We classify all other ICW as other control problems. We focus on information technology problems because information technology controls, as a part of management information system, affect the quality of the information produced by the system. We thus expect that information technology controls are critical to improving the timeliness and accuracy of internal managerial reports (Li et al., 2012; Masli et al., 2010). We also consider accounting personnel problems because even firms with sophisticated information and operating systems may fail to enhance internal reporting quality if they lack accounting personnel with adequate expertise to use the systems properly and generate timely and accurate information (Choi et al., 2013). 12 In addition, inadequate disclosure controls and untimely account reconciliations can mirror the poor quality of internal reporting. If a faulty control system yields untimely, inaccurate, and incomplete information for corporate disclosures and account reconciliations, it is also likely to generate low-quality internal reports for managerial decision making (Feng et al., 2009; Li et al., 2012).
Empirical Models
To examine whether and how the asymmetric behavior of SG&A costs is associated with internal control quality, we rely on the empirical model developed by Anderson et al. (2003). They estimate the degree of SG&A cost asymmetry using Equation 1:

where, for firm i and year t, log(.) denotes the natural logarithm function; SG&Ai,t and Salesi,t represent SG&A costs and sales revenue, respectively; DecDummyi,t is an indicator variable that equals 1 if sales revenue in year t is less than that in year t − 1, and 0 otherwise. The dependent variable, Δlog(SG&Ai,t), represents the change in natural logarithm of SG&A costs between year t and t− 1. 13 The right-hand side of the equation includes the change in log of sales revenue between year t and t− 1, Δlog(Salesi,t), and its interaction with the sales decrease dummy, DecDummy×Δlog(Salesi,t). The change form and log transformation enhances the comparability of the regression coefficients across firms, and mitigates the effect of heteroskedasticity (Anderson et al., 2003). See the appendix for the details of variable definitions.
Equation 1 is based on the nonlinear asymmetric relation between SG&A costs and sales revenue. The coefficient α1 reflects the percentage change in SG&A costs for a 1% increase in sales revenue; it captures the sensitivity of change in SG&A costs to the change in sales revenue when the sales revenue increases from year t− 1 to year t (DecDummy = 0). The coefficient α1 is expected to be positive if managers increase their SG&A spending during the sales growth period. However, the sum of coefficients α1 and α2 captures the percentage change in SG&A costs for a 1% decrease in sales revenue. Hence, the coefficient α2 measures the incremental sensitivity of change in SG&A costs to the contemporaneous change in sales revenue when the sales revenue decreases from year t− 1 to year t (DecDummy = 1). This coefficient α2 is expected to be negative if managers make less adjustment on SG&A costs during the sales contraction period than during the sales growth period.
Anderson et al. (2003) show that the degree of SG&A cost asymmetry is affected by various economic factors by modeling the extent of cost stickiness as a linear combination of such factors. Following the specifications of Banker and Byzalov (2014), we expand the coefficients α0, α1, and α2 in Equation 1 as linear functions of an ICW indicator as well as four economic factors used by Anderson et al. to test the incremental impact of ICW on SG&A cost asymmetry:
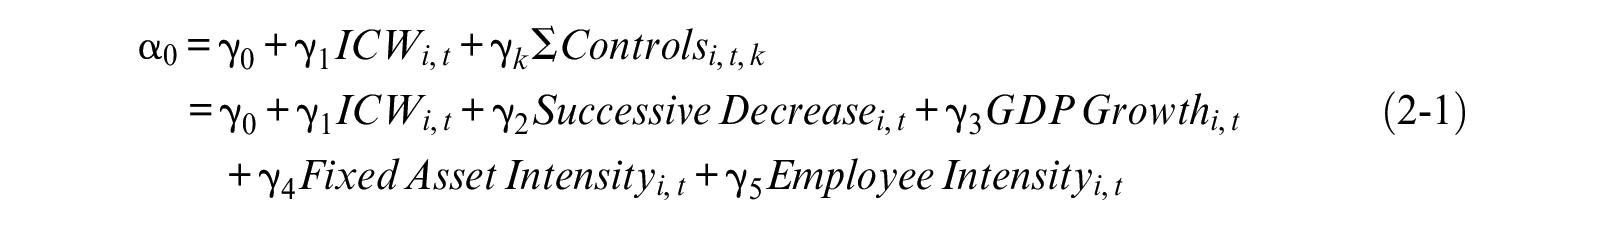
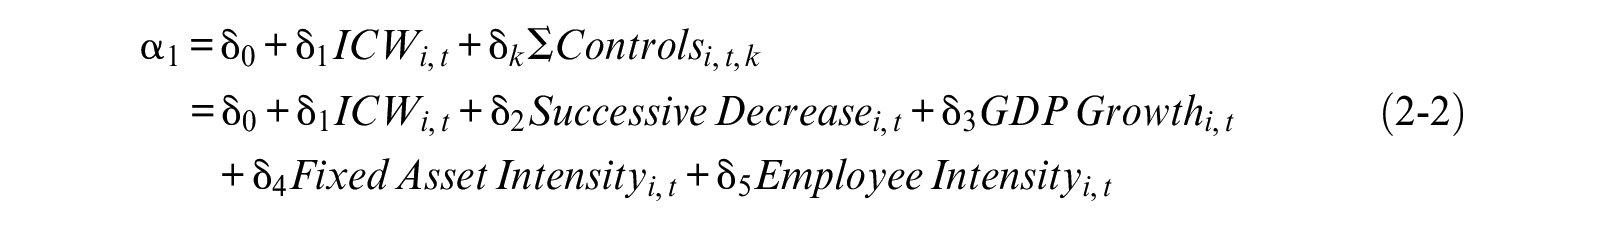
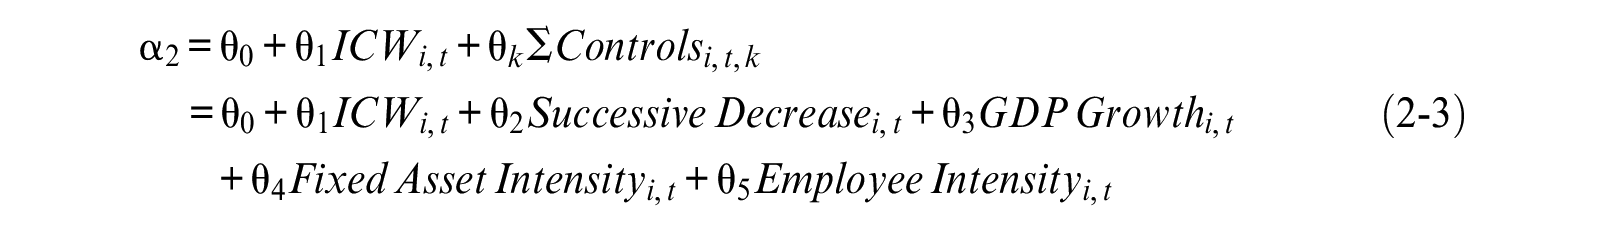
where, for firm i and year t, ICWi,t takes the value of 1 if the auditor concludes that a firm’s internal control over financial reporting is not effective under SOX 404, and 0 otherwise. ΣControlsi,t are four economic factors of SG&A cost asymmetry as documented in Anderson et al. (2003). Successive Decreasei,t takes the value of 1 when sales revenue in year t− 1 is less than sales revenue in year t− 2, and 0 otherwise. GDP Growthi,t is the percentage growth in real GDP in year t. Fixed Asset Intensityi,t is fixed assets divided by total assets in year t. Employee Intensityi,t is the number of employees divided by sales revenue in year t.
Finally, we obtain Equation 3 by substituting Equations 2-1, 2-2, and 2-3 into Equation 1 as follows:
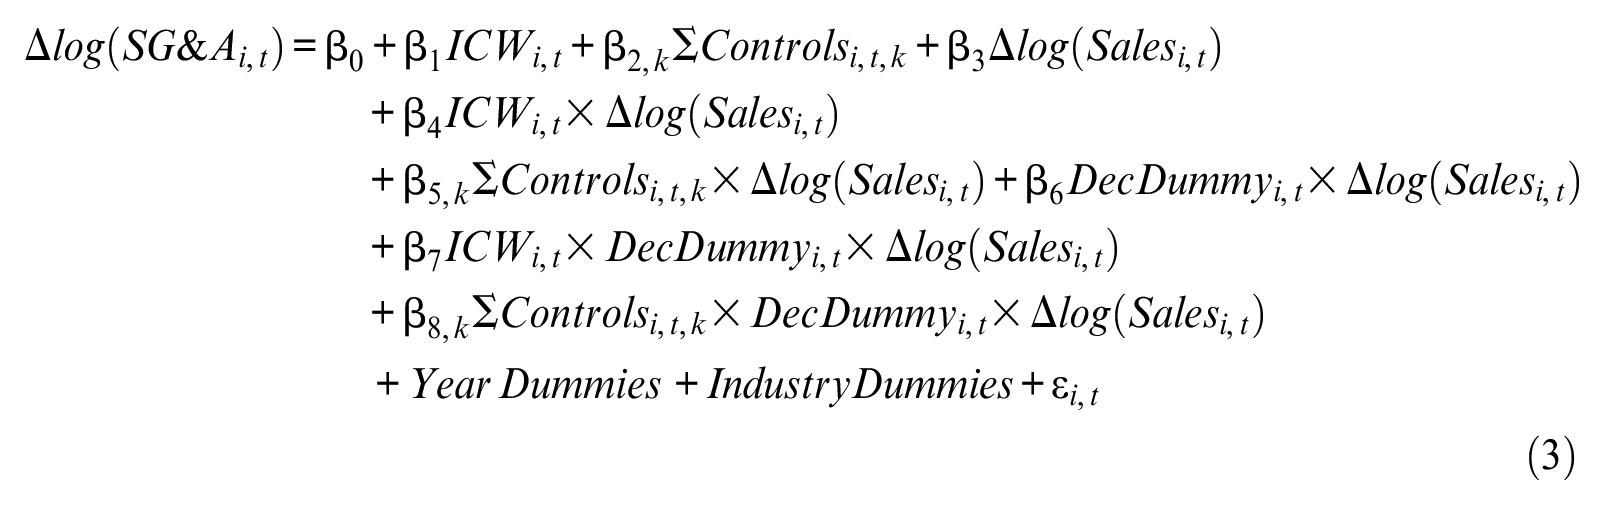
where ICWi,t and ΣControlsi,t,k are activated when sales revenue decreases as well as when sales increase. 14 When sales increase by 1%, SG&A costs increase by β3 percent for non-ICW firms and by (β3 + β4) percent for ICW firms. When sales decrease by 1%, SG&A costs decrease by (β3 + β6) percent for non-ICW firms and by (β3 + β4 + β6 + β7) percent for ICW firms. That is, cost stickiness can be captured by β6 for non-ICW firms and by (β6 + β7) for ICW firms, respectively. We thus expect the coefficient β7 to be significantly negative if the SG&A costs of ICW firms are stickier than those of non-ICW firms (as predicted in H1). Anderson et al. (2003) document that the stickiness of SG&A costs is less pronounced when sales also declined in the preceding period, and is more pronounced in the period of macroeconomic growth and in firms with a large amount of fixed assets and a large number of employees. We thus expect the coefficient β8,1 on the three-way interaction with Successive Decreasei,t to be positive and the coefficients β8,2, β8,3, and β8,4 on the three-way interactions with GDP Growthi,t, Fixed Asset Intensityi,t, and Employee Intensityi,t to be negative, respectively. Equation 3 also includes year and industry dummies to control for the time and industry fixed effects. Industries are identified using Fama–French 12 industry classification. 15 Variable definitions are detailed in the appendix.
To investigate the impact of internal information quality on SG&A cost asymmetry, we disaggregate ICWi,t in Equation 3 into ICW_Infoi,t and ICW_Othersi,t as follows:
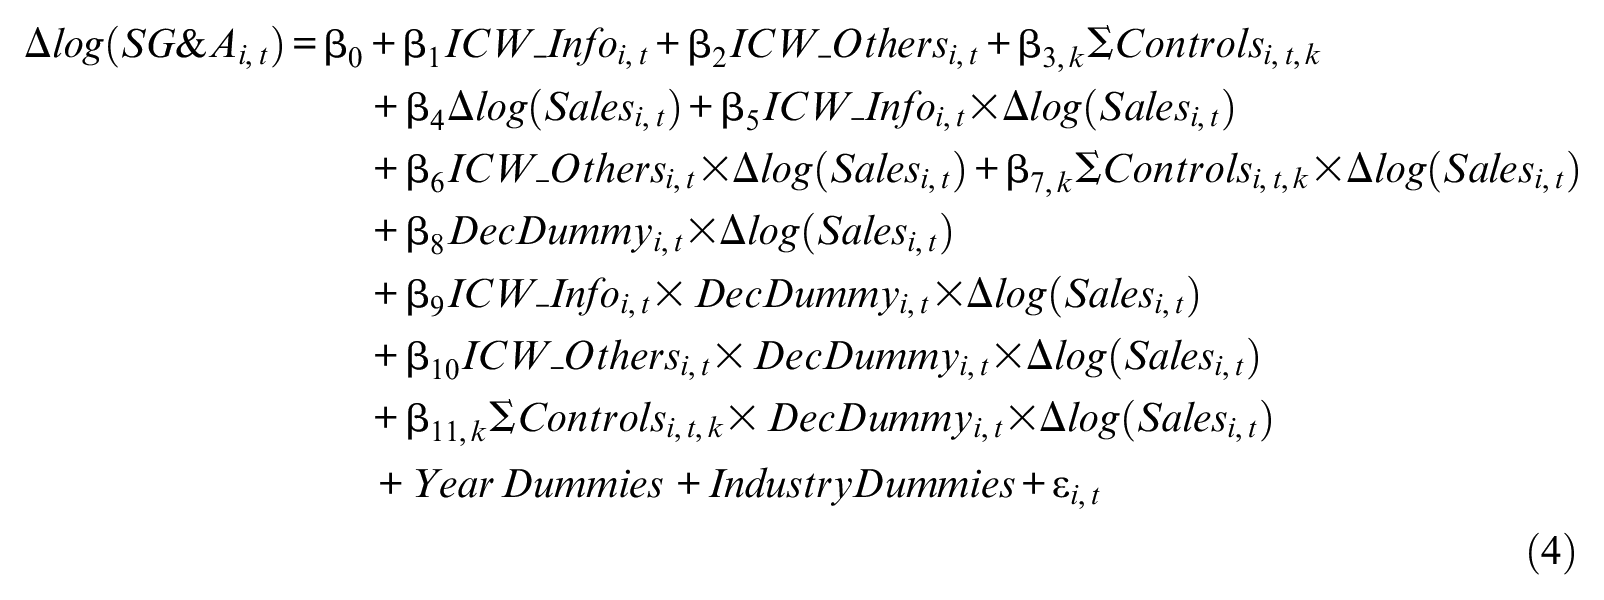
where, for firm i and year t, ICW_Infoi,t takes the value of 1 if a firm reports ICW related to internal information problems, and 0 otherwise. ICW_Othersi,t takes the value of 1 if a firm does not report ICW related to internal information problems but reports other ICW problems, and 0 otherwise. Using Equation 4, we compare the degree of SG&A cost asymmetry among three groups: ICW firms with internal information control problems, ICW firms with other control problems, and non-ICW firms (as a baseline group). The coefficient β9 (β10) is expected to be significantly negative if SG&A costs are stickier for ICW firms with internal information (other) control problems than for non-ICW firms. More important, we expect β9 to be less (i.e., greater in absolute value) than β10 if SG&A cost asymmetry is more pronounced for ICW firms with internal information problems than those with other control problems.
In all regression analyses, we winsorize each of the continuous variables at the first and 99th percentiles to alleviate the undue influence of extreme observations and exclude observations with SG&A costs exceeding sales revenue. 16 Throughout the article, t statistics for all regressions are based on robust standard errors corrected for heteroskedasticity and firm and year clustering (Petersen, 2009).
Sample and Data
Sample Selection
Our sample consists of accelerated filers that are included in Compustat for fiscal years 2004 to 2016. The sample period begins in 2004 because SOX 404 became effective for accelerated filers for fiscal years ending after November 15, 2004 (see figure 1 of Beneish et al., 2008, for the history of internal control regulations). We focus on accelerated filers following Feng et al. (2015) because these firms have reported both the manager’s assessment under SOX Section 404(a) and the auditor’s attestation under SOX Section 404(b) in their 10-K filings since 2004, whereas nonaccelerated filers have reported only the manager’s assessment under SOX Section 404(a) since 2007. We use the SOX 404(b) data from Audit Analytics to construct our test variables ICW, ICW_Info, and ICW_Others. Next, we merge these ICW variables with financial statement data from Compustat. We also require that there should be no missing value for all variables included in our regression.
Table 1, Panel A, presents the ICW distribution in our sample. Our final sample includes 24,483 firm–year observations from 4,184 unique firms. 17 The full sample contains 1,751 observations from ICW firms and 22,732 observations from non-ICW firms. Among the ICW firms, 1,058 observations have internal information control problems and 693 observations have other control problems. Table 1, Panel A, also reports the frequencies of sales increase and sales decrease in the full sample and its subsamples. The proportion of firm–years with sales increase (sales decrease) is 72% (28%) of the full sample and remains similar across our subsamples.
Sample Distribution.
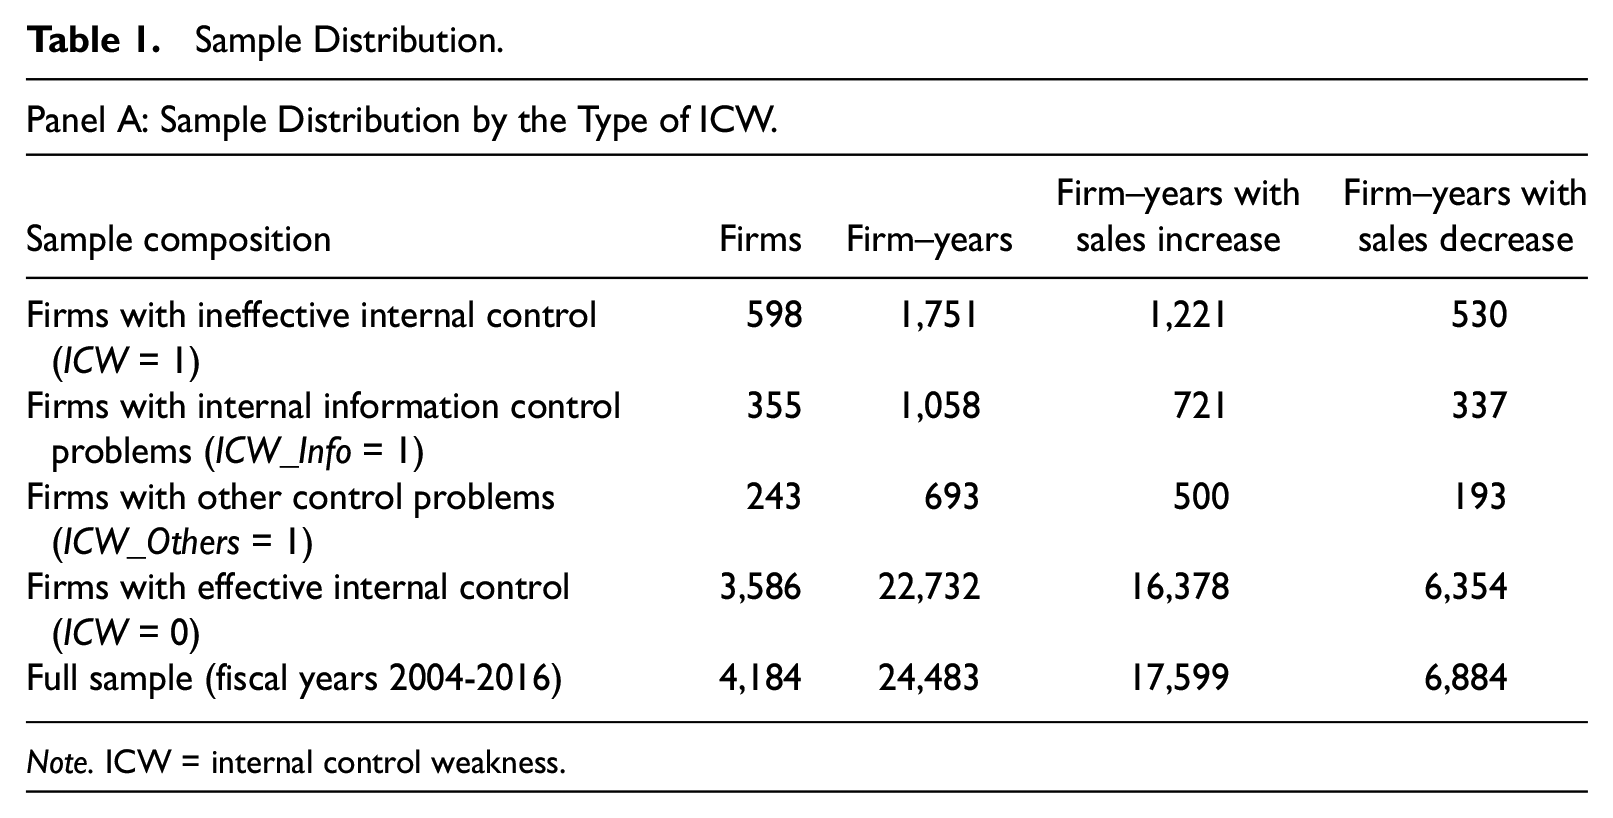
Note. ICW = internal control weakness.
Panel B: Sample Distribution by Industry.
Note. This table reports the sample distribution by the type of ICW in Panel A and the sample distribution by Fama–French industry in Panel B. Variable definitions are presented in the appendix. ICW = internal control weakness.
Table 1, Panel B, presents the sample distribution sorted by the Fama–French industry classification. The business equipment industry takes the largest portion (24.7%) of the full sample and the utilities industry takes the smallest portion (0.27%). 18 Notably, the industry distribution is fairly similar between ICW firms and non-ICW firms. Therefore, it is unlikely that our results are unduly influenced by ICW incidences concentrated in specific industries.
Descriptive Statistics
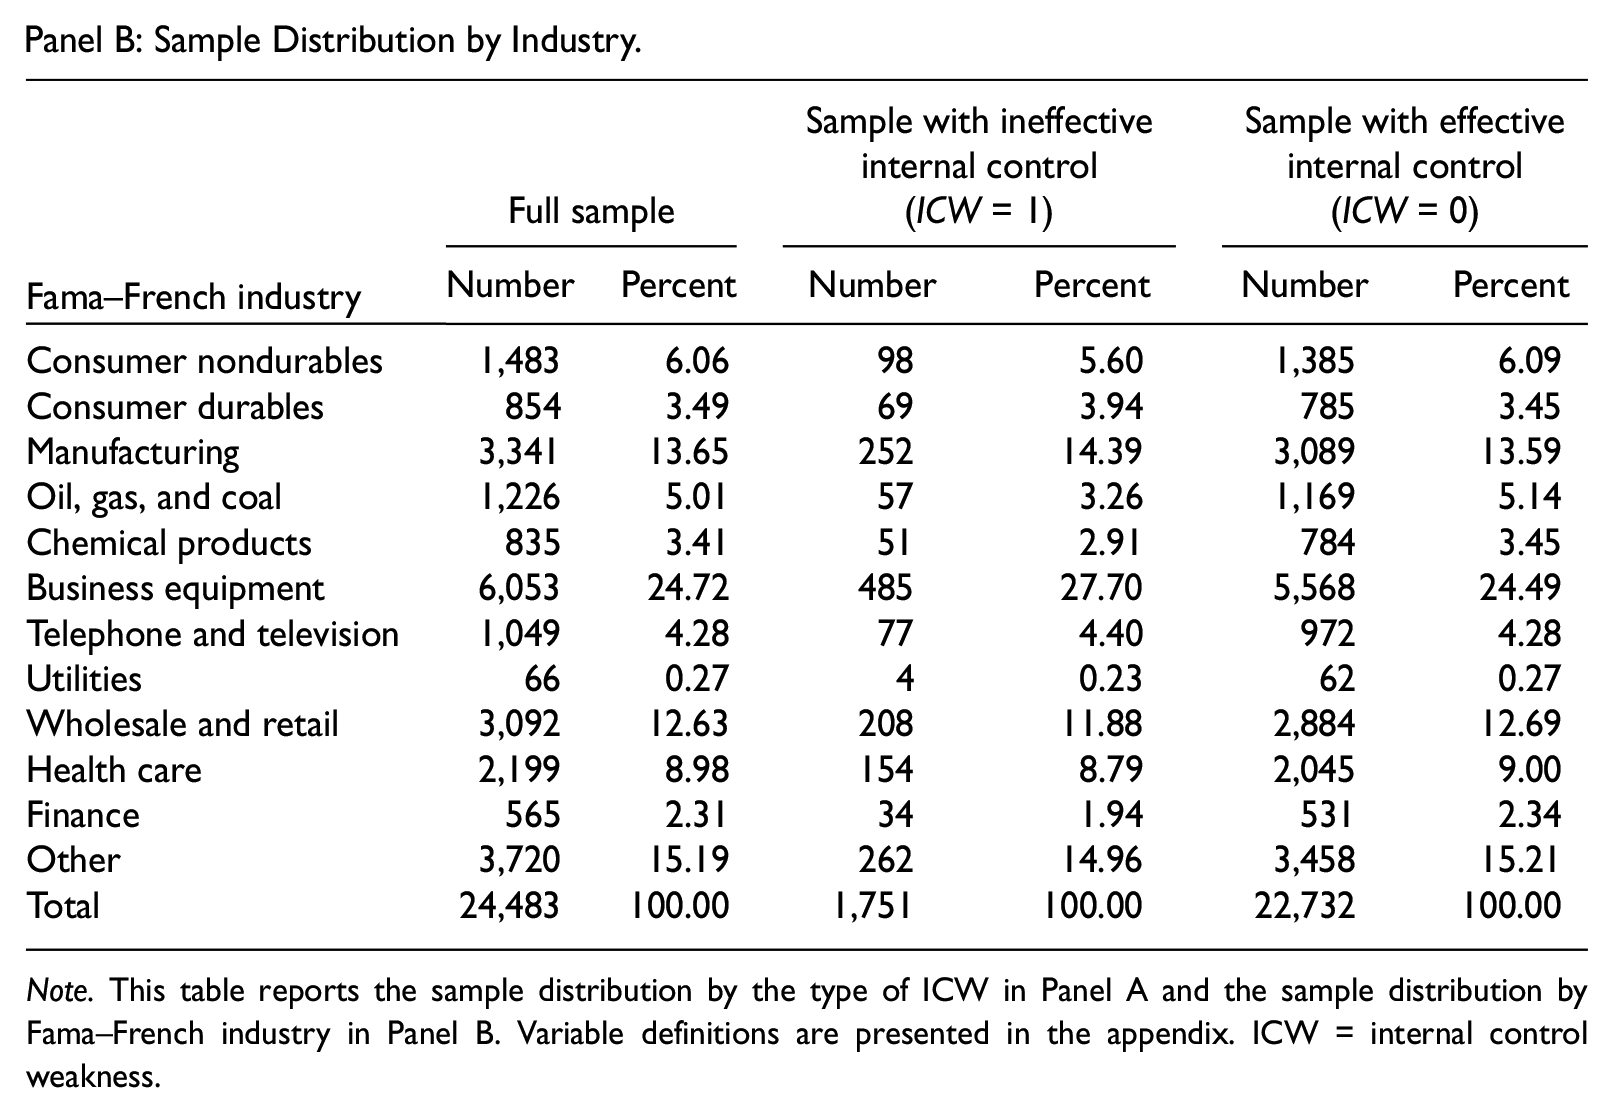
Table 2, Panel A, provides the summary statistics of research variables for the full sample. The mean (median) sales revenue is US$5,219 (US$868) million, whereas the mean (median) SG&A cost is US$903 (US$169) million, suggesting that both distributions are positively skewed. The mean (median) SG&A cost as a percentage of sales revenue is 26% (22%). The means of DecDummy and Successive Decrease suggest that annual sales revenue declined in the current year (relative to the previous year) for 28% of the observations (i.e., DecDummyi,t = 1), and dropped in the preceding year (relative to the 2 years ago) for 24% of the observations (i.e., Successive Decreasei,t = 1). 19 On average, fixed assets account for 26% of total assets, whereas 0.51 employee generates a million dollars of sales revenue. These descriptive statistics are comparable with those illustrated in Anderson et al. (2003) and Chen et al. (2012).
Descriptive Statistics.
Note. SG&A = selling, general, and administrative; GDP = gross domestic product.(continued)
Panel B: Summary Statistics for Subsamples Partitioned by ICW.
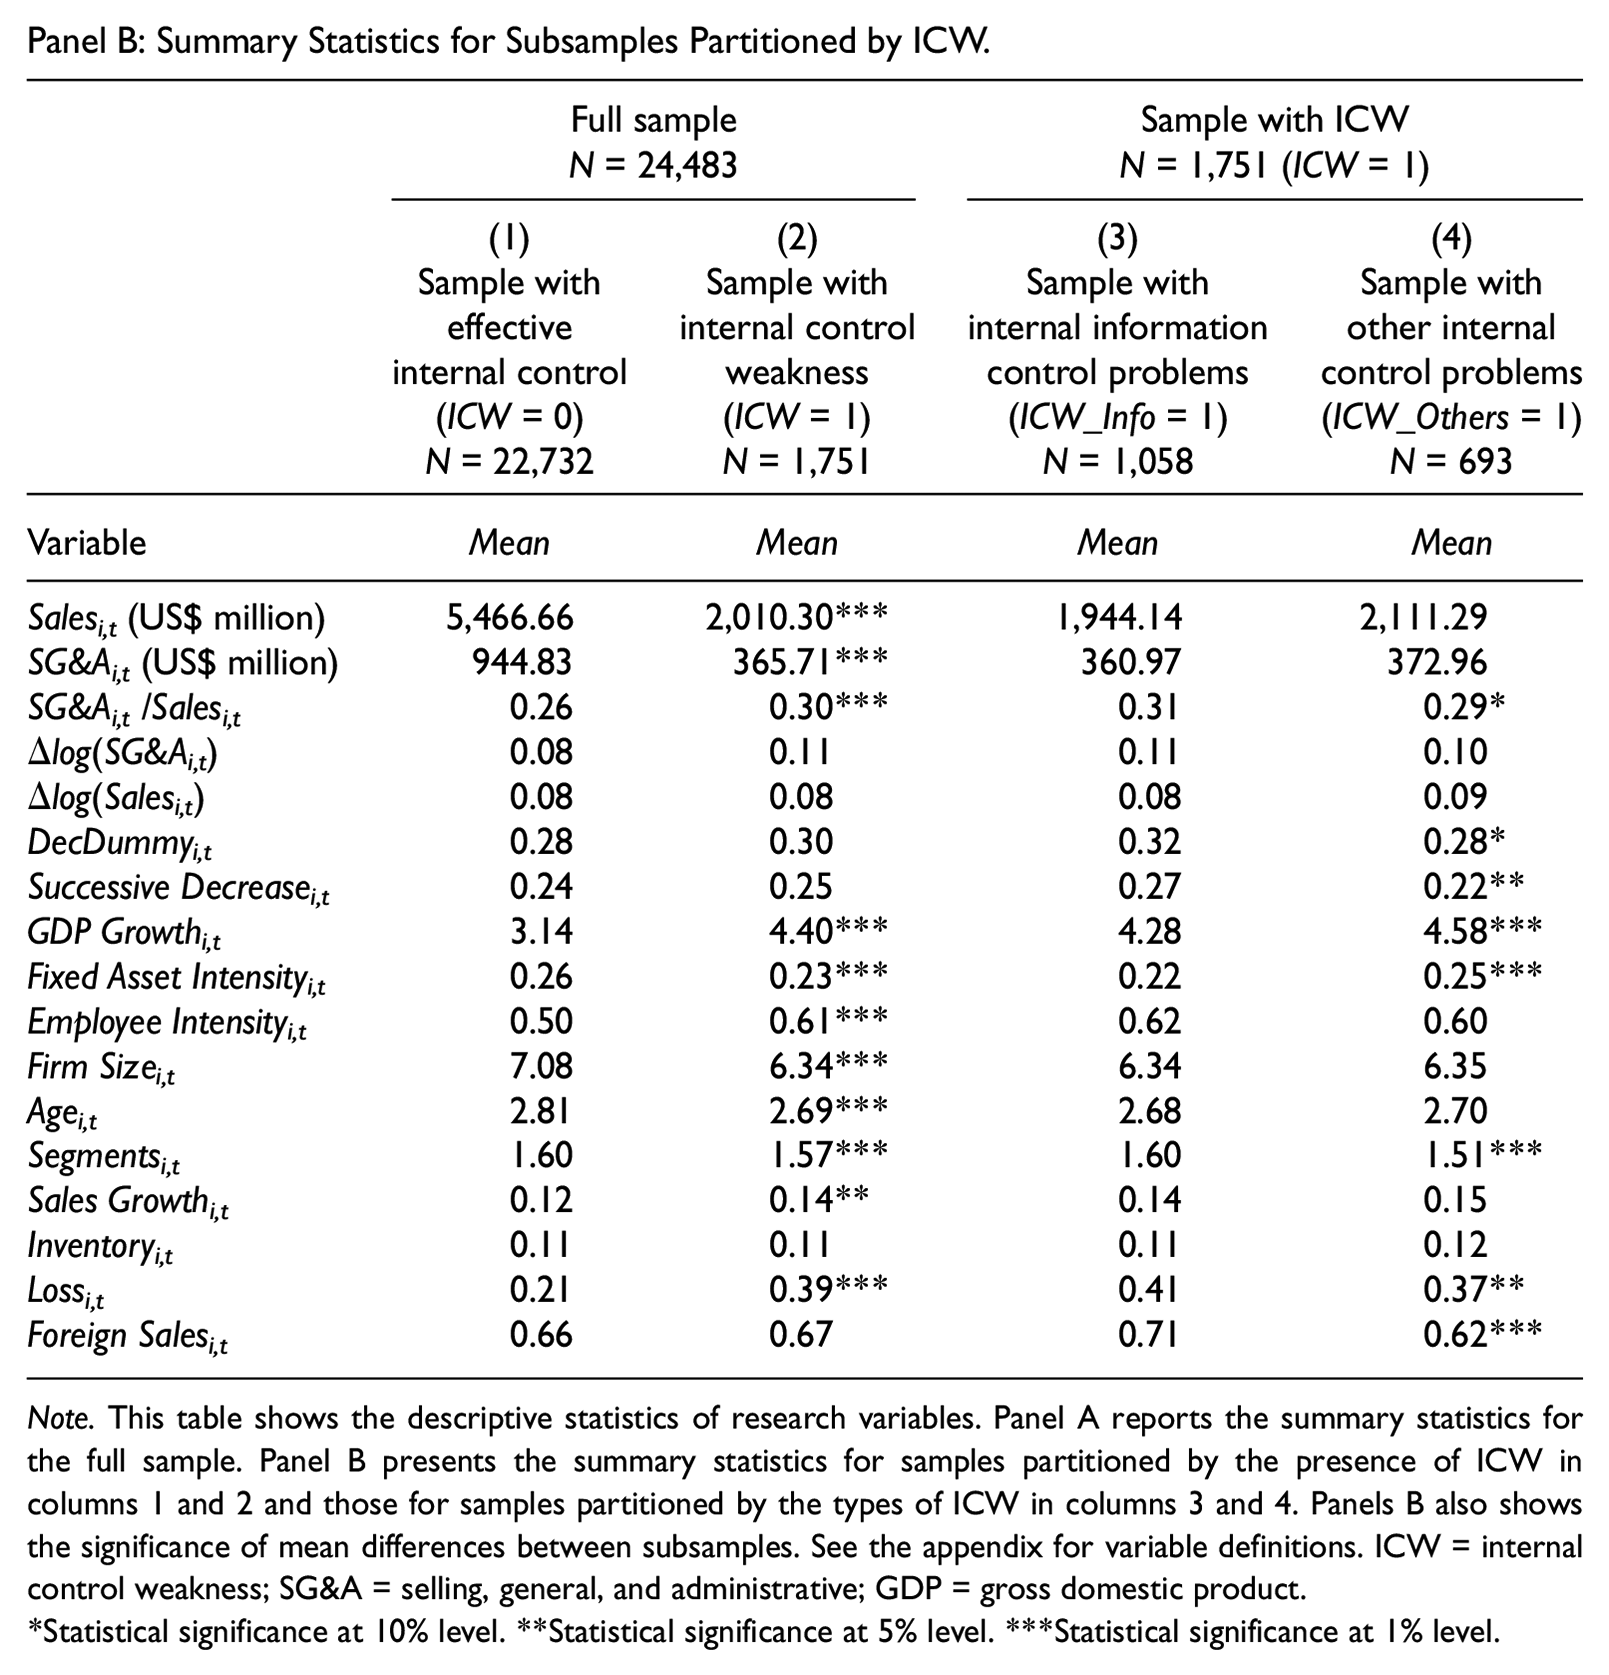
Note. This table shows the descriptive statistics of research variables. Panel A reports the summary statistics for the full sample. Panel B presents the summary statistics for samples partitioned by the presence of ICW in columns 1 and 2 and those for samples partitioned by the types of ICW in columns 3 and 4. Panels B also shows the significance of mean differences between subsamples. See the appendix for variable definitions. ICW = internal control weakness; SG&A = selling, general, and administrative; GDP = gross domestic product.
Statistical significance at 10% level. **Statistical significance at 5% level. ***Statistical significance at 1% level.
Table 2, Panel B, presents the univariate comparison between subsamples partitioned by the presence and the types of ICW. Columns 1 and 2 of Panel B compare the means of research variables between ICW firms and non-ICW firms. ICW firms are significantly smaller than non-ICW firms in terms of sales revenue, SG&A costs, and total assets, which is consistent with the findings of Ashbaugh-Skaife, Collins, and Kinney (2007) and Doyle et al. (2007). ICW firms spend more SG&A costs as a percentage of sales revenue than non-ICW firms, suggesting that the former is less efficient in SG&A cost management than the latter. 20 Moreover, ICW firms exhibit a larger (log) increase in annual SG&A costs than non-ICW firms, whereas the (log) increase in sales revenue is not significantly different between the two groups. The results indicate that the increase (decrease) in SG&A costs surpasses (lags) that in sales revenue for ICW firms. Furthermore, ICW firms have lower fixed asset intensity, higher employee intensity, younger age, a smaller number of segments, higher (unlogged) sales growth, and higher likelihood of loss occurrence than non-ICW firms.
Columns 3 and 4 of Panel B show the univariate comparison between ICW firms with internal information problems and ICW firms with other control problems. The levels and log changes in sales revenue and SG&A costs are not significantly different between the two groups. However, ICW firms with internal information problems have more frequent sales decreases, lower fixed asset intensity, a larger number of segments, higher likelihood of loss occurrence, and higher likelihood of having foreign sales than those with other control problems. The results support the choice of these control variables in regression models.
Empirical Results
ICW and SG&A Cost Asymmetry
To test the effect of ICW on the asymmetric behavior of SG&A costs, we first estimate Equation 3. Table 3 provides the results of ordinary least squares (OLS) regressions for the full sample. Column 1 does not include the main and interaction terms of control variables, whereas columns 2 and 3 include them. As shown in column 1, the coefficient on Sales Change (β3) is significantly positive and the coefficient on DecDummy×Sales Change (β6) is significantly negative. This result is consistent with the presence of cost stickiness in SG&A expenditure for non-ICW firms; SG&A costs increase when sales increase, but SG&A costs decrease to a lesser degree when sales decrease. Specifically, the estimated value of β3 (= 0.566) and the combined value of β3 + β6 (= 0.566 − 0.254) indicate that whereas SG&A costs increase by 0.566% per 1% increase in sales revenue, SG&A costs decrease by 0.312% per 1% decrease in sales revenue for non-ICW firms. More important, the coefficient on the three-way interaction term with ICW (β7) is negative and significant, whereas that on the two-way interaction with ICW (β4) is not significant. 21 The combined value of β3 + β4 + β6 + β7 (= 0.566 + 0.046 − 0.254 − 0.170) indicates that SG&A costs decrease by only 0.188% per 1% reduction in sales revenue for ICW firms. The significant difference in SG&A cost asymmetry between ICW and non-ICW firms supports our H1 that ICW is associated with stickier SG&A costs.
ICW and SG&A Cost Asymmetry.
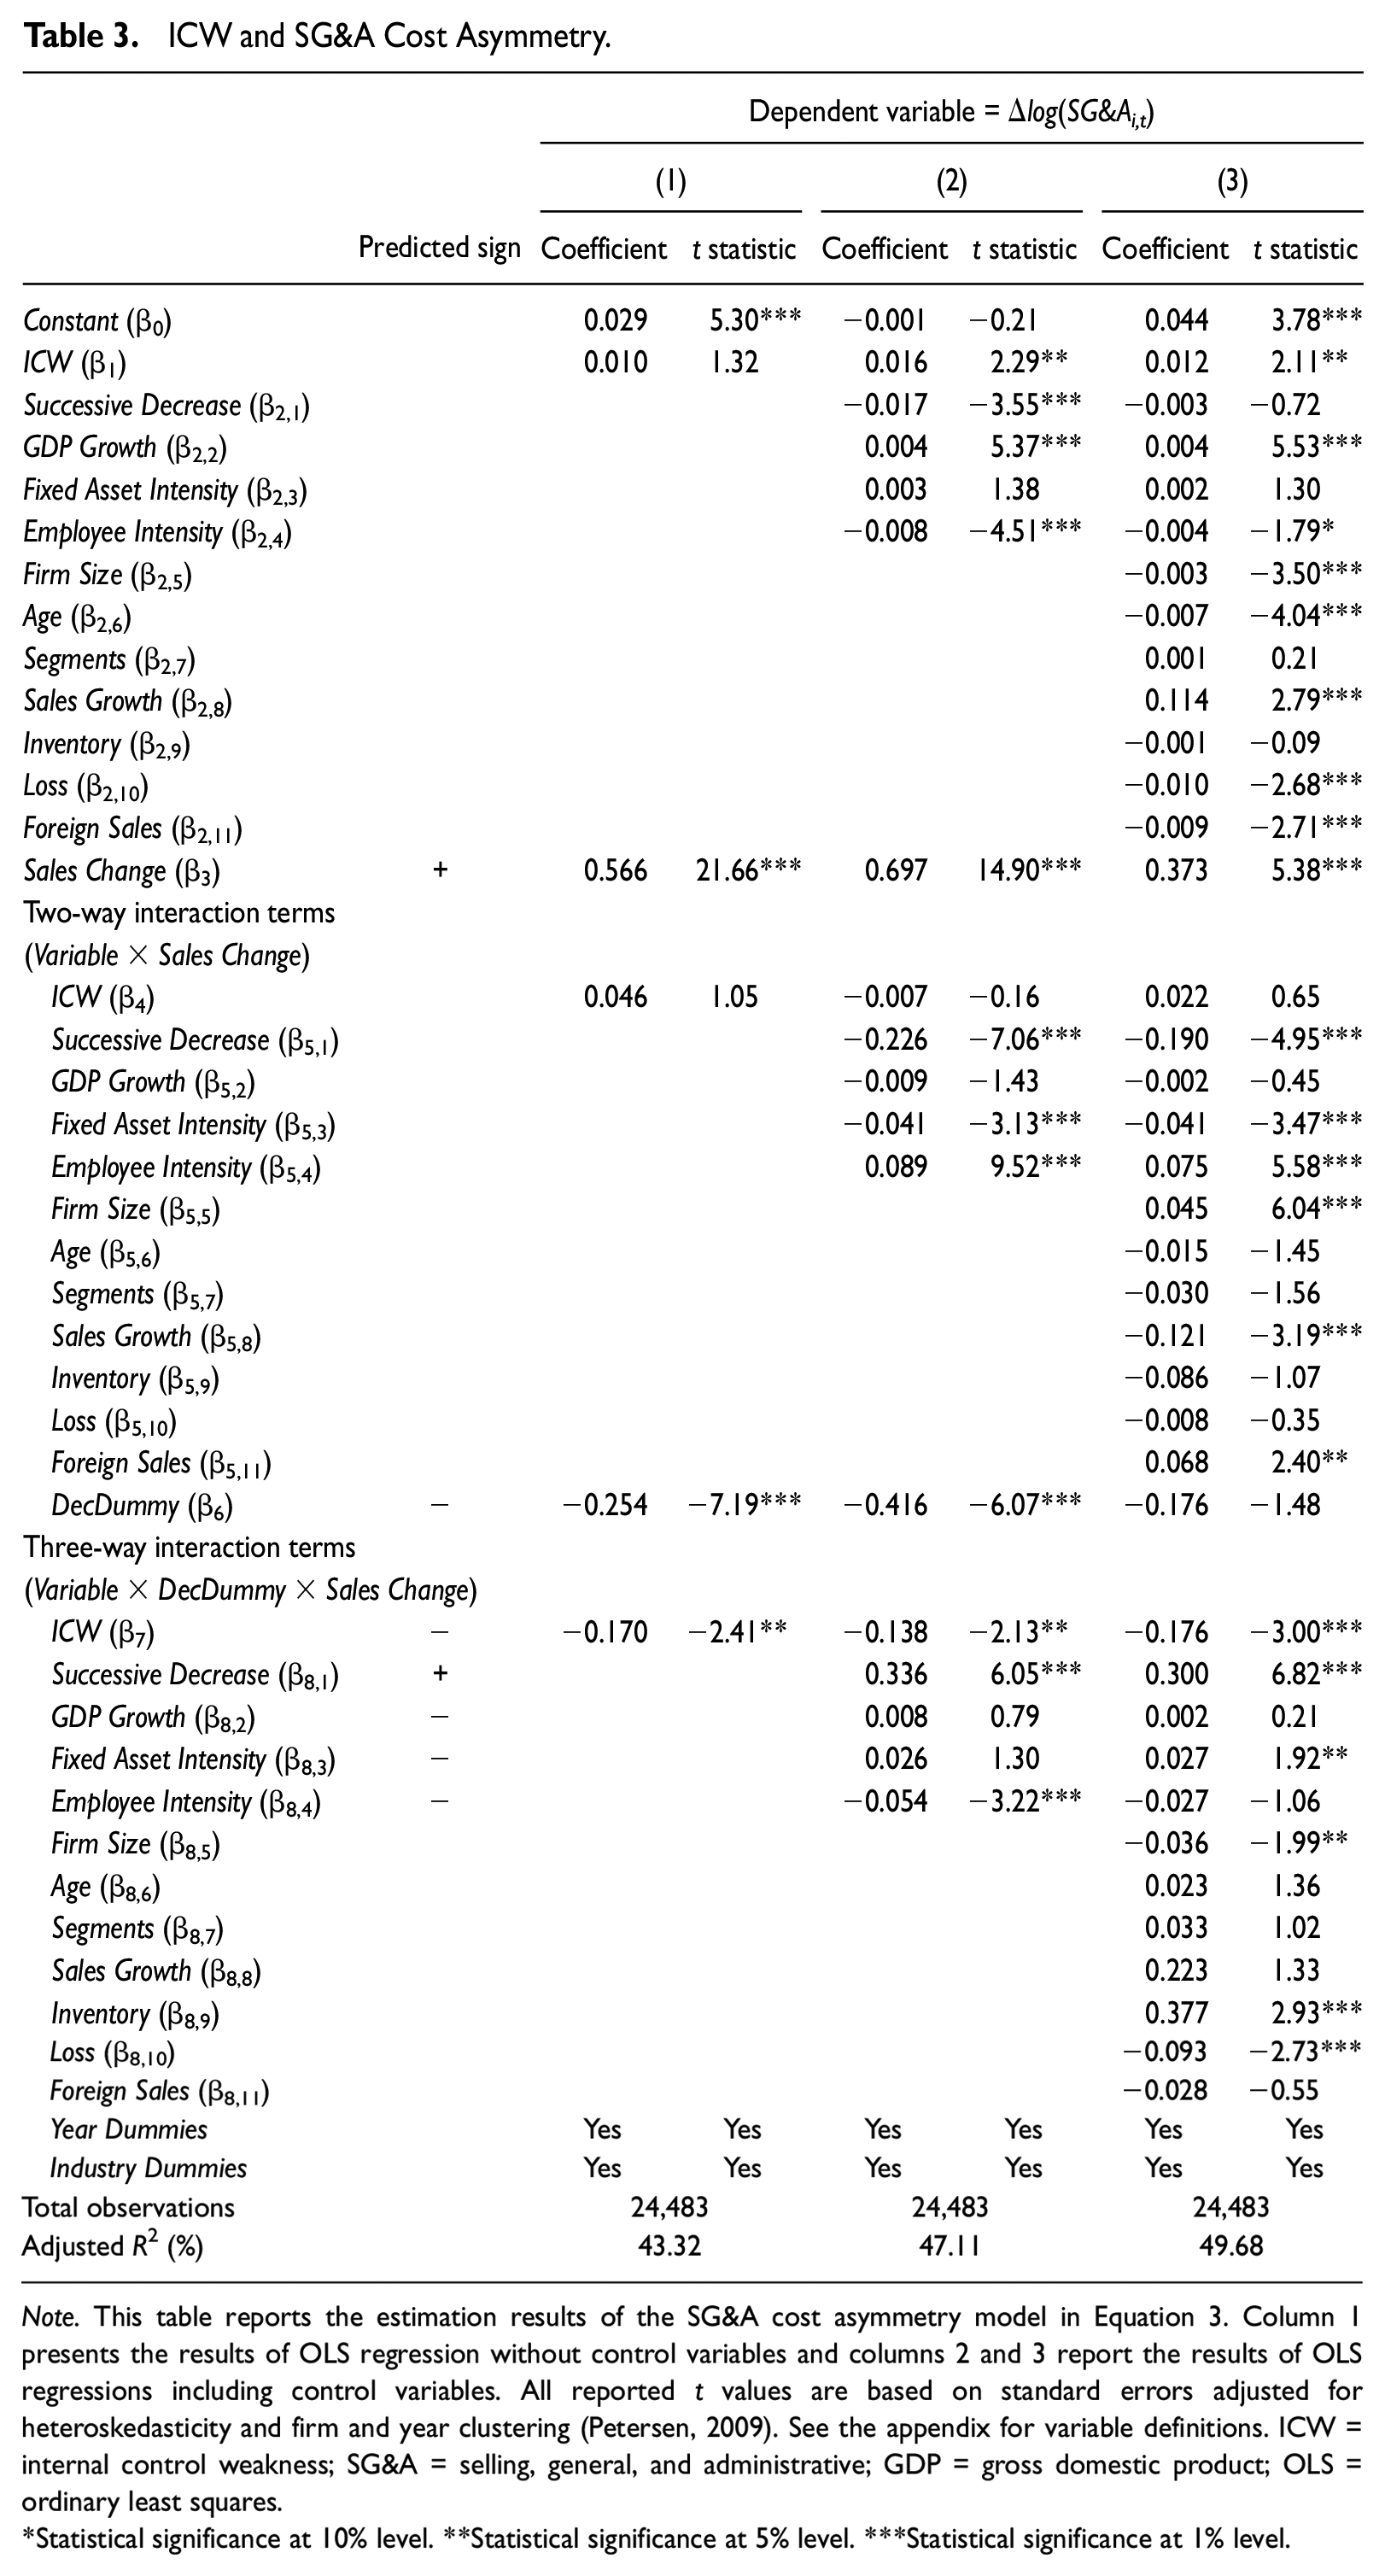
Note. This table reports the estimation results of the SG&A cost asymmetry model in Equation 3. Column 1 presents the results of OLS regression without control variables and columns 2 and 3 report the results of OLS regressions including control variables. All reported t values are based on standard errors adjusted for heteroskedasticity and firm and year clustering (Petersen, 2009). See the appendix for variable definitions. ICW = internal control weakness; SG&A = selling, general, and administrative; GDP = gross domestic product; OLS = ordinary least squares.
Statistical significance at 10% level. **Statistical significance at 5% level. ***Statistical significance at 1% level.
Column 2 includes four control variables that might affect the degree of SG&A cost asymmetry. Overall, the results are robust to adding potential economic determinants of cost stickiness. Whereas the coefficient on Sales Change (β3) is significantly positive, the coefficient on DecDummy×Sales Change (β6) is significantly negative. The significantly negative coefficient on the three-way interaction term with ICW (i.e., β7 = 0.138 with t = −2.13) is consistent with our H1, suggesting that SG&A costs are stickier for ICW firms than for non-ICW firms. Among the control variables, the coefficient on the three-way interaction term with Successive Decrease is significantly positive but the counterpart with Employee Intensity is significantly negative. The coefficients on the three-way interaction terms with GDP Growth and Fixed Asset Intensity are statistically indifferent from zero. 22
Column 3 further includes firm-specific control variables that may determine the presence of ICW. Although column 2 based on Equation 3 includes the key economic factors of SG&A cost asymmetry as in Anderson et al. (2003), there might be omitted variables that affect both the degree of SG&A cost asymmetry and the occurrence of ICW problems. To ensure that our ICW variable does not merely represent some other inherent operating factors that may influence cost stickiness, we expand Equation 3 by adding a set of ICW determinants documented by Ashbaugh-Skaife et al. (2007) and Ashbaugh-Skaife, Collins, Kinney, and LaFond (2009): firm size, firm age, the number of segments, sales growth, inventory holdings, a loss indicator, and a foreign sales indicator. In column 3, the coefficient on Sales Change (β3) is significantly positive and the coefficients on DecDummy×Sales Change (β6) and the three-way interaction with ICW (β7) are significantly negative. The overall results suggest that the positive relation between ICW occurrence and SG&A cost stickiness is not sensitive to the inclusion of potential ICW determinants to the regressions.
We conduct two additional tests to check the robustness of our results. First, we perform industry-level regressions over Fama–French 12 industries. Specifically, we estimate the industry-specific coefficients for each of the 12 industries and perform statistical tests with the mean coefficients and t statistics based on the standard errors of the 12 sets of industry-specific coefficients. We employ the industry-level analyses to see whether our results remain robust after controlling for the potential systematic difference in cost structure across industries. 23 The untabulated results from industry-level regressions are qualitatively similar with those from the full-sample regressions. This finding suggests that the positive association between ICW occurrence and SG&A cost stickiness is unaffected by the difference in cost structure across industries.
Second, we perform our regression analysis after controlling for firm fixed effects. Although we control for various economic determinants of cost stickiness and ICW in Table 3, we cannot rule out the possibility that some omitted variables might jointly explain the degree of SG&A cost asymmetry and the incidence of ICW problems. The firm fixed effect regression allows us to control for potential impacts on our results of time-invariant firm-specific factors that are unobservable and thus omitted from the regression (Lennox, Francis, & Wang, 2012). Moreover, the firm fixed effect regression is less sensitive to the joint determination of SG&A cost stickiness and ICW occurrence (Larcker & Rusticus, 2010; Lennox et al., 2012). Although not tabulated for brevity, we find that our main results are robust to the inclusion of firm fixed effects. This finding alleviates a concern over potential endogeneity that may arise from firm-level omitted variables that are correlated with the incidence of ICW problems.
In sum, we find that SG&A cost asymmetry is more pronounced for ICW firms than for non-ICW firms, which is consistent with the prediction in H1. The finding suggests that, when the internal control system is not effective, managers tend to postpone their decisions about whether to reduce committed resources in response to sales decrease.
Characteristics of ICW and SG&A Cost Asymmetry
We next investigate the impact of different types of ICW on SG&A cost asymmetry. Specifically, we estimate Equation 4 to test the difference in SG&A cost stickiness between ICW firms with internal information control problems and those with other control problems. Table 4 reports the results of OLS regressions for Equation 4. Column 1 shows the effect of the two types of ICW problems on SG&A cost stickiness. The coefficients on the three-way interaction terms with ICW_Info (β9) and with ICW_Others (β10) are both negative but only the former is statistically significant. The estimated value of β9 (= −0.305) is significantly less (larger in absolute magnitude) than that of β10 (= −0.049; p < .01). This result suggests that the significant effect of ICW on SG&A cost stickiness is more pronounced in ICW firms with internal information problems than in those with other control problems.
Internal Information Control Problems and SG&A Cost Asymmetry.
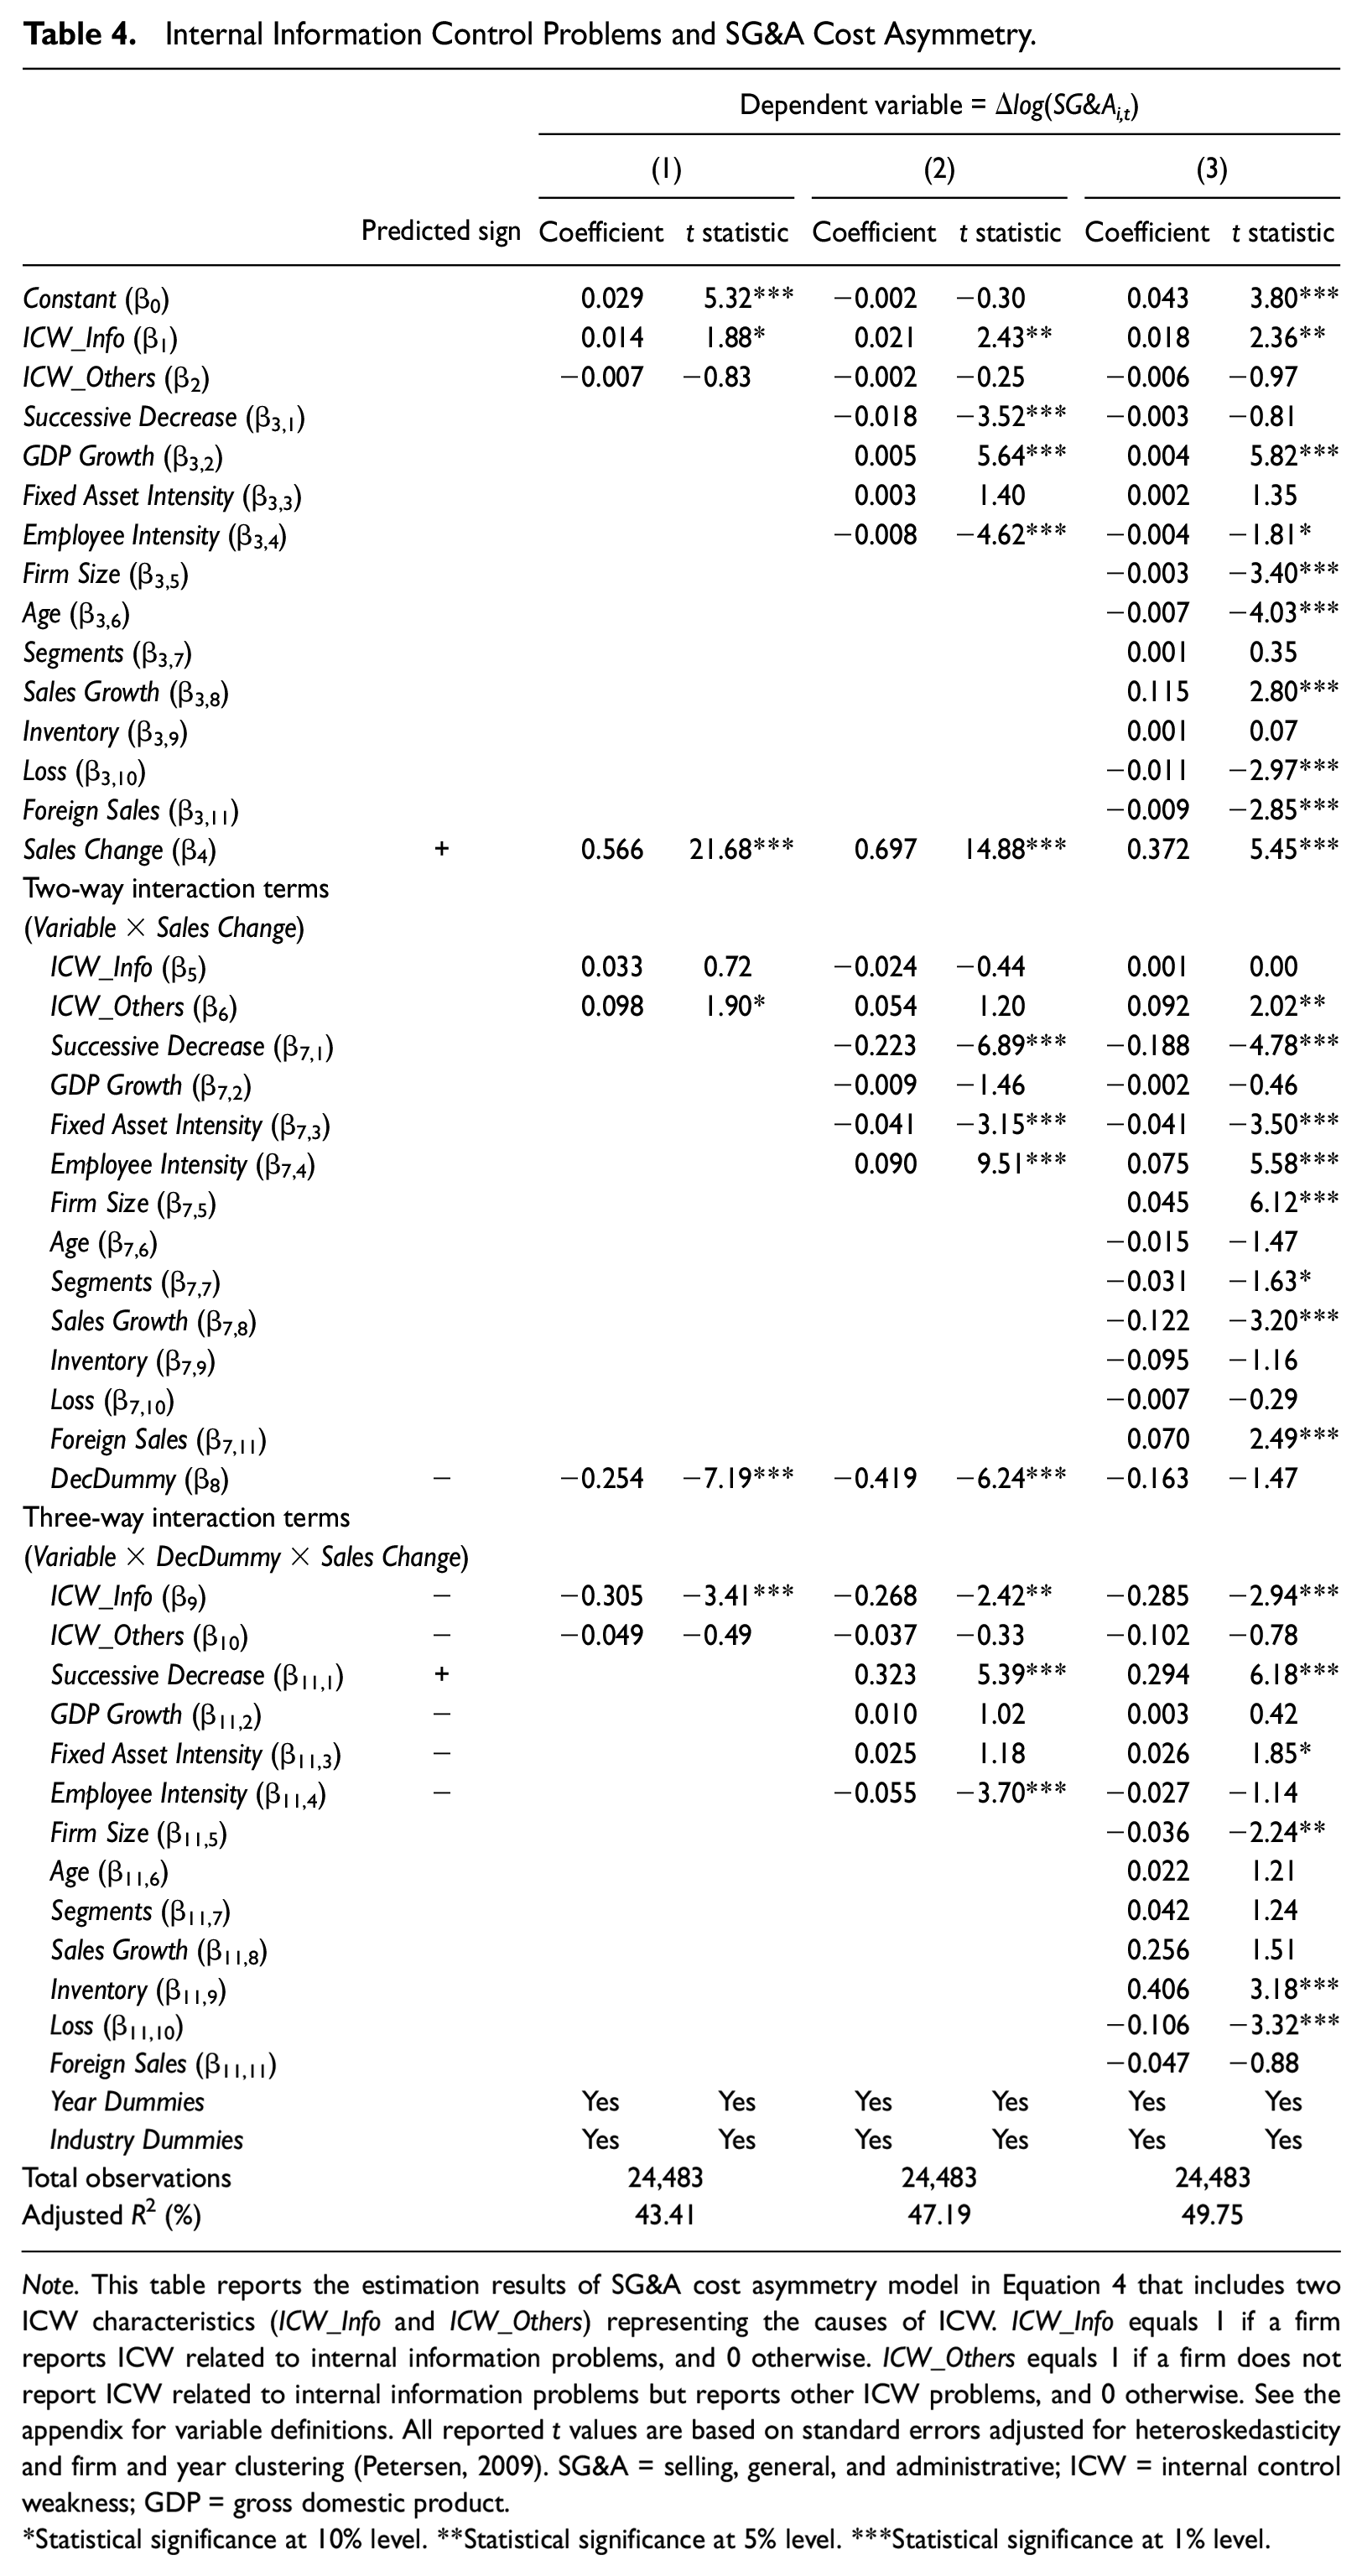
Note. This table reports the estimation results of SG&A cost asymmetry model in Equation 4 that includes two ICW characteristics (ICW_Info and ICW_Others) representing the causes of ICW. ICW_Info equals 1 if a firm reports ICW related to internal information problems, and 0 otherwise. ICW_Others equals 1 if a firm does not report ICW related to internal information problems but reports other ICW problems, and 0 otherwise. See the appendix for variable definitions. All reported t values are based on standard errors adjusted for heteroskedasticity and firm and year clustering (Petersen, 2009). SG&A = selling, general, and administrative; ICW = internal control weakness; GDP = gross domestic product.
Statistical significance at 10% level. **Statistical significance at 5% level. ***Statistical significance at 1% level.
Columns 2 and 3 repeat the test in column 1 after including the main and interaction terms of control variables. We find that the coefficients on the three-way interaction terms with ICW_Info (β9) and ICW_Others (β10) are consistently negative but only the former remains significant. This finding indicates that the positive association between ICW and SG&A cost asymmetry is primarily attributable to internal information control problems rather than to other control problems. The finding is also consistent with the view that poor-quality internal information produced by the inadequate control system is associated with the delayed adjustment of SG&A resources during the sales-decrease periods.
Overall, the results in Table 4 further confirm that managers in ICW firms make less timely downward adjustment of SG&A resources in response to sales decrease than those in non-ICW firms, and show that the untimely resource adjustment is largely attributable to the poor-quality internal information generated by the ineffective internal control system.
Remediation of ICW and SG&A Cost Asymmetry
If the presence of ICW problems induces a high level of SG&A cost asymmetry, one can expect to observe that this asymmetry is reduced when firms fix the reported ICW problems. As a validity check for our cross-sectional results in Tables 3 and 4, we now examine whether the remediation of ICW problems leads to lowering the degree of SG&A cost asymmetry, or equivalently, whether SG&A costs become less sticky after the remediation of ICW. Specifically, we replace ICWi,t in Equation 3 by Remediationi,t, Non-Remediationi,t, and New ICWi,t as follows:
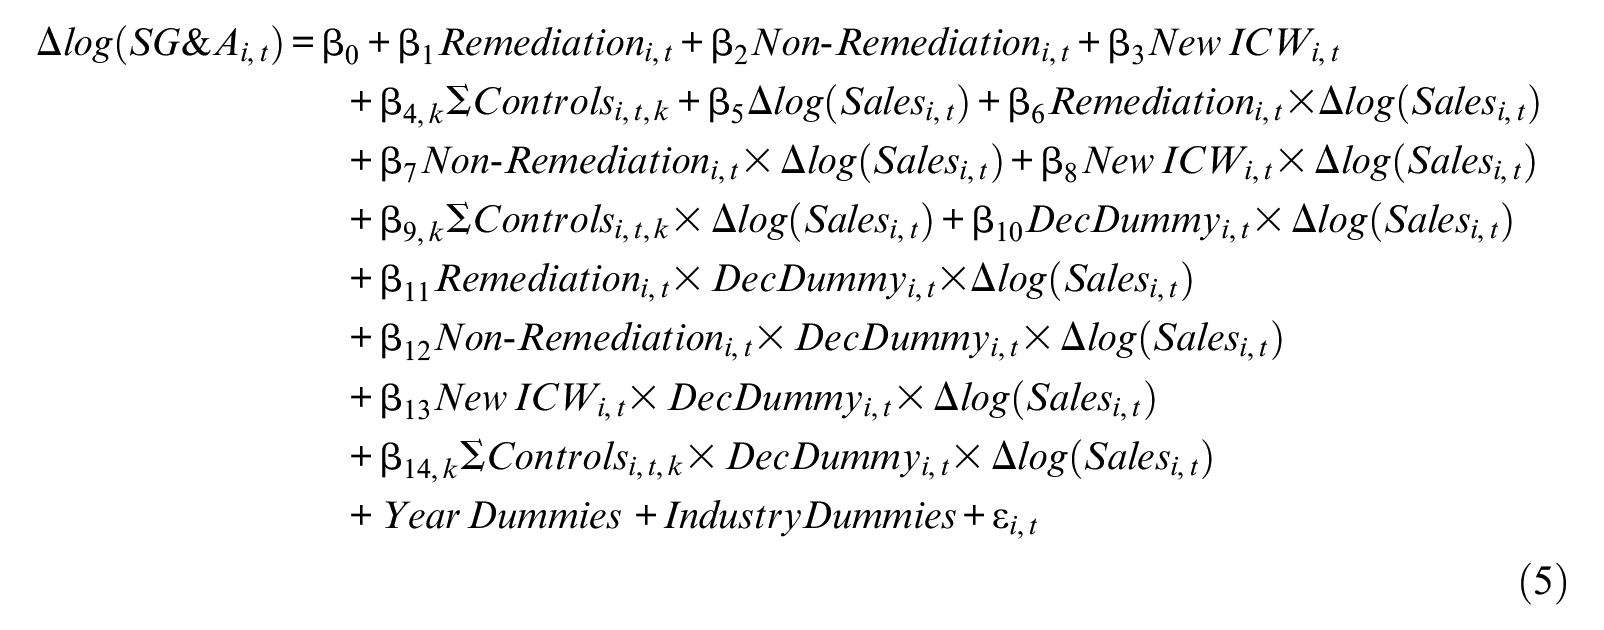
where, for firm i and year t, Remediationi,t equals 1 if a firm received an adverse internal control audit opinion under SOX 404 provisions in the previous year and then an unqualified internal control audit opinion in the current year, and 0 otherwise. Non-Remediationi,t equals 1 if a firm received an adverse SOX 404 audit opinion in both the previous and current years, and 0 otherwise. New ICWi,t equals 1 if a firm received an unqualified SOX 404 audit opinion in the previous year and then an adverse SOX 404 opinion in the current year, and 0 otherwise. Using Equation 5, we compare the degree of SG&A cost stickiness among four groups: remediation firms (821 observations), nonremediation firms (411 observations), new ICW firms (1,340 observations), and non-ICW firms (21,911 observations that received an unqualified SOX 404 opinion in both the previous and current years). If the remediation of ICW problems improves the internal information quality and, thus, lowers the degree of cost asymmetry, we expect the coefficient β11 for remediation firms to be significantly greater (i.e., less sticky costs) than the coefficient β12 for nonremediation firms and the coefficient β13 for new ICW firms.
Table 5 reports the results for Equation 5 with Remediation, Non-Remediation, and New ICW as additional test variables. In column 1, the coefficient on Sales Change (β5) is significantly positive and the coefficient on DecDummy×Sales Change (β10) is significantly negative, which is consistent with the results in Tables 3 and 4. The coefficient on the three-way interaction term with Remediation (β11) is significantly positive but the counterpart with Non-Remediation (β12) is significantly negative. More important, the coefficient β11 for remediation firms is significantly greater than the coefficient β12 for nonremediation firms (p < .01). The results suggest that SG&A costs become less sticky for firms with previously reported ICW problems being fixed in the current period than for firms with previously reported ICW problems not being fixed. In contrast, the coefficient on the three-way interaction with New ICW (β13) is negative and highly significant, which confirms our findings in Tables 3 and 4 that SG&A costs are stickier for ICW firms than for non-ICW firms. Moreover, the coefficient β11 for remediation firms is significantly greater than the coefficient β13 for new ICW firms (p < .01), suggesting the significant decrease in cost asymmetry following the remediation of ICW problems.
Remediation of ICW and SG&A Cost Asymmetry.
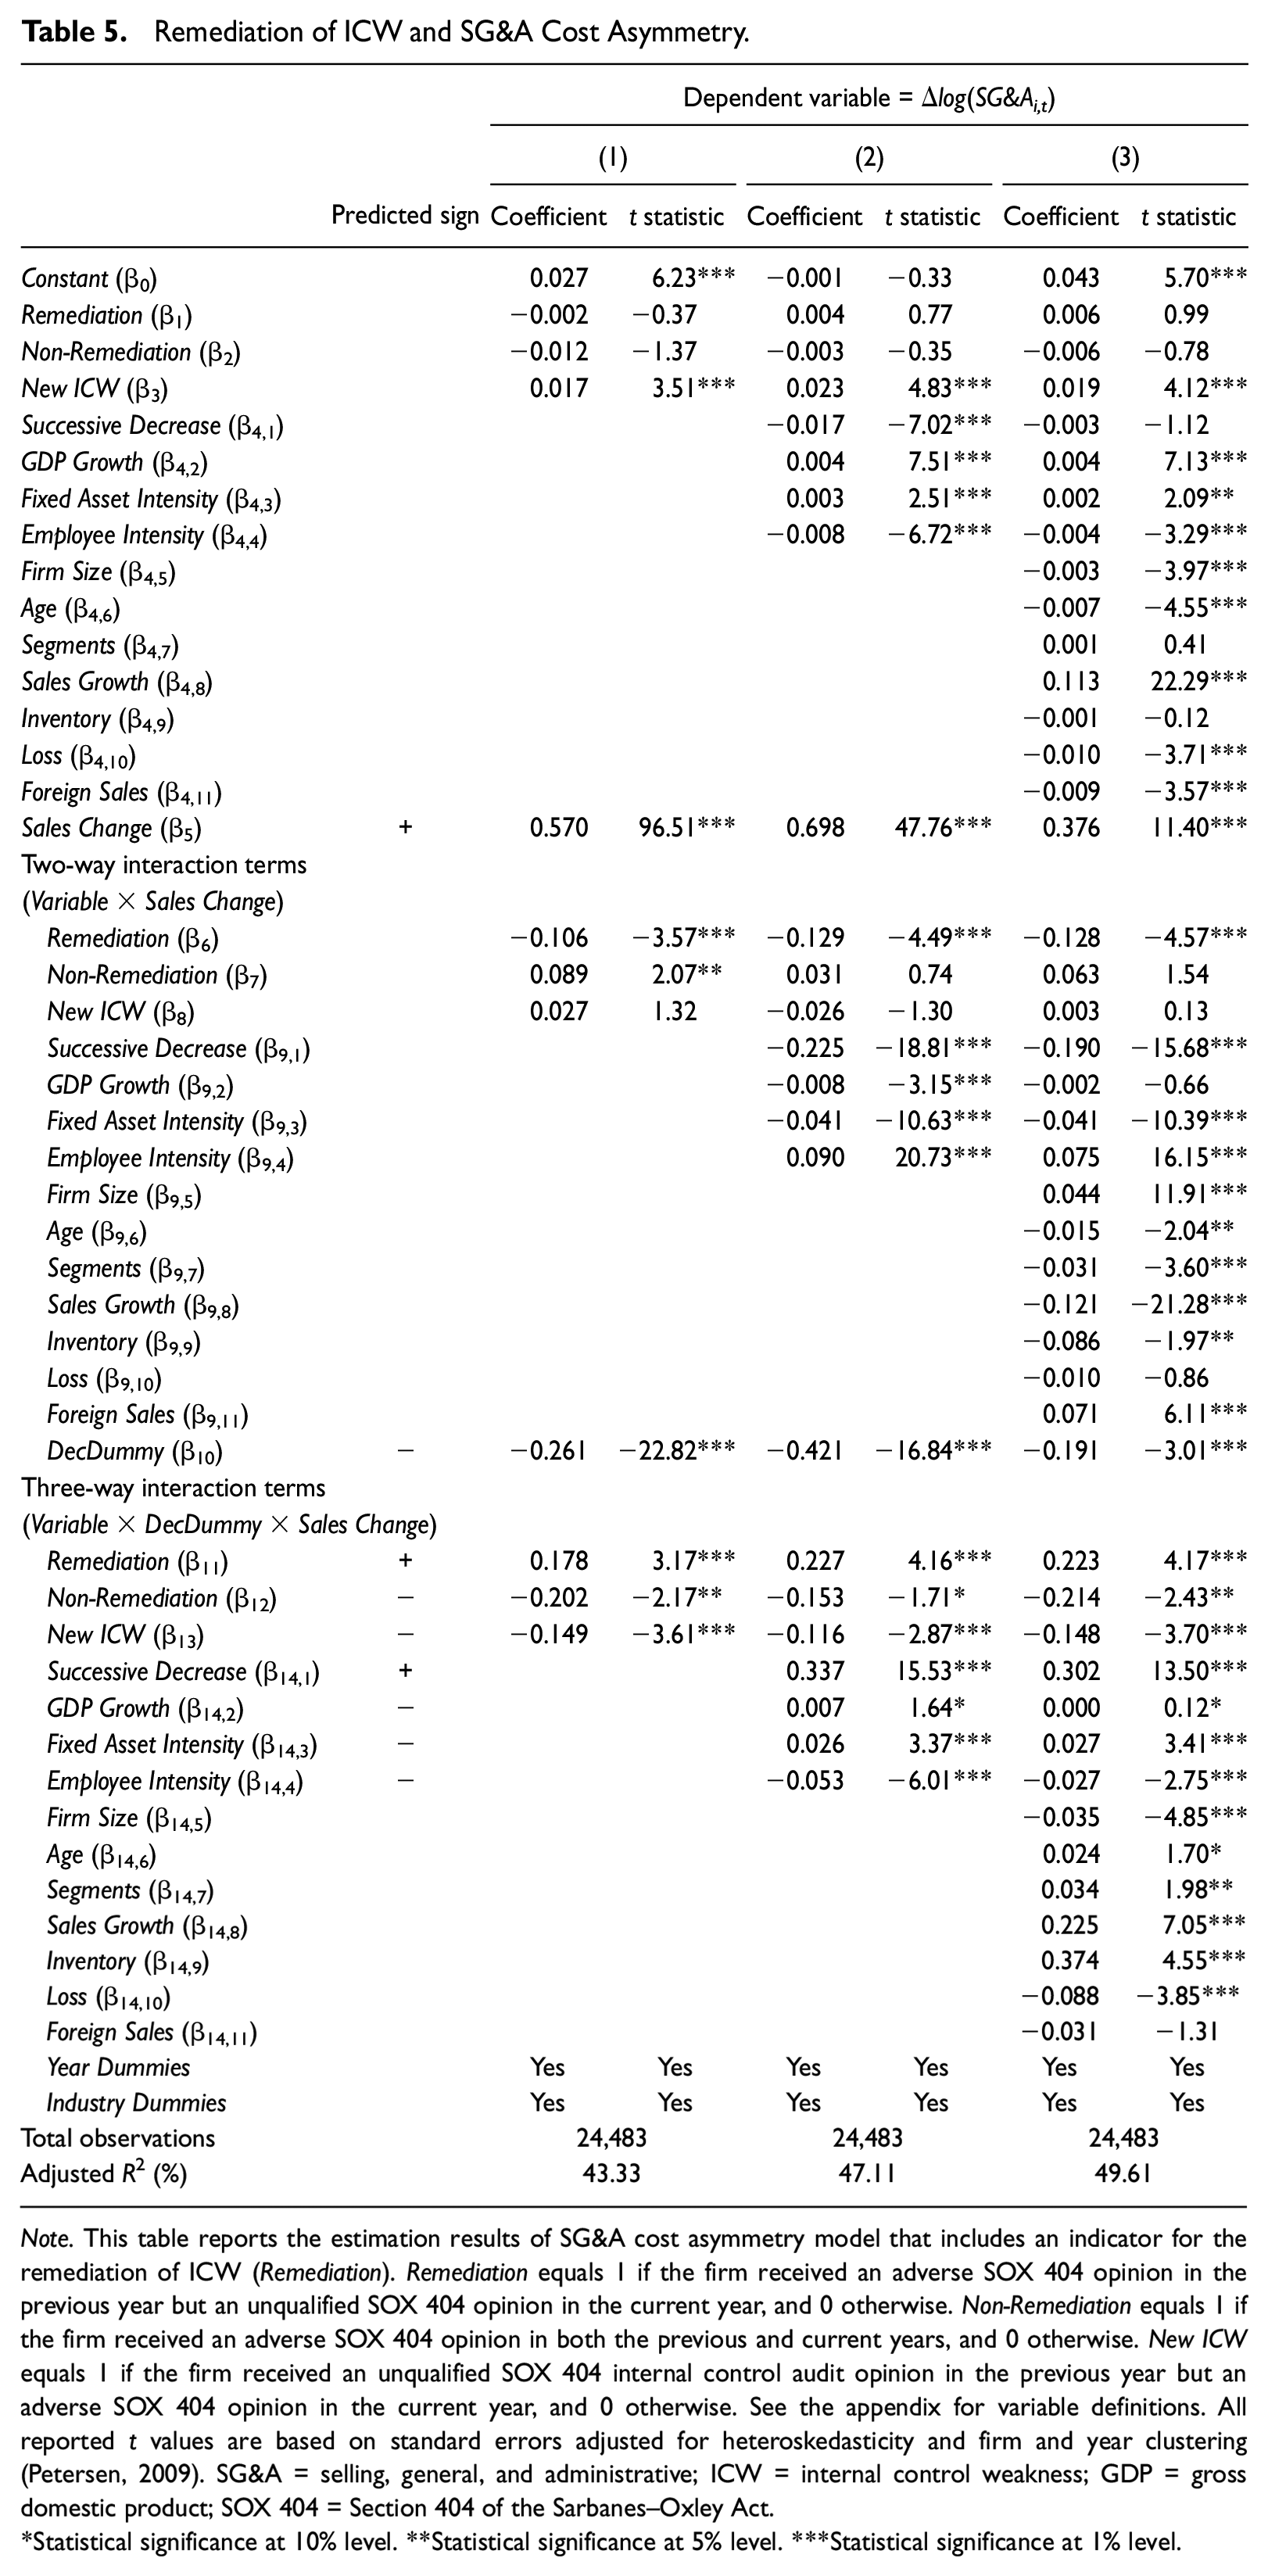
Note. This table reports the estimation results of SG&A cost asymmetry model that includes an indicator for the remediation of ICW (Remediation). Remediation equals 1 if the firm received an adverse SOX 404 opinion in the previous year but an unqualified SOX 404 opinion in the current year, and 0 otherwise. Non-Remediation equals 1 if the firm received an adverse SOX 404 opinion in both the previous and current years, and 0 otherwise. New ICW equals 1 if the firm received an unqualified SOX 404 internal control audit opinion in the previous year but an adverse SOX 404 opinion in the current year, and 0 otherwise. See the appendix for variable definitions. All reported t values are based on standard errors adjusted for heteroskedasticity and firm and year clustering (Petersen, 2009). SG&A = selling, general, and administrative; ICW = internal control weakness; GDP = gross domestic product; SOX 404 = Section 404 of the Sarbanes–Oxley Act.
Statistical significance at 10% level. **Statistical significance at 5% level. ***Statistical significance at 1% level.
As shown in columns 2 and 3, the test results with various control variables added are similar with those without them: The coefficient β11 for remediation firms is significantly positive, whereas the coefficient β12 for nonremediation firms and the coefficient β13 for new ICW firms are both significantly negative. Moreover, the coefficient β11 is significantly greater than the coefficients β12 and β13 (ps < .01 for all cases). Overall, the results for overtime impact of ICW remediation on SG&A cost asymmetry show that the remediation of previously reported ICW problems accelerates the downward adjustment of committed resources in response to sales decrease. This pre- and postremediation analysis buttresses and enriches our results by reconfirming our cross-sectional findings in Tables 3 and 4 in a different but related setting.
Robustness Tests: Controlling for Endogeneity
To ensure that our findings are robust to the endogenous determination of internal control quality, we employ a propensity score matching (PSM) test that addresses potential endogeneity that may arise from self-selection bias (Lennox et al., 2012; Tucker, 2010). We first obtain the predicted likelihood (i.e., propensity score) of ICW incidence by estimating a probit regression of an ICW indicator (ICW) on a set of ICW determinants identified by Ashbaugh-Skaife et al. (2007) and Ashbaugh-Skaife, Collins, Kinney, and LaFond (2009): firm size, firm age, the number of segments, sales growth, inventory holdings, a loss indicator, a foreign sales indicator, and year and industry indicators. 24 We measure all the explanatory variables at the end of year t− 1. Table 6, Panel A, presents the results of the first-stage probit regression.
Robustness Test: PSM Test.
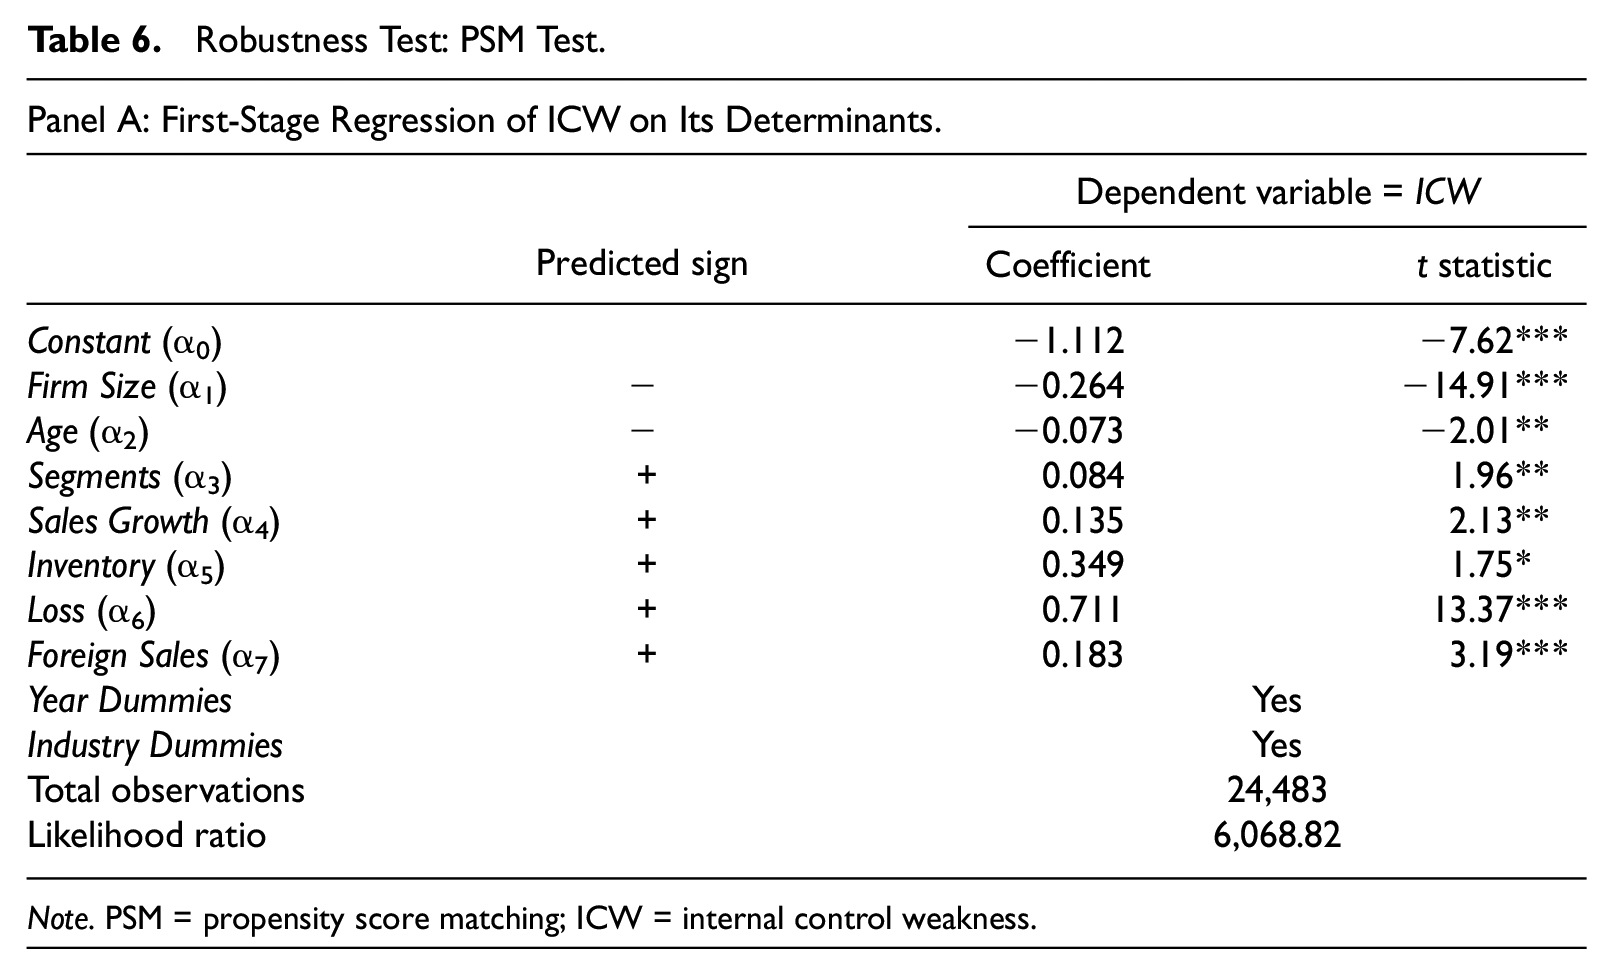
Note. PSM = propensity score matching; ICW = internal control weakness.
Panel B: Mean Differences of the Determinants of ICW After PSM.
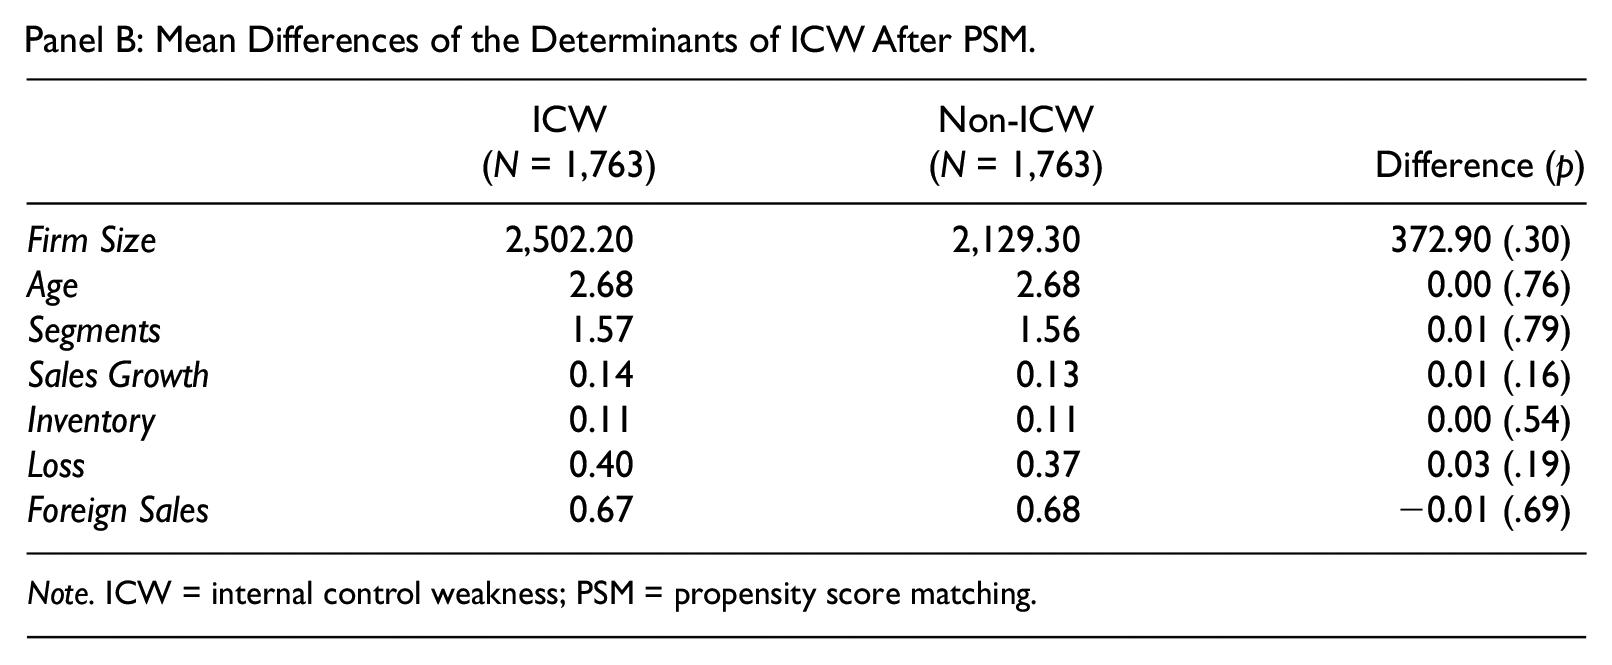
Note. ICW = internal control weakness; PSM = propensity score matching.(continued)
Panel C: Second-Stage SG&A Cost Asymmetry Regressions With the Propensity Score–Matched Sample.
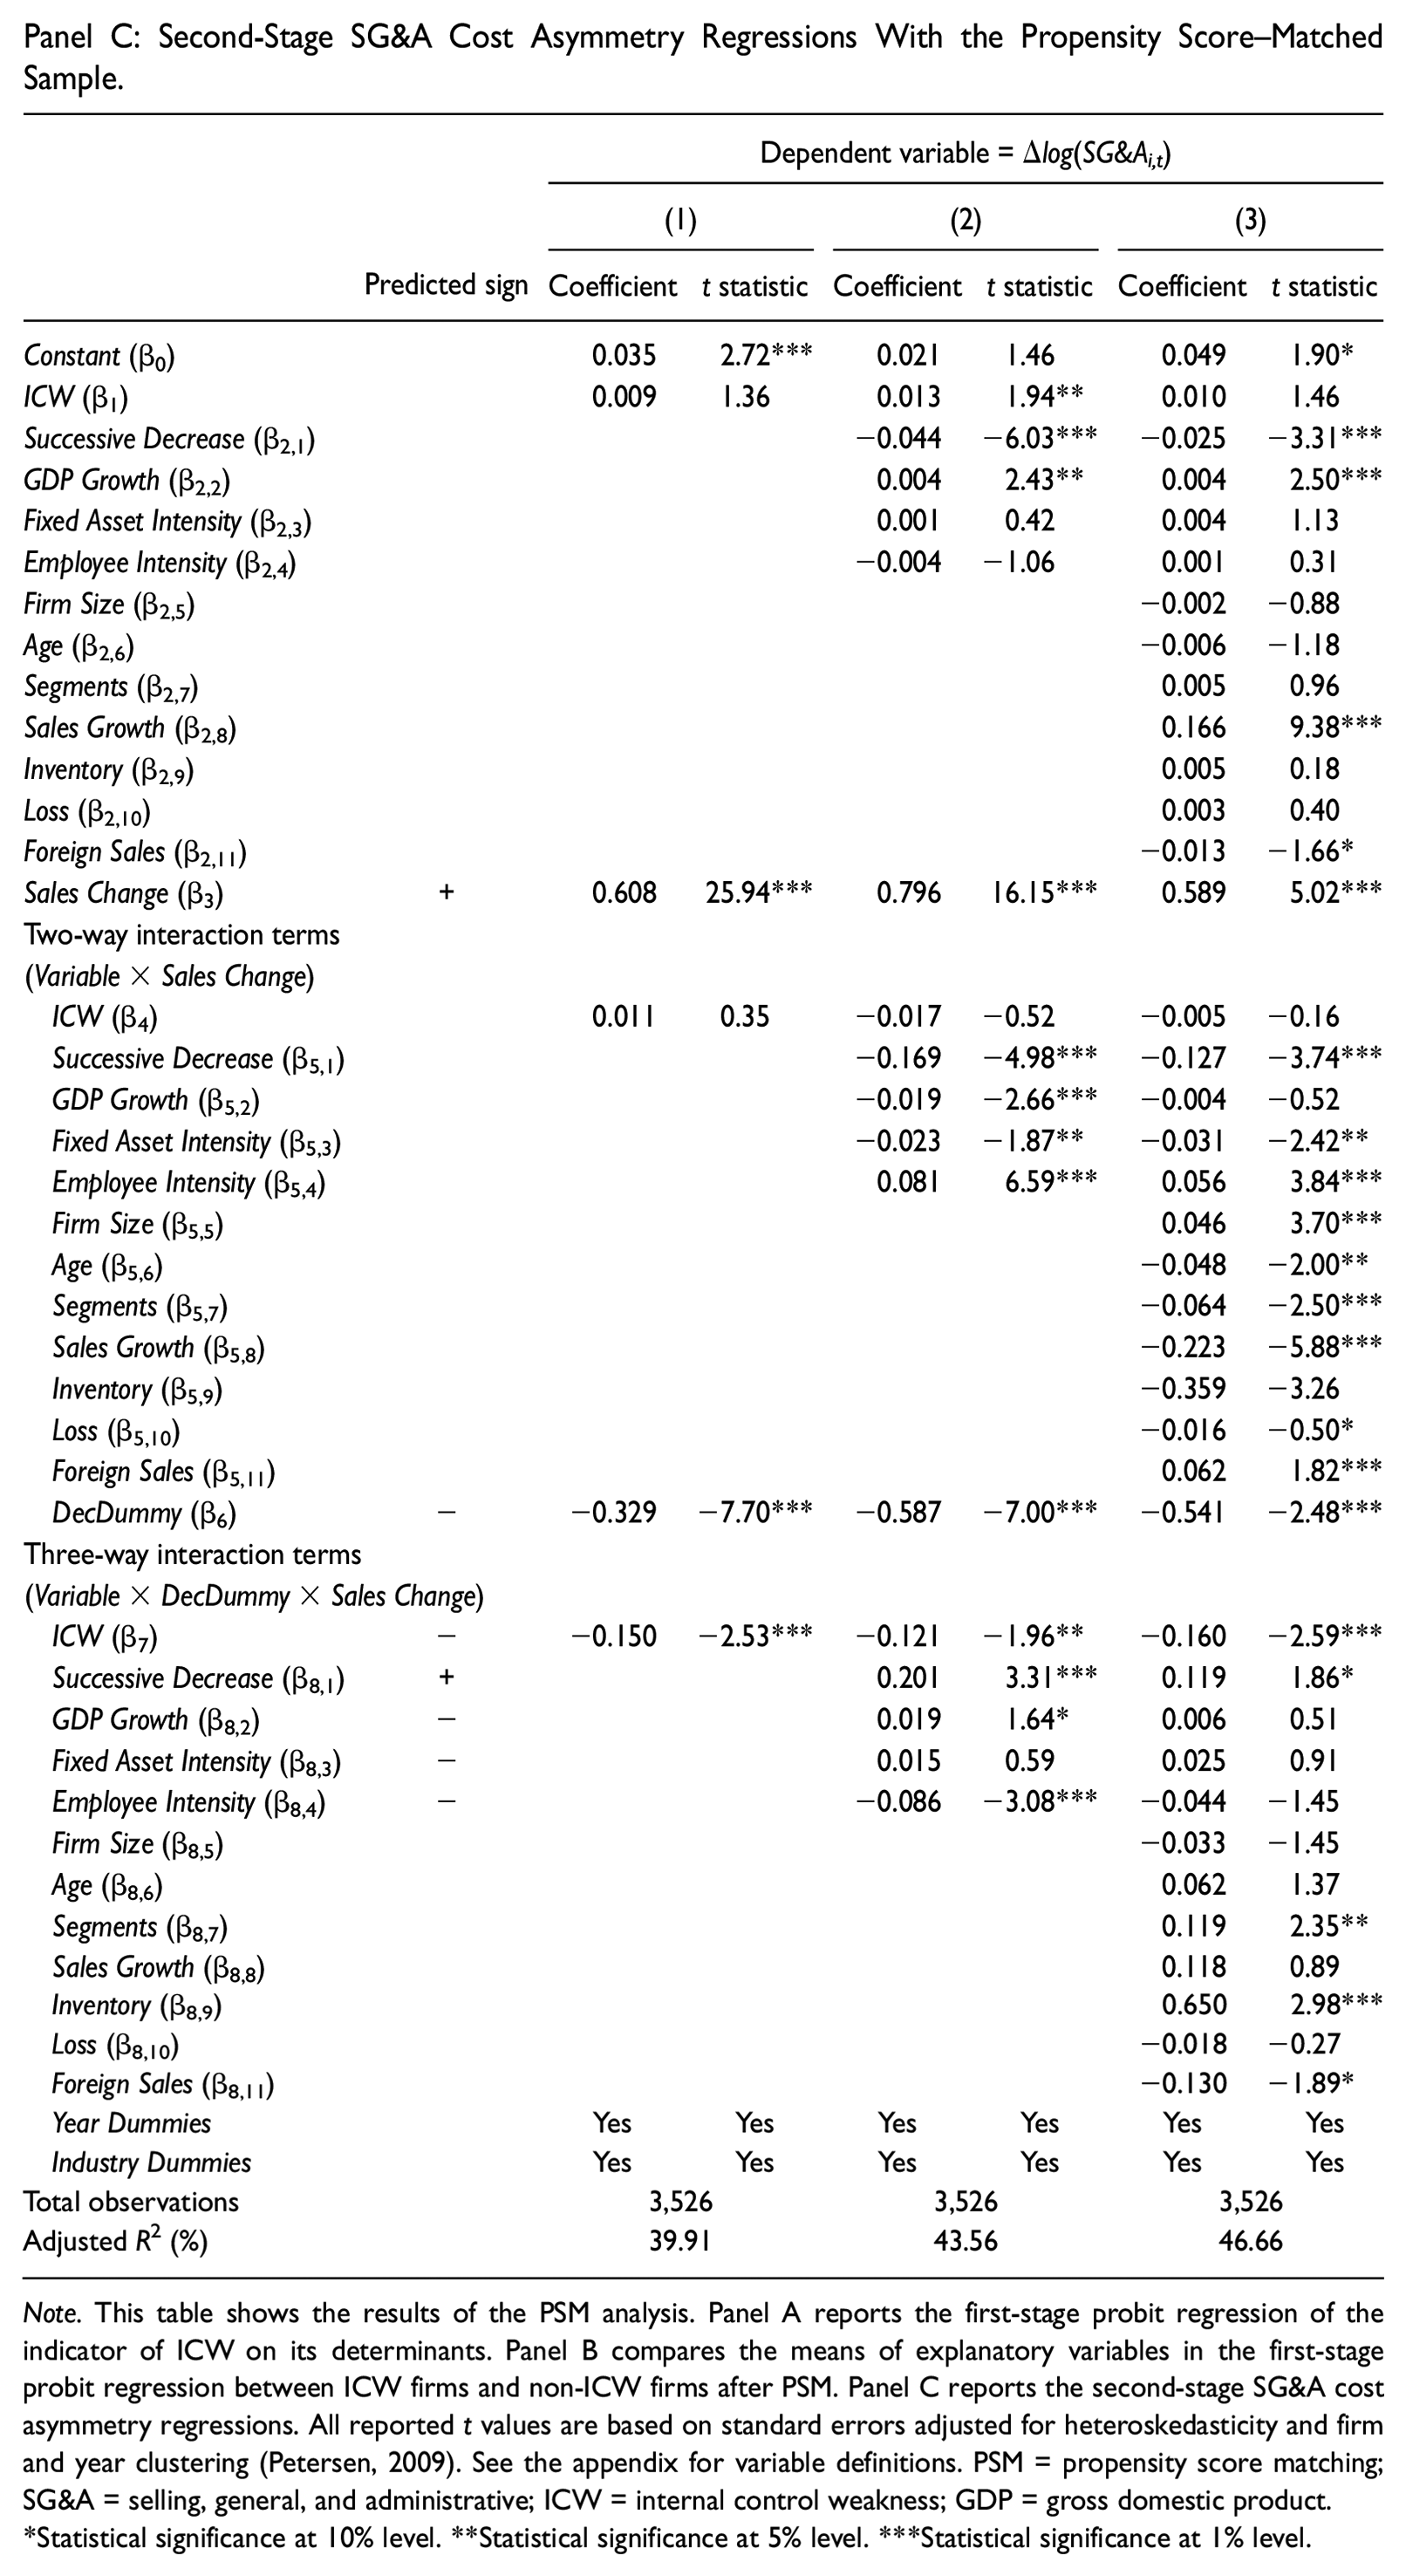
Note. This table shows the results of the PSM analysis. Panel A reports the first-stage probit regression of the indicator of ICW on its determinants. Panel B compares the means of explanatory variables in the first-stage probit regression between ICW firms and non-ICW firms after PSM. Panel C reports the second-stage SG&A cost asymmetry regressions. All reported t values are based on standard errors adjusted for heteroskedasticity and firm and year clustering (Petersen, 2009). See the appendix for variable definitions. PSM = propensity score matching; SG&A = selling, general, and administrative; ICW = internal control weakness; GDP = gross domestic product.
Statistical significance at 10% level. **Statistical significance at 5% level. ***Statistical significance at 1% level.
Using the predicted likelihood or propensity score of ICW incidence, we match each ICW firm to a non-ICW control firm with a maximum 1% of allowable difference in propensity score. 25 In doing so, we also require each ICW firm and its corresponding non-ICW firm to operate in the same two-digit Standard Industrial Classification (SIC) industry in each year. This PSM process controls for not only firm-level ICW determinants but also industry-wide variation in SG&A cost asymmetry (Balakrishnan et al., 2014; Calleja, Steliaros, & Thomas, 2006; Subramaniam & Weidenmier, 2003). The PSM process results in a total of 3,526 firm–year observations: 1,763 observations from ICW firms and 1,763 from non-ICW firms.
Panel B of Table 6 presents the univariate comparison between ICW firms and non-ICW firms after PSM. In the PSM sample, none of the seven ICW determinants in the first-stage regression exhibits a significant difference between the two groups. The results contrast to those in Panel B of Table 2 in which five out of seven ICW determinants have significant differences between ICW firms and non-ICW firms before PSM. Therefore, the covariate balance test confirms the effectiveness of our PSM process.
Using this PSM sample, we reestimate Equation 3. As shown in Panel C of Table 6, the PSM results are qualitatively identical with our main regression results reported earlier in Table 3. Whereas the coefficient on Sales Change (β3) is significantly positive, the coefficient on DecDummy×Sales Change (β6) is significantly negative. More important, the coefficient on the three-way interaction with ICW (β7) remains negative and significant. The results from the PSM test suggest that our primary findings are unlikely to be driven by potential endogeneity associated with the incidence of ICW problems.
Robustness Tests: Firm-Specific Measure of SG&A Cost Asymmetry
Thus far, we have estimated the degree of SG&A cost stickiness using Anderson et al.’s (2003) asymmetric cost behavior model. To check whether our results are sensitive to the measurement of SG&A cost stickiness, we employ the firm-specific measure of SG&A cost asymmetry developed by Weiss (2010). Weiss defines the SG&A cost asymmetry for firm i in quarter q (SG&A_Asymmetryi,q) as the difference in the cost function slope between the two most recent quarters from quarter q− 3 to quarter q, such that sales decrease in one quarter and sales increase in the other.

where
Table 7 shows the results for the effect of ICW on firm-specific SG&A cost asymmetry. 27 Column 1 presents the coefficient estimates from OLS regressions of SG&A_Asymmetryi,t on ICWi,t and control variables. The coefficient on ICW (β1) is negative and significant at the 10% level. This result is consistent with our H1, suggesting that SG&A cost stickiness is more pronounced for ICW firms than for non-ICW firms.
Robustness Test: Firm-Specific Measure of SG&A Cost Asymmetry.
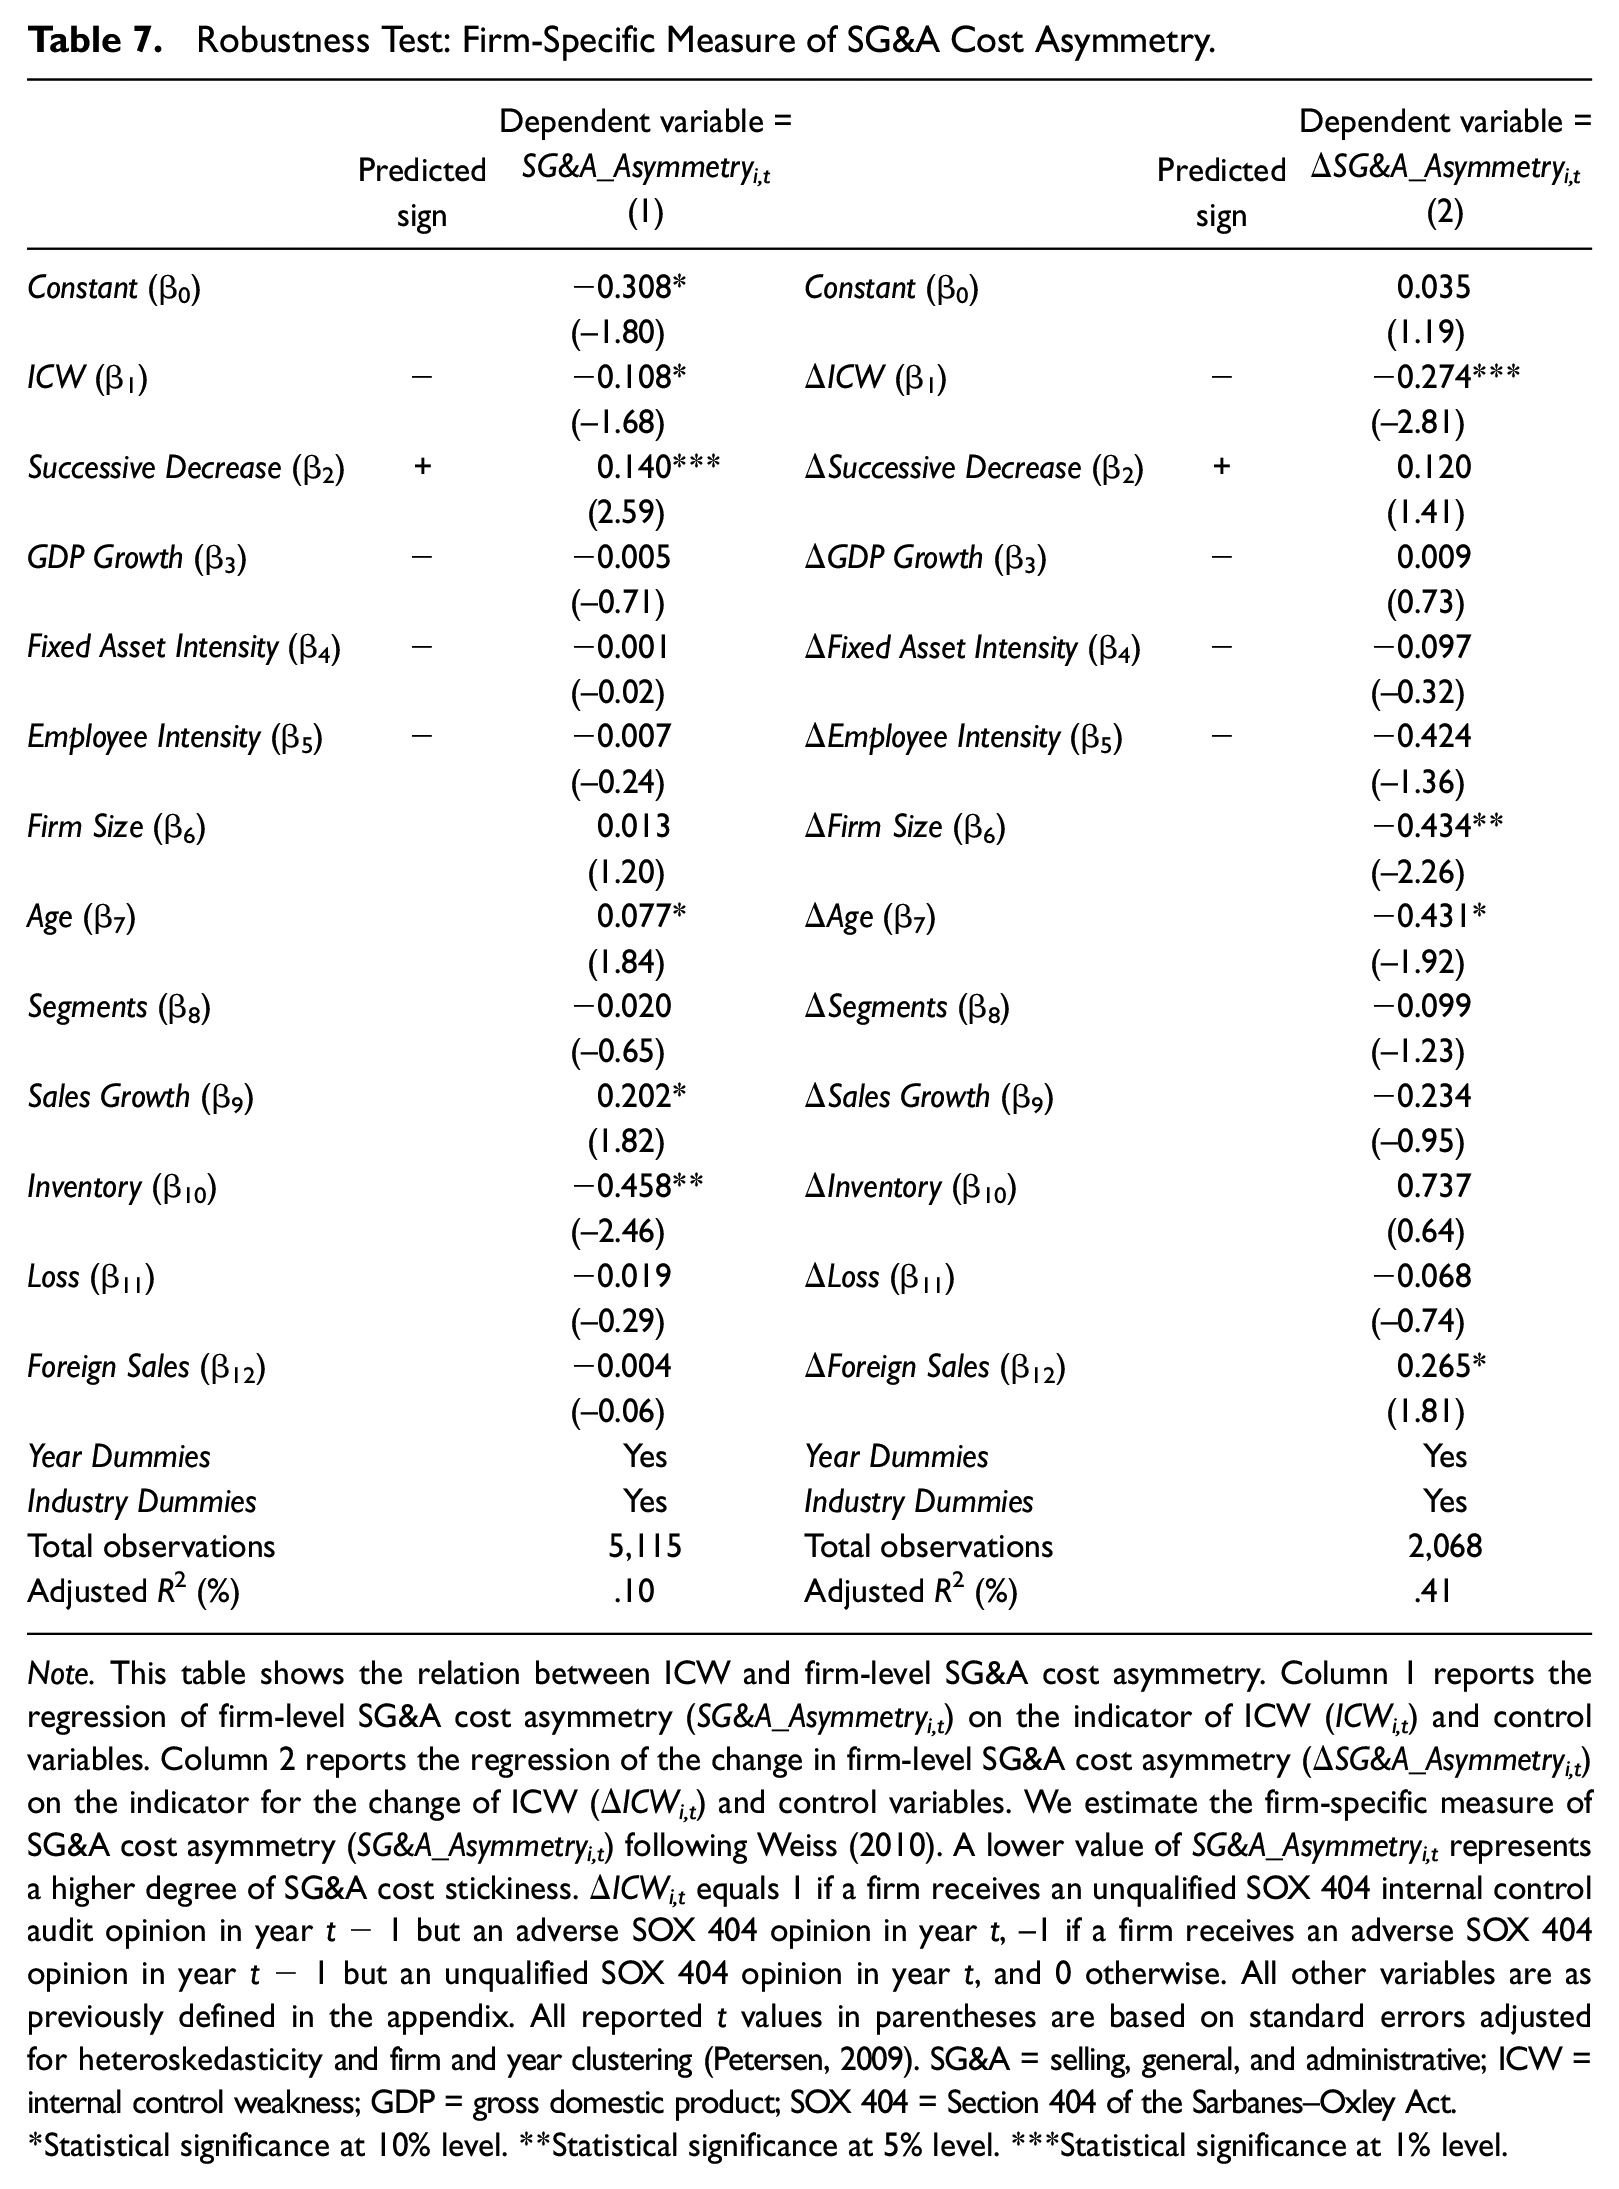
Note. This table shows the relation between ICW and firm-level SG&A cost asymmetry. Column 1 reports the regression of firm-level SG&A cost asymmetry (SG&A_Asymmetryi,t) on the indicator of ICW (ICWi,t) and control variables. Column 2 reports the regression of the change in firm-level SG&A cost asymmetry (ΔSG&A_Asymmetryi,t) on the indicator for the change of ICW (ΔICWi,t) and control variables. We estimate the firm-specific measure of SG&A cost asymmetry (SG&A_Asymmetryi,t) following Weiss (2010). A lower value of SG&A_Asymmetryi,t represents a higher degree of SG&A cost stickiness. ΔICWi,t equals 1 if a firm receives an unqualified SOX 404 internal control audit opinion in year t− 1 but an adverse SOX 404 opinion in year t, –1 if a firm receives an adverse SOX 404 opinion in year t− 1 but an unqualified SOX 404 opinion in year t, and 0 otherwise. All other variables are as previously defined in the appendix. All reported t values in parentheses are based on standard errors adjusted for heteroskedasticity and firm and year clustering (Petersen, 2009). SG&A = selling, general, and administrative; ICW = internal control weakness; GDP = gross domestic product; SOX 404 = Section 404 of the Sarbanes–Oxley Act.
Statistical significance at 10% level. **Statistical significance at 5% level. ***Statistical significance at 1% level.
Column 2 of Table 7 displays the results from OLS regressions of ΔSG&A_Asymmetryi,t on ΔICWi,t and changes in control variables from year t− 1 to year t. The use of the change specification helps us alleviate concerns about potential problems arising from correlated omitted variables and endogeneity (Bradshaw, Bushee, & Miller, 2006). The coefficient on ΔICW (β1) is negative and highly significant at the 1% level. This result suggests that the change in firm-level SG&A cost stickiness is inversely associated with the change in internal control quality. The significant effect of the deteriorating internal control quality on increasing the level of SG&A cost asymmetry lends further support for the view that managers in ICW firms make less timely downward adjustment of committed resources in response to sales decrease because they rely on poor-quality internal managerial reports generated under ineffective internal controls.
Conclusion
Previous research on internal control effectiveness over financial reporting has focused mainly on the internal control problems from the perspective of external users of accounting information such as investors and creditors, and has paid less attention to the economic consequences of internal control problems from the perspective of internal users. As a result, little is known about the impact of ICW on the cost side of business operation. Our study attempts to fill this void by investigating the relation between a firm’s internal control quality and the extent of SG&A cost stickiness or asymmetry. We are motivated to study the impact of ICW on managers’ resource allocation decisions in relation to SG&A expenditures because, first, managers can exercise more discretion over SG&A costs than other costs (e.g., cost of goods sold) in making resource commitment decisions and, second, SG&A costs account, on average, for about 26% of total sales, and thus, are a significant factor determining corporate earnings. To the best of our knowledge, our study is the first to examine whether and how internal control quality is linked to the degree of SG&A cost asymmetry.
Our results, using a sample of firms with SOX 404 disclosures, reveal the following. First, we find that SG&A cost asymmetry is greater for ICW firms than for non-ICW firms. ICW firms exhibit only a 0.19% decrease in SG&A costs per 1% decrease in sales revenue, whereas non-ICW firms exhibit a 0.31% decrease in SG&A costs per 1% decrease in sales revenue. We also find that the stickier SG&A costs in ICW firms are primarily attributable to internal information control problems rather than to other control problems. The above findings are in line with the view that managers in ICW firms make less timely decisions on the adjustment of SG&A resources because they use poor-quality internal managerial reports generated under ineffective internal controls. In addition, we find that the effect of ICW on SG&A cost asymmetry weakens significantly after firms remediate previously reported ICW. Our results are robust to controlling for the potential influence of omitted variables, applying the propensity score–matched sample test, and using an alternative firm-specific measure of SG&A cost asymmetry.
In conclusion, our results suggest that internal control quality is an important factor that determines the behavior of SG&A costs. We also document a hitherto unrecognized benefit of SOX 404 by showing that effective internal controls and/or remediation of previously reported ICW problems reduce the degree of SG&A cost asymmetry by facilitating timely adjustment of committed resources. Overall, our results are consistent with the prediction of the real options theory, in that, poor-quality internal information associated with ICW incents managers to postpone downward adjustments of SG&A resources until the information uncertainty is resolved to a certain extent. Given the scarcity of empirical evidence on the relation between internal information quality and cost management efficiency from the internal user’s perspective, we recommend further research on the issue.
Footnotes
Appendix
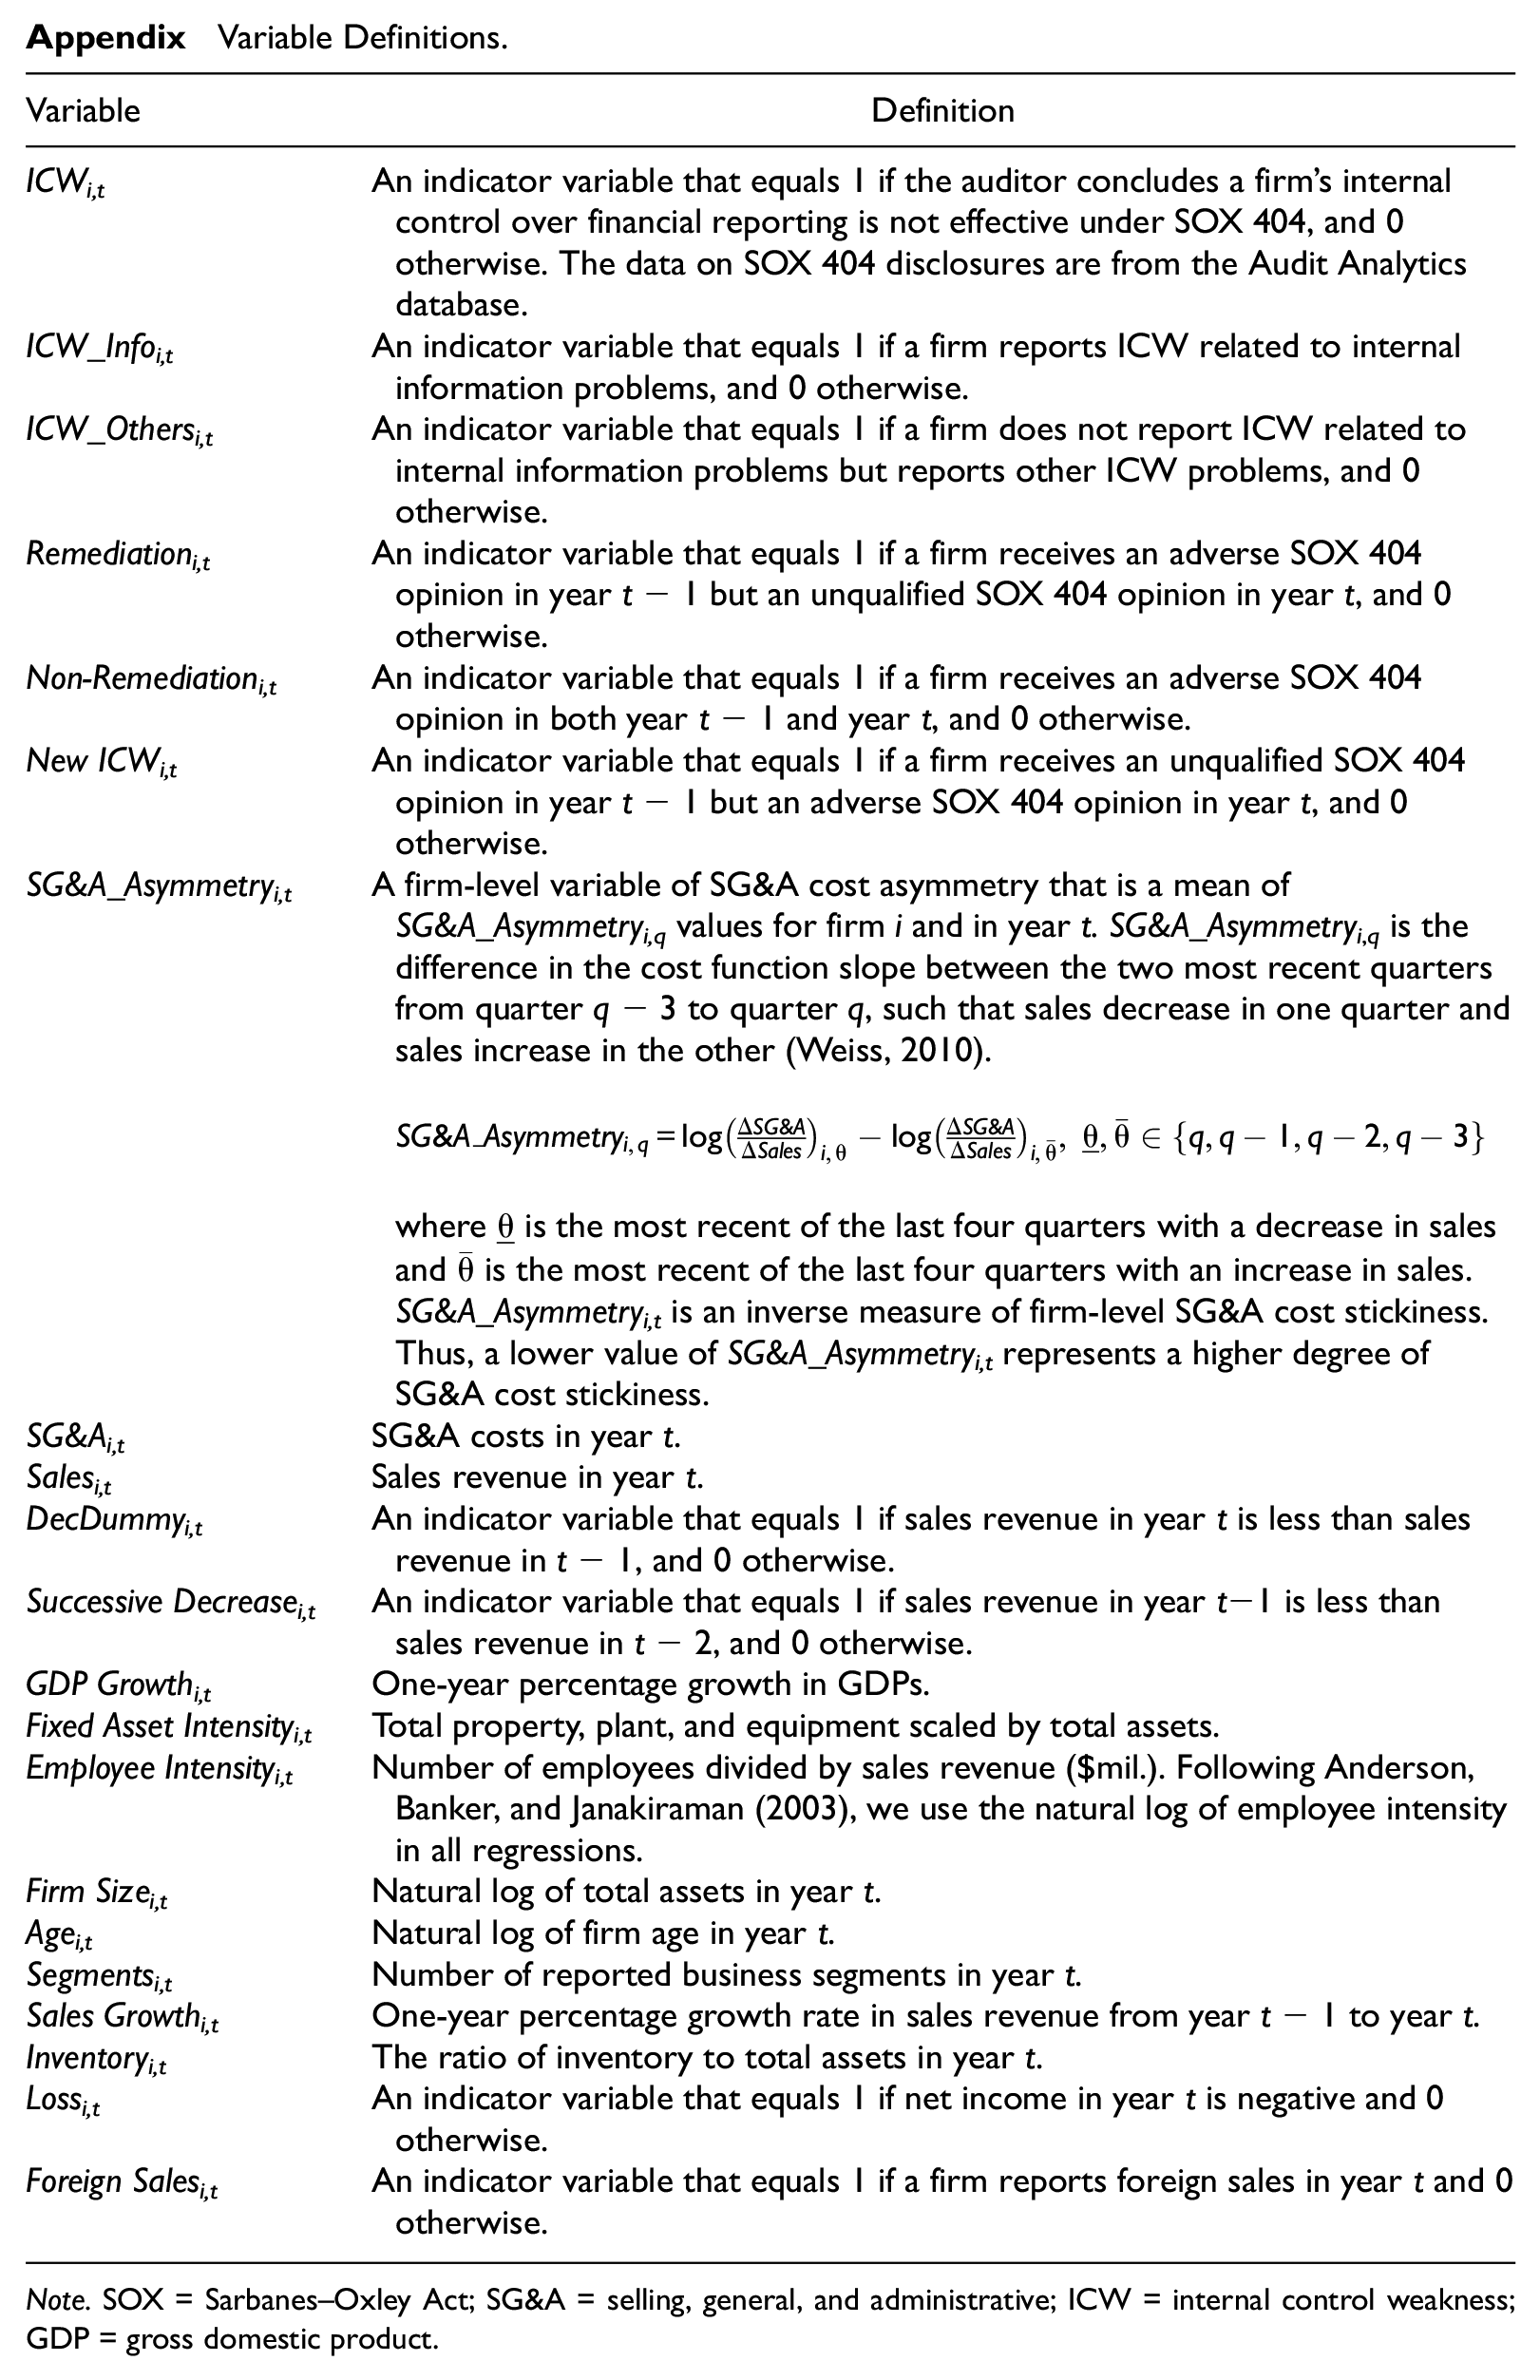
Variable Definitions.
| Variable | Definition |
|---|---|
| ICWi,t | An indicator variable that equals 1 if the auditor concludes a firm’s internal control over financial reporting is not effective under SOX 404, and 0 otherwise. The data on SOX 404 disclosures are from the Audit Analytics database. |
| ICW_Infoi,t | An indicator variable that equals 1 if a firm reports ICW related to internal information problems, and 0 otherwise. |
| ICW_Othersi,t | An indicator variable that equals 1 if a firm does not report ICW related to internal information problems but reports other ICW problems, and 0 otherwise. |
| Remediationi,t | An indicator variable that equals 1 if a firm receives an adverse SOX 404 opinion in year t− 1 but an unqualified SOX 404 opinion in year t, and 0 otherwise. |
| Non-Remediationi,t | An indicator variable that equals 1 if a firm receives an adverse SOX 404 opinion in both year t− 1 and year t, and 0 otherwise. |
| New ICWi,t | An indicator variable that equals 1 if a firm receives an unqualified SOX 404 opinion in year t− 1 but an adverse SOX 404 opinion in year t, and 0 otherwise. |
| SG&A_Asymmetryi,t | A firm-level variable of SG&A cost asymmetry that is a mean of SG&A_Asymmetryi,q values for firm i and in year t. SG&A_Asymmetryi,q is the difference in the cost function slope between the two most recent quarters from quarter q− 3 to quarter q, such that sales decrease in one quarter and sales increase in the other (Weiss, 2010). where is the most recent of the last four quarters with a decrease in sales and is the most recent of the last four quarters with an increase in sales. SG&A_Asymmetryi,t is an inverse measure of firm-level SG&A cost stickiness. Thus, a lower value of SG&A_Asymmetryi,t represents a higher degree of SG&A cost stickiness. |
| SG&Ai,t | SG&A costs in year t. |
| Salesi,t | Sales revenue in year t. |
| DecDummyi,t | An indicator variable that equals 1 if sales revenue in year t is less than sales revenue in t− 1, and 0 otherwise. |
| Successive Decreasei,t | An indicator variable that equals 1 if sales revenue in year t−1 is less than sales revenue in t− 2, and 0 otherwise. |
| GDP Growthi,t | One-year percentage growth in GDPs. |
| Fixed Asset Intensityi,t | Total property, plant, and equipment scaled by total assets. |
| Employee Intensityi,t | Number of employees divided by sales revenue ($mil.). Following Anderson, Banker, and Janakiraman (2003), we use the natural log of employee intensity in all regressions. |
| Firm Sizei,t | Natural log of total assets in year t. |
| Agei,t | Natural log of firm age in year t. |
| Segmentsi,t | Number of reported business segments in year t. |
| Sales Growthi,t | One-year percentage growth rate in sales revenue from year t− 1 to year t. |
| Inventoryi,t | The ratio of inventory to total assets in year t. |
| Lossi,t | An indicator variable that equals 1 if net income in year t is negative and 0 otherwise. |
| Foreign Salesi,t | An indicator variable that equals 1 if a firm reports foreign sales in year t and 0 otherwise. |
Note. SOX = Sarbanes–Oxley Act; SG&A = selling, general, and administrative; ICW = internal control weakness; GDP = gross domestic product.
Acknowledgements
We thank Bharat Sarath (editor); Kannan Raghunandan (associate editor); an anonymous referee; Jim Cannon; Ivo Jansen; Kyonghee Kim; Natalia Kochetova-Kozloski; Feng Liu; Sarah McVay; Gord Richardson; Liu Zheng; seminar participants at City University of Hong Kong, Fudan University, Hong Kong Baptist University, Old Dominion University, University of Macau, University of Massachusetts Boston, University of South Florida, University of Waterloo, and Xiamen University; and conference participants at the 2012 AAA Annual Meeting, the 2012 AAA Mid-Atlantic Meeting, the 2013 CAAA Annual Conference, and the 2013 Korean Accounting Association Summer International Conference.
Declaration of Conflicting Interests
The author(s) declared no potential conflicts of interest with respect to the research, authorship, and/or publication of this article.
Funding
The author(s) received no financial support for the research, authorship, and/or publication of this article.