
Abstract
We use the staggered introduction of a major financial-reporting regulation worldwide to study whether firms make financing decisions consistent with the pecking order theory. Exploiting cross-country and within country-year variation, we document that treated firms increase their issuance of external financing (and ultimately increase investment) after the new regime. Furthermore, firms make different leverage decisions (debt vs equity) around the new regulation depending on their ex-ante debt capacity, which allows them to adjust their capital structure. Our findings highlight the importance of the pecking order theory in explaining financing as well as investment policies.
Keywords
Introduction
There is an intense theoretical and empirical debate in financial economics about the determinants of firms’ capital structure decisions. Much of this debate revolves around the pecking order theory proposed by Myers and Majluf (1984). Specifically, prior studies investigate—and find mixed evidence on—whether a firm’s capital structure choices depend on the extent of information asymmetry between the firm and investors. 1 Part of the challenge in testing predictions from the pecking order theory is the difficulty in obtaining exogenous variation in information asymmetry in order to isolate the effect of asymmetry on financing decisions. Bharath et al. (2009) attempt to address this issue using firm-level measures of adverse selection, such as bid-ask spread and the probability of informed trading. However, as Garmaise and Natividad (2010) note, “Credible exogenous information proxies are hard to find, and there are relatively few natural experiments that result in significant shifts in the information environment” (p. 1).
We address this challenge using the staggered introduction of International Financial Reporting Standards (hereafter “IFRS”) around the world as a plausibly exogenous shock to the information asymmetry of individual companies, and study whether these companies’ financing and investment decisions are consistent with predictions of the pecking order theory. The introduction of IFRS is one of the most significant regulatory changes in accounting history. Prior research shows that IFRS is associated with improved corporate transparency and enhanced comparability of financial statements. This, in turn, has led to a reduction in information asymmetry—a necessary condition for the development of the predictions that we validate in our sample. 2 In addition, IFRS is determined at the country level and is therefore less likely to reflect the endogenous preferences of a single firm. 3 Although firms in certain jurisdictions could voluntarily adopt IFRS before it becomes mandatory, voluntary adoption is uncommon in most countries (Daske et al., 2013). One explanation for this is that firms that adopt IFRS voluntarily would fail to achieve one of the main expected benefits of the regime: the externalities arising from an increase in comparability (DeFond et al., 2011). Furthermore, we know of no empirical evidence that IFRS systematically affects other determinants of capital structure, such as tax rates, financial distress, or market timing. These features allow us to focus on predictions from the pecking order theory (although we do control for factors capturing other theories in our empirical tests). 4
In our first set of tests, we study the impact of IFRS on external financing. The pecking order theory predicts that information asymmetry between managers and (new) investors creates adverse selection costs, which lead firms to pass up profitable investment opportunities that require external capital. The key intuition is that, as managers have an information advantage over outside investors, they are more inclined to raise external financing when they believe outside investors are overvaluing the company’s stock. Investors, however, anticipate this behavior and respond to an equity issuance (and, to a lesser extent, a debt issuance) by discounting the stock (debt) price. Therefore, information asymmetry leads to adverse selection costs that make external financing less attractive and, in equilibrium, cause firms in need of external capital to pass up profitable investment opportunities. To the extent that the new regulation reduces information asymmetry between managers and investors, the regulation should ease access to external financing for IFRS-adopting firms.
To test this prediction, we use two different methodologies. First, we conduct standard cross-country tests, where we benchmark IFRS adopters to a control sample of non-IFRS adopters. Second, to improve our identification, we conduct within-country tests, where we compare financially constrained firms (treated) to nonfinancially constrained firms (control) in the same country. We expect that the regulation will disproportionately ease access to external financing for financially constrained firms. These firms should benefit more from a reduction in information asymmetry and be more inclined to seek external financing and fund investment opportunities, relative to firms that were unconstrained and well-positioned to finance positive NPV projects prior to the new regime.
Our cross-country tests compare firms from 32 countries that adopted IFRS from 2003 through 2012 to firms from six countries that did not adopt IFRS during that period. Our sample consists of countries that adopted the new standard early, such as Singapore (2003) and the European Union (2005), as well as ones that adopted it later, such as Brazil, Canada, China, Russia, and South Korea. We then exploit within country-year variation in external financing needs among the 32 IFRS-adopting countries, based on firms’ financing frictions before the regulation, and estimate difference-in-difference (“DiD” henceforth) specifications using country-year fixed effects. This methodology controls for alternative factors that could influence financing decisions across countries and times (e.g., differences in financial market integration, economic development, and tax rates, etc.). We proxy for ex-ante financing frictions using the Whited and Wu (2006) and Hadlock and Pierce (2010) financial constraint indexes, as well as a combined measure of financial constraints that is based on those indexes.
Using our cross-country specification, we document a 2.9%–3.3% increase in the probability of raising external financing for IFRS adopters relative to non-IFRS adopters following the introduction of the new regime. Using our within-country specification, we document a 2.7%–3.1% increase in the yearly probability of raising external financing after the new regulation for constrained firms relative to unconstrained firms, a change of about 9%–11% relative to preadoption financing levels. These findings are robust to controlling for numerous variables related to other determinants of financing decisions (e.g., distress risk, investment opportunities, market timing, etc.), as well as to country-year and firm-fixed effects. 5 This result provides initial evidence that is consistent with our prediction that IFRS adoption reduces adverse selection costs and allows treated firms to increase their use of external financing.
We then follow Bertrand and Mullainathan (2003) and allow for a nonlinear (yearly) effect for treated and control firms around the mandate. The idea behind the test is that, if the parallel trends assumption is satisfied, then the increase in external financing among treated firms will begin with the introduction of the new regulation, with no noticeable difference in the use of external financing during the “pre” period. That is exactly what we find. The trends in financing decisions in treated and control firms are identical before the mandate. Different financing patterns start in the year of the adoption and peak in the year subsequent to the new regime.6,7
Next, we turn to the regulation’s implications for capital structure. Specifically, we test whether firms change their leverage depending on their financing capacity (Myers, 1984 terms this prediction the “modified pecking order”; see also Lemmon & Zender, 2010 for a recent test of this argument). The idea is that firms will raise external financing first in the form of debt and then, as the cost of raising additional debt increases (i.e., when debt capacity has been reached), in the form of equity capital. Therefore, adopting firms with debt capacity will issue more debt and increase leverage, while adopting firms without debt capacity will issue more equity and decrease leverage, after the new regime begins.
We test this prediction by focusing on the treatment sample (financially constrained firms) and exploiting variation in proxies for a firm’s existing debt capacity at the adoption of the new regime. Using leverage regressions with firm- and country-year fixed effects, we find that firms with debt capacity increase leverage after the adoption of IFRS, while those without debt capacity decrease leverage. Treatment firms in the top quartile of debt capacity decrease their market leverage by 2 percentage points relative to treatment firms in the bottom quartile of debt capacity. This is economically important, relative to an average leverage ratio of 18.87% for the treatment sample in the preadoption period. 8
Finally, we study the implications of our findings for investment decisions. The pecking order theory holds that adverse selection costs lead financially constrained firms to pass up profitable investment opportunities. If this is the case, then a reduction in information asymmetry should allow financially constrained firms to increase both external financing (as we show above) and investment. Consistent with this prediction, in the postregulation period, investment by financially constrained firms increases by 2.8%–3.8%, which translates to a 9%–12% relative increase over pre-IFRS levels. In addition, financially constrained firms become more responsive to growth opportunities, reinforcing the idea that the increase in investment is due to an improvement in investment efficiency. These findings complement our evidence on financing activities and are consistent with the new regulation allowing constrained firms to increase investment.
It is important to note that we use the adoption of IFRS as a setting in which a new regulation substantially alters the information environment of the adopting firms. We refer to the new regulation broadly, and use “IFRS adoption” to describe not only the new set of standards but also their supporting infrastructure, such as enforcement efforts by regulators to increase compliance with the standards. Although the debate over which factors drive the economic consequences of IFRS adoption and implementation is important (see, e.g., Barth & Israeli, 2013; Christensen et al., 2013), the key feature, for our purposes, is that these channels lead to a reduction in adverse selection costs. Nevertheless, we provide evidence that the impact of IFRS on external financing is stronger in high enforcement countries, consistent with Christensen et al. (2013). We find only modest evidence of an incremental effect of distance of IFRS to local GAAP and foreign direct investments (FDI). 9
Our study contributes to the debate about the extent to which information asymmetry influences financing, as predicted by the pecking order theory. The finance literature disagrees about the importance of this theory and arrives at mixed conclusions about its usefulness (Bharath et al., 2009; Fama & French, 2002, 2005; Leary & Roberts, 2010; Shyam-Sunder & Myers, 1999 among many others). An important challenge in testing the pecking order theory is to obtain exogenous variation in information asymmetry in order to isolate its effects on financing decisions (Garmaise & Natividad, 2010). We use the introduction of IFRS as a financial-reporting regulatory change that shocked the information environment of adopting firms in general and financially constrained firms in particular, and show that financially constrained firms make financing and investment decisions that are consistent with predictions from the pecking order theory.
Our study also contributes to the literature on the role of regulation in financing decisions. We provide evidence that a financial-reporting regulation can have an important effect on financing decisions around the world. To date, the international literature on the implications of major global reforms for financing decisions has mostly centered on creditor control rights (e.g., La Porta et al., 1997, 1998) or market liberalization (see Bekaert & Harvey, 2000; Henry, 2000). 10 In contrast, we focus on a major financial-reporting regulatory reform, whose primary purpose is to reduce information asymmetry among market participants. Our results add to the literature by suggesting that financial-reporting reforms can significantly influence financing decisions, resulting in higher investment by financially constrained firms.
The remainder of the article is organized as follows: Section “Sample” describes our sample and presents descriptive statistics. Section “Research Design” describes our research design. Section “Main Results” presents the results for external financing. Section “Leverage Implications” presents the results for leverage. Section “Investment Implications” presents analyses on investment, and section “Conclusion” concludes.
Sample
Our sample ranges from 2001 through 2013 and consists of firms from countries that adopted IFRS from 2003 through 2012. For our cross-country tests, we also have a control sample of firms from nonadopting countries. We exclude firms that voluntarily reported under IFRS before the mandate, as well as cross-listed firms that already reported under international accounting standards. This allows us to focus on firms that were required to comply with the new regulation for the first time. A country is included if it averages at least 10 observations per year. We exclude financial firms and utilities (ICB codes 7000 and 8000). To mitigate the influence of small firms, we exclude firms with a market value of less than US$1 million or with negative equity. We winsorize all continuous variables at the 1% and 99% levels to limit the influence of outliers. Each firm is required to have available price data from Datastream and the necessary financial accounting data from Worldscope. Following Daske et al. (2008), we consider firms from countries that adopted IFRS but have a non-December fiscal year end as adopting IFRS in the following year. Finally, we limit the preadoption and postadoption period to a maximum of 4 years to avoid confounding effects.
Table 1 presents descriptive statistics for the countries in our sample. For each country, the table includes the number of firms, the number of firm-years, the number of firm-years preadoption and postadoption, whether the country experiences concurrent changes in enforcement according to Christensen et al. (2013), the degrees of change in the accounting standards based on Bae et al. (2008), and the IFRS adoption year. Panel A presents the sample of adopting countries. It consists of 39,922 firm-year observations from 32 adopting countries, and includes developed economies (e.g., Australia, France, Germany, the United Kingdom, and Singapore) as well as growing ones (e.g., Brazil, China, and Hong Kong). Firms from one country (Singapore) adopted the new regulation in 2003, firms from 19 countries adopted it in 2005, and firms from 12 countries adopted it after 2005 (e.g., Brazil, Canada, China, Russia, and South Korea, among others). Panel B presents the sample of nonadopting countries. This total sample consists of 58,192 firm-year observations from six nonadopting countries, and includes developed economies (e.g., Japan and United States) as well as growing ones (e.g., India and Thailand).
Descriptive Statistics by Country.

Note. The table reports descriptive statistics for each country in our sample. Panel A presents results for IFRS-adopting countries. The sample consists of 39,922 firm-year observations from 2001 through 2013, from 32 countries that adopted IFRS from 2003 through 2012. ΔEnforcement is an indicator variable that equals one if there were concurrent changes in enforcement according to Christensen et al. (2013). Change in GAAP is the degree of change in the accounting standards based on the Bae et al. (2008) measure. Panel B present the results for nonadopting countries. This sample consists of 58,192 observations from 6 countries from 2001 through 2013. A country is included if it has an average of 10 observations per year in the preadoption and postadoption periods. We exclude observations corresponding to voluntary adopters, cross-listed firms, financial firms (ICB codes 8000), utilities (ICB codes 7000), and firms with negative equity or with total assets lower than USD$1 million at the beginning of the year. Each firm is required to have data available from Datastream and Worldscope. GAAP = generally accepted accounting principles.
Research Design
We use two different methodologies to test our main prediction that the probability of raising external capital changed around the adoption of IFRS. First, we conduct cross-country tests where we compare IFRS adopters (treatment) to non-IFRS adopters (control). Second, we conduct within-country analyses where we compare financially constrained firms (treatment) to nonfinancially constrained firms (control) within a given IFRS-adopting country. The latter methodology allows us to improve our identification and address concerns that other country-year level factors could drive the results.
Cross-Country Tests
In our first methodology, we model whether, ceteris paribus, the probability of raising external financing increased following IFRS adoption. Specifically, we estimate the following linear probability model with a DiD specification: 11

where Ext_Fin equals 1 if a firm issues external financing (debt or equity) above 5% of the beginning period assets in a given year and 0 otherwise (we obtain similar inferences if we use a 2% cutoff).
To better understand the mechanisms behind our main results, we perform three cross-country tests. In particular, we estimate the following model:

where Adopter is one of our partitioning variables and the other variables are the same as in Model (1).
13
The first two tests measure each country’s institutional features, using proxies suggested by prior studies. First, we use the change in enforcement concurrent with IFRS adoption (ΔEnforcement), as suggested by Christensen et al. (2013). These authors find that mandatory IFRS reporting had a larger impact on liquidity in five E.U. countries that concurrently made substantive changes in reporting enforcement (Finland, Germany, Netherlands, Norway, and the United Kingdom). Thus, we partition adopters into
Second, we categorize countries conditional on ex-ante differences between a country’s local GAAP and IFRS (Change in GAAP). To do so, we partition our sample on the number of accounting differences, as measured by Bae et al. (2008). Bae et al. (2008) compare local standards to IFRS and categorize 21 differences in accounting rules. We use their measure and split our sample into small, medium, and large differences in accounting standards. In particular, AdopterL corresponds to firms in countries with less than six accounting differences, AdopterM corresponds to firms in countries with 6 to 11 accounting differences, and AdopterH corresponds to firms in countries with 12 or more accounting differences (these cutoffs represent the 25th and 75th percentiles of Change in GAAP in our sample).
In our third test, we investigate the role of foreign investment in the change in financing decisions post IFRS. If information asymmetry between the firm and investor is higher when the investor is from a different country, then the countries that rely more on foreign investment before the adoption of IFRS should benefit more from the new regime. We partition adopting countries based on the foreign investment inflow to gross domestic product (GDP) as measured the year before the adoption of IFRS. As with our Change in GAAP partitions, the cutoffs represent the 25th and 75th percentiles of the percentage of foreign direct investment to GDP in our sample.
Finally, to mitigate concerns that our results are clustered around 2005, we also investigate whether our inferences hold when the firm is a 2005 versus a non-2005 adopter.
Within-Country Tests
Next, to strengthen our identification, we conduct a within-country specification. We test whether, within the same country, treated firms that have high levels of information frictions rely more on external financing in the postadoption period. To test this prediction, we compare firms with high levels of financial constraints (treatment firms) to firms with low levels of financial constraints (control firms). Specifically, we estimate the following linear probability model with a DiD specification:

where
Variable Definitions and Descriptive Statistics
Following Leary and Roberts (2010), our main dependent variable, Ext_Fin, equals one if a firm issues debt or equity above 5% of its beginning period assets in a given year and zero otherwise. We measure debt issuances (Debt Is) as the change in long-term debt normalized by lagged total assets. By focusing on long-term debt, we avoid including other liabilities (e.g., pensions) that could be directly affected by the adoption of IFRS. 15
Following Leary and Roberts (2010), we measure equity issuances (Equity Is) from changes in the market value of equity. This approach avoids the use of balance sheet data, which could be mechanically affected by changes in accounting methods (e.g., due to a higher use of fair value estimates) following IFRS. 16 We proxy for financial constraints (Treatment in Equation (3) above) using two ex-ante measures based on the level of financial constraints measured the year before the adoption of IFRS. First, we use the Whited and Wu (2006) financial constraint index. Because this measure is based on U.S. data and could be affected by country-level attributes, we rank the index measure based on within country-industry median. The treatment firms are those with index values above the median (Treatment = F. Constraint WW).
Second, we use the Hadlock and Pierce (2010) index of financial constraints. As with the previous measure, we rank the index based on within country-industry to address potential cross-country differences in measurement. Treatment firms are those with index values above the median (Treatment = F. Constraint HP). In addition to these two measures, we use a combined measure based on the previous two. This measure, F. Constraint, is equal to one if F. Constraint WW is equal to one and F. Constraint HP is equal to 1, and 0 otherwise.
We include a number of controls from the previous literature (Bharath et al., 2009; Leary & Roberts, 2010; Rajan & Zingales, 1995; Shyam-Sunder & Myers, 1999). Specifically, we control for the following firm characteristics: financial distress (BSM-Prob), asset tangibility (Tangibility), growth opportunities (Tobin’s Q), profitability (Profitability), firm size (Log[Sales]), the amount of financing needed by the firm (Deficit), cash balance (Cash), and stock return (Returns). In some regressions that do not include country-year fixed effects, we control for a set of macroeconomic variables capturing changes in the supply of capital, such as bilateral trade (Trade), interest rates (Tbill), and GDP growth (ΔGDP). 17 Firm and country characteristics are measured at the beginning of the year. Returns, Deficit, and BSM-Prob are measured concurrently to control for capital needs and market timing. The exact definitions of these variables are in the Appendix.
Table 2 provides descriptive statistics for both samples. On average, 28% of adopting firms raise external financing each year. This number is broadly consistent with Leary and Roberts (2010), who find that 32.5% of firms raise external capital. Firms’ mean leverage ratio is 21.16%, which is consistent with the 15%–30% range that Rajan and Zingales (1995) reported for an international sample of firms. Around 29% of the adopting firms’ assets are tangible, a value within both the 27%–31% range reported by Leary and Roberts (2010) and the 24%–52% range reported by Rajan and Zingales (1995). Cash holdings amount to 15% of total assets, which is higher than the 4%–7% range obtained by Leary and Roberts (2010) but within the 8%–18% range reported by Rajan and Zingales (1995). Finally, the mean BSM-Prob (described below and in the Online Appendix) is 0.10, and the mean financing deficit equals 5% of assets.
Descriptive Statistics.
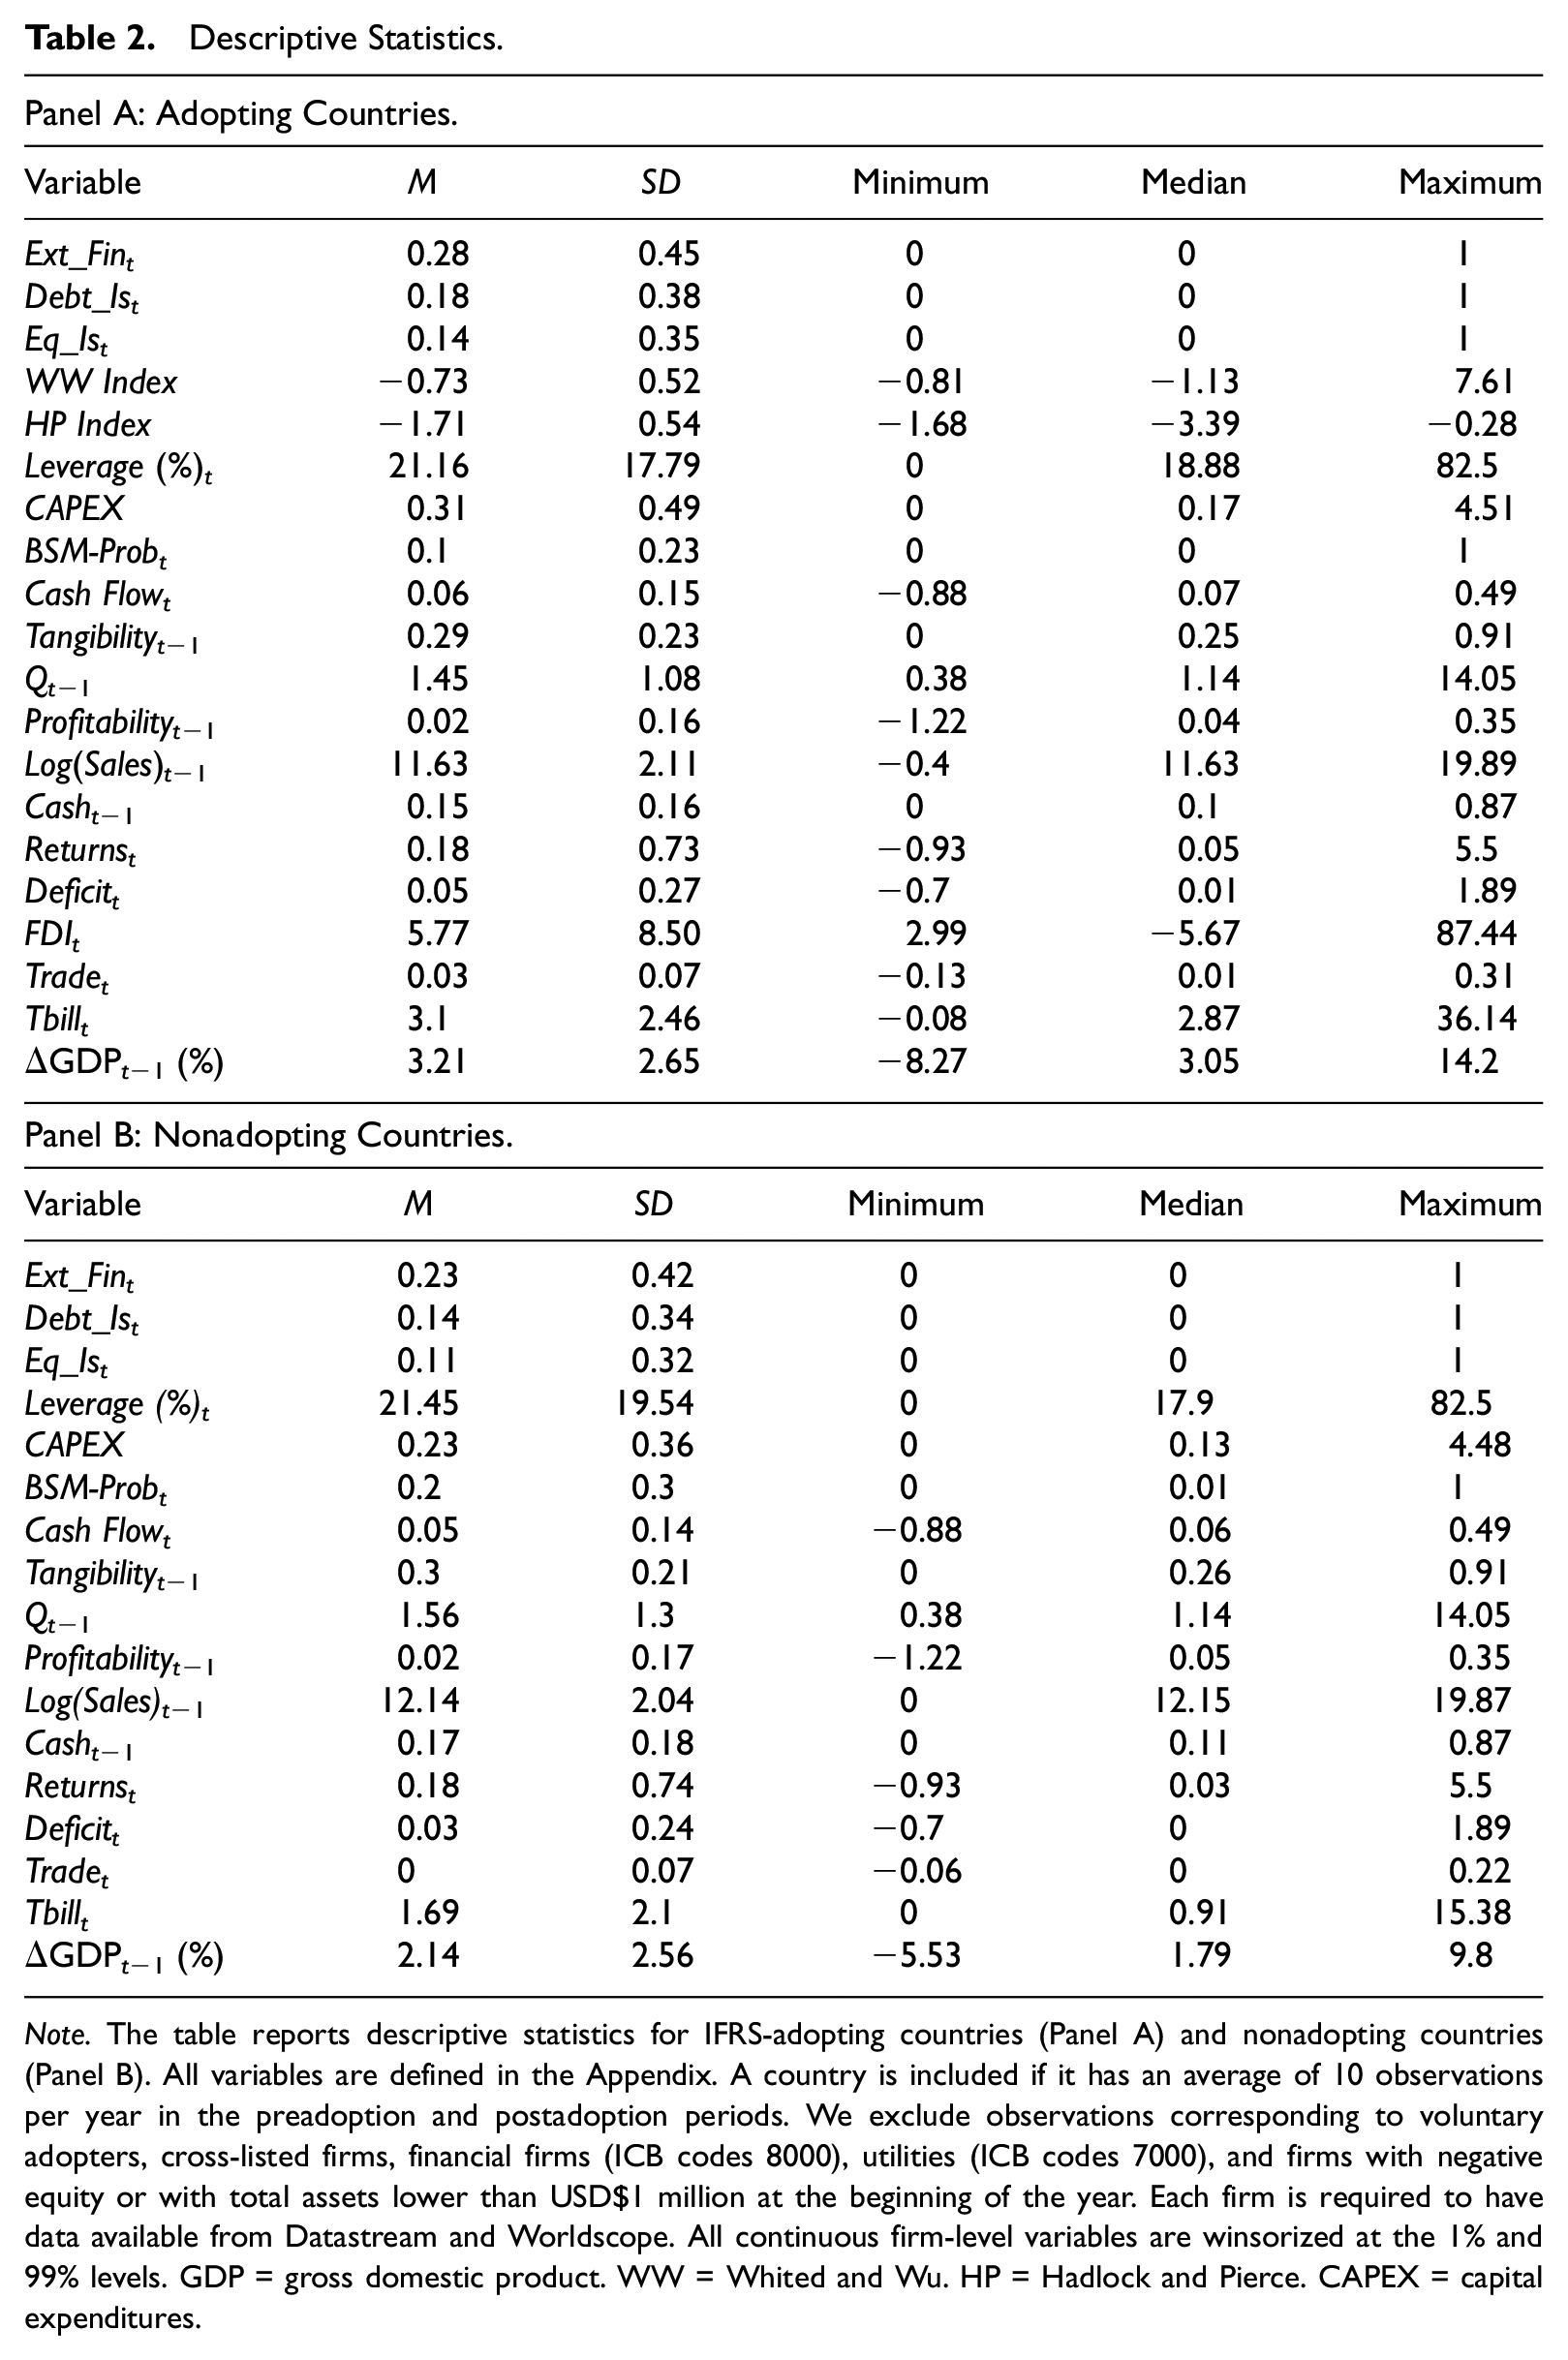
Note. The table reports descriptive statistics for IFRS-adopting countries (Panel A) and nonadopting countries (Panel B). All variables are defined in the Appendix. A country is included if it has an average of 10 observations per year in the preadoption and postadoption periods. We exclude observations corresponding to voluntary adopters, cross-listed firms, financial firms (ICB codes 8000), utilities (ICB codes 7000), and firms with negative equity or with total assets lower than USD$1 million at the beginning of the year. Each firm is required to have data available from Datastream and Worldscope. All continuous firm-level variables are winsorized at the 1% and 99% levels. GDP = gross domestic product. WW = Whited and Wu. HP = Hadlock and Pierce. CAPEX = capital expenditures.
Main Results
Validation Test—IFRS and Information Asymmetry
The interpretation of our results relies on the assumption that IFRS adoption significantly reduces information asymmetry. Although previous studies in accounting have provided ample evidence of this link (e.g., Byard et al., 2011; Daske et al., 2008; Tan et al., 2011), we nonetheless confirm these results in our sample. In the Online Appendix, we provide evidence that firms in our treatment sample experience a decrease in information asymmetry following the adoption of IFRS. Next, we investigate whether external financing changes following the adoption of IFRS.
Cross-Country Tests
We now turn to our cross-country specification—the DiD research design in Equations (1) and (2). Table 3 reports the results for our first prediction—that IFRS adoption increases the probability that firms will raise external financing. 18 Column 1 presents the results when year-fixed effects are excluded. We find that IFRS-adopting firms experience a 2.9% increase in the likelihood of raising external financing post IFRS, relative to nonadopting firms. Column 2 presents the results when year-fixed effects are included. The inferences are similar. Overall, the evidence in Table 3 suggests that IFRS-adopting firms rely more on external financing after the adoption of IFRS.
Probability of Issuing External Financing—Cross-Country.
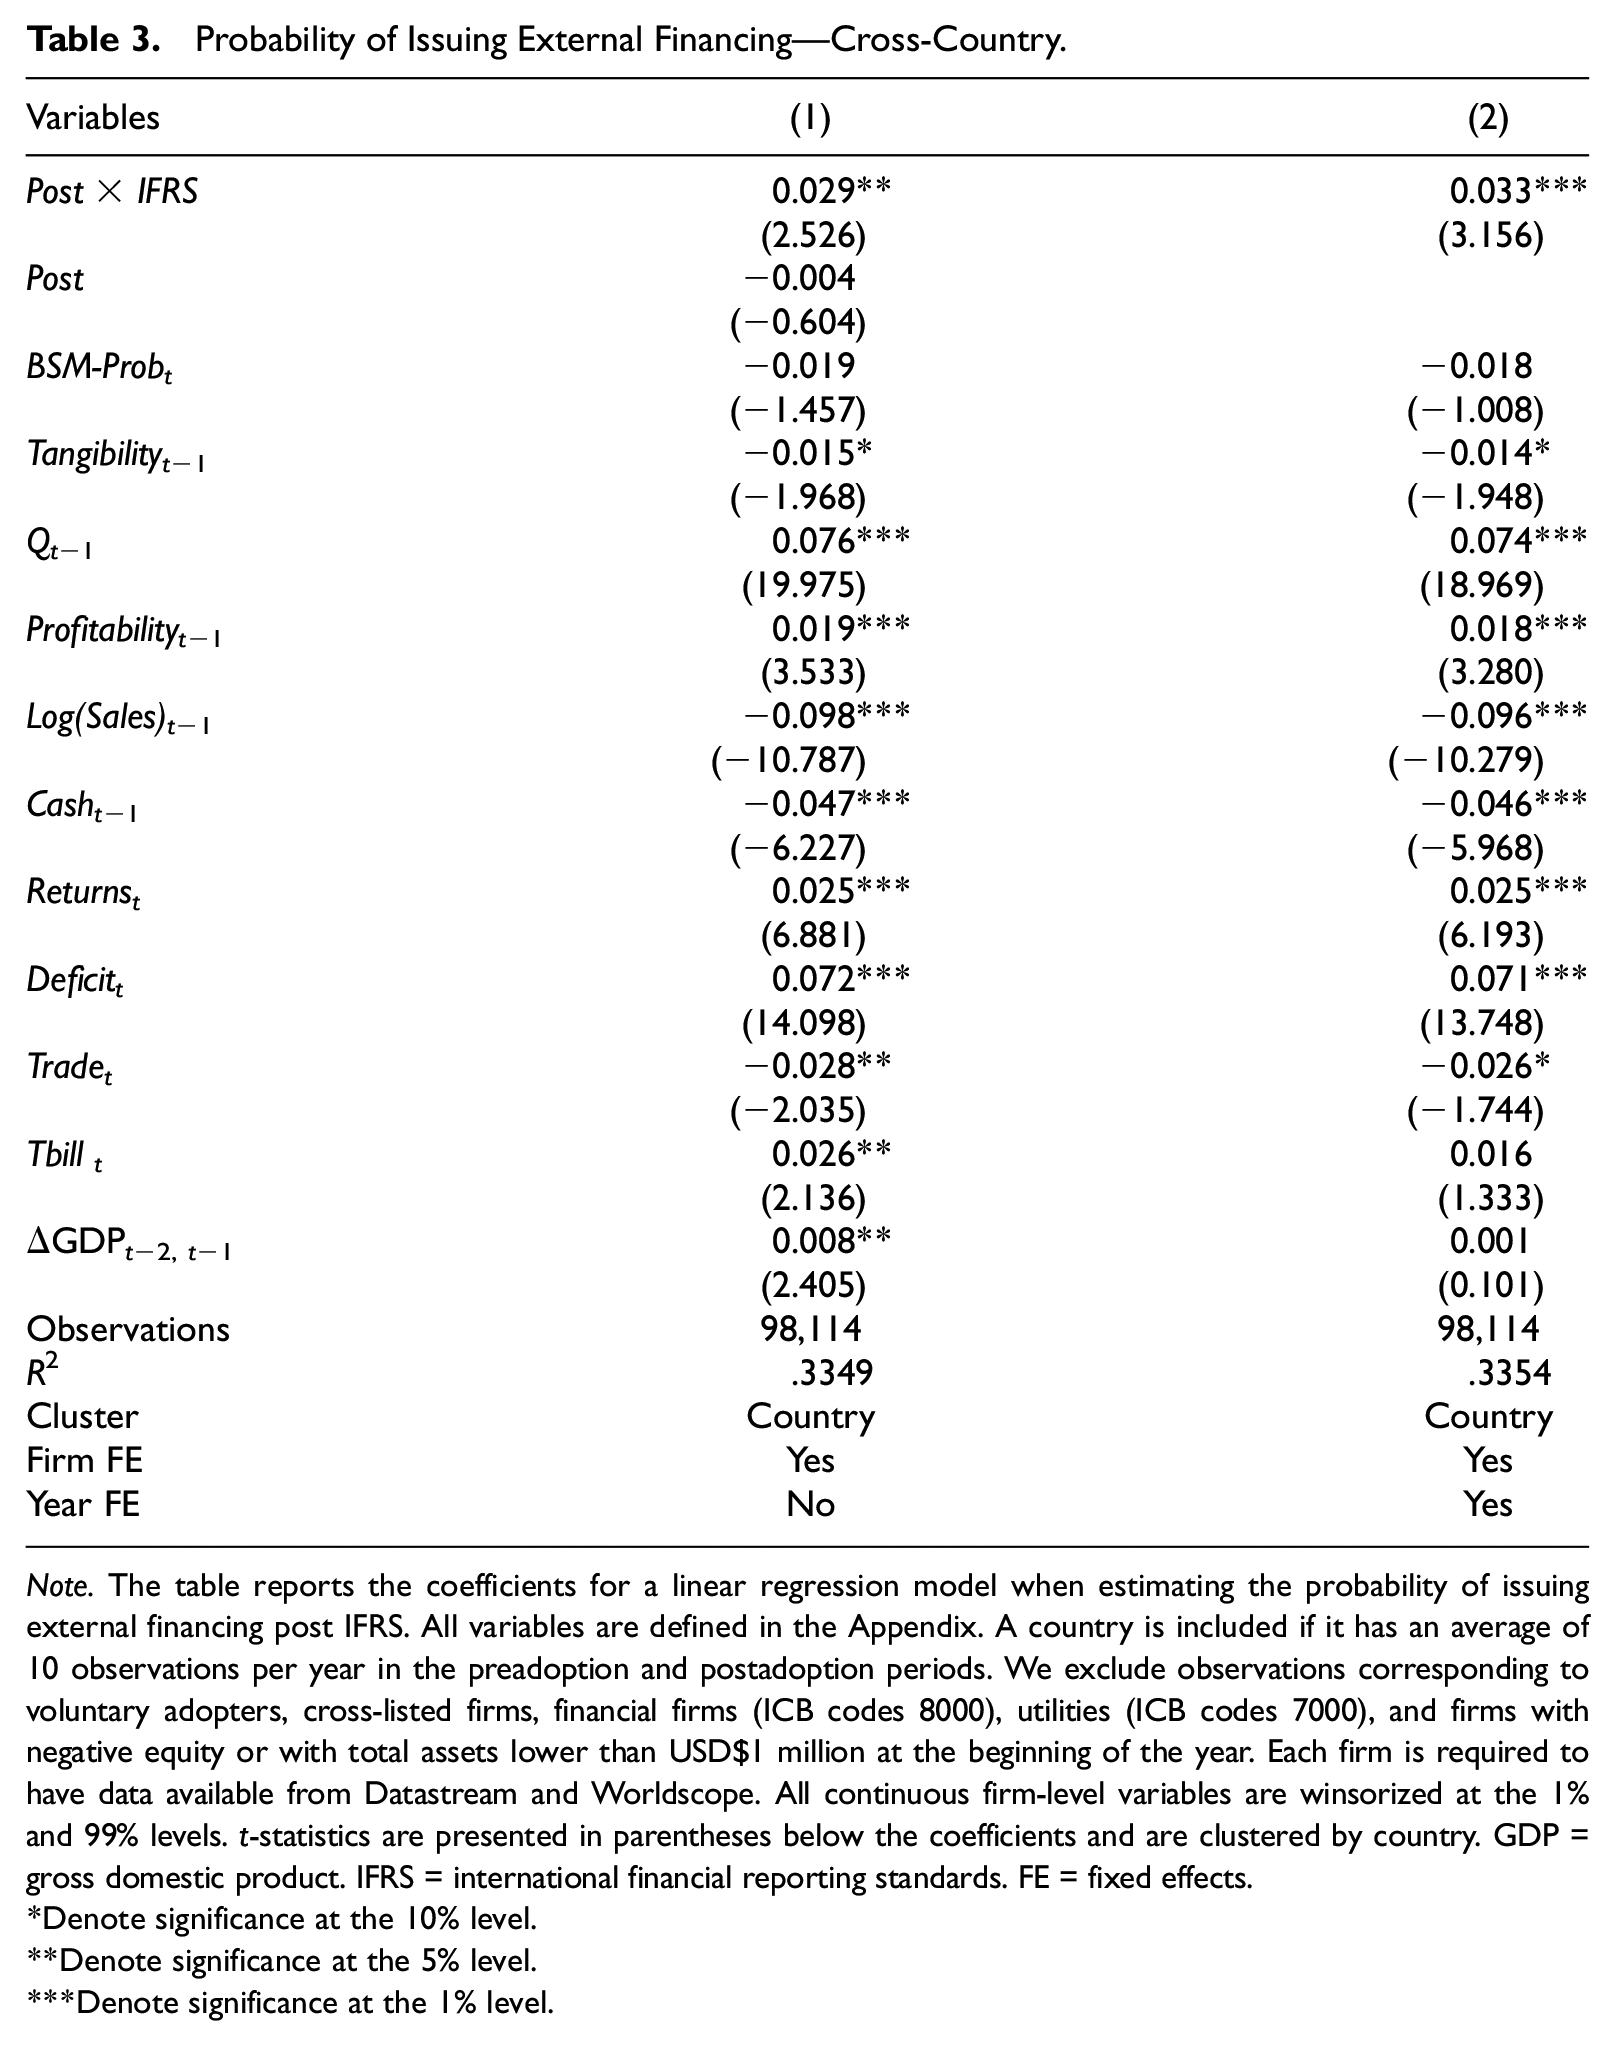
Note. The table reports the coefficients for a linear regression model when estimating the probability of issuing external financing post IFRS. All variables are defined in the Appendix. A country is included if it has an average of 10 observations per year in the preadoption and postadoption periods. We exclude observations corresponding to voluntary adopters, cross-listed firms, financial firms (ICB codes 8000), utilities (ICB codes 7000), and firms with negative equity or with total assets lower than USD$1 million at the beginning of the year. Each firm is required to have data available from Datastream and Worldscope. All continuous firm-level variables are winsorized at the 1% and 99% levels. t-statistics are presented in parentheses below the coefficients and are clustered by country. GDP = gross domestic product. IFRS = international financial reporting standards. FE = fixed effects.
Denote significance at the 10% level.
Denote significance at the 5% level.
Denote significance at the 1% level.
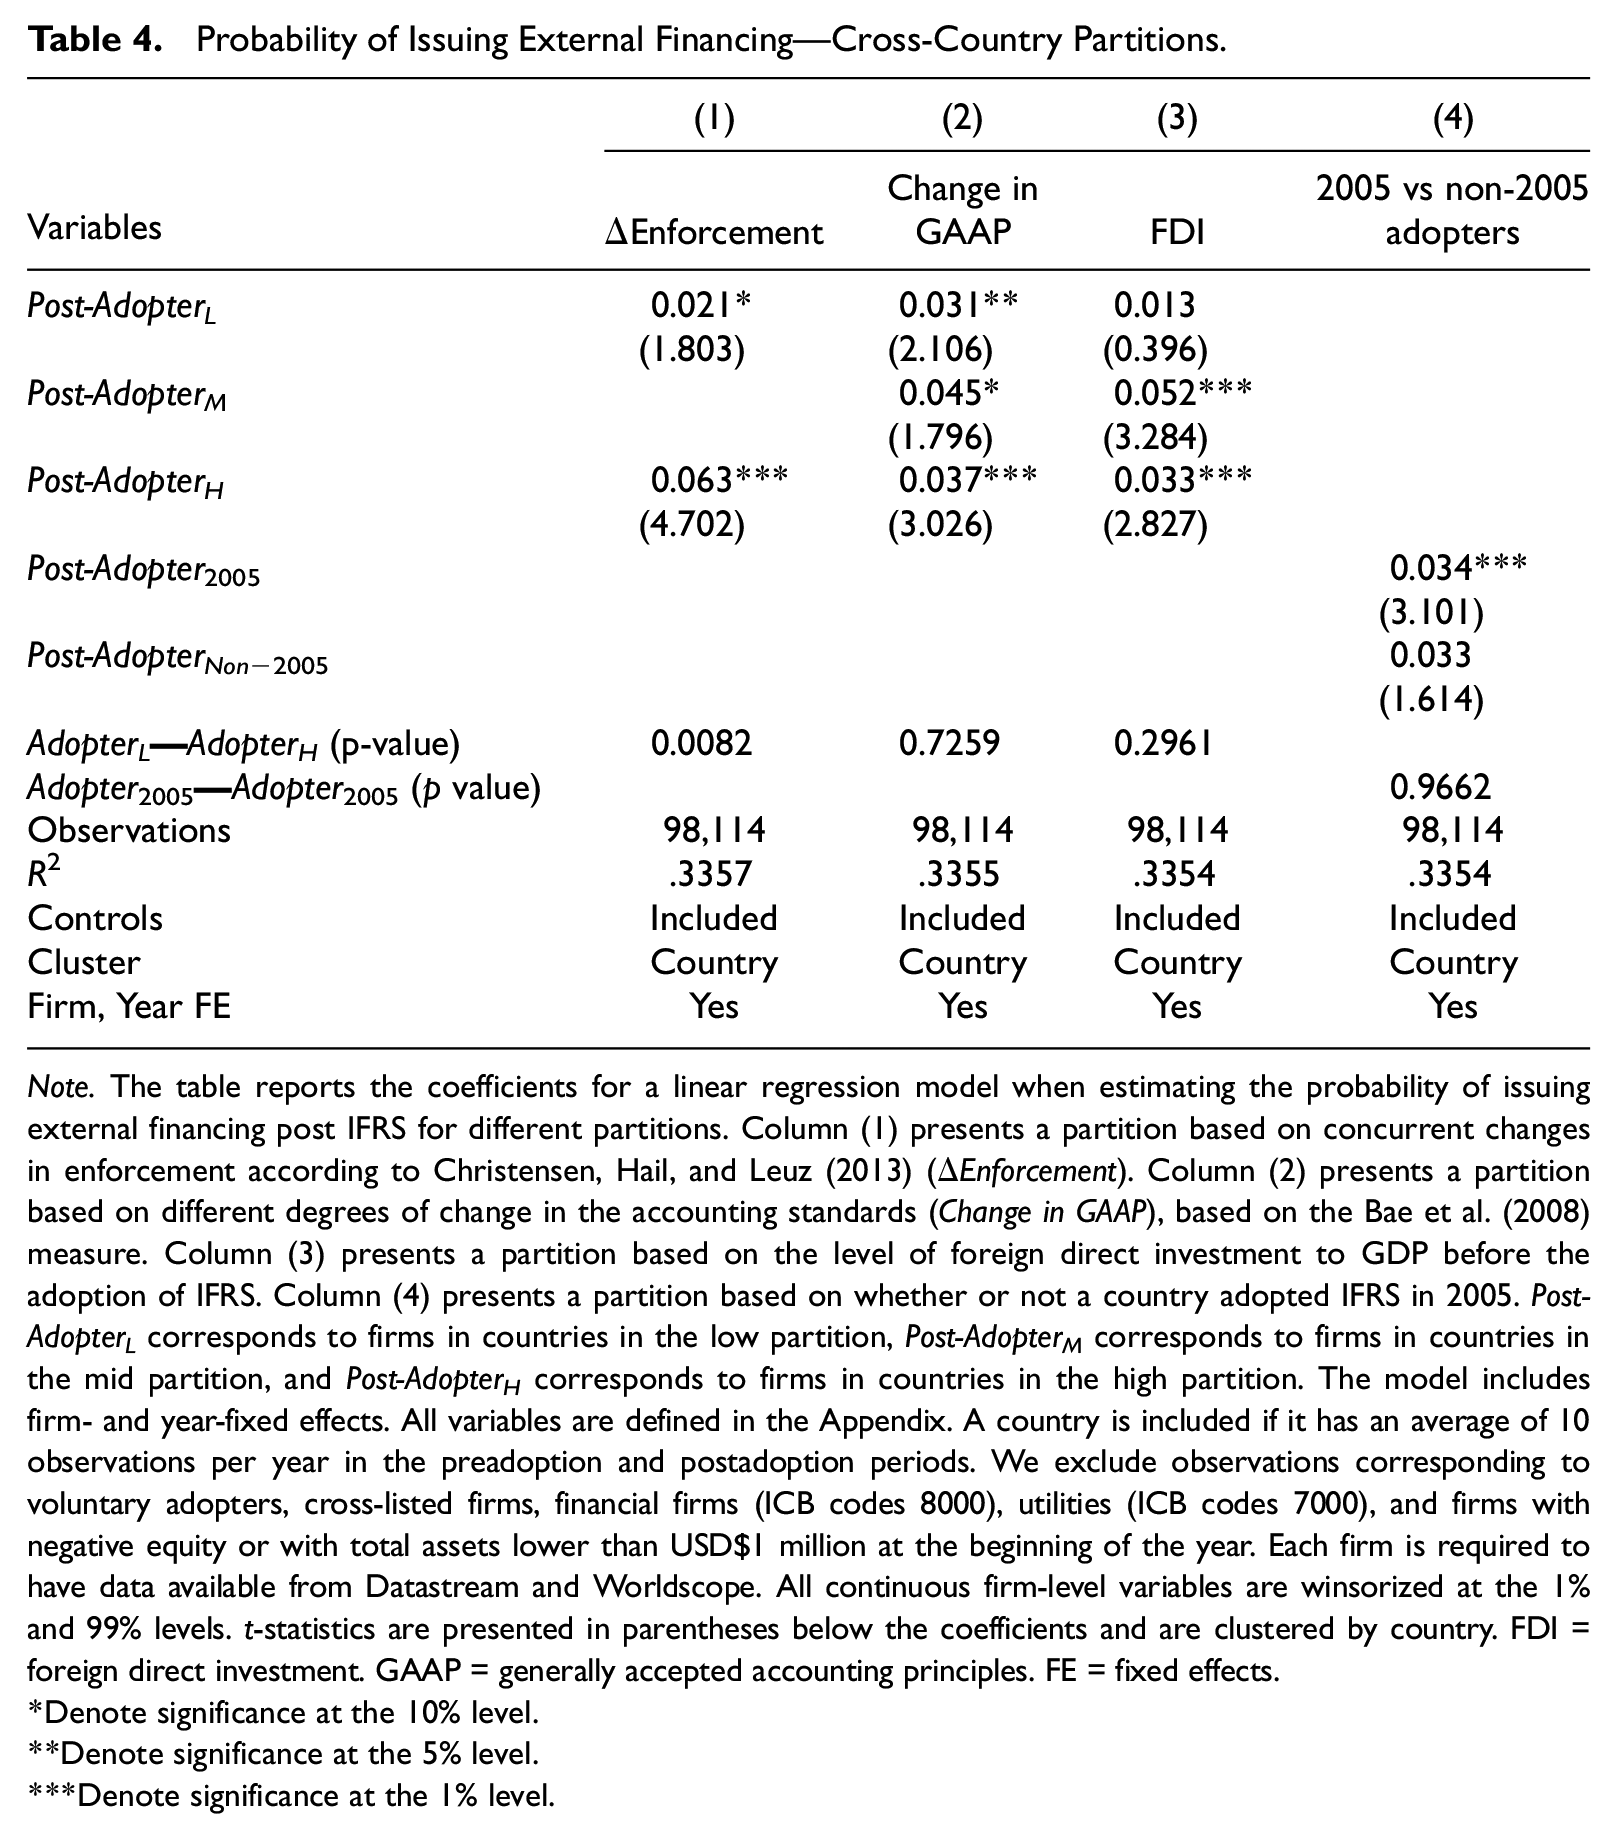
Table 4 presents the results for our cross-country partitions. We find that firms in countries that experience concurrent changes in enforcement increase external financing more post IFRS, relative to firms whose countries experience minimal or no concurrent enforcement changes. This is consistent with firms from countries with stronger institutional features experiencing larger changes in the likelihood of issuing external financing. In particular, for Column (1), we find that firms in countries with high ΔEnforcement are 4.2% (i.e., 6.3% minus 2.1%) more likely to issue external financing after the adoption of the IFRS, relative to firms in countries with low ΔEnforcement. In another test, we find only modest evidence consistent with firms in countries that have more accounting differences with IFRS increasing their external financing more, post IFRS, relative to other firms. In this case, the difference in coefficients is not statistically significant.
Probability of Issuing External Financing—Cross-Country Partitions.
Note. The table reports the coefficients for a linear regression model when estimating the probability of issuing external financing post IFRS for different partitions. Column (1) presents a partition based on concurrent changes in enforcement according to Christensen, Hail, and Leuz (2013) (ΔEnforcement). Column (2) presents a partition based on different degrees of change in the accounting standards (Change in GAAP), based on the Bae et al. (2008) measure. Column (3) presents a partition based on the level of foreign direct investment to GDP before the adoption of IFRS. Column (4) presents a partition based on whether or not a country adopted IFRS in 2005. Post-AdopterL corresponds to firms in countries in the low partition, Post-AdopterM corresponds to firms in countries in the mid partition, and Post-AdopterH corresponds to firms in countries in the high partition. The model includes firm- and year-fixed effects. All variables are defined in the Appendix. A country is included if it has an average of 10 observations per year in the preadoption and postadoption periods. We exclude observations corresponding to voluntary adopters, cross-listed firms, financial firms (ICB codes 8000), utilities (ICB codes 7000), and firms with negative equity or with total assets lower than USD$1 million at the beginning of the year. Each firm is required to have data available from Datastream and Worldscope. All continuous firm-level variables are winsorized at the 1% and 99% levels. t-statistics are presented in parentheses below the coefficients and are clustered by country. FDI = foreign direct investment. GAAP = generally accepted accounting principles. FE = fixed effects.
Denote significance at the 10% level.
Denote significance at the 5% level.
Denote significance at the 1% level.
Next, we investigate whether firms in countries with higher foreign direct investment inflows to GDP experience a greater increase in external financing post IFRS. Column (3) presents the results for this specification. The coefficient on Post-AdopterL is statistically insignificant, while the coefficients on Post-AdopterM and Post-AdopterH are positive and statistically significant. This suggests that countries that rely more on foreign investment benefit more from the new regime. However, the difference in coefficient between the high and low partitions, 2%, is not significant.
Finally, in Column 4, we find that both 2005 adopters and non-2005 adopters experience increases in external financing. Although the result is only significant for the 2005 adopters, the economic magnitudes of the coefficients are similar, and the difference between groups is not statistically significant. Overall, these findings mitigate a concern that an omitted confounding factor around the adoption of the new regulation in 2005 could drive our results.
Within-Country Tests
Table 5 presents the results for our within-country specification. Columns 1 to 3 present the results using each of the three measures of ex-ante levels of financial constraints. In column 1, the coefficient on Post x F. Constraint WW equals 0.03 and is statistically significant. This finding suggests that firms that were financially constrained (as per the Whited–Wu index) pre-IFRS increased their use of external financing by 3% after adoption of IFRS. Columns 2 and 3 present similar results using F. Constraint HP and F. Constraint, respectively, as the treatment firms. In column 2, the coefficient on Post x F. Constraint HP equals 0.027 and is statistically significant. In economic terms, the 2.7%–3.1% increase in external financing corresponds to a change of 9%–11% relative to pre-adoption financing levels. 19 Finally, in Columns 4 and 5, we partition our sample into 2005 adopters and Non-2005 adopters and find that our inferences hold. In fact, Non-2005 adopters experience an above-average increase of 4.3% in external financing postadoption. This result suggests that our prior statistically insignificant results for non-2005 adopters are driven by financially unconstrained firms.
Probability of Issuing External Financing.
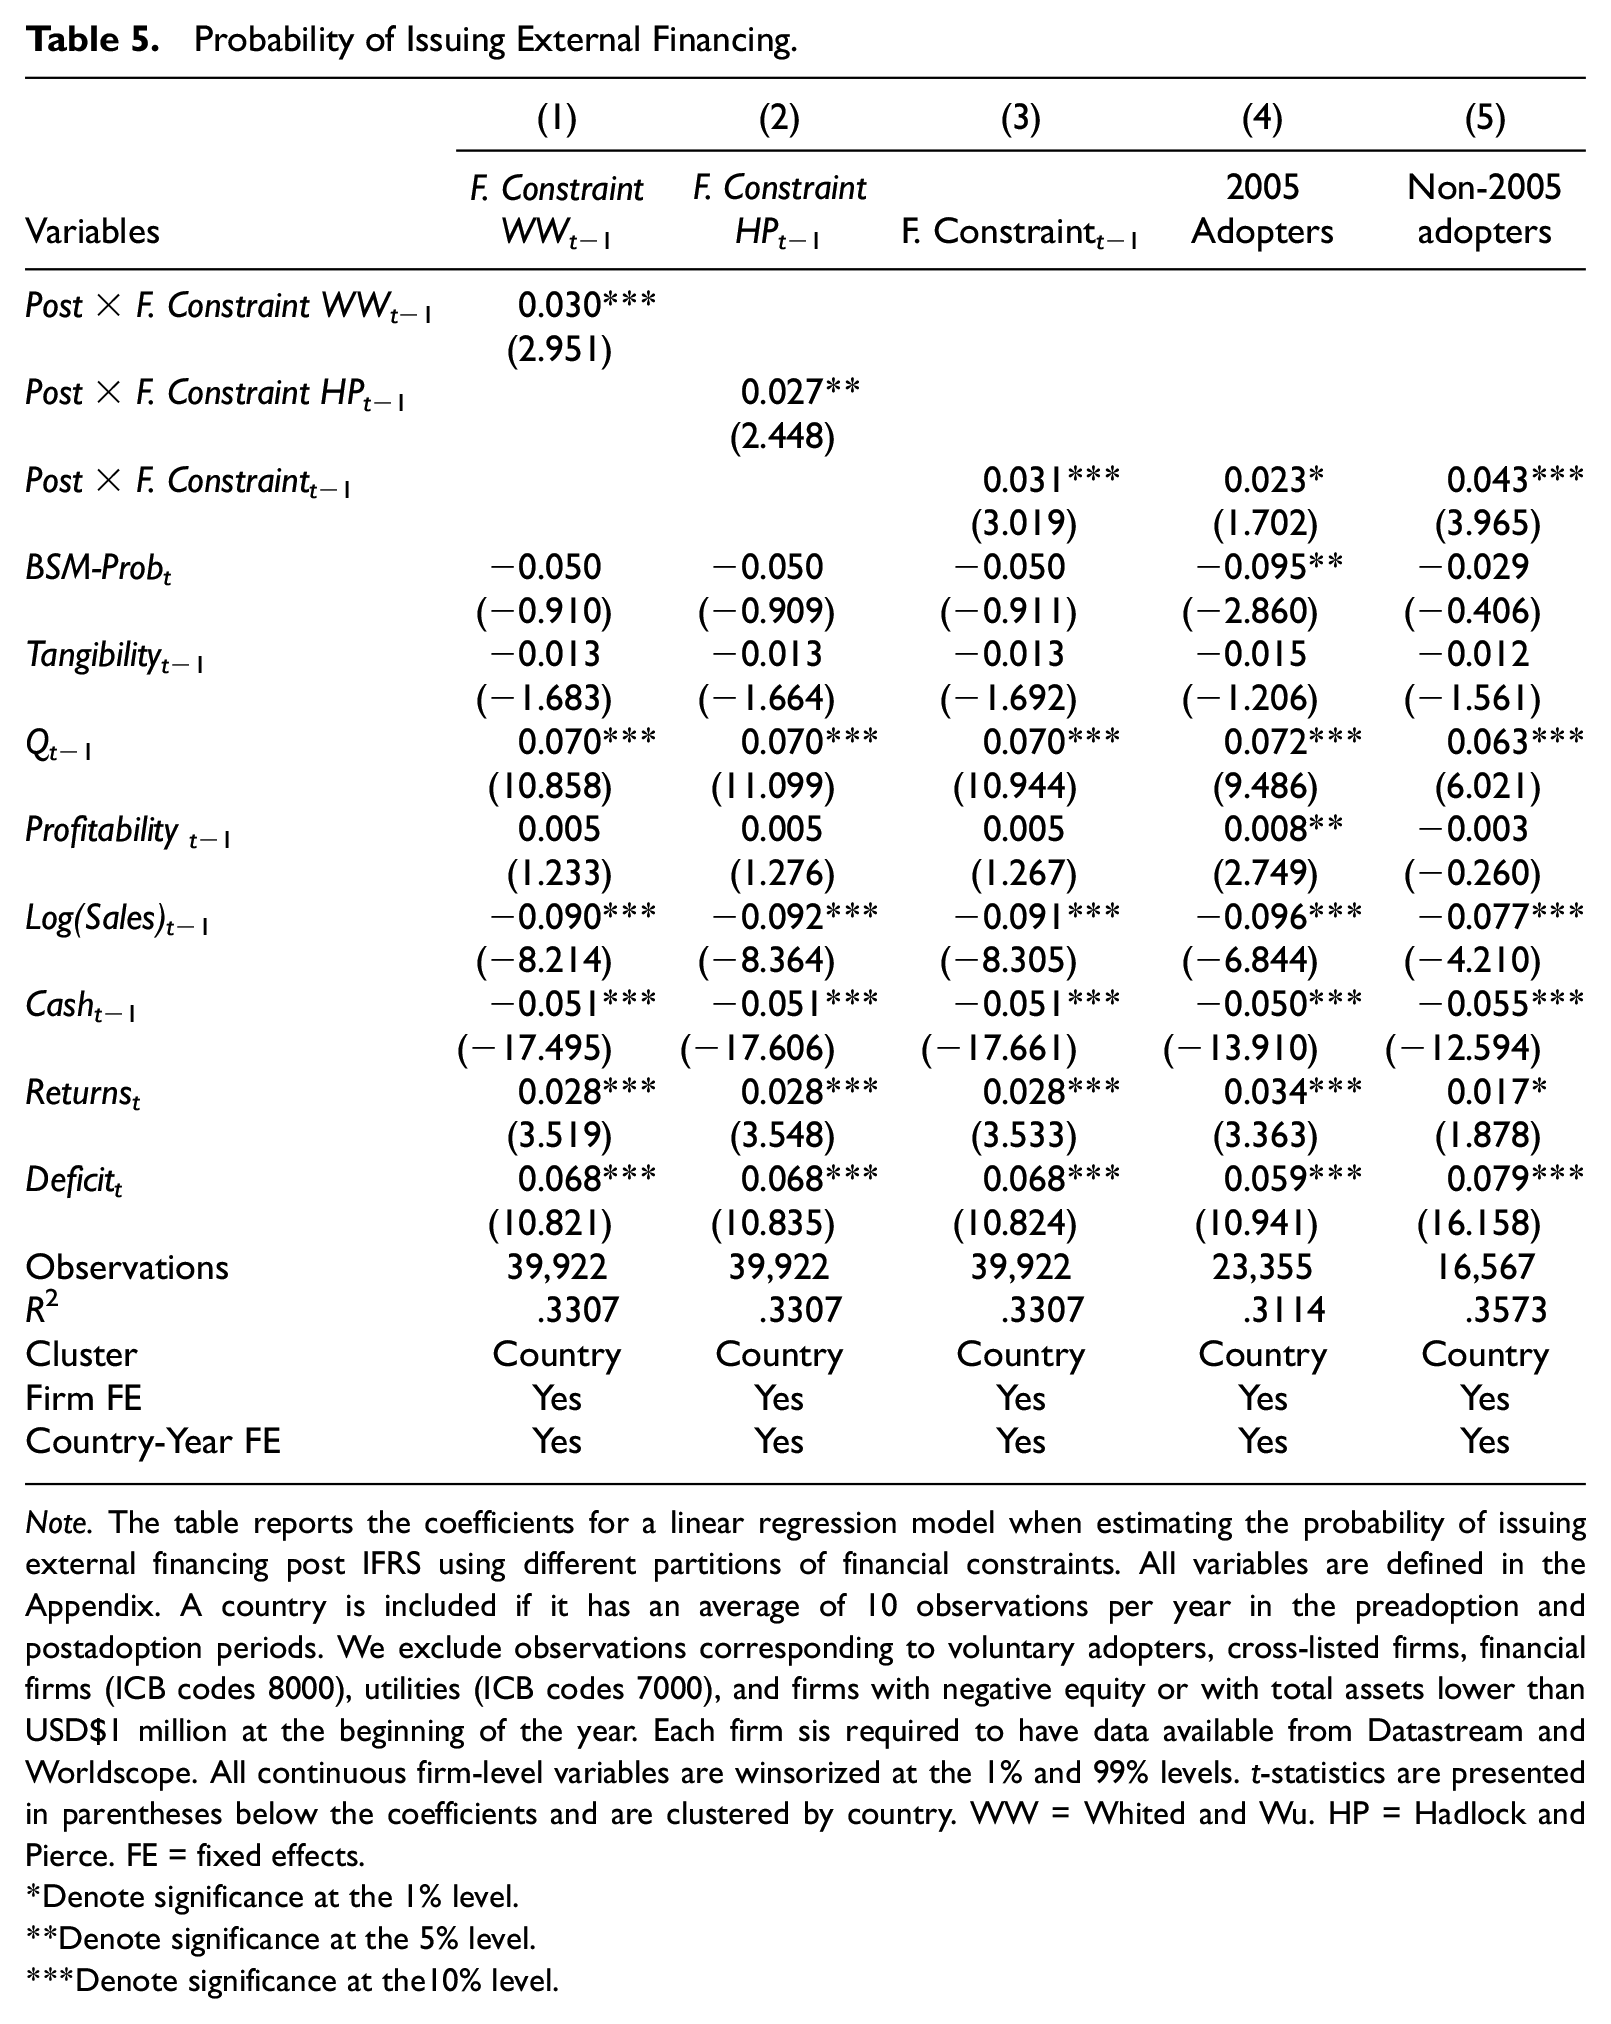
Note. The table reports the coefficients for a linear regression model when estimating the probability of issuing external financing post IFRS using different partitions of financial constraints. All variables are defined in the Appendix. A country is included if it has an average of 10 observations per year in the preadoption and postadoption periods. We exclude observations corresponding to voluntary adopters, cross-listed firms, financial firms (ICB codes 8000), utilities (ICB codes 7000), and firms with negative equity or with total assets lower than USD$1 million at the beginning of the year. Each firm sis required to have data available from Datastream and Worldscope. All continuous firm-level variables are winsorized at the 1% and 99% levels. t-statistics are presented in parentheses below the coefficients and are clustered by country. WW = Whited and Wu. HP = Hadlock and Pierce. FE = fixed effects.
Denote significance at the 1% level.
Denote significance at the 5% level.
Denote significance at the10% level.
Parallel trends
Our within-country identification strategy compares constrained to unconstrained firms—groups that, by default, have different characteristics and propensities to raise external financing. As a result, it is important to establish that both groups experience similar trends in issuing external financing prior to the new regulation, as our DiD specification assumes. To validate the parallel trends assumption, we follow Bertrand and Mullainathan (2003) and allow the adoption of the regulation to have a nonlinear (yearly) effect around the mandate. We align the data in event time and replace the Post dummy variable with separate interaction variables for each event year. In particular, we include five interactions to isolate the effect of the 2 years before and the years after the mandate. Years −4 and −3 serve as the benchmark, so we do not include interactions for those years. The dummy Post(+2 plus) captures years +2, +3, and +4.
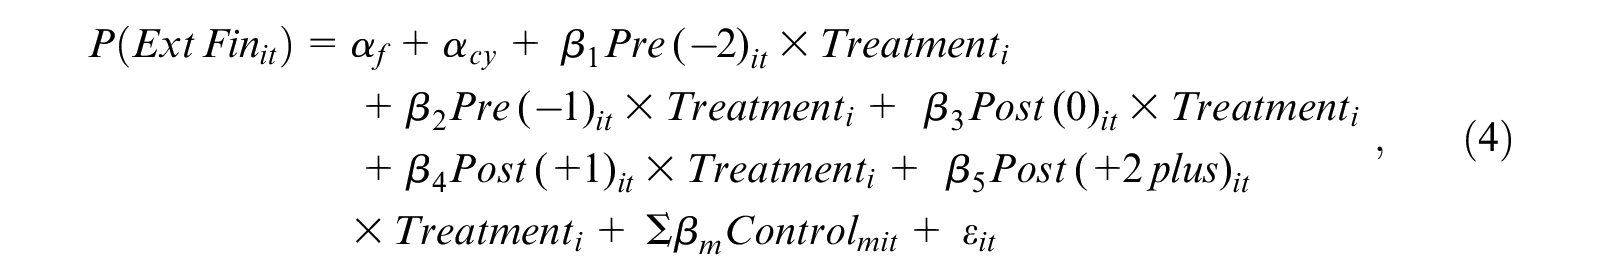
If the parallel trends assumption is satisfied, we would expect no difference in trends between the treatment and control firms in the premandate period, resulting in insignificant
Table 6, Column 1 presents the results when Treatment is equal to F. Constraint WW; Column 2 presents the results when Treatment is equal to F. Constraint HP; and Column 3 presents the results when Treatment is equal to F. Constraint. In the pre-IFRS period (i.e., Pre [−2] and Pre (−1)), all of our models show insignificant coefficients, suggesting similar trends in the treated and control groups before the IFRS adoption. For example, in Column 1, the coefficient on Pre(−2) x Treatment is −0.006 and insignificant, and the coefficient on Pre(–1) x Treatment is 0.006 and insignificant.
Parallel Trends.

Note. The table reports coefficients for a linear regression model predicting the probability of issuing external financing post IFRS. All variables are defined in the Appendix. A country is included if it has an average of 10 observations per year in the preadoption and postadoption periods. We exclude observations corresponding to voluntary adopters, cross-listed firms, financial firms (ICB codes 8000), utilities (ICB codes 7000), and firms with negative equity or with total assets lower than USD$1 million at the beginning of the year. Each firm is required to have data available from Datastream and Worldscope. All continuous firm-level variables are winsorized at the 1% and 99% levels. t-statistics are presented in parentheses below the coefficients and are clustered by country. WW = Whited and Wu. HP = Hadlock and Pierce. FE = fixed effects.
Denote significance at the 1% level.
Denote significance at the 5% level.
Denote significance at the 10% level.
In contrast, in the post-IFRS period, the yearly coefficients are mostly of a similar magnitude to the average effect shown in Table 5, and are statistically significant. In columns 1 to 3, the coefficients on Post(0) x Treatment and Post(+1) x Treatment range from 0.019 through 0.067 and are generally statistically significant. The coefficient on Post (+2 plus) x Treatment is significant only in Column 1.
Leverage Implications
Our results so far suggest that the new regulation reduced information asymmetry, allowing financially constrained firms to increase their external financing. We now turn to the implications of this finding for the types of securities issued and thus for capital structure.
Our prediction comes from the “modified pecking order” in Myers (1984). Specifically, we test whether firms issue debt or equity depending on their financing capacity. The idea is that firms will raise external financing first in the form of debt and then, as the cost of raising additional debt increases (i.e., when debt capacity has been reached), in the form of equity capital. As a result, we expect firms with debt capacity to issue more debt and increase leverage, and firms without debt capacity to issue more equity and decrease leverage. We use BSM-Probability, the market-based probability of bankruptcy derived from the Black–Scholes–Merton option-pricing model (BSM-Prob is defined in detail in the Online Appendix), as our proxy for debt capacity at the time of the IFRS adoption. As a robustness test, we also present results using leverage as an alternative proxy for debt capacity.
To assess the effect of the new regulation on capital structure, we model firm leverage around the adoption of the new regime for treatment firms (as defined by our conjoint measure of F. Constraint) and investigate whether debt capacity affects how leverage changes post-IFRS adoption. Specifically, we estimate the following models:


where Leverage equals total debt divided by the market value of assets.
20
We use two measures of debt capacity. The first, Rank BSM, is defined as the within country-industry BSM-Prob quartile rescaled to range from 0 through 1. The second, Rank Leverage, is defined as the within country-industry book leverage quartile rescaled to range from 0 through 1. Both BSM-Prob and Book Leverage are firm-level variables, measured the year before the adoption. Therefore, due to the inclusion of firm-fixed effects, the main effect for Rank BSM and Rank Leverage is subsumed from the model. Our prediction that firms with debt capacity will increase leverage implies a positive coefficient
Table 7 presents our results for the leverage regressions for our treatment sample. Column (1) shows that the coefficient on Post is positive and significant, consistent with treatment firms with debt capacity increasing leverage post-IFRS adoption. The increase in leverage suggests that the magnitude of debt issuances is greater than the magnitude of equity issuances. The coefficient on Post x Rank BSM is negative and significant at the 1% level for Columns (1) and (2), suggesting that post-IFRS leverage is lower for firms with a low level of debt capacity. The sum of the coefficients Post + Post x Rank BSM is negative though insignificant. To strengthen our inferences, we use leverage as an alternative proxy for debt capacity. Similar to our Rank BSM results, Columns (3) and (4) suggest that post-IFRS leverage is lower for firms with a low level of debt capacity.
Market Leverage (%) Conditional on Debt Capacity.

Note. The table reports the coefficients for a linear regression model when estimating Market Leverage (%) post IFRS based on different levels of debt capacity for treatment firms defined by F. Constraint. All variables are defined in the Appendix. A country is included if it has an average of 10 observations per year in the preadoption and postadoption periods. We exclude observations corresponding to voluntary adopters, cross-listed firms, financial firms (ICB codes 8000), utilities (ICB codes 7000), and firms with negative equity or with total assets lower than USD$1 million at the beginning of the year. Each firm is required to have data available from Datastream and Worldscope. All continuous firm-level variables are winsorized at the 1% and 99% levels. t-statistics are presented in parentheses below the coefficients and are clustered by country. BSM = Black–Scholes–Merton; GDP = gross domestic product. FE = fixed effects.
Denote significance at the 1% level.
Denote significance at the 5% level.
Denote significance at the 10% level.
Investment Implications
In this section, we test the implications of our prior results for investment policies. An important implication in Myers and Majluf (1984) is that information asymmetry leads financially constrained firms to pass up profitable investment opportunities. Our findings above show that the new regulation reduces information asymmetry for firms that are subject to it, and that financially constrained firms take advantage of this reduction by increasing their external financing. We now predict that these firms will use the additional funds to increase investment after the new regulation.
Following prior research (e.g., Almeida & Campello, 2007), we proxy for investment using capital expenditures deflated by beginning period property, plant, and equipment (PP&E). We then estimate the following model:

where Treatment is F. Constraint WW, F. Constraint HP, or F. Constraint. Consistent with prior investment research (e.g., Almeida & Campello, 2007; Fazzari et al., 1988), we include controls for investment opportunities (Q) and cash flows (Cash Flow). We standardize the control variables to facilitate the interpretation of coefficients.
Table 8, Panel A presents our results for the capital expenditure regression. Columns 1 to 3 present the results for the treatment sample based on the three measures of ex-ante financial constraints. In all cases, we find that Post x Treatment is positive and statistically significant. For instance, in Column 1, we find that Post x F. Constraint WW equals 0.038 and is statistically significant at the 1% level. This finding suggests that, following IFRS adoption, financially constrained firms increase investment more than unconstrained firms do. This result is consistent with the conditional model by Biddle et al. (2009), in that the financially constrained firms are assumed to be underinvesting. As a result, an increase in investment efficiency for these firms implies that they will increase their level of investment post IFRS. In economic terms, we find that in the postregulation period, investment by financially constrained firms increases by 2.8%–3.8%, which translates to a 9%–12% relative increase over pre-IFRS levels. 21
Capital Expenditures.

Note. The table reports the coefficients for a linear regression model when estimating changes in capital expenditure post IFRS. Panel A presents the results for different partitions of financial constraints. Panel B presents the results for the treatment sample when assessing the change in the sensitivity of capital expenditure to Tobin’s Q post IFRS. All variables are defined in the Appendix. A country is included if it has an average of 10 observations per year in the preadoption and postadoption periods. We exclude observations corresponding to voluntary adopters, cross-listed firms, financial firms (ICB codes 8000), utilities (ICB codes 7000), and firms with negative equity or with total assets lower than USD$1 million at the beginning of the year. Each firm is required to have data available from Datastream and Worldscope. All continuous firm-level variables are winsorized at the 1% and 99% levels. t-statistics are presented in parentheses below the coefficients and are clustered by country. WW = Whited and Wu. HP = Hadlock and Pierce. FE = fixed effects. IFRS = international financial reporting standards.
Denote significance at the 1% level.
Denote significance at the 5% level.
Denote significance at the 10% level.
To provide more direct evidence on whether the new regime had an effect on the efficiency of these investments, we investigate how the sensitivity of capital expenditures to Tobin’s Q changes following the adoption of IFRS, based on Shroff et al. (2014). We then estimate the following model for our treatment sample (as defined by our conjoint measure of F. Constraint):

Table 8, Panel B presents our results for Equation (8) when including Post (column [1]) or when including year-fixed effects (column [2]). In both cases, we find that the coefficient on Post x Q is positive and statistically significant, suggesting that capital expenditures become more sensitive to Q following IFRS adoption. Overall, our results are consistent with investment increasing and becoming more efficient post-IFRS adoption.
Conclusion
We use the staggered introduction of IFRS as an exogenous shock to firms’ information environment, and study whether treated firms change their financing and investment decisions in a manner consistent with the pecking order theory. We show that firms in IFRS-adopting countries are more likely to raise external financing and increase investment under the new regime. We then exploit within country-year variation in firms’ financing frictions and find that financially constrained firms increase their financing and investment more than unconstrained firms. Furthermore, firms make different leverage choices (i.e., debt vs equity) under the new regime, depending on their ex-ante debt capacity, and use their access to external financing to rebalance their capital structure. Our findings highlight the importance of the pecking order theory in explaining financing as well as investment policies.
Our study complements the findings in two important literatures. First, we contribute to the debate about the relevance of the pecking order theory developed by Myers and Majluf (1984). Using IFRS as a shift in the information environment of IFRS-adopting firms, we show that the changes in the financing and investment patterns for these firms are consistent with predictions in the pecking order theory. Second, we contribute to the international literature on the role of regulation on financing decisions worldwide.
Supplemental Material
Internet_Appendix_033120_APW – Supplemental material for The Pecking Order and Financing Decisions: Evidence From Changes to Financial-Reporting Regulation
Supplemental material, Internet_Appendix_033120_APW for The Pecking Order and Financing Decisions: Evidence From Changes to Financial-Reporting Regulation by Patricia Naranjo, Daniel Saavedra and Rodrigo S. Verdi in Journal of Accounting, Auditing & Finance
Footnotes
Appendix
Acknowledgements
The authors thank Linda Myers (editor), Mohan Venkatachalam (discussant), and two anonymous reviewers for their suggestions. Further, they thank Manuel Adelino, Joshua Anderson, Mark Bradshaw, John Core, Xavier Giroud, João Granja, Nick Guest, Michelle Hanlon, Amy Hutton, Christian Leuz, Gustavo Manso, Stewart Myers, Jeff Ng, Scott Richardson, Michael Roberts, Antoinette Schoar, Nemit Shroff, Eric So, Jerry Zimmerman, and workshop participants at the 2019 JAAF Conference, University of Arizona, Boston College, University of British Columbia, Catholic-Lisbon University, Harvard, INSEAD, LBS, MIT, Penn State, Rice University, UCLA, University of Sao Paulo, and Wharton for helpful comments. The authors gratefully acknowledge financial support from the MIT Sloan School of Management, Rice University, and UCLA. Patricia Naranjo and Daniel Saavedra are also grateful for financial support from the Deloitte Foundation.
Declaration of Conflicting Interests
The author(s) declared no potential conflicts of interest with respect to the research, authorship, and/or publication of this article.
Funding
The author(s) received no financial support for the research, authorship, and/or publication of this article.
Supplemental Material
Supplemental material for this article is available online.
Notes
References
Supplementary Material
Please find the following supplemental material available below.
For Open Access articles published under a Creative Commons License, all supplemental material carries the same license as the article it is associated with.
For non-Open Access articles published, all supplemental material carries a non-exclusive license, and permission requests for re-use of supplemental material or any part of supplemental material shall be sent directly to the copyright owner as specified in the copyright notice associated with the article.