
Abstract
This study examines the economic implications of fair value liability gains and losses arising from the adoption of Statement of Financial Accounting Standards No. 159 (hereafter, FAS 159). We find a positive correspondence between a firm’s FAS 159 fair value liability gains and losses and current period stock returns, consistent with the notion that these gains and losses are priced by equity investors. However, further analysis indicates that fair value gains and losses from liabilities have a statistically significant negative association with future returns, suggesting that investors misprice this earnings component and subsequently correct the mispricing. We also find that the negative association for fair value gains is stronger for firms with lower levels of institutional ownership.
Introduction
We examine how investors perceive the valuation implications of recognized fair value gains and losses attributable to fair value changes in liabilities. Statement of Financial Accounting Standards No. 159, The Fair Value Option for Financial Assets and Financial Liabilities (hereafter, FAS 159; Financial Accounting Standards Board [FASB], 2007), allows firms to elect fair value as the measurement basis for certain financial instruments. A primary motivation for this standard is to allow a consistent measurement basis of both financial assets and financial liabilities on the balance sheet, as this accounting standard enables firms to apply fair value measurement to certain financial liabilities for the first time.
Because FAS 159 gives firms the option to fair value their financial liabilities, the standard has been controversial and has drawn considerable attention. As with the fair value measurement of certain hard-to-measure financial assets, market participants have concerns that the fair value measurement of financial liabilities is unreliable, especially if these financial liabilities are not actively traded. For example, Kothari et al. (2010) argue that the fair value election decision is potentially misused when fair values are unverifiable, which in turn increases reporting opportunism. This is especially so if firms are motivated to report gains from their financial liabilities due to deterioration of financial prospects or changes in interest rates (e.g., Guthrie et al., 2011; Henry, 2009). With regard to the fair value gains from liabilities, Demerjian et al. (2016) argue that reporting liabilities at fair value can have particularly perverse implications for debt contracting. Specifically, the fair value election decision may allow borrowers to exploit the fair value option rule because borrowers can time the exercise of the fair value option for certain types of loans (e.g., revolving line of credit). Their results suggest that fair value adjustments are included in debt contracting when they are most likely to improve performance measurement.
Although the updated FASB guidelines for financial instruments (FASB, 2016), requiring firms to recognize the gains/losses from fair value changes in liabilities attributable to credit risk in other comprehensive income, seemingly resolve the ongoing debate over the fair value measurement of liabilities, regulators (e.g., U.S. Securities and Exchange Commission, 2016) have also expressed concern that managers would exercise more judgment to determine the extent of the change in fair value of liabilities due to changes in instrument-specific credit risk. 1 This concern arises because standard setters did not fully eliminate this rule, that is, to the point of rescinding fair valuing of financial liabilities. Hence, while FAS 159 now requires entities to present separately, in other comprehensive income, the portion of the total change in a financial liability’s fair value that results from a change in instrument-specific credit risk, the basis of measurement for these financial instruments is still fair value as opposed to amortized cost. Moreover, the current rule still allows firms to recognize fair value gains/losses due to changes in factors other than the firm’s own credit risk in net income, raising a question of whether those fair value gains/losses due to changes in other factors are value relevant. In this sense, the FAS 159 rule remains relevant to the ongoing debate about whether financial statements should incorporate more or less fair value reporting.
Our study attempts to provide direct evidence on whether fair value gains and losses from liabilities are value relevant. This research setting is possible because FAS 159 disclosure requirements allow market participants to directly assess the impact of gains and losses from fair value changes in liabilities. In particular, we examine whether contemporaneous stock price changes reflect reported fair value liability gains and losses. This evidence is especially relevant given the many assertions that the accounting for fair valuing liabilities is flawed. We also examine to what extent the valuation implications of these fair value changes affect future returns. We consider these research questions to be of importance given the controversy that raises troubling questions about the nature of fair value gains and losses from liabilities, and what they really represent in the overall context of a firm’s fundamentals. Finally, we investigate whether the value relevance of fair value liability gains and losses due to firms’ own credit risks differs from those due to other factors and how different components of fair value liability gains and losses affect future returns. This evidence can provide insights into ongoing debates on the scope of fair value reporting.
We draw our sample from firms that elected the fair value option as the measurement basis for their financial liabilities, following FAS 159. We review their financial statements from 2008 to 2012 to hand-collect financial statement information pertaining to FAS 159 disclosures. We find a positive association between a firm’s stock returns and FAS 159 fair value gains or losses from liabilities that is incremental to the market response to the firm’s earnings before inclusion of these fair value gains and losses. These results extend prior research that investigates the market pricing on fair value gains and losses of financial assets (e.g., Barth, 1994). Next, we examine the future valuation implications of these liability gains and losses by investigating the association between this earnings component and future returns. A positive association will suggest that investors underestimate the valuation implications of fair value liability gains and losses and that they were initially too pessimistic (optimistic) about the gains (losses) of these firms when those gains (losses) were initially reported. On the contrary, a negative association between fair value changes and future stock returns will suggest that investors are initially optimistic (pessimistic) about these gains (losses), but reverse their initial optimism (pessimism) over the next 12 months as they become better able to assess the realizability of these gains and losses.
We find that liability gains have a statistically significant negative association with future 1-year returns. Specifically, the magnitude of the reversed negative association is greater than that of the positive association with contemporaneous returns, indicating that investors initially mispriced these fair value changes. In a cross-sectional analysis, we find that this mispricing occurs mostly for firms with low institutional ownership. One interpretation of these results is that investors misreact to the firm’s prospects when the firm reports net income that is boosted by fair value gains from liabilities but do not consider the real implications of these fair value gains and losses in the overall context of the firm’s changing fundamentals to market conditions. This finding provides some evidence that the fair value accounting for liabilities in our sample period may be flawed, as most of these gains are not realizable but instead are reversed from the financial statements in subsequent periods. In this regard, our results support the concerns expressed by many regarding the accounting treatment of fair valuing liabilities.
In additional tests, we utilize a difference-in-differences approach to document that the value relevance of earnings for our sample firms improves in the post–FAS 159 adoption period relative to similar control firms (i.e., firms that did not adopt the fair value option for their liabilities). The results confirm our main findings of contemporaneous market pricing of fair value gains and losses. The adopters experience an increase in R2 in the value relevance regressions in the postadoption period, while the nonadopters experience a decrease. We further examine how the market adjusts its initial market reaction to liability gains and losses by replacing future 1-year returns with future quarterly returns. We find that it takes at least 4 months for the market to correct its initial reaction to fair value liability gains and losses.
Because FAS 159 disclosures do not specifically require firms to separately report fair value gains and losses from liabilities as a result of changes in a firm’s own credit risk, the majority of firms in our sample do not isolate the reporting of these fair value gains and losses with gains and losses from changes in interest rates and other market conditions. However, for a small subset of firms that clearly isolate the impact of fair value gains and losses due to changes in a firm’s own credit risk, we repeat our value relevance tests to examine whether the liability gains and losses arising from a firm’s own credit risk changes are value relevant. We still find that both gains and losses attributable to changes in a firm’s own credit risk and those attributable to changes in other factors are positively related to stock returns. However, we find that the market overreacts to only fair value liability gains and losses due to firms’ own credit risk.
Our contribution to extant research that addresses the controversy surrounding fair value accounting for liabilities is twofold. First, our study provides more direct and comprehensive evidence on the efficacy of FAS 159. Barth et al. (2008) find that the relation between credit risk changes and equity returns is significantly less negative for firms with more debt. In contrast, by using data on firms that recognize gains and losses from liabilities in the post–FAS 159 period, we are able to provide direct evidence on the market reaction to reported fair value gains and losses from liabilities. Cedergren et al. (2019) also investigate the value relevance of the liability gains and losses using FAS 159 data. However, the authors focus only on the liability gains and losses arising from firms’ credit risk changes as in Barth et al. (2008). The fair value of liabilities can change not only because of a firm’s credit risk change but also because of a change in overall uncertainty in the economy. Our study makes an incremental contribution by investigating the latter factor.
Second, we find evidence that suggests fair value changes in liabilities have different future valuation implications from fair value changes in assets. Specifically, it appears that market participants might have misinterpreted the valuation implications of fair value changes in liabilities when they are first disclosed, thus resulting in a market correction in subsequent periods for firms that report fair value liability gains. To the best of our knowledge, no prior study has examined liability gain mispricing. We believe that our study is of interest to standard setters, regulators, and investors who are concerned about the financial reporting implications of fair valuing liabilities.
The remainder of the article proceeds as follows: The section “Hypothesis Development” develops the hypotheses. The section “Research Design” describes the data and research design. The section “Empirical Results” discusses the main results and the results of additional analyses. The final section presents our conclusions.
Hypothesis Development
Institutional Background
FAS 159 was promulgated to permit firms the option (i.e., the “fair value option”) to measure financial instruments at fair value on an instrument-by-instrument application. Under this standard, firms have the discretion to irrevocably elect fair value as the initial and subsequent measurement attribute for certain financial assets and liabilities. All fair value changes must be reflected in earnings, including fair value changes resulting from changes in market interest rates (and other macroeconomic factors) as well as changes in the firm’s own creditworthiness. To improve transparency, the standard requires various disclosures, including information relating to how changes in fair value affect a firm’s earnings.
The stated objective of FAS 159 is to improve financial reporting by providing firms the opportunity to mitigate artificial volatility in reported earnings caused by measuring related assets and liabilities differently. Adopting this standard will also allow firms to apply the fair value measurement basis to designated derivative assets and liabilities without having to apply complex hedge accounting provisions. Finally, standard setters believe that this standard will expand the use of fair value measurement and help to mitigate some of the limitations of the mixed-attribute reporting model.
Because FAS 159 permits firms to fair value some of their liabilities, it has received considerable attention and resulted in much controversy over whether fair value gains from liabilities reflect economic income. Prior research that has examined this issue provides mixed evidence on whether market participants perceive these gains and losses from liabilities in a similar manner to gains and losses from assets. Koonce et al. (2011) show that investors’ fair value judgments are contingent on whether the financial instrument in question is an asset or a liability, whether fair values produce gains or losses, and whether or not the item will be sold. In addition, the authors find that investors consider fair value changes as more relevant for assets than for liabilities, even when the underlying economics of both types of financial instruments are held constant. On the contrary, there is some empirical evidence that shows equity investors are able to impute the gains and losses from the changes in fair value of liabilities. Specifically, Barth et al. (2008) find that increases (decreases) in equity value are associated with decreases (increases) in debt value arising from increases (decreases) in credit risk, after controlling for the direct effect on equity value of the credit risk change. Thus, their study suggests that the stock market imputes the valuation implications of fair value changes in liabilities in the correct direction, just as it does for fair value changes in assets.
In the following sections, we highlight the main arguments in the debate for and against the fair value measurement of liabilities. 2
Arguments for Recognizing Fair Value Gains and Losses From Liabilities as Income
Better match between assets and liabilities
A central argument for fair valuing a firm’s liabilities is to better align the measurement basis of its liabilities with the measurement basis of its corresponding assets. Measuring liabilities at fair value will lead to a consistent measurement basis on both sides of the balance sheet if a firm has been measuring its assets at fair value. In contrast, if a firm’s assets are measured at fair value but its liabilities are measured at amortized cost, changes in market interest rates or the firm’s credit risk will affect only the fair value measurements of its assets but will not lead to a remeasurement of its liabilities. If the measurement of liabilities does not incorporate the effect of these changes, there is an accounting income mismatch. Consequently, net income (or other comprehensive income) will be distorted by the mismatch and will not properly reflect the underlying economics of the firm. This argument also underlies the FASB’s long-term objective of measuring liabilities at fair value to be consistent with measuring assets at fair value.
Hodder et al. (2006) provide some evidence that supports this argument. They examine properties of GAAP (Generally Accepted Accounting Principles) net income, GAAP comprehensive income, and full fair value income to determine which accounting income measure best reflects firm risk. They find that investors view the volatility of full fair value income as a better measure of firm risk than the other two measures. The authors interpret their results as suggesting that greater inclusion of fair value estimates will lead to reported accounting income that better reflects a firm’s underlying economic risk. In a related study, Hirst et al. (2004) also document that a full fair value income measurement is more likely to enable analysts to reach better-informed value and risk judgments about a firm’s fundamentals.
Wealth transfer between equity and debt holders
Drawing on Merton’s (1974) theoretical framework, Barth et al. (2008) outline the economic justification for fair value measurement of a firm’s liabilities as a wealth transfer between equity and debt holders. 3 Briefly, equity holders have an option to put their firm to debt holders. That is, if the asset value of the firm falls below the value of the debt, the shareholders can transfer the firm to the debt holders. When the value of the firm’s assets decreases, the value of exercising the put option increases. Therefore, the value of the debt decreases to reflect the transfer of wealth from debt holders to equity holders due to the increase in the put option value.
Effectively, debt holders will “share” in the losses of the firm if it becomes insolvent. Therefore, the apparent gain to the firm is essentially an allocation of claims between the firm’s owners and its lenders. Consequently, Barth and Landsman (1995) state that the “fair value accounting for liabilities is conceptually no different than for assets” (p. 104) because the decrease in liabilities’ fair values arising from a deterioration of a firm’s financial condition represents the transfer of wealth from creditors to equity holders.
Arguments Against Recognizing Fair Value Gains and Losses From Liabilities as Income
Realizability issue
If liabilities are seldom transferred, it is not clear whether the firm has the ability to benefit from the change in liability value, even if there is a change in its fair value. A liability transfer usually requires negotiations between the firm (i.e., the debt issuer) and its counterparties (i.e., the debt holders), which often is a lengthy process. Hence, most liabilities are typically held to maturity for redemption at their face value by the firm and typically do not involve debt renegotiation despite changes in the market value of a firm’s debt. Consequently, the economic impact to a firm’s equity holders attributable to changes in the fair values of a firm’s liabilities is unclear. In support of the above argument, Koonce et al. (2011) find that investors’ fair value judgments are contingent on specific contexts even if these judgments appear inconsistent with the predictions of economic theory. Specifically, they find that investors consider fair value changes to be less relevant for liabilities. Investors also view fair value changes as more relevant when firms anticipate selling or settling their financial instruments in the near term compared with held-to-maturity financial instruments. 4
Counterintuitive nature of fair value gains and losses from liabilities
Critics argue that recognizing fair value changes in liabilities, particularly changes in debt value arising from changes in a firm’s own credit risk, will lead to counterintuitive results. The counterintuitive income statement effect argument remains one of the most commonly cited objections to fair valuing liabilities. When liability measurement includes the impact of a firm’s own credit risk, a firm reports an accounting gain from a decline in the credit quality of its liabilities. Opponents of fair value accounting for liabilities argue that this gain is misleading and counterintuitive. Their basic premise is that reporting accounting gains when a firm’s fundamentals deteriorate provides misleading information signals. For example, Lipe (2002) documents that accounting information conveys misleading positive signals when a firm that is approaching bankruptcy uses fair value to measure liabilities, because it reports a gain when its financial strength deteriorates and a loss when its financial strength increases. Relatedly, Gaynor et al. (2011) find that a majority of their survey respondents (i.e., over 70%) misinterpreted fair value gains attributable to a deterioration in a firm’s creditworthiness as a positive signal and fair value losses as a negative signal.
Hypotheses
We address the above issues by empirically examining the valuation implications of fair value gains and losses attributable to fair value changes in liabilities for firms that adopt FAS 159. Our setting allows for a direct test of the above arguments about whether market participants price gains or losses from fair valuing liabilities. Specifically, we are interested in examining whether gains and losses from liabilities are priced in the market. If liability gains and losses are not ignored by investors, we hypothesize that these gains and losses will be positively associated with current period stock returns. We are also interested in whether a negative association between these gains and losses and stock returns will materialize, as critics of fair value accounting for liabilities have contended, given the apparent misleading nature of this earnings component.
Therefore, we test the following hypothesis (stated in null form):
Next, we investigate whether investors correctly understand the future valuation implications of these liability gains. If investors do not understand the different nature (e.g., persistence) of each earnings component and misreact to a specific earnings component, that earnings component can have a significant positive or negative association with future returns. For example, Sloan (1996) shows that total accruals have weaker associations with future earnings than cash flow from operations, but investors do not understand total accruals’ implications for future earnings and overreact to it, leading to negative future returns (the earnings fixation hypothesis). The notion that fair value measurements are associated with firms’ future financial performance has been examined for fair value assets such as investment securities (e.g., Evans et al., 2014) and derivative instruments such as cash flow hedges (e.g., Campbell, 2015). 5 However, prior research has not examined whether reported fair value changes for FAS 159 designated financial liabilities have similar valuation implications to those for financial assets. In this test, a positive association between these gains and losses and future stock returns will suggest that investors are initially pessimistic (optimistic) about the gains (losses) of these firms when they are first reported. On the contrary, a negative association between liability fair value gains and losses and future stock returns will suggest that investors are initially mispricing the gains and losses, that is, optimistic (pessimistic) about the gains (losses). Finally, if the market is efficient and investors correctly understand the nature of each earnings component, the information is incorporated into the stock price in a timely manner and will not have a significant association with future returns.
It is ex ante unclear whether or not investors would impute the valuation implications of liability gains and losses for future earnings correctly. While extant research shows that unrealized fair value asset increases (decreases) reported by firms in the current period have positive (negative) valuation implications, as these gains and losses are eventually realized in subsequent periods by the sale or settlement of these financial instruments (e.g., Park et al., 1999), it is not certain whether reported fair value changes in liabilities are realizable or simply reversed in subsequent periods. Therefore, we state our second hypothesis in the null form, as follows:
Research Design
Sample Selection
We use accounting data and filing dates (10-Q and 10-K) from Compustat, and stock return and price data from Center for Research in Security Prices(CRSP). We hand-collect our main variable of interest, change in fair value of liabilities included in earnings (ΔLIAB). For the hand-collection of ΔLIAB, we first identify firms in the financial industry with nonzero fair value liabilities (Compustat: TFVLQ) and nonzero change in fair value included in earnings for which the fair value option was elected (Compustat: TFVCEQ). Although these firms have nonzero TFVCEQ in the sample period, they may have elected the fair value option only for their assets. Thus, to confirm that they adopted the fair value option for their liabilities, we manually check the 10-Q and 10-K filings of these firms, and drop the firms that record zero liability gains and losses over the entire sample period, assuming that these firms do not adopt the fair value option for their fair-valued liabilities. Some firms record zero liability gains and losses in the early sample period but start recording nonzero liability gains and losses in the middle of the sample period. In this case, we presume that the firms elected the fair value option in the year they start recording nonzero liability gains and losses and drop the observations before the adoption year. We also delete observations whose beginning-of-quarter stock price is below US$3 to mitigate the extreme (small-denominator) effects of low-priced stocks on quarterly returns. We then winsorize all the variables at the top and bottom 1% of the sample distributions. Our final sample consists of 490 firm-quarter observations from the first quarter of 2007 to the first quarter of 2012. 6 Of these 490 firm-quarters, 260 are from banks, 137 from financial companies, and 93 from insurance companies.
Fair value changes in financial liabilities typically arise from either changes in a firm’s own credit risk or overall market interest rate risk. Some firms in our sample provide quantitative information regarding the fair value changes in their liabilities included in earnings as a consequence of changes in the firm’s own credit risk. 7 For these firms, we hand-collect this information (ΔLIAB_CREDIT) to examine its value relevance. After applying the same filtering process used in the above main sample, we obtain 128 firm-quarter observations with fair value gains and losses from liabilities attributable to changes in the firm’s own credit risk. We refer to this sample as the reduced sample.
Models for Testing Hypotheses
We first analyze the valuation implications of the gains and losses from the change in fair value of liabilities included in earnings by estimating the following model that relates stock return to its various earnings components:

where QRETi,t is quarterly risk-adjusted returns from a four-factor model (i.e., the three Fama–French factors and the momentum factor) measured over the period starting 3 trading days after the filing date of the quarter t– 1 10-Q (10-K) to 2 trading days after the filing date of the 10-Q (10-K) in quarter t. 8 We measure quarterly returns up to 2 trading days after the 10-Q and 10-K filing date to ensure that the returns reflect investors’ responses to the information. NI_exclΔFVi,t is income before extraordinary items per share excluding the change in fair values of assets and liabilities included in earnings for which the fair value option was elected. ΔFV_ASSETi,t is per share recognized FAS 159 gains and losses from assets for the quarter. ΔFV_LIABi,t is per share recognized FAS 159 gains and losses from liabilities for the quarter. Thus, NI_exclΔFVi,t represents income that excludes the effect of fair value changes in assets and liabilities. ΔNIi,t is the seasonal change in earnings per share before extraordinary items, defined as ΔNIi,t = NIi,t– NIi,t–4. Finally, Yeart-Quartert captures year-quarter fixed effects. We scale each income variable by beginning-of-quarter market price.
We hypothesize that the coefficient on ΔFV_LIABi,t, our main variable of interest, is positive if the market reflects the information in fair value gains and losses from liabilities. In contrast, this coefficient will not be reliably different from zero if fair value gains and losses from liabilities are not value relevant or if there are significant reliability concerns regarding their measurement. Consistent with the results from prior research, we expect positive coefficients on NI_exclΔFVi,t and ΔFV_ASSETi,t.
For the test of H2, we replace QRETi,t in Model (1) with future 1-year risk-adjusted return (RET_1YR) measured over the period starting 3 trading days after the quarter t 10-Q (10-K) filing date to 2 trading days after the quarter t+ 4 10-Q (10-K) filing date. 9 We then estimate the following model:

In all our regression tests, we use standard errors clustered by firm and year to account for within-firm and within-year correlations in residuals. 10
Empirical Results
Univariate Analyses
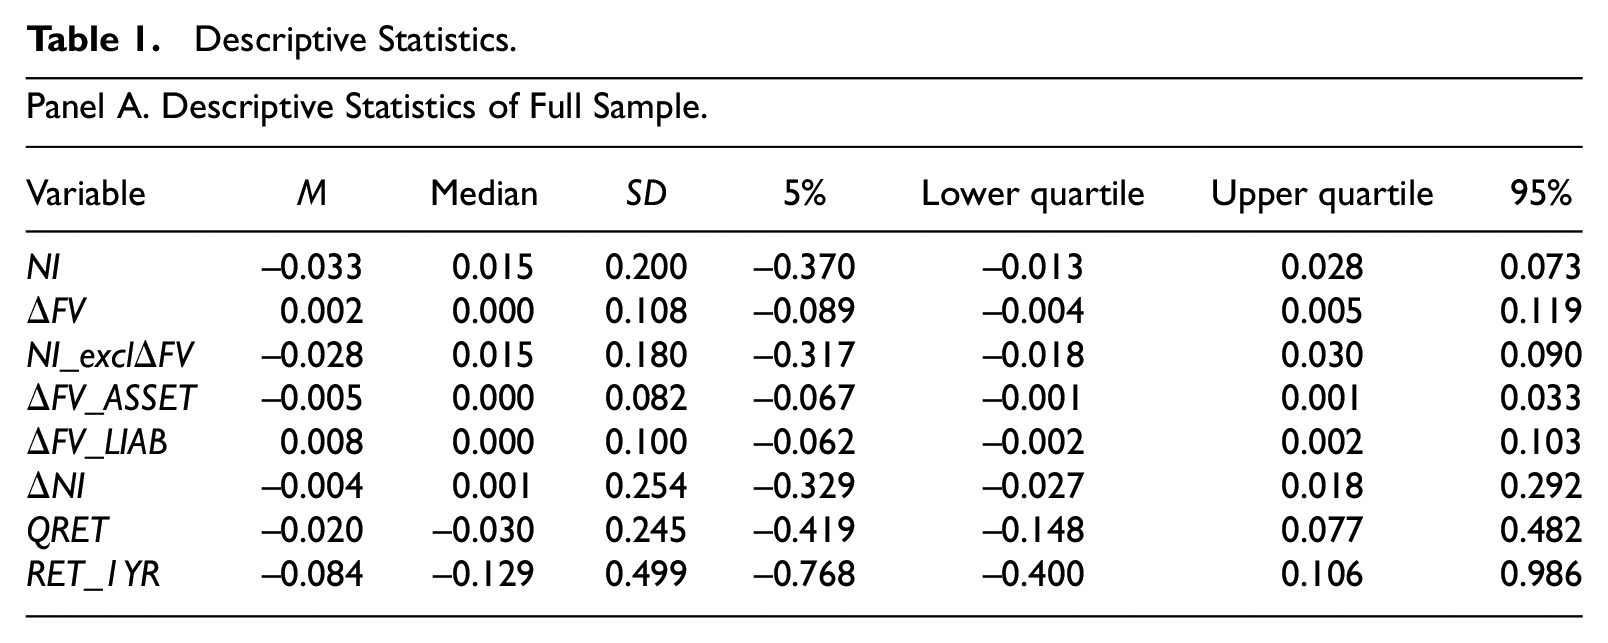
Table 1, Panel A, presents descriptive statistics for the variables. The averages of quarterly risk-adjusted returns based on the four-factor model (QRET), 1-year-ahead future risk-adjusted returns (RET_1YR), income before extraordinary items (NI), and change in NI (ΔNI) are all negative. This is expected because our sample period includes the 2008 crisis period and the sample firms are in the financial industries, which were the most negatively affected during the crisis period. The standard deviations of ΔFV_ASSET and ΔFV_LIAB (0.082 and 0.100) are about 50% of the standard deviation of NI, which indicates that fair value changes included in earnings have a significant effect on the firm’s earnings for our sample firms.
Descriptive Statistics.
Panel B. Correlation Matrix for Key Variables.
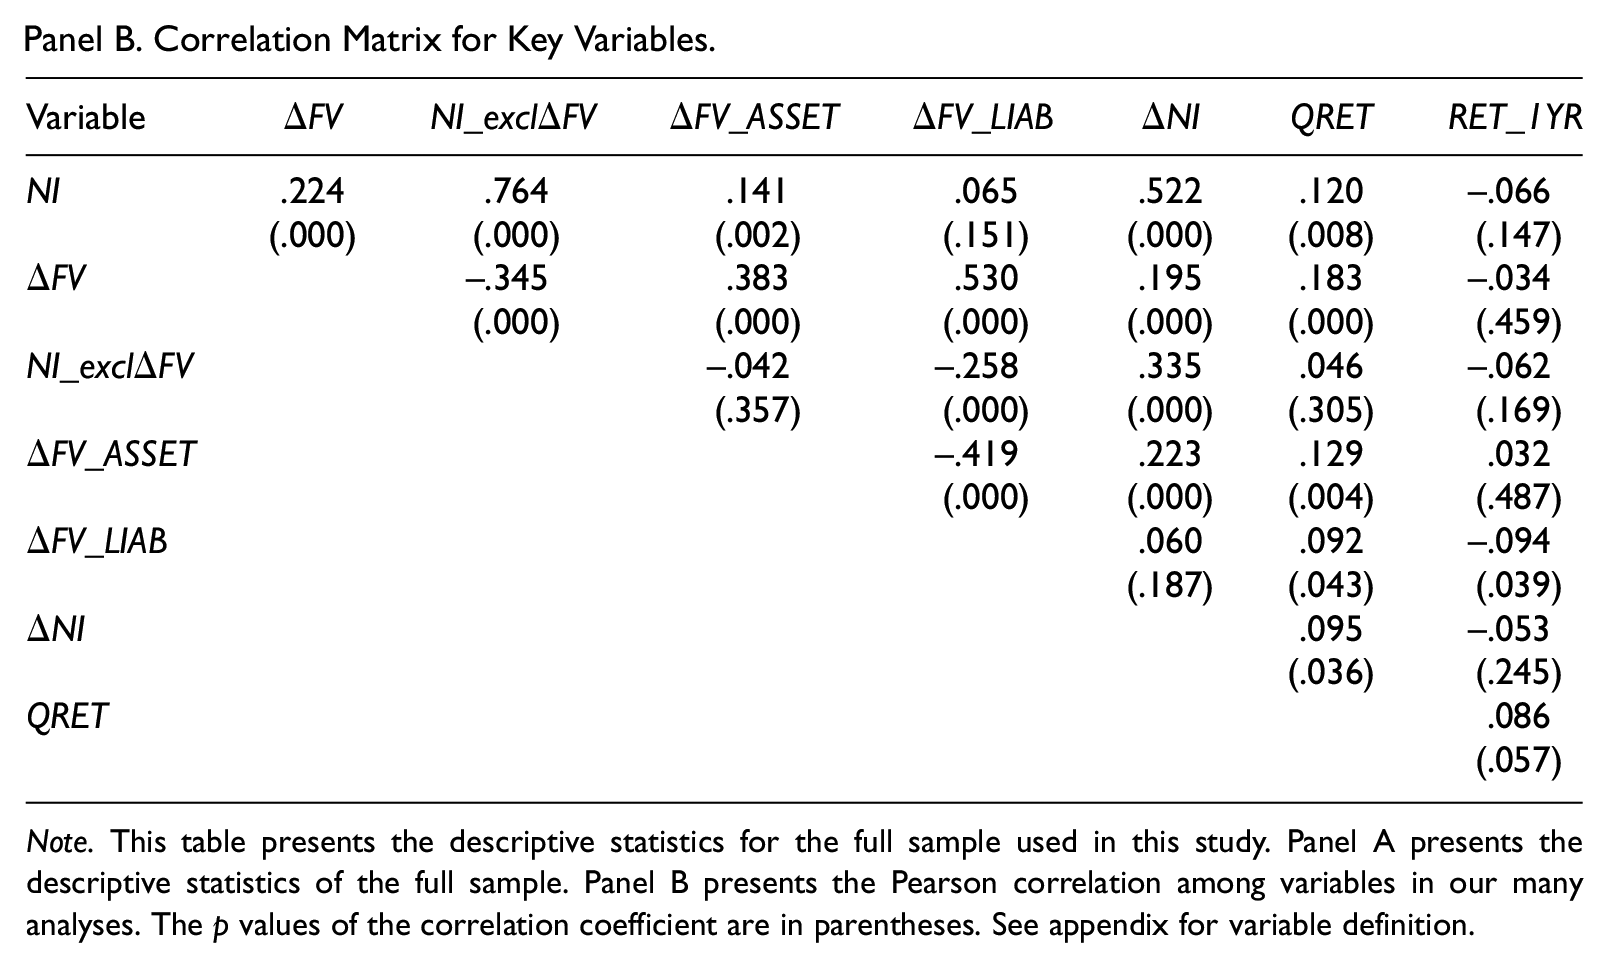
Note. This table presents the descriptive statistics for the full sample used in this study. Panel A presents the descriptive statistics of the full sample. Panel B presents the Pearson correlation among variables in our many analyses. The p values of the correlation coefficient are in parentheses. See appendix for variable definition.
Table 1, Panel B, presents the Pearson correlations among the key variables employed in our empirical analyses. We find a significantly positive correlation between QRET and ΔFV_LIAB. Also, Panel B reports a significantly negative correlation between RET_1YR and ΔFV_LIAB. Because these univariate correlations do not control for other effects, we defer tests of our hypotheses, H1 and H2, to the results of multivariate analyses discussed in the subsequent sections. 11
Association With Contemporaneous Stock Returns (H1)
In this section, we present regression results to test our two hypotheses. All tabulated regression results control for time effects (i.e., year-quarter). 12 Table 2 presents the results on the value relevance of earnings components. The first column shows the results of the basic value relevance test with earnings (NI) and the change in earnings (ΔNI). The coefficients of the two variables are positive but insignificant at conventional levels. 13 However, when we decompose NI into its respective components (NI_exclΔFV and ΔFV) in the second column, we find a significant positive association (0.091, t = 2.02) between QRET and NI_exclΔFV. We also find a significant positive relation (coefficient = 0.420, t = 2.12) between QRET and ΔFV. In the third column, we further decompose ΔFV into ΔFV_ASSET and ΔFV_LIAB, and find that both ΔFV_ASSET and ΔFV_LIAB are value relevant. Specifically, the coefficient on ΔFV_ASSET is 0.570 (t = 3.39), and the coefficient on ΔFV_LIAB is 0.302 (t = 2.83). The magnitude of the coefficient on ΔFV_LIAB is smaller than that of ΔFV_ASSET (difference is significant at the 1% level).
Value Relevance Tests.
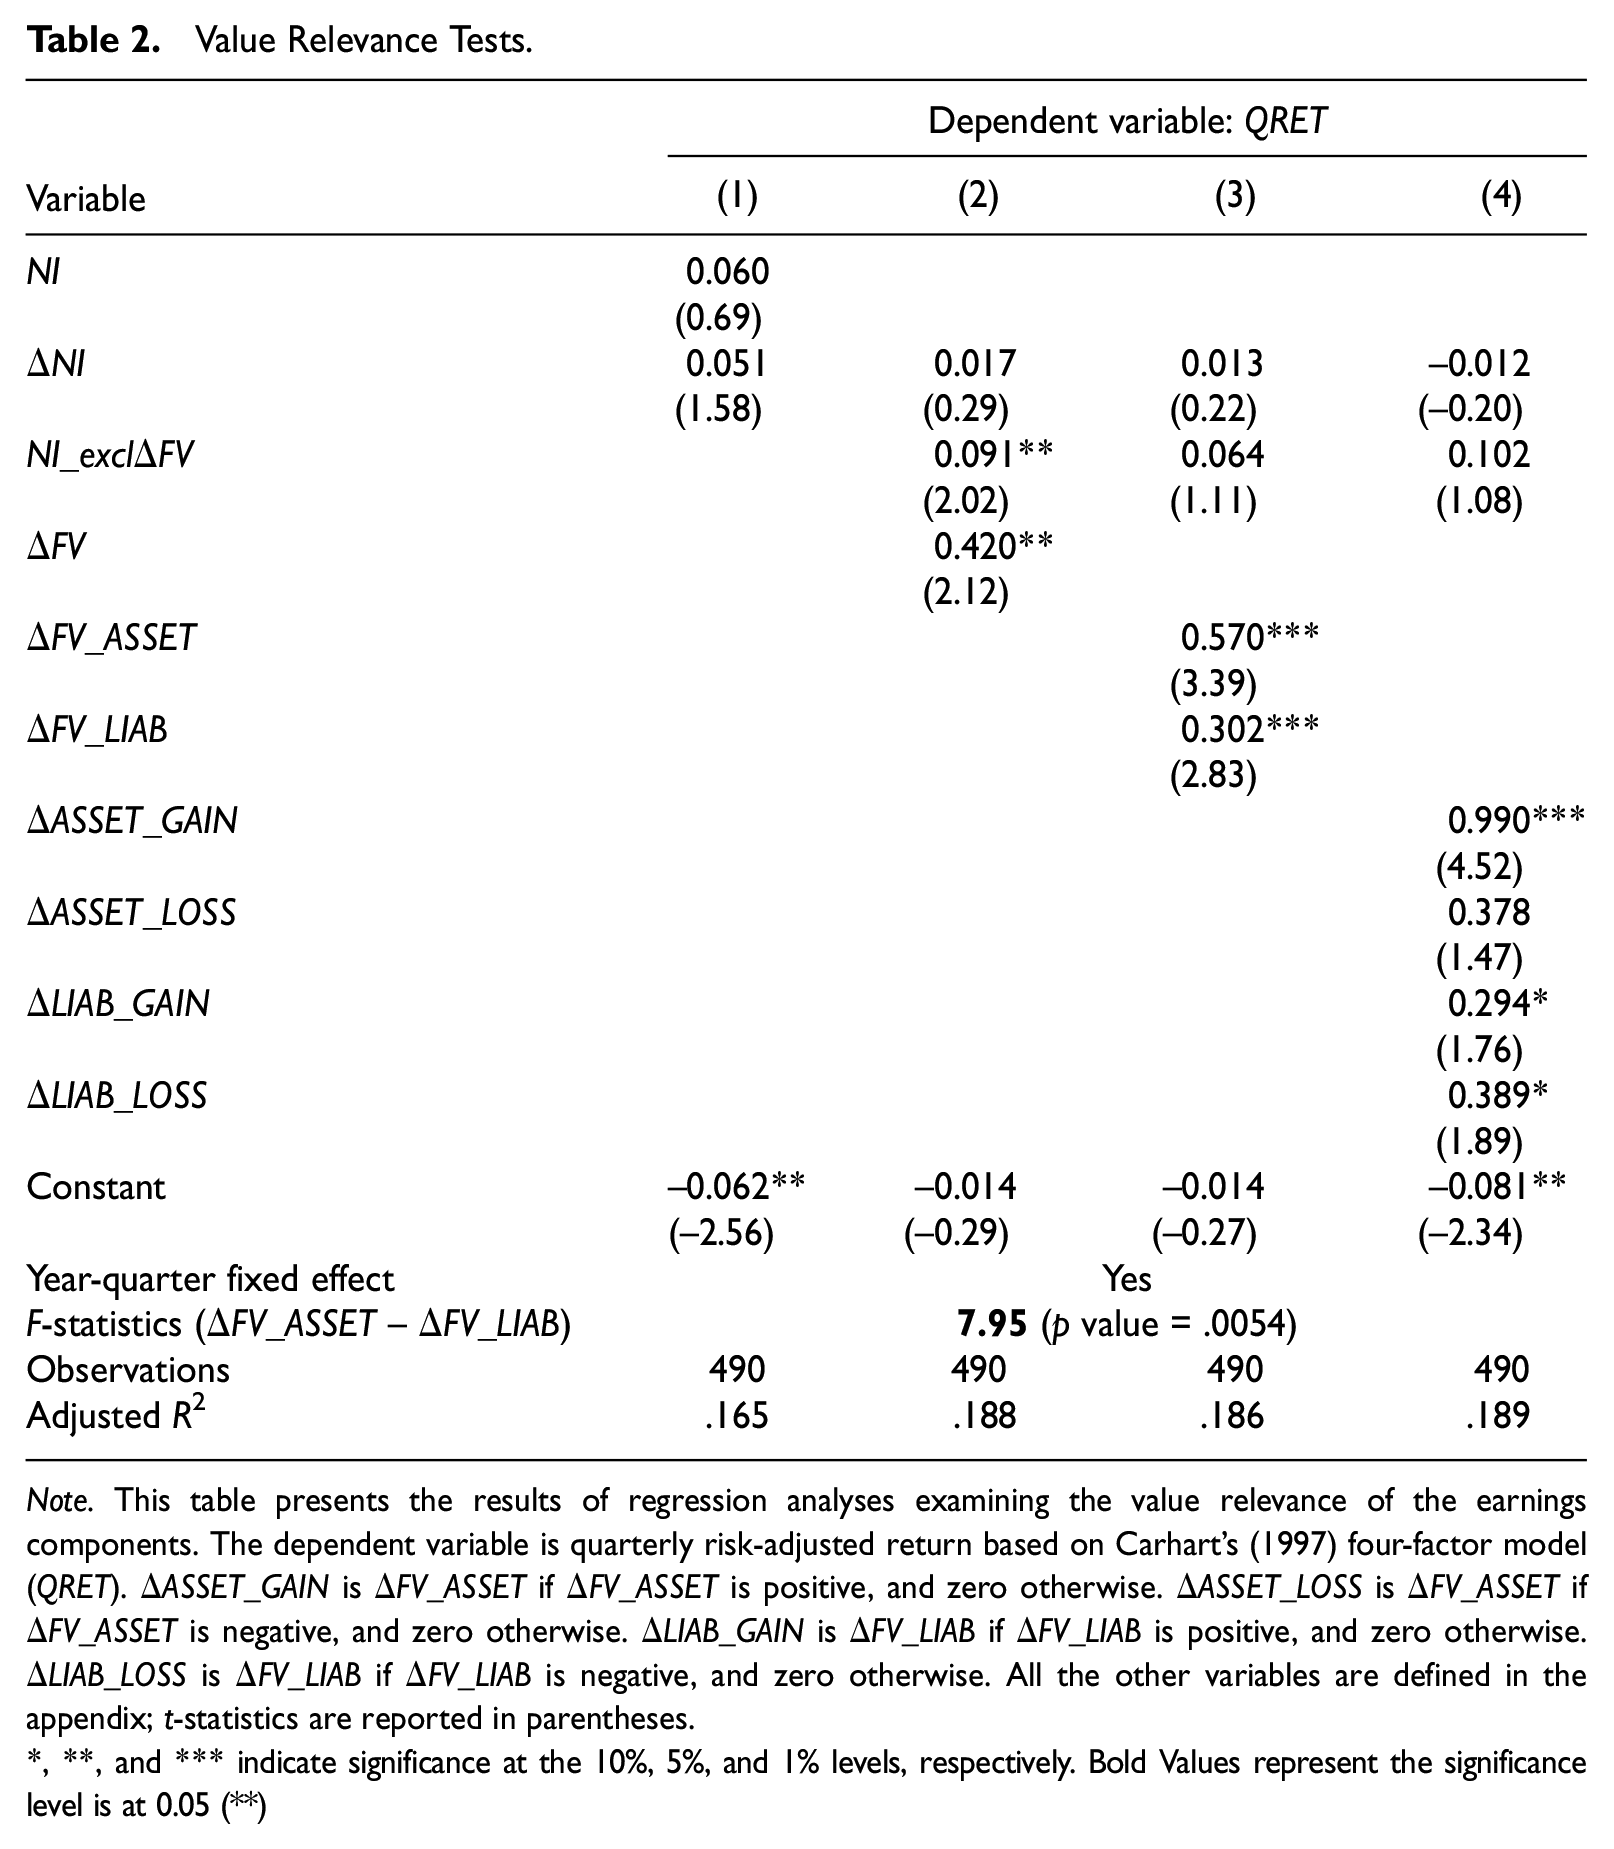
Note. This table presents the results of regression analyses examining the value relevance of the earnings components. The dependent variable is quarterly risk-adjusted return based on Carhart’s (1997) four-factor model (QRET). ΔASSET_GAIN is ΔFV_ASSET if ΔFV_ASSET is positive, and zero otherwise. ΔASSET_LOSS is ΔFV_ASSET if ΔFV_ASSET is negative, and zero otherwise. ΔLIAB_GAIN is ΔFV_LIAB if ΔFV_LIAB is positive, and zero otherwise. ΔLIAB_LOSS is ΔFV_LIAB if ΔFV_LIAB is negative, and zero otherwise. All the other variables are defined in the appendix; t-statistics are reported in parentheses.
, **, and *** indicate significance at the 10%, 5%, and 1% levels, respectively. Bold Values represent the significance level is at 0.05 (**)
In Column (4), we decompose ΔFV_ASSET and ΔFV_LIAB into gains and losses (ΔASSET_GAIN, ΔASSET_LOSS, ΔLIAB_GAIN, and ΔLIAB_LOSS). We find a significant result only for ΔASSET_GAIN (0.990, t = 4.52) but not for ΔASSET_LOSS (0.378, t = 1.47). In contrast, we find that both gains and losses from the fair value changes in liabilities are significant at the 10% level (0.294, t = 1.76 vs. 0.389, t = 1.89).
Overall, the results of the multivariate analyses based on contemporaneous market reactions suggest that investors price information about reported FAS 159 fair value liability gains and losses. In the next section, we assess whether the contemporaneous market reactions reflect mispricing by focusing on future (1-year-ahead) market returns.
Association With Future Returns (H2)
To test our second hypothesis, we examine whether investors efficiently incorporate the information in each earnings component into stock price. More specifically, we study the association between each earnings component and future 1-year return.
Table 3 shows that there is no significant association between ΔNI (and NI_exclΔFV) and future returns. However, we do find a significant negative coefficient on ΔFV_LIAB (–0.476, t = −13.13). For fair value liabilities, when we compare the coefficients on ΔFV_LIAB in Tables 2 and 3 (i.e., 0.302 and −0.476), the results suggest that investors misreacted to the initial disclosure of the information and this misreaction reverses in subsequent quarters. In Column (2), we decompose ΔFV_LIAB into gains and losses (ΔLIAB_GAIN and ΔLIAB_LOSS). We find that the misreaction is primarily attributable to fair value liability gains (–0.483, t = −2.56) and not to fair value liability losses (–0.529, t = −1.61). Contrary to the other earnings components that do not reverse within the next 12 months, an interpretation of these findings is that market participants subsequently reverse their interpretation of the information in these fair value gains from liabilities. A possible reason is that they find out that these gains are not realizable or they are more aware of the deteriorating fundamentals of these firms that lead to the recognition of the fair value gains in the first place.
One-Year-Ahead Return Tests.
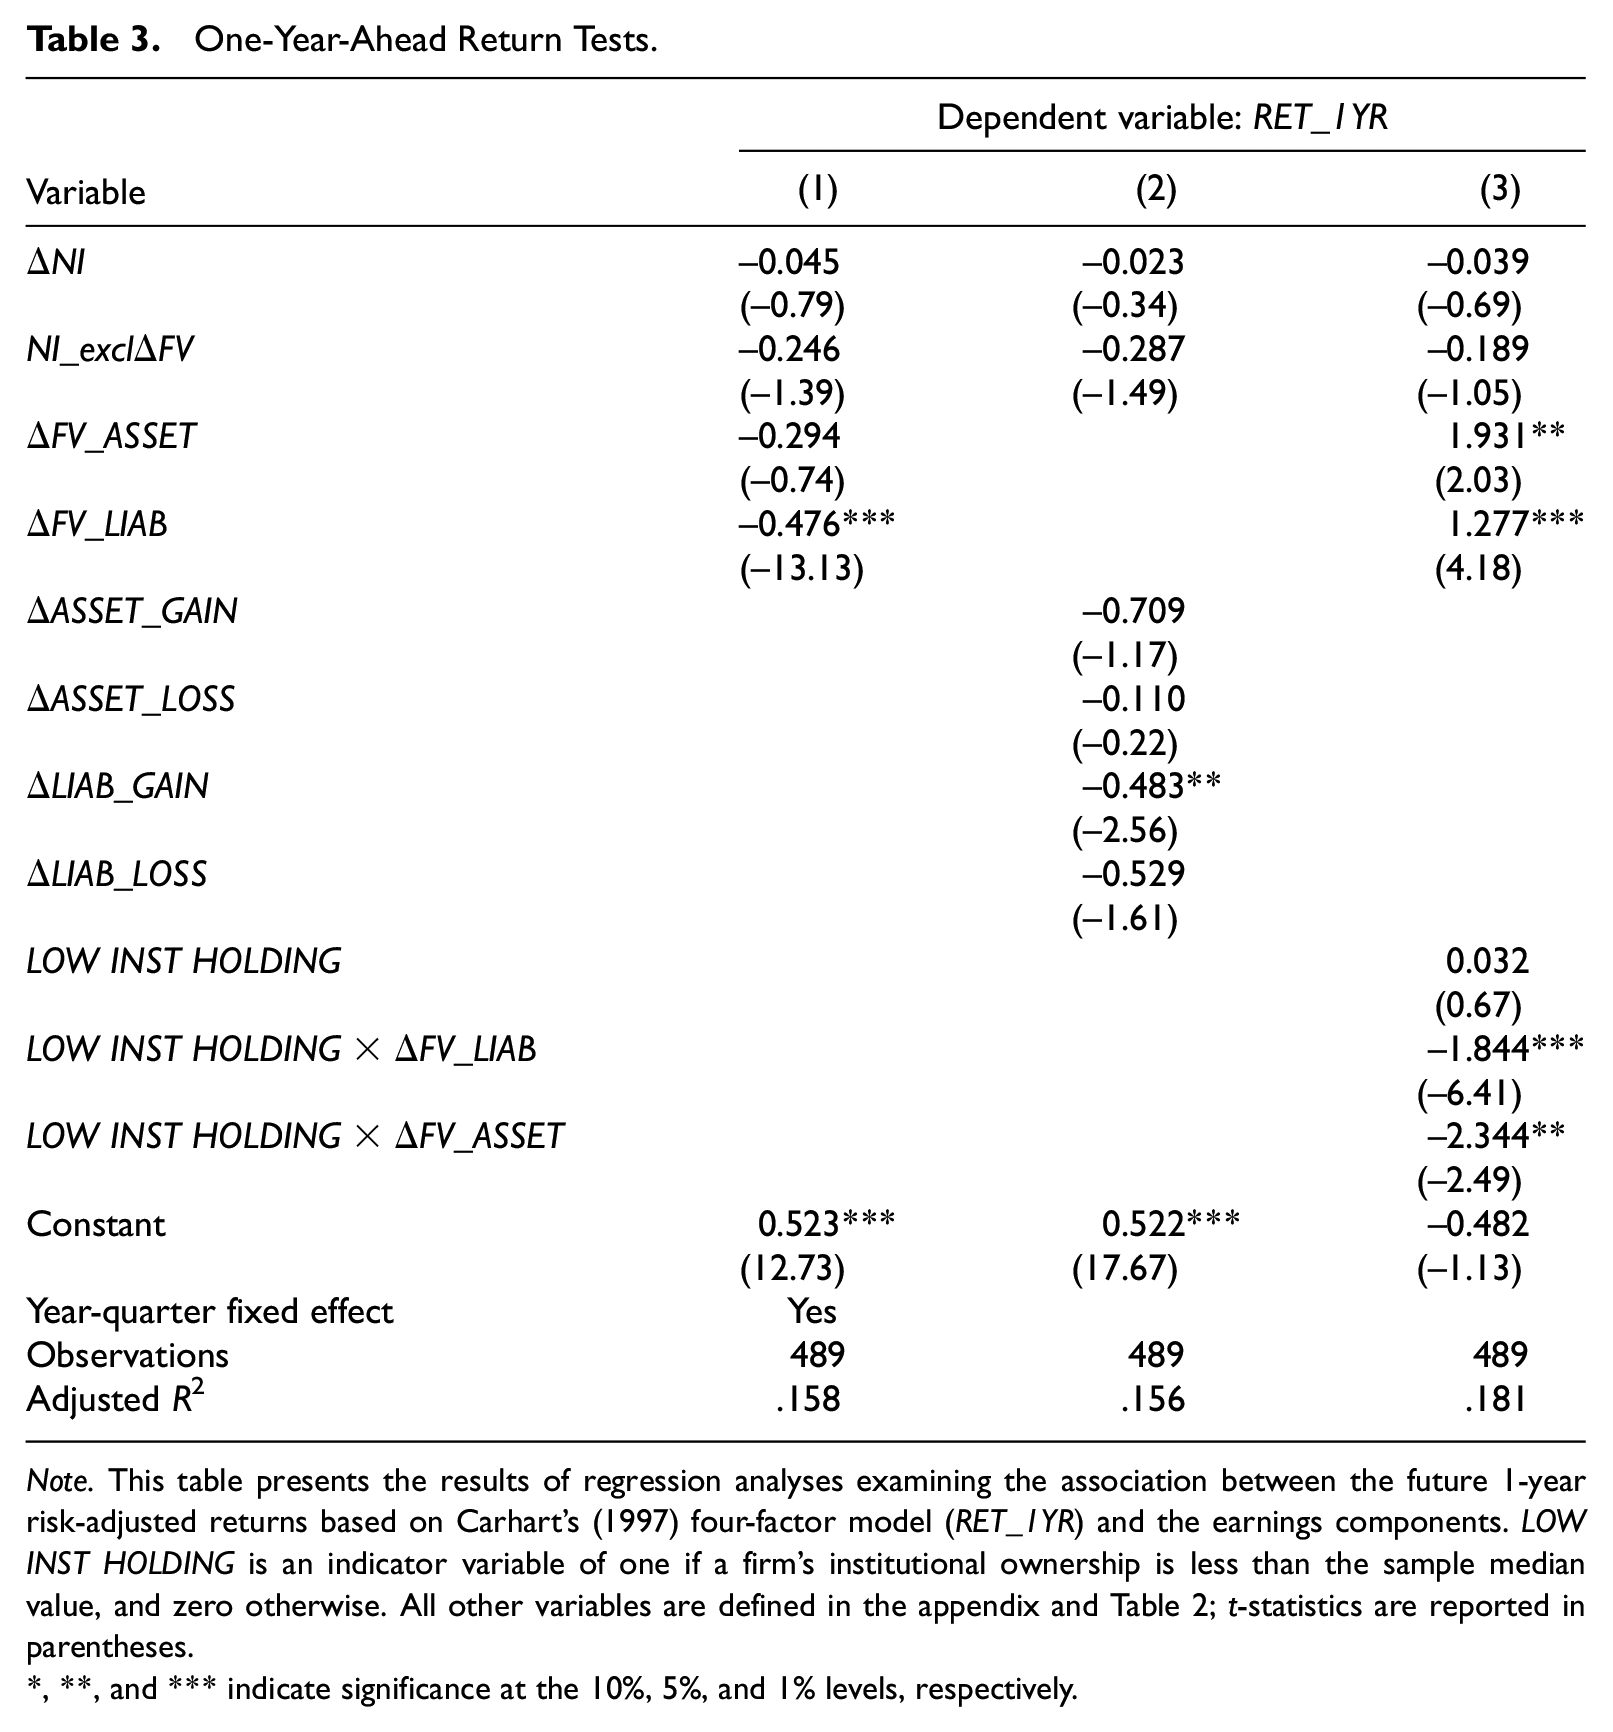
Note. This table presents the results of regression analyses examining the association between the future 1-year risk-adjusted returns based on Carhart’s (1997) four-factor model (RET_1YR) and the earnings components. LOW INST HOLDING is an indicator variable of one if a firm’s institutional ownership is less than the sample median value, and zero otherwise. All other variables are defined in the appendix and Table 2; t-statistics are reported in parentheses.
, **, and *** indicate significance at the 10%, 5%, and 1% levels, respectively.
In Column (3), we investigate whether the role of market participants in adjusting their initial market reaction to the fair value changes in assets and liabilities varies by institutional ownership. We expect a stronger price adjustment for firms with low institutional ownership. The results are consistent with this expectation. They suggest that the negative coefficient on ΔFV_LIAB in Column (1) is mostly driven by the firms with low institutional ownership. Specifically, we find a negative coefficient on the interaction variable LOW INST HOLDING×ΔFV_LIAB (–1.844 and t = −6.41). 14 These results suggest that the market mispricing of FAS 159 gains and losses from liabilities is more pronounced among firms with low institutional ownership. 15
Additional Analyses
Difference-in-differences test: Value relevance of liability gains and losses
In the previous section, we show the contemporaneous pricing of fair value gains and losses from liabilities. With respect to the contemporaneous market reaction, we conduct a difference-in-differences test to confirm whether the market reactions to fair value gains and losses from liabilities are driven by the adoption of FAS 159. We select control firms using the following criteria: the log of total assets (SIZE); the ratios of fair value assets (FV_ASSET), fair value liabilities (FV_LIAB), and derivatives (DERIVATIVES) to total assets; and earnings volatility (EARN VOLATILITY). Large firms are more likely to have complex financial products. Thus, these firms are more likely to adopt FAS 159 to reduce the burden of complicated hedge accounting. For the same reason, we conjecture that firms that use derivatives are more likely to adopt FAS 159. Another stated objective of FAS 159 is to reduce income volatility caused by different measurement bases for a firm’s assets and liabilities. Therefore, we expect that earnings volatility is a determinant of FAS 159 adoption. We also reason that firms that elect FAS 159 for their liabilities tend to have a higher proportion of fair value assets and liabilities to total assets.
Table 4 presents the results of the propensity score matching (PSM) criteria for selecting the control sample firms. Based on the propensity score (with a maximum caliper of 0.05 and without replacement), we select the control sample through one-to-one matching. We use a probit regression specification as our determinants’ model for whether the firm adopts FAS 159 or not (ADOPTION). As expected, Panel A of Table 4 shows that the coefficients of SIZE and FV_LIAB are statistically significant and have the expected signs. In contrast, the coefficients of FV_ASSET, DERIVATIVES, and EARN VOLATILITY are not significant, although their signs are in the predicted direction. Panel B of Table 4 reports the univariate differences of the treatment firms and the control firms to ensure that our PSM procedure properly matches the treatment and control firms. As reported in Panel B, the univariate differences across the five characteristics suggest that the treatment and control firms are similar across our matching criteria.
Treatment and Control Firm Selection for Difference-in-Differences Test.Panel A: Selection Model.
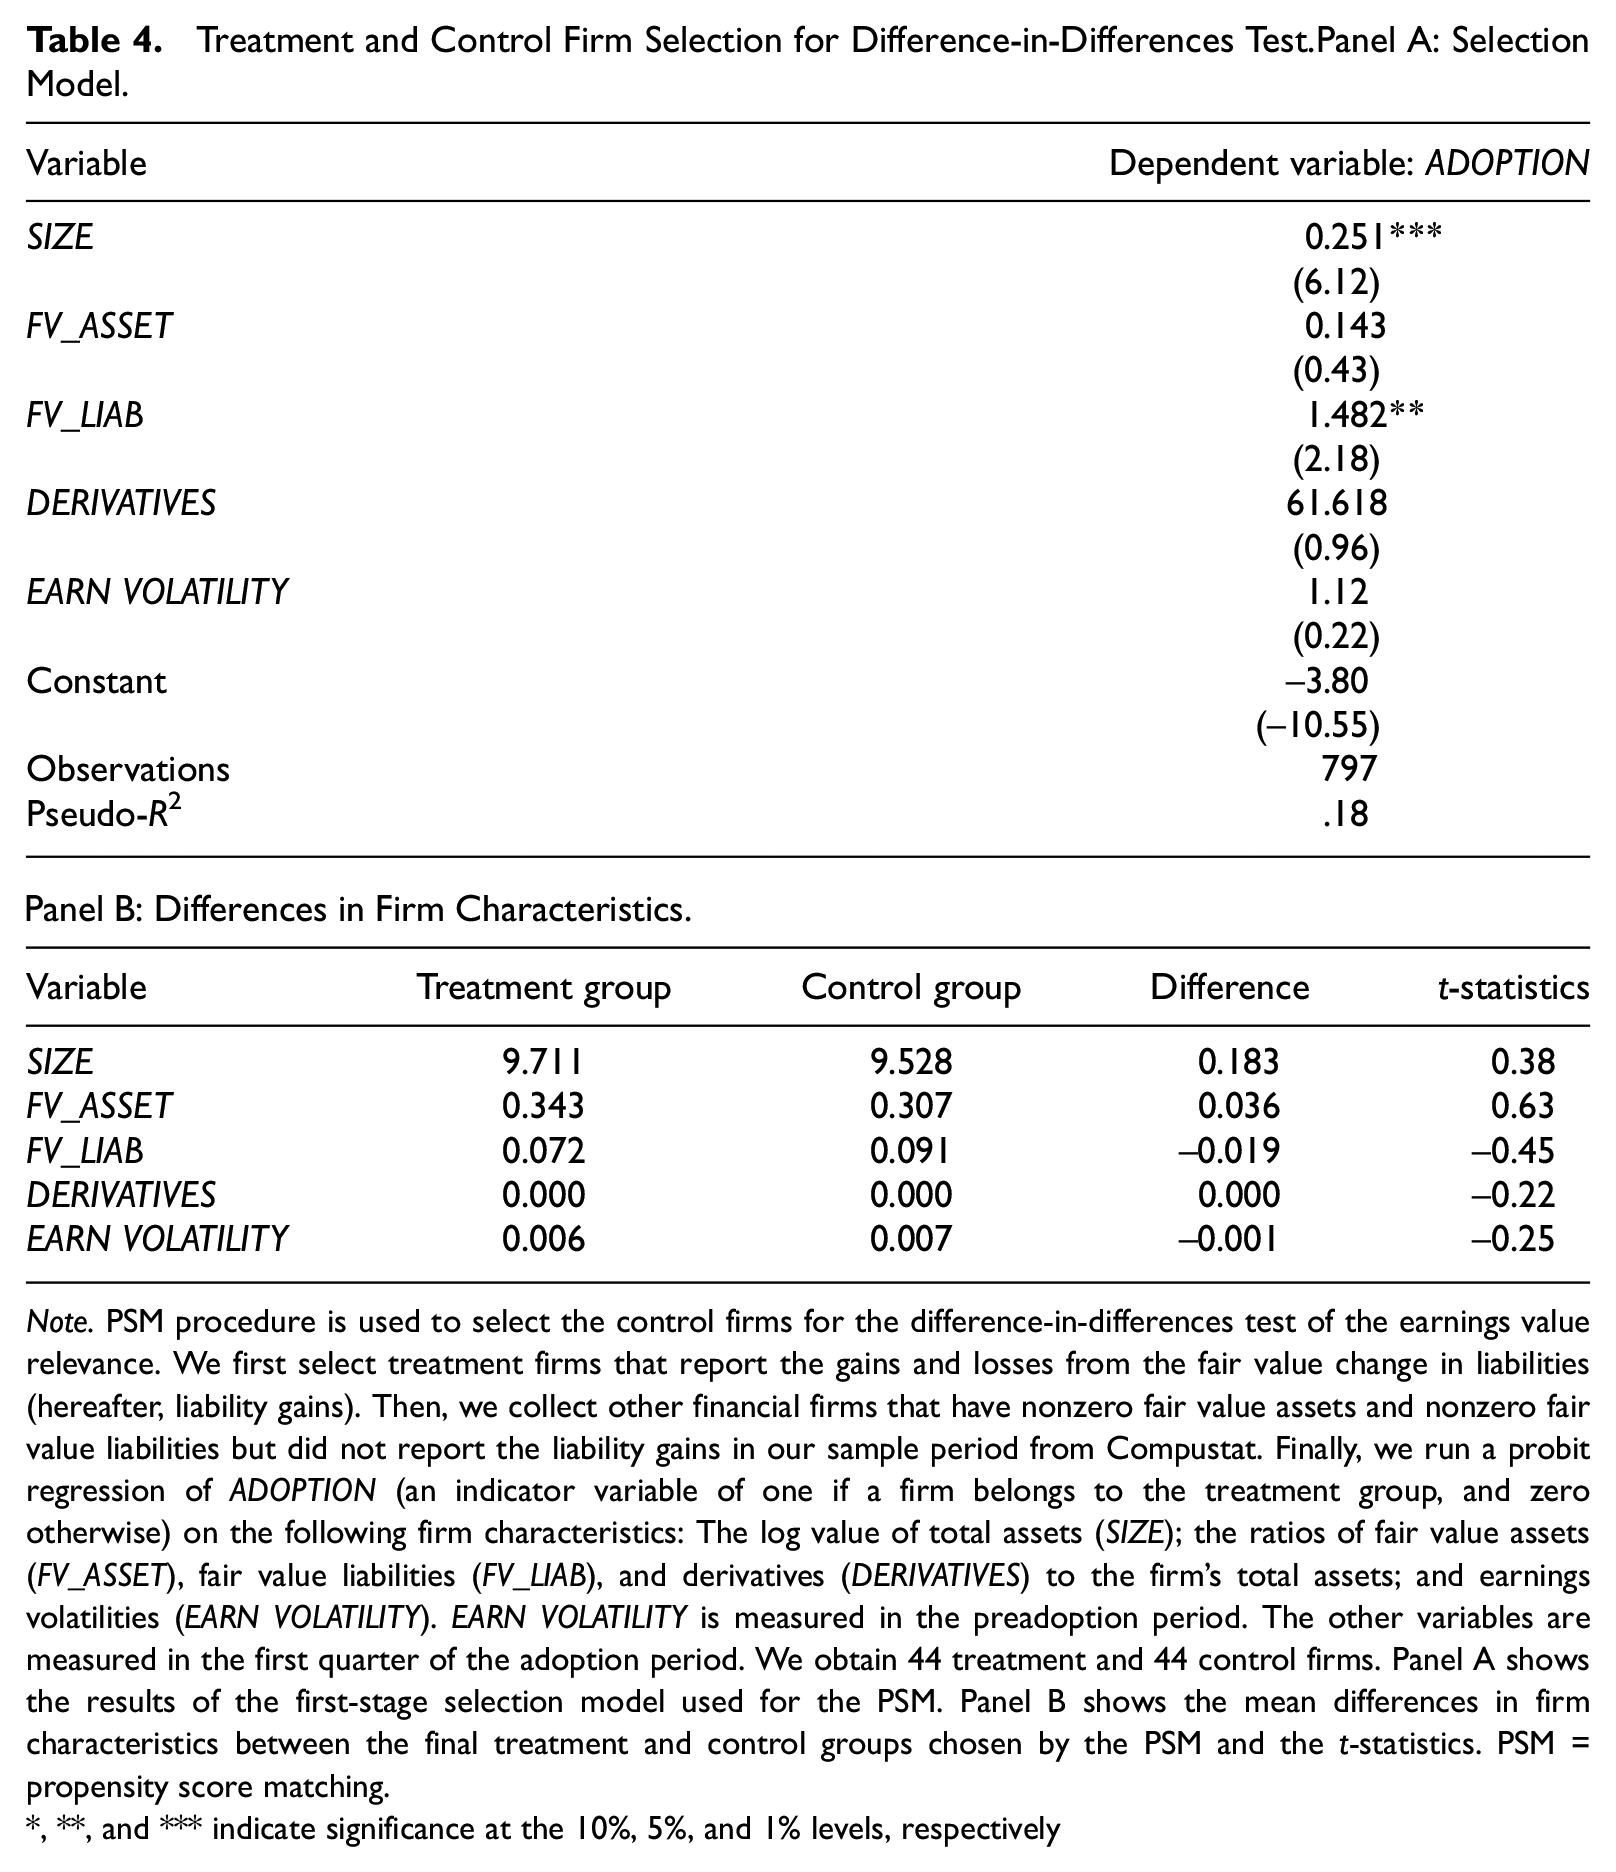
Note. PSM procedure is used to select the control firms for the difference-in-differences test of the earnings value relevance. We first select treatment firms that report the gains and losses from the fair value change in liabilities (hereafter, liability gains). Then, we collect other financial firms that have nonzero fair value assets and nonzero fair value liabilities but did not report the liability gains in our sample period from Compustat. Finally, we run a probit regression of ADOPTION (an indicator variable of one if a firm belongs to the treatment group, and zero otherwise) on the following firm characteristics: The log value of total assets (SIZE); the ratios of fair value assets (FV_ASSET), fair value liabilities (FV_LIAB), and derivatives (DERIVATIVES) to the firm’s total assets; and earnings volatilities (EARN VOLATILITY). EARN VOLATILITY is measured in the preadoption period. The other variables are measured in the first quarter of the adoption period. We obtain 44 treatment and 44 control firms. Panel A shows the results of the first-stage selection model used for the PSM. Panel B shows the mean differences in firm characteristics between the final treatment and control groups chosen by the PSM and the t-statistics. PSM = propensity score matching. *, **, and *** indicate significance at the 10%, 5%, and 1% levels, respectively
In Table 5, we report the average adjusted R2s of the value relevance regressions (QRETi,t = α0+α1NI+α2ΔNIi,t+ei,t) for fair value option adopters versus nonadopters in the pre– and the post–FAS 159 adoption periods by focusing on the explanatory power provided by the fair value gains and losses from liabilities. However, in the post–FAS 159 period, many firms adopt the fair value option not only for their liabilities but also for their assets. Even if the average adjusted R2s of the value relevance regressions increase in the postadoption period, we would not be able to discern whether the increase is because of the value relevance of the fair value asset gains or of the fair value liability gains. To address this concern, for adopters, we first separate NI into NI_exclΔFV, ΔFV_ASSET, and ΔFV_LIAB. Then, we estimate the following regression without ΔFV_ASSET in the post–FAS 159 period:

As long as ΔFV_ASSET is value relevant, we expect that the exclusion of the ΔFV_ASSET will lower the average adjusted R2 and make it harder to observe the increase in the average adjusted R2 in the post–FAS 159 period for adopters.
Difference-in-Differences Value Relevance Test.
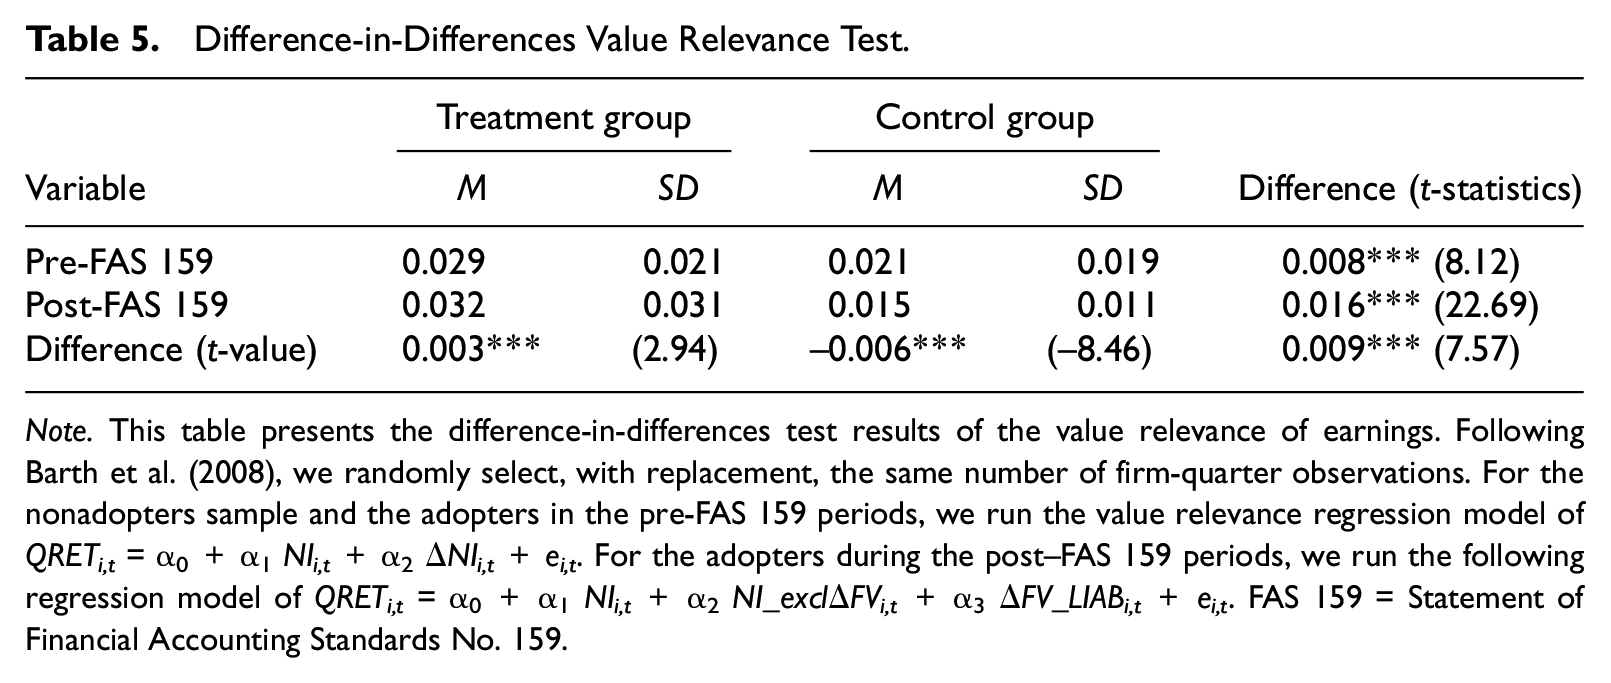
Note. This table presents the difference-in-differences test results of the value relevance of earnings. Following Barth et al. (2008), we randomly select, with replacement, the same number of firm-quarter observations. For the nonadopters sample and the adopters in the pre-FAS 159 periods, we run the value relevance regression model of QRETi,t = α0+α1NIi,t+α2ΔNIi,t+ei,t. For the adopters during the post–FAS 159 periods, we run the following regression model of QRETi,t = α0+α1NIi,t+α2NI_exclΔFVi,t+α3ΔFV_LIABi,t+ei,t. FAS 159 = Statement of Financial Accounting Standards No. 159.
Following Barth et al. (2008), we randomly select 1,000 samples, with replacement, with the same number of firm-quarter observations and estimate this regression model for each sample. We thus obtain 1,000 R2s for each group. The results show that the average adjusted R2 of the value relevance regressions is significantly greater in the post–FAS 159 period for the adopter group than in the pre-period. The difference (0.003) is statistically significant at the .01 level. In contrast, the average adjusted R2 for the control group (nonadopters) decreased in the post-period. 16
Reversing market reactions
Of additional interest is how long it takes for the market to reverse its initial reaction to gains (losses) from fair value changes in assets and liabilities. This is especially so if the reversal in fair value liability changes signals credit risk deterioration (improvement). To address this concern, we re-estimate Equation 2 after replacing 1-year future returns with quarterly future returns.
Table 6 presents the regression results for four different quarters. For the fair value liability gains and losses, we find that the reversals in market reaction are observed in the second and the fourth quarters. This result suggests that it takes time for market participants to understand the information content of gains and losses from fair value liabilities.
Future Returns by Each Quarter.
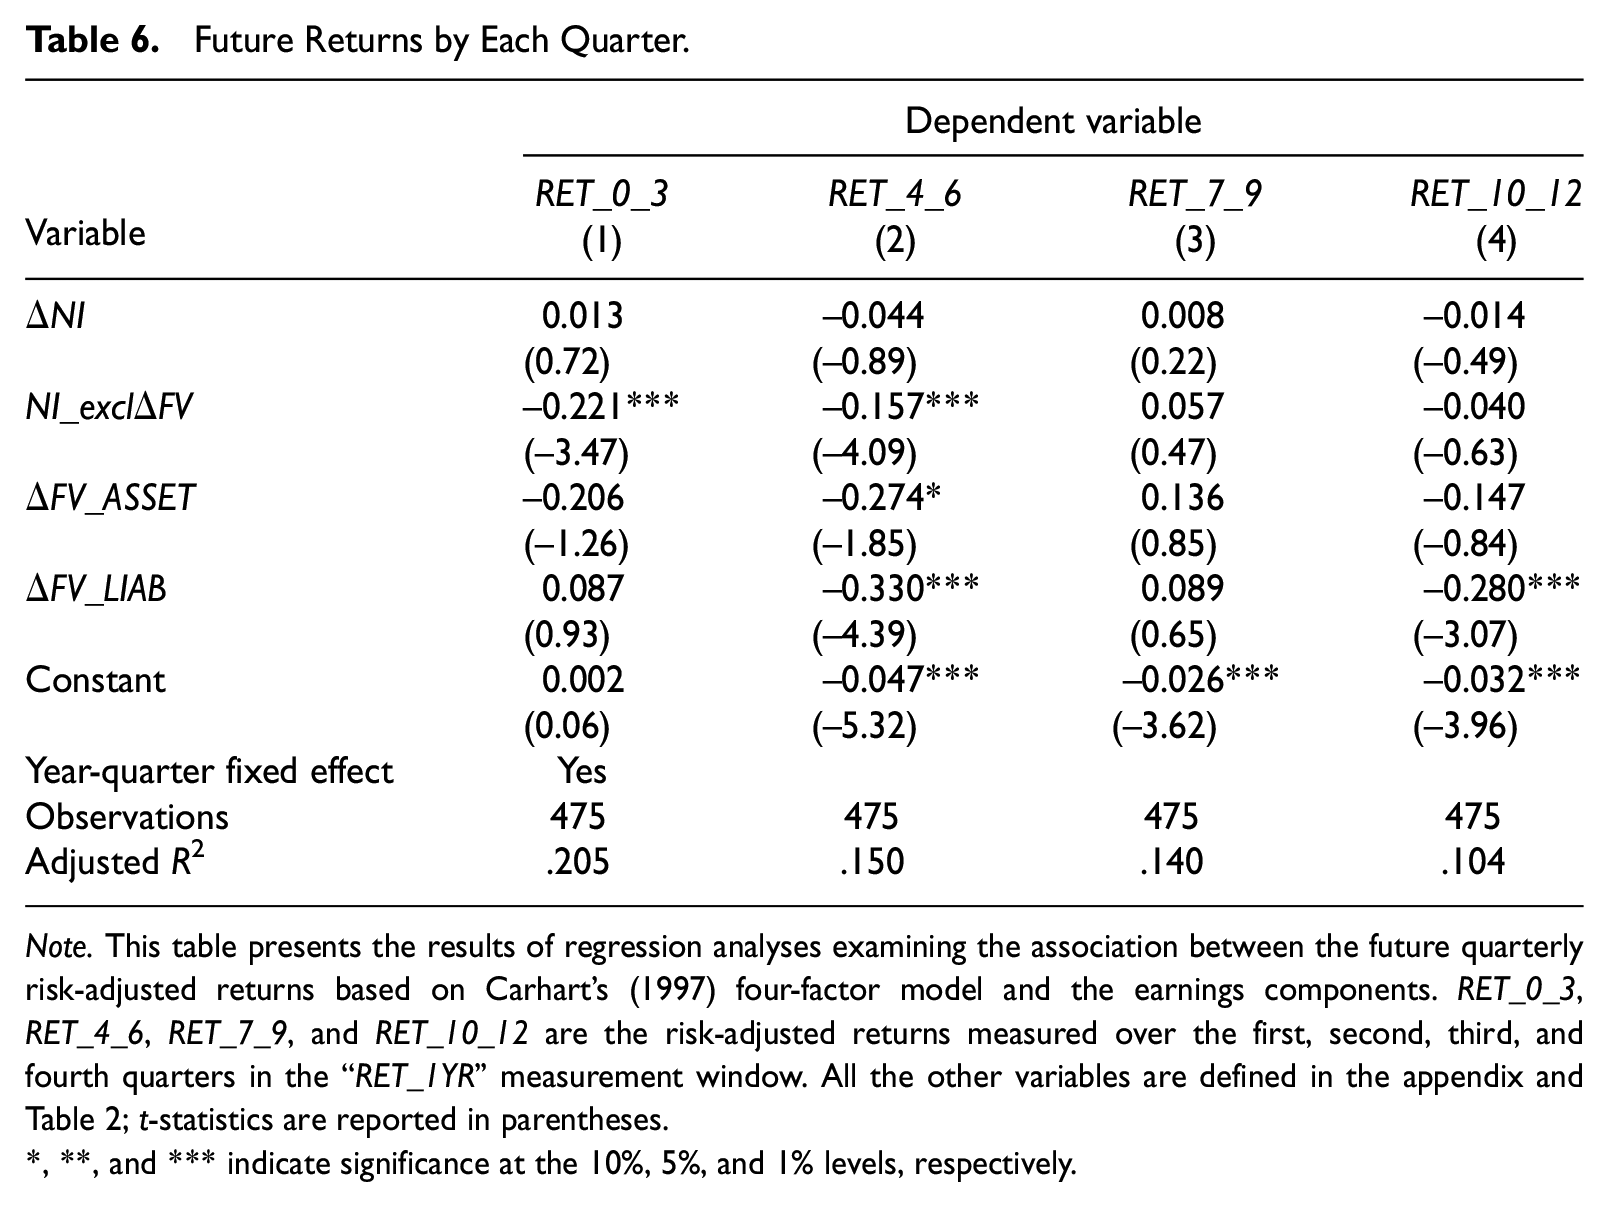
Note. This table presents the results of regression analyses examining the association between the future quarterly risk-adjusted returns based on Carhart’s (1997) four-factor model and the earnings components. RET_0_3, RET_4_6, RET_7_9, and RET_10_12 are the risk-adjusted returns measured over the first, second, third, and fourth quarters in the “RET_1YR” measurement window. All the other variables are defined in the appendix and Table 2; t-statistics are reported in parentheses.
, **, and *** indicate significance at the 10%, 5%, and 1% levels, respectively.
Controlling for self-selection
Not all firms elect FAS 159 for their financial instruments. To address endogeneity concerns arising from this potential self-selection issue, we add firms that have fair-valued liabilities but do not choose fair value options for the liabilities to the main sample, compute the Inverse Mills ratio with the selection model used in Table 4, and re-estimate our main regressions after controlling for endogeneity by including the Inverse Mills ratio. 17
Table 7 reports the results of the value relevance analyses after addressing this concern. We obtain similar results that are comparable with our earlier results. Specifically, Column (2) of Table 7 shows that the fair value changes from FAS 159 adoption are positively related to quarterly returns (0.756, t = 2.96). When we decompose ΔFV into ΔFV_ASSET and ΔFV_LIAB, we continue to find that both ΔFV_ASSET and ΔFV_LIAB are priced by the market. Finally, we decompose ΔFV_ASSET and ΔFV_LIAB into gains and losses (ΔASSET_GAIN, ΔASSET_LOSS, ΔLIAB_GAIN, and ΔLIAB_LOSS). Similar to our earlier results, we find that the market reflects the information in both gains and losses from the fair value changes in assets. We also find significant coefficients for ΔLIAB_GAIN (0.534, t = 1.75) and ΔLIAB_LOSS (1.084, t = 1.73).
Value Relevance Tests After Controlling for Endogeneity.
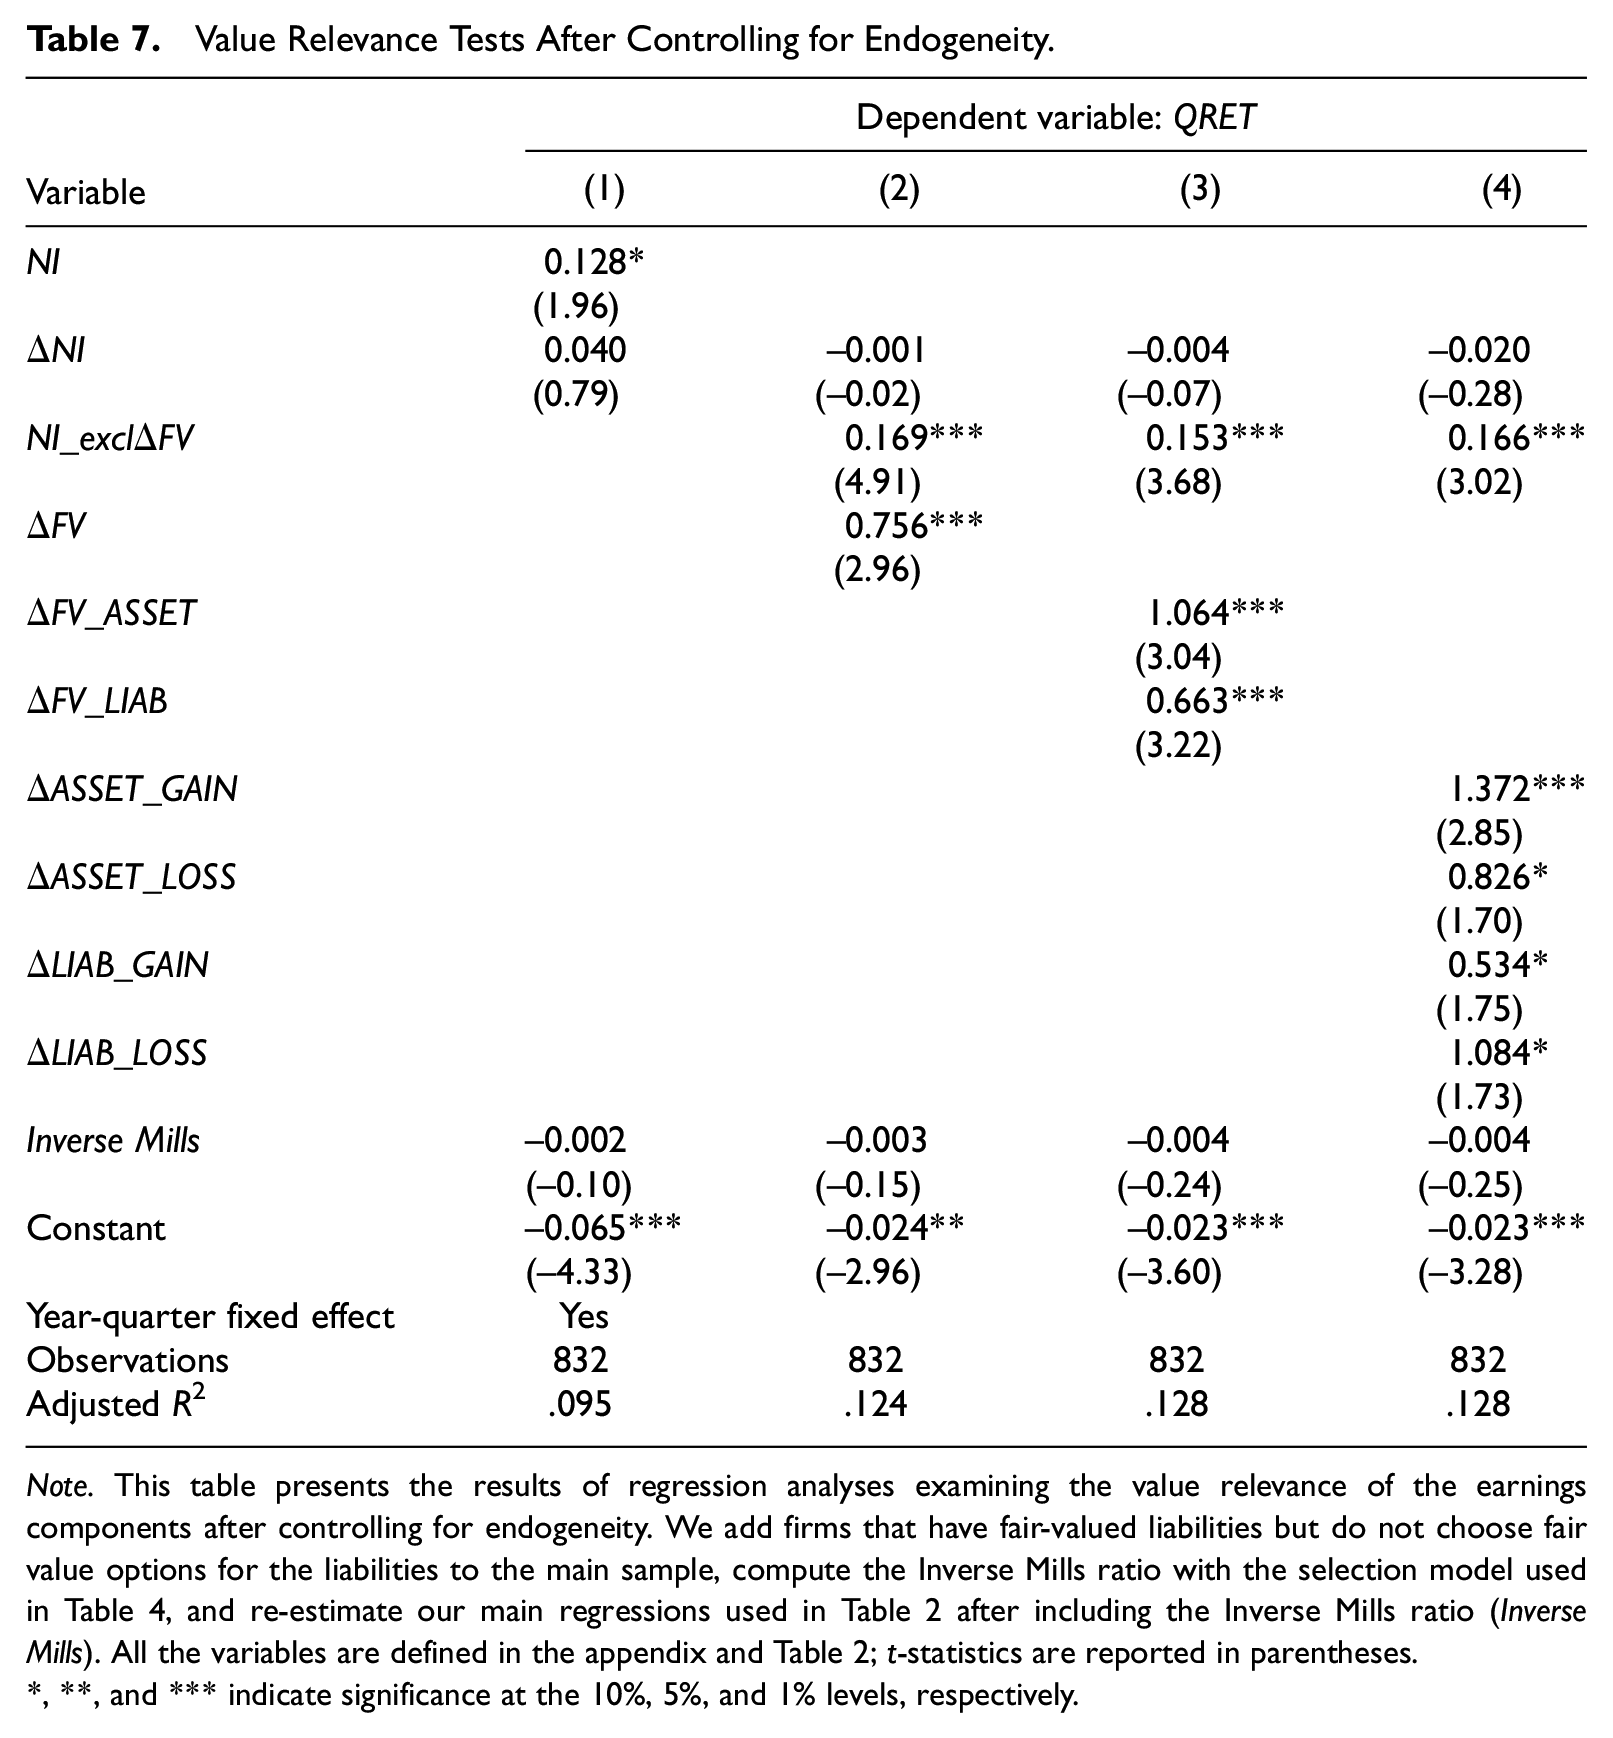
Note. This table presents the results of regression analyses examining the value relevance of the earnings components after controlling for endogeneity. We add firms that have fair-valued liabilities but do not choose fair value options for the liabilities to the main sample, compute the Inverse Mills ratio with the selection model used in Table 4, and re-estimate our main regressions used in Table 2 after including the Inverse Mills ratio (Inverse Mills). All the variables are defined in the appendix and Table 2; t-statistics are reported in parentheses.
, **, and *** indicate significance at the 10%, 5%, and 1% levels, respectively.
The effect of change in firms’ credit risk
Next, we use the reduced sample of firms that explicitly disclose gains and losses from liabilities solely due to changes in a firm’s credit risk to directly assess the market pricing of these liability gains and losses. The majority of firms in our sample do not provide detailed footnote disclosures that allow us to isolate the fair value gains related to instrument-specific credit risk from other macroeconomic factors. However, a small subset of firms in our sample does provide such disclosures. By hand-collecting fair value liability gains and losses per share attributable to changes in the firm’s own credit risk, we are able to explicitly separate changes in the fair values of the firm’s liabilities that are due to changes in the firm’s own credit risk from changes in fair values due to changes in other factors such as market interest risk.
We compute the fair value change in liabilities attributable to factors other than changes in the firm’s own credit risk (ΔLIAB_NCREDITit) as the difference between ΔFV_LIABi,t and ΔLIAB_CREDITi,t. We examine the market pricing of ΔLIAB_CREDITi,t using the following regression model:

The income variables are scaled by beginning-of-quarter market capitalization. To be consistent with Barth et al. (2008) and to directly compare our results with those reported in Table 7 of Barth et al. (2008), we control for the credit rating change of the sample firms in a given quarter (ΔCR_RATINGi,t). If fair value gains and losses from liabilities due to changes in the firm’s own creditworthiness are informative, we expect a positive coefficient on ΔLIAB_CREDITi,t.
In Table 8, we find a statistically significant coefficient (0.205) on ΔLIAB_CREDITi,t at the .10 level in Column (1), which suggests that market pricing of the fair value changes is economically significant. 18 We also find that the market positively reacts to the fair value changes due to other factors (1.101, t = 2.47). For these two components of the fair value changes, we observe that investors only misreact to the fair value change in liability due to firms’ own credit risk. The results of the regression on future 1-year returns are shown in Column (2), where we find a significantly negative coefficient only on ΔLIAB_CREDITi,t (–0.699, t = −2.09). The coefficient on ΔLIAB_NCREDITit is not significant.
Analysis on Fair Value Gains and Losses Due to Changes in Firms’ Own Credit Risk.
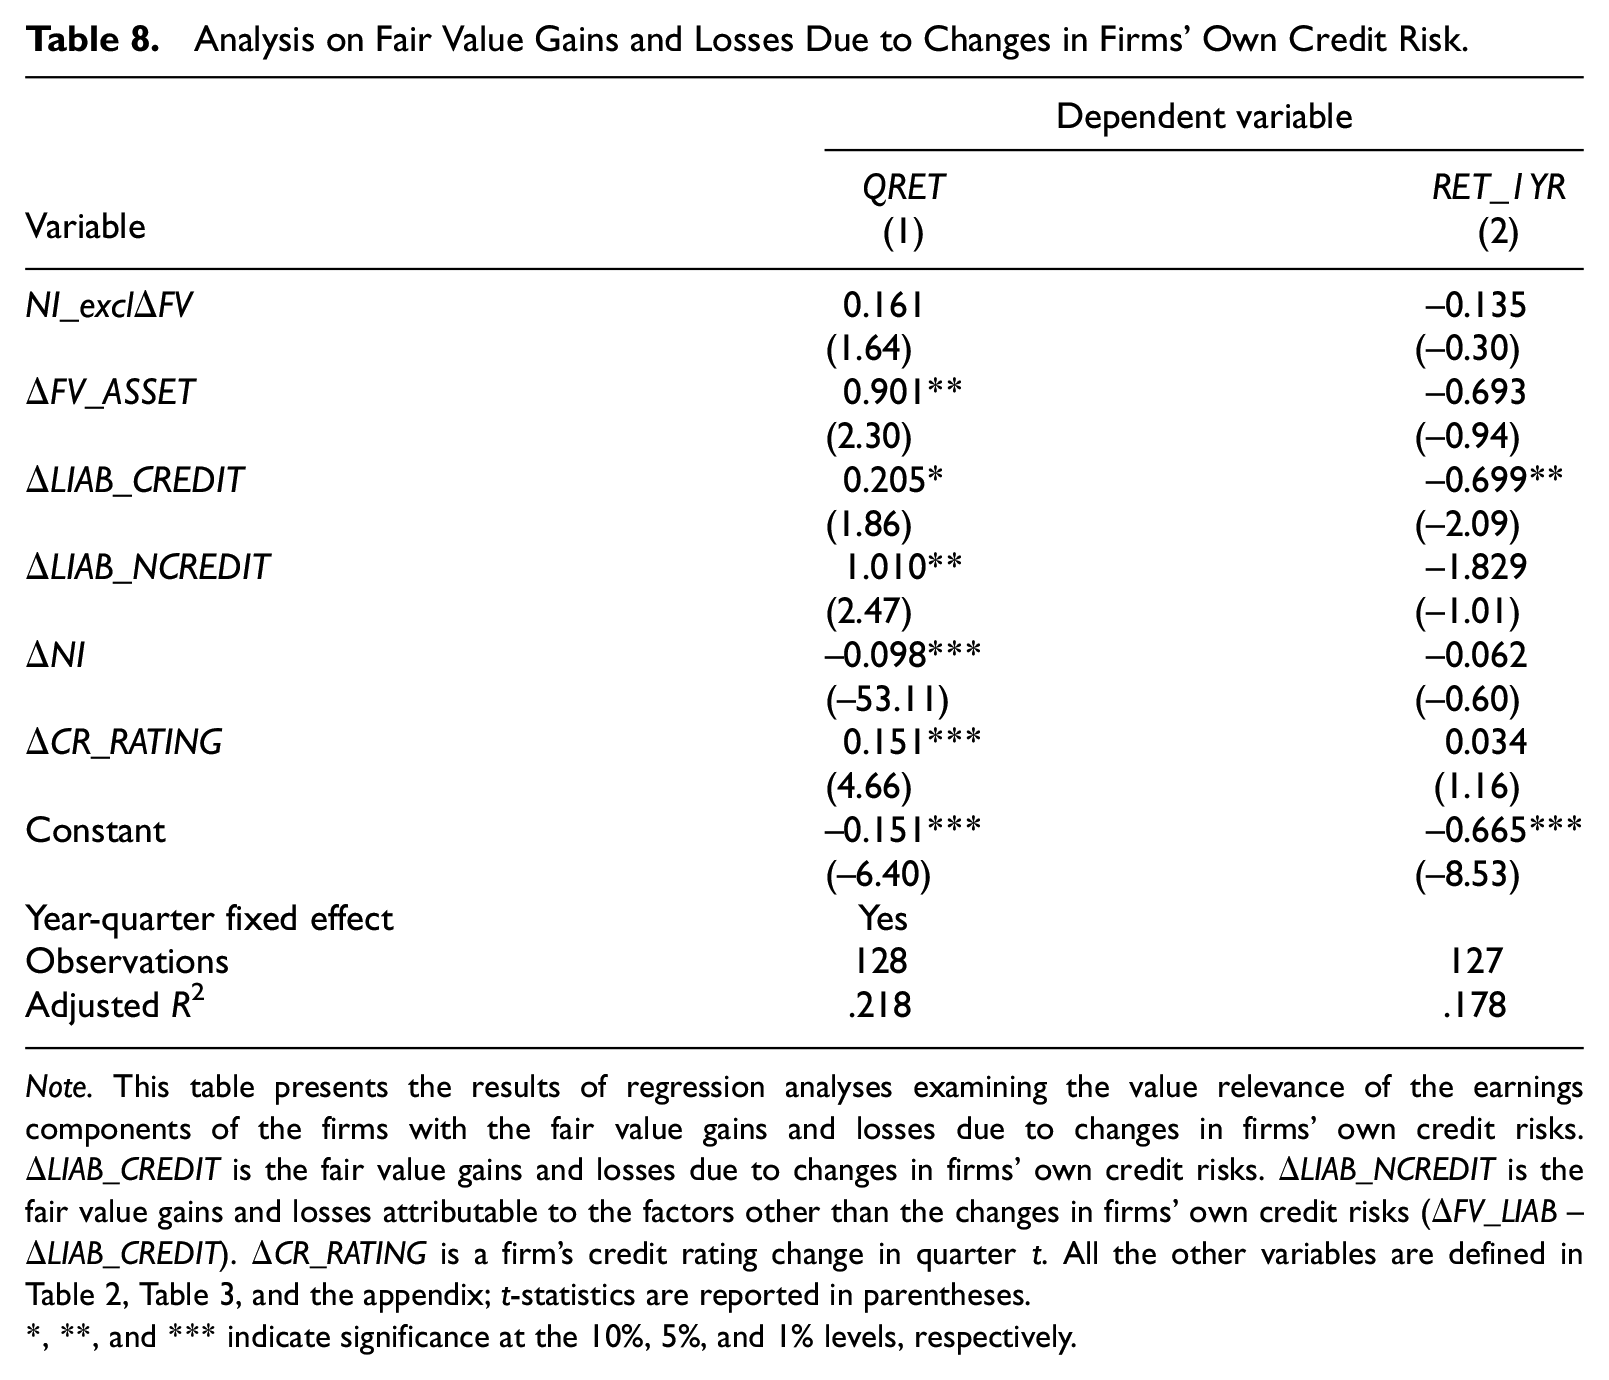
Note. This table presents the results of regression analyses examining the value relevance of the earnings components of the firms with the fair value gains and losses due to changes in firms’ own credit risks. ΔLIAB_CREDIT is the fair value gains and losses due to changes in firms’ own credit risks. ΔLIAB_NCREDIT is the fair value gains and losses attributable to the factors other than the changes in firms’ own credit risks (ΔFV_LIAB–ΔLIAB_CREDIT). ΔCR_RATING is a firm’s credit rating change in quarter t. All the other variables are defined in Table 2, Table 3, and the appendix; t-statistics are reported in parentheses.
, **, and *** indicate significance at the 10%, 5%, and 1% levels, respectively.
Changes in value relevance over time
In line with results from the contemporaneous and future market reactions to liability gains or losses, an interesting question is whether the market learns about the economic implications of fair value gains and losses over time. To answer this question, we follow prior studies (e.g., Collins et al., 1997; Kim & Kross, 2005) that investigate changes in value relevance over time. Specifically, similar to Collins et al. (1997), we regress the estimated incremental explanatory power for fair value gains and losses from assets and from liabilities on a time variable as follows:

where
Untabulated test results show that the coefficient of TIME is insignificant at conventional levels. However, the results should be interpreted with caution because the time span of this analysis is relatively short.
Conclusion
This study examines how investors perceive fair value liability gains and losses arising from FAS 159 adoption. Consistent with the objectives of standard setters, we find a positive association between a firm’s contemporaneous stock returns and FAS 159 gains and losses from liabilities. Our results thus suggest that the market incorporates the impact of reported fair value gains and losses from liabilities.
We also examine how investors react to the valuation implications of the liability gains and losses by investigating the association between this earnings component and future returns. We find a reversal of market reactions to liability gains and losses within a 1-year window, suggesting that investors initially misreact to the information in this earnings component. In a cross-sectional analysis, we find that the investor misreaction occurs mostly among the firms with low institutional ownership. If retail investors fixate on net income and do not examine its various earnings components, these findings provide some evidence suggesting that retail investors might have misunderstood the valuation implications of these fair value liability changes given their counterintuitive nature.
Overall, our study provides empirical evidence on investors’ assessments of the impact of fair value gains and losses from liabilities during the period when the FASB permitted fair value gains and losses from liabilities to be recognized as part of net earnings. Our study is informative to standard setters and regulators regarding the importance to investors of fair value gains and losses from liabilities and provides relevant information for addressing questions regarding whether firms should fair value their liabilities and whether fair value gains and losses from liabilities should be treated differently. Our study thus provides interesting evidence that contributes to the debate and controversy surrounding the fair value accounting for liabilities.
Footnotes
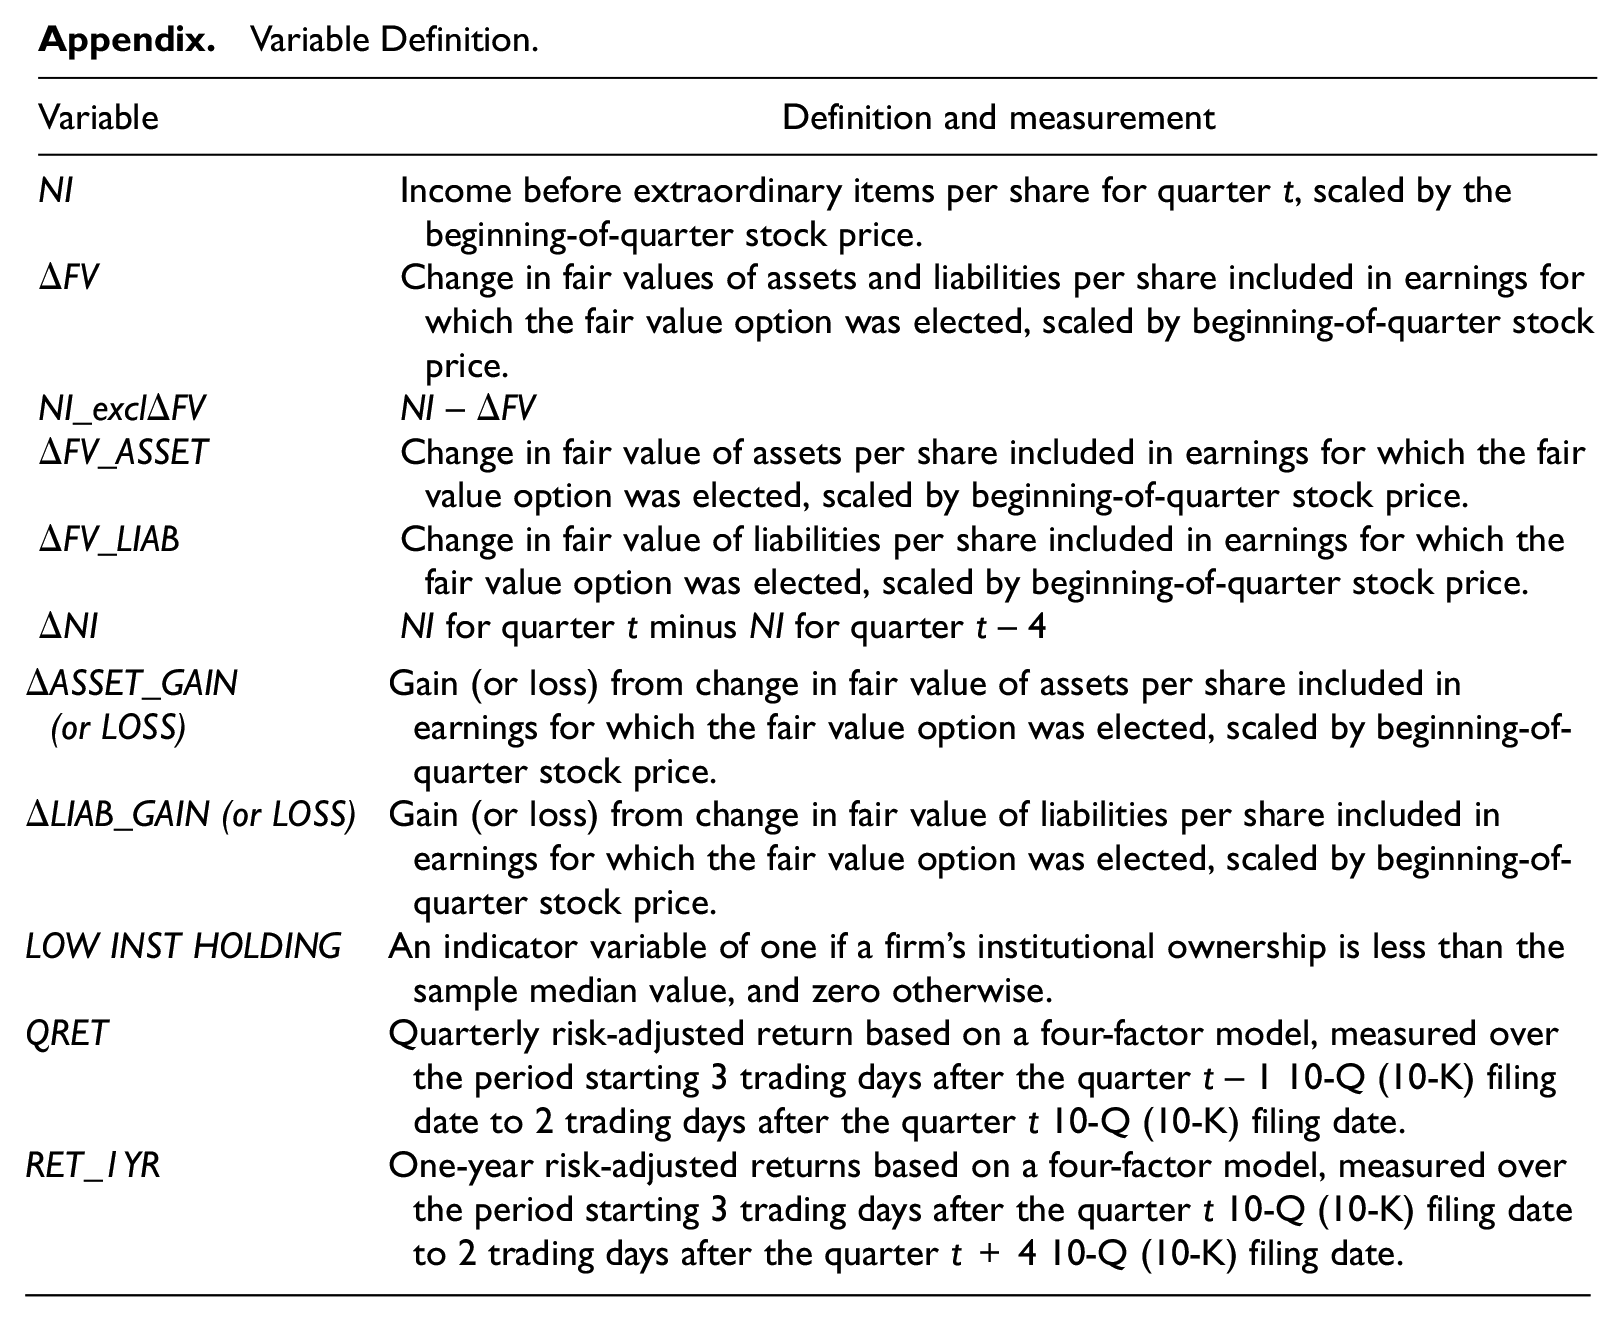
Appendix
Variable Definition.
| Variable | Definition and measurement |
|---|---|
| NI | Income before extraordinary items per share for quarter t, scaled by the beginning-of-quarter stock price. |
| ΔFV | Change in fair values of assets and liabilities per share included in earnings for which the fair value option was elected, scaled by beginning-of-quarter stock price. |
| NI_exclΔFV | NI–ΔFV |
| ΔFV_ASSET | Change in fair value of assets per share included in earnings for which the fair value option was elected, scaled by beginning-of-quarter stock price. |
| ΔFV_LIAB | Change in fair value of liabilities per share included in earnings for which the fair value option was elected, scaled by beginning-of-quarter stock price. |
| ΔNI | NI for quarter t minus NI for quarter t– 4 |
| ΔASSET_GAIN (or LOSS) | Gain (or loss) from change in fair value of assets per share included in earnings for which the fair value option was elected, scaled by beginning-of-quarter stock price. |
| ΔLIAB_GAIN (or LOSS) | Gain (or loss) from change in fair value of liabilities per share included in earnings for which the fair value option was elected, scaled by beginning-of-quarter stock price. |
| LOW INST HOLDING | An indicator variable of one if a firm’s institutional ownership is less than the sample median value, and zero otherwise. |
| QRET | Quarterly risk-adjusted return based on a four-factor model, measured over the period starting 3 trading days after the quarter t– 1 10-Q (10-K) filing date to 2 trading days after the quarter t 10-Q (10-K) filing date. |
| RET_1YR | One-year risk-adjusted returns based on a four-factor model, measured over the period starting 3 trading days after the quarter t 10-Q (10-K) filing date to 2 trading days after the quarter t+ 4 10-Q (10-K) filing date. |
Acknowledgements
We are grateful for helpful comments and suggestions from Orie Barron, Neil Bhattacharya, Jeffrey Callen, Leslie Hodder (discussant), Hong Hyun (discussant), Henock Louis, and Katherine Schipper; conference participants at the 2012 American Accounting Association Annual Meeting, 2013 American Accounting Association’s Financial Accounting Reporting Section Meeting, 41st European Accounting Association Annual Congress, 2018 Hawaii Accounting Research Conference, and 2018 Journal of Accounting, Auditing and Finance Conference; and seminar participants at Kyushu University, Singapore Management University, and Singapore University of Social Sciences. We also appreciate the research assistance of Cheong Hui Shan, Xiangang Xin, and Eunice Yeo.
Authors’ Note
A previous draft of this paper was titled “Assessing the Valuation and Risk Implications of Fair Value Accounting for Liabilities: Evidence From FAS 159’s Reported Gains and Losses.”
Declaration of Conflicting Interests
The author(s) declared no potential conflicts of interest with respect to the research, authorship, and/or publication of this article.
Funding
The author(s) received no financial support for the research, authorship, and/or publication of this article.