



Abstract
Recent efforts have been made to identify and compare employees with profiles reflecting different combinations of affective (AC), normative (NC), and continuance (CC) organizational commitment. To date, the optimal profiles in terms of employee behavior and well-being have been found to be those in which AC, NC, and CC are all strong, or those where AC, or AC and NC, dominate. The poorest outcomes are found for profiles where AC, NC, and CC are all weak, or CC dominates. The primary goal of the current study was to use latent profile analysis and latent transition analysis to identify profile groups and examine changes in profile membership over an 8-month period in an organization undergoing a strategic change. We also tested hypotheses concerning the relation between perceived trustworthiness of management and employees’ commitment profile within and across time. We found that commitment profiles have substantial temporal stability and that trustworthiness positively predicts memberships in more desirable commitment profiles. There was also some, albeit weak, evidence that changes in perceived trustworthiness were accompanied by corresponding shifts in the commitment profile.
The three-component model of commitment (Meyer & Allen, 1991; Meyer & Herscovitch, 2001) defines commitment as a force that binds an individual to a target or course of action. However, this force can be characterized by three distinct mind-sets—desire (affective commitment), obligation (normative commitment), and perceived cost (continuance commitment)—that can have different implications for behavior. Although Meyer and colleagues argued that the mind-sets combine to influence behavior, most research has focused on their independent or additive effects. Only recently have studies examined the behavioral consequences of “commitment profiles” (e.g., Gellatly, Meyer, & Luchak, 2006; Wasti, 2005). These studies generated new insights into the nature and implications of commitment and served as the impetus for recent developments in commitment theory (Meyer, Becker, & Van Dick, 2006; Meyer & Maltin, 2010; Meyer & Parfyonova, 2010).
The shift in attention to commitment profiles reflects a broader trend in organizational research toward greater use of a person-centered approach (see Wang & Hanges, 2011). In contrast to the more common variable-centered approach that aims to explain relations among variables, the person-centered approach involves the identification of homogeneous subgroups of individuals within a population. The person-centered approach treats individuals in a more holistic fashion and allows for the possibility that a set of attributes (e.g., commitment mind-sets) might be experienced differently, and have different implications, in combination than they do individually. Consequently, the person-centered approach affords a different perspective on a phenomenon of interest and complements the variable-centered approach (Marsh, Lüdtke, Trautwein, & Morin, 2009; Meyer, Stanley, & Vandenberg, 2013).
To date, commitment profile studies have been cross-sectional and have not adequately addressed the important issue of profile stability. If the commitment profiles found across samples differ radically, or the profile structure within a sample is reactive to situational cues, it will be difficult to make meaningful recommendations. Therefore, our primary objective was to determine whether there is temporal stability in commitment profiles within a sample of employees. This study was conducted in an organization undergoing a large-scale change in strategy and culture, providing a strong test of within-sample stability.
Also, most of the attention in existing profile studies has been directed at their implications for behavior (Somers, 2010; Wasti, 2005) and well-being (Meyer, Stanley, & Parfyonova, 2012; Somers, 2009), with little concern for how these profiles are formed or change over time. To take advantage of what has been learned about the consequences of commitment profiles, we need to know more about what managers can do to foster desirable profiles and maintain them under conditions of change. Therefore, our second objective was to examine the role of one potential contributor to profile formation and change—the perceived trustworthiness of management. We focused on trustworthiness because trustworthiness and the trust it engenders become particularly salient under conditions of change (Tomlinson & Mayer, 2009), and both have been linked to commitment in previous research (Colquitt, Scott, & LePine, 2007; Dirks & Ferrin, 2002). Thus, there was good reason to believe that perceptions of management trustworthiness would be relevant to the formation and change of commitment profiles.
Commitment Profile: Theory and Research
Meyer and Herscovitch (2001) offered a set of propositions concerning how various combinations (profiles) of the commitment mind-sets—affective (AC), normative (NC), and continuance (CC) commitment—would relate to behaviors (e.g., turnover, performance, organizational citizenship). They proposed that the optimal profiles from an outcomes perspective would be characterized by strong AC and relatively weak CC and NC (i.e., the less autonomously motivated mind-sets). The least desirable outcomes were expected for uncommitted employees (all components low) or those whose profile was dominated by strong CC. These propositions have been tested in several studies with mixed support. Although profiles characterized by strong AC were indeed found to be associated with desirable behaviors, the AC-dominant profile was not necessarily optimal. 1 Indeed, several studies reported that intention to remain, organizational citizenship behavior (OCB), and well-being were greatest among employees with AC/NC-dominant or fully committed (high AC, NC, and CC) profiles (Gellatly et al., 2006; Meyer, L. Stanley, et al., 2012; Somers, 2009; Wasti, 2005), suggesting a possible synergy of the three components (see Johnson, Groff, & Taing, 2009).
Gellatly et al. (2006) interpreted their findings as evidence that the way any component of commitment is experienced will depend on the context created by the other components. For example, combined with strong AC, NC may be experienced as a moral imperative, whereas with weak AC and strong CC it might be experienced as indebted obligation. Similarly, Meyer, L. Stanley, et al. (2012) suggested that, on its own, strong CC might reflect entrapment due to lack of alternatives or the economic costs of leaving. Alternatively, when combined with strong AC and NC, CC could reflect awareness of the costs associated with the loss of desirable work and/or work conditions. Thus, the implications of CC and NC will depend on their relative strength within the full commitment profile.
Considered together, the results of existing profile studies suggest that the optimal commitment profiles from an outcomes perspective are the fully committed, AC/NC-dominant, and AC-dominant profiles. The poorest outcomes tend to be associated with the uncommitted and CC-dominant profiles. Based on these findings, one might conclude that organizations should invest effort and resources to foster the optimal profiles. However, as noted previously, recommendations such as this rest on the assumption that there is a relatively standard set of distinguishable profiles within the workforce, that there are strategies organizations can use to foster these desirable profiles, and that, once established, commitment profiles remain relatively stable over time. These assumptions remain largely untested. In the discussion to follow we focus first on the issue of stability, and then on profile development.
Stability of Commitment Profiles
The stability of commitment profiles can be addressed in several ways. First, there is the question of whether a common set of profiles emerges across samples (i.e., cross-sample stability). This question is best answered by comparing profiles across studies. Although research is still limited, Meyer, L. Stanley, et al. (2012) noted that several profiles emerge quite regularly. Indeed, all of the studies they reviewed identified fully committed, AC/NC-dominant, CC-dominant, and uncommitted profiles. Most studies identified an AC-dominant profile and two studies found a CC/NC-dominant profile. Several studies also identified profiles in which scores on all three mind-sets fell in the moderate range. The only profile described by Meyer and Herscovitch (2001) that has not been found, other than through median split approaches, is the NC-dominant profile. Thus, some profiles replicate quite consistently. Although other profiles emerge occasionally, the feasible set of profiles is relatively small and easily manageable.
A second question has to do with the temporal stability of commitment profiles within a sample. That is, will the same profiles be detected for a given sample on separate occasions? Recommendations that organizations select for or promote some profiles over others (e.g., Meyer, L. Stanley, et al., 2012), or use different management strategies for different types of employees (e.g., Morin, Morizot, Boudrias, & Madore, 2011), assume that profiles persist over time. However, their temporal stability has yet to be investigated. The evidence for cross-sample consistency suggests, but does not directly demonstrate, within-sample temporal stability. Consequently, addressing this issue was one of our key objectives.
Finally, there is the question of temporal stability of individual employees’ commitment profiles. The questions of within-person and within-sample temporal stability are highly related. Temporal stability at the individual level virtually assures within-sample stability. However, even if individual employees’ profiles change over time, within-sample stability remains a possibility if the change involves balanced movement (i.e., switching) between existing profiles. For example, if some employees shift from a CC-dominant profile to an AC/CC-dominant profile over time, while other employees shift in the opposite direction, the profile structure of the sample should remain the same over time. Even when the switching is not fully balanced, the profile structure might still remain the same across time, although the relative profile sizes may differ. Only large and uniform shifts in individual employee profiles are likely to lead to within-sample instability. Thus, if a dramatic event caused a large proportion of employees with an AC/CC-dominant profile to shift to a CC-dominant profile, with no one moving in the opposite direction, the former profile might be detected before the event but not after. In addressing temporal stability, it is important to consider factors that might contribute to stability and change in individuals’ profiles.
In theory, there are several reasons to expect the commitment mind-sets to remain relatively stable over time. Mowday, Porter, and Steers (1982) argued that, by its very nature, (affective) commitment is a stable attitude emerging in part from a dispositional propensity to commit. Weiner (1982) proposed that NC develops largely as a function of socialization forces presumably designed and intended to create stability. Becker (1960) suggested that (continuance) commitment develops when individuals make “side bets” (e.g., investing time to develop organization-specific skills) that make it costly to change one’s course of action, potentially for a considerable period of time. Although empirical evidence for dispositional influences on commitment is sparse (Meyer, Stanley, Herscovitch, & Topolnytsky, 2002), a few recent studies have reported correlations between personality and AC (e.g., Erdheim, Wang, & Zickar, 2006; Panaccio & Vandenberghe, 2012), as well as relations between commitment mind-sets and cultural values (Clugston, Howell, & Dorfman, 2000; Fischer & Mansell, 2009; Meyer, D. Stanley, et al., 2012; Wasti, 2003). Finally, Morin, Morizot, et al. (2011) found evidence of a general factor underlying AC to seven distinct work-relevant foci, suggesting the existence of a general tendency to commit. Thus, to the extent that these internal factors are free to operate (i.e., without strong counterforces in the environment), individual employees’ profiles should be expected to remain stable.
There are also strong theoretical and empirical bases for expecting instability in commitment profiles over time. Indeed, in the initial formulation of the three component model, Meyer and Allen (1991, 1997) focused almost exclusively on situational factors as determinants of commitment. In contrast to research on dispositions, there has been an extensive body of research linking commitment to work conditions (or perceptions of these conditions). Meta-analyses provide strong evidence linking AC (and to a lesser extent NC) to perceived organizational support (Rhoades & Eisenberger, 2002), organizational justice (Colquitt, Conlon, Wesson, Porter, & Ng, 2001), empowerment (Seibert, Wang, & Courtright, 2011), trust (Colquitt et al., 2007), high involvement work practices (Jiang, Lepak, Hu, & Baer, 2012), and transformational leadership (Jackson, Meyer, & Wang, 2013). CC has been linked to lack of employment alternatives and nontransferability of skills and education (Meyer et al., 2002). Each of these situational factors is subject to change and, based on their relations with commitment, could contribute to changes in one or more of the commitment mind-sets.
Few studies have examined relations between situational factors and commitment over time, and the findings have been mixed (see Morrow, 2011). Some of the earliest longitudinal studies involving established employees provided little evidence for time-lagged relations between work conditions and commitment (Bateman & Strasser, 1984; Curry, Wakefield, Price, & Mueller, 1986). However, Meyer and colleagues (Meyer & Allen, 1988; Meyer, Bobocel, & Allen, 1991) found significant time-lagged relations between work experiences (e.g., job challenge) and commitment among new employees. These findings suggest that situational factors may play a role in shaping commitment, but that they are most likely to do so under novel or changing conditions. Once formed, commitment might remain quite stable.
In sum, there are reasons to expect both stability and changes in commitment over time. There is no strong evidence to suggest that organizational changes such as the one experienced by employees in our study will be sufficiently strong or uniform to produce temporal instability in the profile structure of an entire sample of employees. Therefore, we predicted that we would find several of the more common profiles in our sample, and that these would remain stable over time.
Hypothesis 1: Our sample will be heterogeneous with regard to commitment profile and should include the following: fully committed, AC/NC-dominant, AC-dominant, CC-dominant, uncommitted. Other possible profiles include CC/NC-dominant and all mid profiles.
Hypothesis 2: The same profiles will exist prior to and following the change.
Perceived Management Trustworthiness and Commitment
As noted earlier, there has been little research to identify factors involved in the formation of, or change in, commitment profiles (see Gellatly, Hunter, Currie, & Irving, 2009, for an exception). Therefore, our second objective was to investigate the roles of perceived management trustworthiness, and change in perceived trustworthiness, respectively, in the formation and changes in commitment profiles. Trust is commonly conceptualized as a willingness to make oneself vulnerable to the decisions or actions of others, whereas trustworthiness is a quality of the trustee (Colquitt et al., 2007; Mayer, Davis, & Schoorman, 1995; Schoorman, Mayer, & Davis, 2007). According to Mayer et al. (1995), judgments of trustworthiness reflect an assessment of three characteristics: benevolence (concern for the truster’s well-being), ability (situation-relevant competence), and integrity (adherence to acceptable moral and ethical principles). Trust and trustworthiness are inextricably intertwined. Indeed, many measures of trust make direct reference to two or more of the facets of trustworthiness (Salamon & Robinson, 2008). We focused on trustworthiness rather than trust per se because the findings are likely to be more directly actionable.
A basic theoretical underpinning of organizational commitment is social exchange (Meyer & Allen, 1991). At the heart of high-quality exchanges is the belief that the other party will fulfill its obligations (Blau, 1964; Cropanzano & Mitchell, 2005). Trust is therefore important at any stage of a relationship, but becomes central under conditions of uncertainty such as a large-scale organizational change (Mayer et al., 1995). In these contexts, employees are likely to be guided by their perceptions of management’s trustworthiness. Indeed, there is considerable empirical evidence linking commitment, particularly AC, to trust (Dirks & Ferrin, 2002) and trustworthiness (Colquitt et al., 2007). In their meta-analysis, Dirks and Ferrin found that AC correlated positively with trust in top management and immediate supervisor, but that the former relation was stronger. They argued that the difference might be because top management plays a greater role in developing strategy and policy. Thus, when it comes to their willingness to commit to the organization, employees may pay particular attention to whether they trust top management to steer the organization in the proper direction.
In contrast to its positive relation with AC, trust in management has generally been found to have a negative (Albrecht & Travaglione, 2003; Laschinger, Finegan, Shamian, & Casier, 2000) or nonsignificant (Hopkins & Weathington, 2006; Ozag, 2006) relation with CC. Although these studies did not address the issue of causality, to the extent that a negative relation exists, we expect it may be because employees with strong CC find it difficult to leave the situation despite concerns about management’s trustworthiness. It is unlikely that lack of trust contributes directly to the perceived cost of leaving. To our knowledge, only two studies have examined the relation between trust and NC. Ozag (2006) found a positive correlation with a combined measure of trust in supervisor and the organization. Colquitt, LePine, Piccolo, Zapata, and Rich (2012) found positive correlations with both affect- and cognition-based measures of trust in supervisor. However, when the cognition-based measure of trust (conceptually similar to our trustworthiness measure) was included in a structural equation modeling analysis, the relation with NC disappeared. Thus, the findings pertaining to both CC and NC are somewhat inconsistent. It is important to note, however, that research is limited and has not considered CC or NC as they might be experienced within a commitment profile.
Based on the foregoing theory and research, we developed hypotheses pertaining to profile formation. First, we expected that employees who perceived management to be trustworthy would be more likely to have a profile characterized by strong AC. Employees who see management as untrustworthy may have little reason to commit to the organization, and might therefore be uncommitted (waiting for an opportunity to leave) or CC-dominant (seeing no alternative but to stay). Finally, employees who perceive management as trustworthy might also develop a felt obligation to remain (NC-dominant) as a means of reciprocation, or a sense of indebtedness due to expectation from other individuals (e.g., CC/NC-dominant), although both NC-dominant and CC/NC-dominant profiles were rare in past research. A trusting environment is likely to be perceived positively, in which case NC might combine with AC to form an AC/NC-dominant or fully committed profile.
Hypothesis 3: Employees’ perceptions of management trustworthiness will relate positively to their likelihood of having a fully committed, AC/NC-dominant, or AC-dominant profile, and negatively to the likelihood of having an uncommitted or CC-dominant profile.
Although some studies have examined the relations between trust and commitment under conditions of change (Albrecht & Travaglione, 2003; Laschinger et al., 2000), we are unaware of any studies that have investigated how changes in perceptions of management trustworthiness related to changes in commitment mind-sets over time. Consequently, our hypotheses were guided by the broader literature on commitment and change (see Meyer, 2009). Moreover, to be consistent with Hypothesis 2 regarding the temporal stability at the sample level, we focused our attention on the role that changes in perceptions of management trustworthiness might have on individual employees’ transitions between profiles over time.
Morrow’s (2011) review of longitudinal studies revealed that commitment can increase or decrease as a consequence of organizational change. Although she did not address the role of trust per se, it is interesting to note that the strongest and most consistent evidence for a decrease in AC was obtained in the case of downsizing (e.g., Armstrong-Stassen, 1998). Changes such as this can lead employees to engage in a process of sense making (Tomlinson & Mayer, 2009), with implications for the nature and strength of their commitment (Meyer, Allen, & Topolnytsky, 1998). For example, employees may see the change as unjust (Caldwell, Liu, Fedor, & Herold, 2009) or a violation of its psychological contract (Korsgaard, Sapienza, & Schweiger, 2002), thereby reducing perceptions of trustworthiness. However, large-scale organizational changes can also provide an opportunity for management to build trust by using fair procedures and/or communicating the need to “rewrite” the psychological contract in a mutually satisfactory manner (Meyer, 2009). Therefore, how employees react to management’s actions may depend on how they interpret the situation, and this could vary from employee to employee. This may have implications for temporal movement of profiles at the individual level:
Hypothesis 4: An increase (decline) in perceptions of management trustworthiness will relate positively (negatively) to the likelihood of an employee transitioning from a less favorable to a more favorable profile, and will relate negatively (positively) with the likelihood of transitioning from a more favorable to a less favorable profile.
Other Methodological Considerations
Before moving on, three additional methodological issues warrant consideration. First, there is disagreement concerning the dimensionality of trustworthiness. For example, Mayer and Davis (1999) found evidence for three factors, whereas Searle et al. (2011) found two (benevolence and integrity combined). Some investigators (e.g., Salamon & Robinson, 2008) combine the three subscales, whereas others treat them individually (e.g., Colquitt & Rodell, 2011). For purposes of hypothesis development, we focused on global trustworthiness. However, as described later, we conducted preliminary analyses to determine how to best represent the trustworthiness construct in tests of these hypotheses.
Second, recall that Dirks and Ferrin (2002) found that AC correlated positively with trust in top management and the immediate supervisor, but that the former correlation was stronger. In this study we measured perceptions of the trustworthiness of both levels of management. This allowed us to determine whether Dirks and Ferrin’s findings would replicate in analyses of commitment profiles. In addition, it provided a partial control for concerns about the effects of common method bias. That is, such concerns should be reduced if the strength of relations differs across foci of trustworthiness.
Finally, because ours is the first study to examine relations between perceived trustworthiness and commitment profiles, the generalizability of our findings is a potential concern. Therefore, we also examined relations between profile membership and turnover intent for comparison with previous research (e.g., Somers, 2009, 2010; Wasti, 2005). If our results are similar, we can have greater confidence that our sample is not unique and the findings regarding trustworthiness will generalize.
Method
Research Setting and Change Context
The research site was a large energy company undergoing a planned structural and cultural transformation. The company itself was fairly new—a by-product of a recent and significant reorganization by its parent company. Due to deregulation in the Canadian energy sector, and in an attempt to remain competitive, the parent company split the business into three separate companies, one of which was a shared services provider. The latter company, which served as the research site, provided services (e.g., HR, IT) to the other companies within the umbrella organization.
The shared services provider had its own revenue and earnings targets, strategies for success, and business plans. According to senior management, the company’s goal was to become a profitable and significant player in its market niche. To achieve this objective, it had to be profit-oriented and adaptable to changes in the energy and shared services industries. This philosophy was dramatically different from the one that had existed under regulation. The regulator had required the utility to meet strict guidelines and placed limits on profits. Among the most immediate and visible events affecting employees after the reorganization were the layoff of approximately 20% of permanent employees, the hiring of a slightly greater number of contract workers, minor changes in the senior management team, and a variety of initiatives undertaken by senior management to promote the changes in strategy and culture (e.g., “town hall” meetings, site visits, and management training).
Participants, Data Collection, and Missing Data Procedures
The data reported in this article were collected as part of a much larger project on organizational change. 2 The first survey was administered 1 month prior to the official announcement of the planned change. The entire workforce (N = 1,041) was asked to participate, and 699 (67%) responded. The second survey was administered 8 months later. Again, the entire workforce (N = 1,075) was invited to participate, and 637 (59%) responded. Surveys were distributed via interoffice mail. Participation in the survey was voluntary and anonymous. Employees were given 2 weeks to return the surveys. Reminders were e-mailed and posted on bulletin boards a few days before the deadline for return. We were able to match Time 1 and Time 2 surveys by having employees use a unique code number. All of the measures described below were included on both administrations of the survey. The demographic information, descriptive statistics, reliabilities, and correlations for all of the study’s variables are reported in Table 1.
Descriptive Statistics, Correlations, and Reliabilities

Note: fs = factor scores; t1 = Time 1; t2 = Time 2. All correlation coefficients above .05 are statistically significant at p < .05; correlations above .07 are significant at p < .01; correlations above .10 are significant at p < .001. Cronbach’s alphas are reported on the diagonal in bold.
For present purposes, data obtained from those involved in planning and overseeing the change initiative (i.e., senior management) were not included in the analyses. Within-time analyses were conducted on data from all of the remaining respondents (Time 1: N = 688; Time 2: N = 625). Longitudinal analyses were conducted using the data from all respondents, using full information maximum likelihood estimation (FIML)—rather than a listwise deletion strategy focusing only on employees having answered both time points—to handle missing data (Enders, 2010; Little & Rubin, 1987; Schafer, 1997). FIML estimation, especially when used in conjunction with robust maximum likelihood estimation, has been found to result in unbiased parameter estimates under even a very high level of missing data (e.g., 50%), in the context of longitudinal studies with missing time points, under missing at random assumptions, and even to violations of these assumptions in some cases (e.g., Enders, 2001, 2010; Enders & Bandalos, 2001; Graham, 2009; Larsen, 2011; Shin, Davidson, & Long, 2009). FIML is recognized to perform better than most alternative missing data strategies (listwise deletion, pairwise deletion, mean substitution), especially in the context of longitudinal studies, and has been shown to perform equivalently (or even better in some cases; e.g., Larsen, 2011) to more computationally intensive multiple imputation procedures (e.g., Enders, 2010; Graham, 2009). Contrary to popular beliefs, FIML does not replace the missing values (i.e., is not an imputation method). Rather, FIML estimates model parameters (versus specific missing values on specific variables) based on all of the available information in the variance-covariance matrix.
An important advantage of using FIML, specific to this study, is that it allowed us to maximize sample size, which was important given that latent transition analysis requires large samples in order to converge on proper, replicated solutions and to achieve reasonable generalizability (recall that the total sample size is divided into profiles so that the ability to extract stable small yet meaningful profiles is a direct function of the total sample size). Furthermore, to ensure that the results from the main longitudinal models were unbiased by this decision, latent profile analyses were also conducted on the time-specific subsamples (see the online supplemental materials, available at jom.sagepub.com), and the results regarding the nature of the profiles were found to replicate across time points and converged with those from the latent transition analyses reported here.
Measures
Trustworthiness
We assessed the perceived trustworthiness of both top management and the immediate supervisor using slightly modified (i.e., shortened) versions of the measures of ability, benevolence, and integrity developed by Mayer et al. (1995). Ability was measured with four items (e.g., “Top management [my supervisor] is very capable of performing its [his/her] job”), benevolence with four items (e.g., “Top management [my supervisor] is very concerned about my welfare”), and integrity with five items (e.g., “Top management [my supervisor] has a strong sense of justice”). Responses were made on a 5-point Likert-type scale (1 = strongly disagree and 5 = strongly agree). Preliminary confirmatory factor analyses were conducted on this instrument and are fully reported in the online supplemental materials accompanying this article. The results from these analyses showed that, although the a priori measurement model fitted the data well, the three a priori facets of trustworthiness where so highly correlated as to detract from their discriminant validity. Indeed, an alternate factor model in which these three facets were used to define a higher-order factor of trustworthiness for each source (i.e., supervisor, top management) and measurement point—resulting in four higher-order factors—provided an equivalent fit to the data while providing a much more parsimonious representation of the data. 3 This model also proved perfectly invariant (i.e., equivalent) across time points (Meredith, 1993), suggesting that comparisons of trustworthiness levels over time were justified. Given that we had no specific predictions about the implications of specific facets of trustworthiness, for purposes of hypothesis testing we used the higher-order trustworthiness factors to estimate the latent factor scores for (a) initial levels of perceived trustworthiness at Time 1 and (b) change over time (between Time 1 and Time 2) in trustworthiness levels (e.g., McArdle, 2009). These factor scores were estimated separately for top management and supervisor, and saved in an external data file to use in the main analyses reported in this article. It should be noted that, when we conducted exploratory analyses to examine predictive models including a single facet of trustworthiness at a time (see Table S4 in the online supplemental materials), the pattern and size of effects were roughly the same across facets, and in line with those based on the higher-order factor. This further supports the interpretation that these effects largely refect variance shared among the facets.
Organizational commitment
We measured commitment to the organization using slightly reworded versions of Meyer, Allen, and Smith’s (1993) six-item affective (e.g., “[The company] has a great deal of personal meaning for me”), six-item normative (e.g., “I would feel guilty if I left [the company] now”), and six-item continuance (e.g., “I have no choice but to work for [the company]”) commitment scales. Responses were made on a 5-point Likert-type scale (1 = strongly disagree and 5 = strongly agree). Preliminary confirmatory factor analyses were also conducted on this instrument and used to estimate factor scores on the commitment factors to use as inputs for the main analyses. These results are fully reported in the online supplemental materials accompanying this article and fully supported the a priori factor model, as well as its complete longitudinal measurement invariance.
Turnover intention
We measured turnover intention with one item: “How likely is it that you will voluntarily leave [the company] within the next 2 years?” Responses could vary from 1 (very unlikely) to 5 (very likely). High scores reflected greater likelihood of leaving.
Data Analysis
The latent transition analyses (LTA) models (Collins & Lanza, 2009; Nylund, Asparouhov, & Muthén, 2007) used in this study were estimated using the robust maximum likelihood estimator in Mplus 6.12 (L. K. Muthén & Muthén, 2011). Although previous research has generally yielded five to seven profiles (see Meyer, L. Stanley, et al., 2012), we examined solutions with up to eight profiles. To avoid the problem of local maxima (i.e., chance selection of a suboptimal solution), we conducted analyses for each model with 2,000 random sets of start values to ensure that the best log likelihood value was adequately replicated. We also increased the default to 100 iterations for these random starts and retained the 100 best solutions for final stage optimization (Hipp & Bauer, 2006; McLachlan & Peel, 2000). By default, Mplus constrains the variance of the indicators (factors scores) to be equal across profiles. However, following Morin, Maïano, Marsh, Janosz, and Nagengast (2011), we estimated alternative models in which the variances of the indicators were freely estimated in all profiles. Annotated Mplus code used to estimate all models in this present study are reproduced in the online supplemental materials to this article.
In all cases, to determine the final solution we first examined several fit statistics, including the Akaike information criterion (AIC), the Bayesian information criterion (BIC), the consistent Akaike information criterion (CAIC), and the sample-adjusted Bayesian information criterion (SABIC). A lower value on the AIC, CAIC, BIC, and SABIC suggests a better-fitting model. Simulation studies showed that BIC, CAIC, and SABIC, but not AIC, were particularly efficient in selecting the optimal model (see the online supplemental materials for additional details on the relative efficacy of these indicators). Finally, because relying on only empirical fit indices for model selection can lead to overinterpretation of the empirical results (Lubke & Muthén, 2005; Marsh et al., 2009; B. Muthén, 2003), we also used theory and previous commitment profile studies (see Meyer, L. Stanley, et al., 2012) to guide our selection of the optimal profile solution.
Although LTA does not require the estimation of a common set of profiles at each time period, it is often useful to systematically test whether the nature of the profile has switched over time. Therefore, we used the final retained LTA solution to systematically test for the equality of the estimated profiles by including longitudinal invariance constraints on the component means and variances within each of the profiles across the two time periods. This analysis permitted a finer-grain assessment of the nature of sample-level changes in commitment profiles over time.
Multinomial logistic regression analyses were conducted to verify whether the demographic predictors, initial levels of perceived management trustworthiness, and changes in trustworthiness over time were indeed predictive of the likelihood of membership into the various profiles from this final, time-invariant LTA model. Results from multinomial logistic regressions differ from those provided by standard linear or logistic regressions. First, each predictor has k-1 (with k being the number of profiles in the data) different complementary effects for comparison of one profile to a referent profile. Second, the regression coefficients represent the effects of the predictors on the log odds of the outcome (i.e., the probability of membership in one profile versus another in a pairwise comparison) that can be expected for a one-unit increase in the predictor. Since these coefficients are expressed in log-odds units, they are complex to interpret. We therefore provide easier-to-interpret odds ratios (OR), which reflect the change in likelihood of membership in the target profile versus the comparison profile for each unit increase in the predictor. ORs allow the size of the different effects to be compared more directly. For instance, an OR of 2 indicates that for each unit increase in the predictor, participants are twice as likely to be members of the target profile versus the comparison profile. ORs under 1, related to negative logistic regression coefficients, indicate that the likelihood of membership in the target profile is reduced. Thus, an OR of 0.5 shows that the likelihood of membership in the target profile versus the comparison profile is reduced by 50% per unit increase in the predictor.
It should be noted that the direct inclusion of covariates (predictors and outcomes) into the model that is used here takes into account the model-estimated posterior probabilities (the estimated probability that each individual has of belonging to each profile). Contrasting with the traditional methods of assigning individuals based on their most-likely profile membership to a single profile, the present method avoids the biases associated with the dichotomization of continuous variables (MacCallum, Zhang, Preacher, & Rucker, 2002) and systematically reduces biases in the estimation of the model parameters (Bolck, Croon, & Hagenaars, 2004; Clark & Muthén, 2009).
Finally, to verify whether turnover intention was affected by membership in the various latent profiles, participants’ turnover intention at both time points was added to the final unconditional model as additional indicators of the profiles at their respective time points (i.e., turnover intention at Time 1 was included as an indicator of the profiles estimated at Time 1, and turnover intention at Time 2 was included as an indicator of the profiles estimated at Time 2). To test for mean level differences between the profiles, we used the MODEL TEST command of Mplus, which provides an omnibus Wald chi-square test of mean differences across the profiles (L. K. Muthén & Muthén, 2011), and the Mplus MODEL CONSTRAINT function to systematically test mean-level differences across all specific pairs of profiles (using the multivariate delta method; e.g., Raykov & Marcoulides, 2004).
Results
Unconditional Latent Transition Analysis
The fit indices for the two- to eight-profile solutions at each time point are reported in Table 2. We report fit for two alternative parameterizations for each model—one where variances are constrained to equality across profiles and one where they are freely estimated. As can be seen, fit is improved when variances are freely estimated. The values for AIC, BIC, CAIC, and SABIC continued to decrease with the addition of profiles, at least up to six or seven profiles, which is common in these types of models (e.g., Marsh et al., 2009; Morin, Maïano, et al., 2011; Petras & Masyn, 2010). However, the decrease tended to plateau at around five profiles, which is consistent with the time-specific results reported in the online supplemental materials.
Latent Transition Analyses

Note: AIC = Akaike information criterion; BIC = Bayesian information criterion; CAIC = consistent AIC; k = number of latent profiles in the model; LL = model log likelihood; #fp = number of free parameters; SABIC = sample-adjusted BIC; SCF = scaling correction factor of the robust maximum likelihood estimator.
As a further aid in identification of the optimal solution, we examined the means for AC, NC, and CC for the bordering (four-profile and six-profile) solutions. This inspection revealed that the five-profile solution conformed most closely to theory and the findings of previous profile studies. Moreover, the five profiles were the same at both time points and were identical to the solutions obtained in the preliminary latent profile analyses conducted with the Time 1 and Time 2 data (see online supplemental materials). In contrast, profiles in the four-profile solution differed primarily in the level of the three mind-sets, with little evidence of differentiation in terms of profile shape. The six-profile solution differed from the five-profile solution primarily by splitting one profile based on a slight difference in commitment levels. Therefore, for the sake of parsimony, and because the added value of person-centered analyses is greater in the presence of qualitative (shape) differences across profiles (see Marsh et al., 2009; Meyer et al., 2013), we retained the five-profile model as our final solution.
Examination of the most likely assignment of each participant into the various combinations of profiles also reveals the impressive stability of membership into these profiles. In fact, only 2.76% of the cases switch classes over time, corresponding to 27 participants out of the 978 included in the sample. Also, the very high entropy indicator (.92) associated with this final model reveals that classifications were quite accurate for most participants. Interestingly, when we further examined the probability of membership into the various profiles for the participants who changed profile over time, we noted that at least half of them had an unclear dominant profile membership at Time 1 (with only 45% to 65% likelihood of being a member of their Time 1 profile, but also an elevated likelihood of being a member of the profile they joined at Time 2). In other words, half of the very few employees who changed profile over time were already “border” cases (i.e., participants with an unclear dominant profile) at the beginning of the study so their “changing” of profile may only reflect classification imprecision (e.g., similar to measurement error in classical factor analyses) rather than a real modification of their commitment profiles over time. This reinforces the fact that commitment profiles are highly stable and that very few employees change profile over time, even when exposed to important organizational changes.
To aid in the interpretation of the five commitment profiles, we plotted the means for AC, NC, and CC (see Figure 1). Consistent with most previous research, we first plotted the raw means to illustrate absolute and relative differences in the three mind-sets across profiles. However, we also plotted the normed means to take into account deviations from population levels of commitments in the interpretation of the profiles (see Figure 2). To this end, we used normative data reported by Meyer, D. Stanley, et al. (2012) for the English Canadian studies included in their meta-analysis.
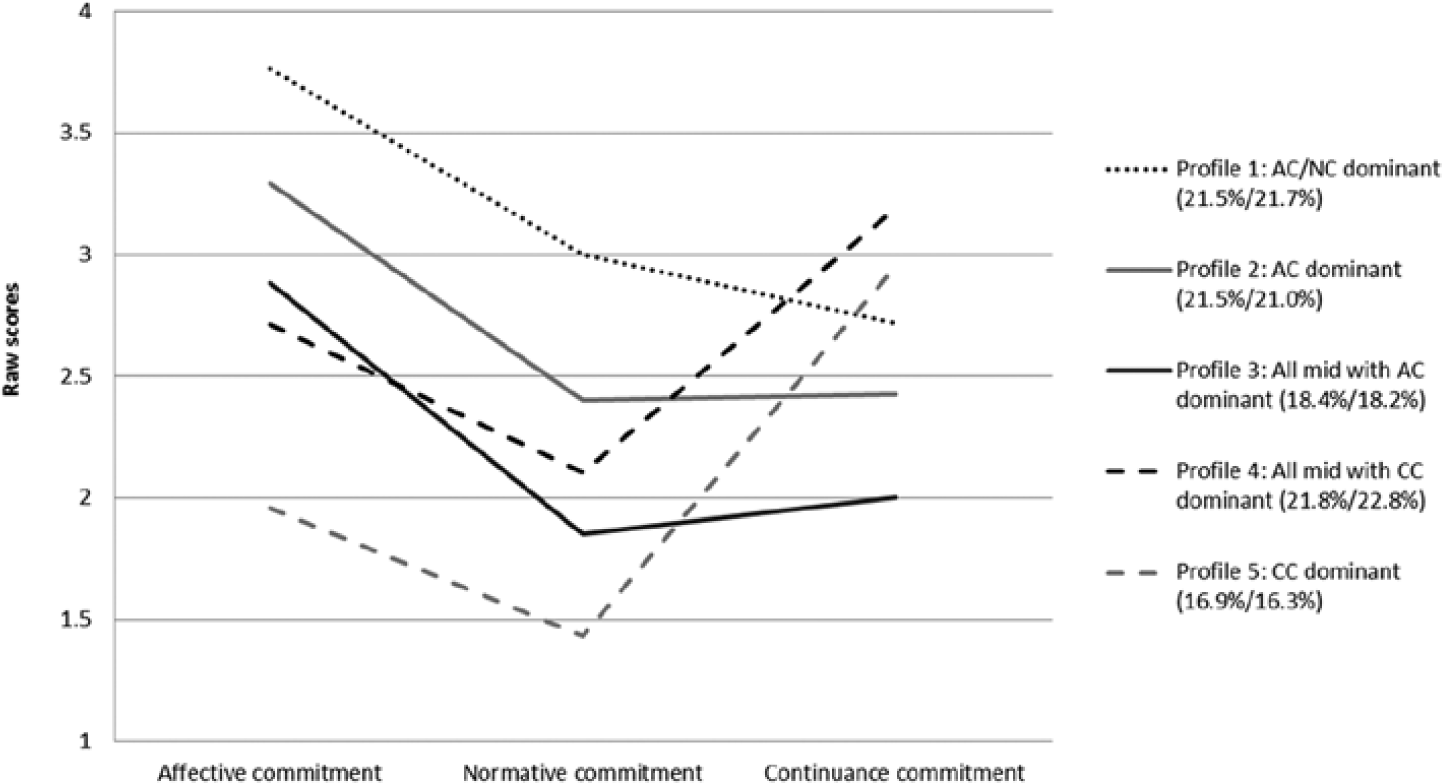
Final Selected Latent Transition Analysis Model (Plotted Based on Raw Scores)

Final Selected Latent Transition Analysis Model (Plotted Based on Normed Scores)
Looking first at the raw mean plot in Figure 1, it can be seen that Profile 1 is characterized by comparatively high scores on AC and NC. Indeed, AC and NC are higher in this profile than in any other profile and, while both are above the scale midpoint (3), CC scores fall below the midpoint. Therefore, we labeled this profile AC/NC-dominant. This profile describes close to 22% of the employees. In Profile 2, which describes approximately 21% of the employees, only the AC mean is above the scale midpoint, thus we used the label AC-dominant. The shape of Profile 3 is similar to that of Profile 2, but the levels of all three mind-sets are lower and all fall below the midpoint of the scale. We labeled this profile all mid with AC-dominant to reflect the fact that, despite AC being somewhat elevated, the overall level of commitment was only moderate. This profile describes approximately 18% of the employees. Profiles 4 and 5 were somewhat similar in shape in that the mean for CC is considerably stronger than the means for AC and NC. However, all three means were higher in Profile 4 than in Profile 5. Given that the means for Profile 4 were in the moderate range, we labeled this profile all mid with CC-dominant. Because the AC and NC means for Profile 5 were very low, we labeled this profile CC-dominant. Whereas Profile 4 describes approximately 22% of the employees, the least favorable Profile 5 describes closer to 17% of them.
The plot of the norm-standardized means shown in Figure 2 appears similar, particularly in shape, to that for the raw means. However, looking at the norm-standardized means, it is clear that the majority of the means fall below those for Canadian employees in general (i.e., above zero). Indeed, only the AC and NC means in Profile 1 and the AC mean in Profile 2 are above average. The other most notable difference between the two sets of plots is in the relative strength of NC within each profile. This is perhaps most obvious in the AC/NC-dominant profile where the means for the standardized AC and NC scores are more similar than the means for the raw scores. This reflects the fact that for Canadian employees, the mean is generally lower for NC than for AC.
These profiles depicted in Figures 1 and 2 are similar to those commonly found in previous research. Perhaps the most notable exclusions are the fully committed and uncommitted profiles. Thus, our findings provide partial support for Hypothesis 1. The fact that the same profiles were identified at both time points, prior to and following the change, provides strong support for Hypothesis 2. Considering this, and the fact that very few individuals shifted between profiles over time, it is not surprising that the size of the profile groups reflected in Figure 1 are also very similar. It is also noteworthy that the different profiles are so similar in size, suggesting that they are all meaningful subgroups with the participating organization.
Predicting Profile Membership From Demographic Characteristics
To explore the implications of demographic differences on commitment profiles, we included demographic variables in the LTA model as predictors of the Time 1 profiles. The CC-dominant profile was selected as the reference profile because, based on previous research, it is the least favorable of the profiles identified in this study. The multinomial regression statistics compared the likelihood of belonging to a particular profile (for example, AC/NC-dominant profile) versus the reference profile (the CC-dominant profile in this case). The results of these analyses are reported in Table 3. Recall that the ORs reflect the change in likelihood of membership in the target profile versus the comparison profile for each unit increase in the predictor. An OR above 1 means that as the value of a predictor increases, the likelihood of being classified in a target profile (e.g., AC/NC-dominant group) is higher than the likelihood of being classified in a reference profile (i.e., CC-dominant group). Conversely, an OR below 1 means that, as the value of a predictor increases, the likelihood of being classified in a target profile is reduced, as compared to the likelihood of being classified in a reference profile (i.e., CC-dominant group).
Demographics and Management Trustworthiness Predicting in Latent Transition Analyses

Note: AC = affective commitment; CC = continuance commitment; NC = normative commitment; OR = odds ratio. The CC-dominant profile was selected as the reference profile. Gender is coded as 0 (male) or 1 (female). Full-time is coded as 0 (part-time) or 1 (full-time). Level is coded as 0 (frontline) or 1 (manager). Union membership is coded as 0 (no) or 1 (yes).
p < .05.
p < .01.
Inspection of Table 3 reveals a few statistically significant associations between the demographic variables and the likelihood of membership into a profile. For example, managerial level significantly predicted the relative likelihood of membership in the two AC-dominant profiles (i.e., all mid with AC-dominant profile and AC-dominant profile). Interestingly, it did not predict likelihood of membership into the arguably most desirable AC/NC-dominant profile. Similarly, tenure negatively predicted the relative likelihood of membership in the two AC-dominant profiles, but not in the AC/NC-dominant profile. Gender negatively predicted the relative likelihood of membership in the profile characterized by midlevels of commitments with AC-dominant, suggesting that men are more likely to be members of this profile than women. No other profiles were predicted by gender. Finally, union membership negatively predicted the relative likelihood of membership in the AC/NC-dominant profile. Overall, despite some significant associations, the demographic variables were generally not strong predictors of profile membership.
Predicting Profile Membership From Perceived Management Trustworthiness
A final set of models were estimated in which initial levels of perceived top management and supervisor trustworthiness were included as predictors of profile membership at Time 1. In these same models, changes in trustworthiness ratings from Time 1 and Time 2 were included as predictors of profile membership at Time 2. The latter analysis was conducted to determine whether changes in levels of perceived trustworthiness would contribute to the prediction of profile membership at Time 2 above and beyond the prediction afforded by Time 1 profile membership (i.e., longitudinal stability). Thus, this corresponds to an estimation of whether changes in levels of perceived trustworthiness could contribute to the prediction of change in profile membership over time. To ease the interpretation of the odds ratio produced by these multinomial logistic regressions, the predictors (i.e., Time 1 trustworthiness and change in trustworthiness) were converted to z scores before the analyses. Thus, a z score of 1 on the initial levels of Time 1 trustworthiness reflects a perception of the trustworthiness of the target that is higher than the average perception by 1 SD. For the change scores, 1 reflects a level of change that is greater than the average level of change by 1 SD. It should be noted that the observed levels of changes were in fact so low so as to create problems in the estimation of the coefficients when not converted to z scores. This is because OR coefficients reflect changes in the outcomes as a function of 1 unit in the predictor, which, in the case of the raw change scores, reflects an extreme level of change. Thus, the raw latent change scores for top management and immediate supervisor trustworthiness have, respectively, means of 0.11 and −0.01, with SDs of 0.41 and 0.56. So, that means that a change of 1 in raw score units corresponds to a change of approximately 2 SDs over the mean, which is enormous.
Top management trustworthiness at Time 1 positively predicted the likelihood of being a member of all four profiles relative to the reference (CC-dominant) profile. Inspection of the odds ratios reveals that top management trustworthiness predicts likelihood of membership in the profiles more strongly as the favorability of the profiles increases. Specifically, the odds ratios for membership in the two all mid profiles (i.e., all mid with CC-dominant or with AC-dominant) were similar (2.51 and 2.34, respectively), but were twice as high when predicting membership into the AC-dominant profile (5.92) and 5 times as high when predicting membership into the AC/NC-dominant profile (11.78). Therefore, an increase in perceptions of management trustworthiness substantially enhanced the chance of an employee corresponding to a more favorable profile.
Although the pattern of findings was similar for analyses involving the trustworthiness of immediate supervisor, including the increase in odds ratio with profile favorability, the size of the odds ratio was considerably smaller. Specifically, the odds ratios for immediate supervisor trustworthiness ranged from 1.30 to 1.82 compared to the 2.34 to 11.78 range for top management trustworthiness. Together, these findings support Hypothesis 3 regarding the implications of perceived management trustworthiness for commitment profiles. They were also in line with Dirks and Ferrin’s (2002) results, demonstrating that top management trustworthiness is more important than immediate supervisor trustworthiness in predicting commitment.
Perhaps not surprisingly, given the great stability of the profiles noted above, changes in perception of management trustworthiness did not generally predict the likelihood of membership in the Time 2 profiles beyond the prediction afforded by the Time 1 profile membership. Indeed, only one significant effect was observed—increases in the perceived trustworthiness of top management positively predicted increases in the relative likelihood of switching from the reference profile (CC-dominant profile) at Time 1 to an all mid with CC-dominant profile at Time 2. In addition, no significant effects were found for changes in immediate supervisor trustworthiness. The fact that the only significant prediction was found for change in perceptions of top management trustworthiness provides weak support for Hypothesis 4. Again, it must be emphasized that these findings are attributable to the fact that the profiles were highly stable over time and that classification of employees into these profiles was highly accurate (as illustrated with the .92 entropy indicator) and stable. Recall that less than 3% of the sample were deemed to have switched profiles from Time 1 to Time 2. This explains the relatively high standard errors associated with the multinomial logistic regression coefficients for the changes scores. The largest transition involved 10 individuals who moved from the CC-dominant profile at Time 1 to the all mid with CC-dominant profile at Time 2, which helps to explain why this was the only transition predicted by changes in top management trustworthiness.
Within-Time Comparisons of the Profile Groups on Turnover Intention
The results from the next set of analyses in which turnover intention was included as an additional profile indicator are reported in Table 4. For both time points, the omnibus test of mean differences was highly significant. Also noteworthy is the fact that the means and variances of turnover intention within each profile are very similar across time points, again reinforcing the stability of the profiles. In fact, an additional omnibus test of mean differences across time points confirmed that they did not differ significantly from one another (χ2 = 3.87, df = 5, p = .57). A detailed examination of mean differences shows significant differences between most of the profiles, with only the all mid with CC-dominant profile and the AC-dominant profile not significantly different from one another. Although turnover intentions are similar for employees with these two profiles, the motives (desire vs. perceived cost) are different. Perhaps the most surprising finding is that employees with an all mid with AC-dominant profile were more likely to intend to leave than those with an all mid with CC-dominant profile. This might suggest that at moderate levels, CC provides a stronger tie to the organization than does AC. Perhaps least surprising, and consistent with previous research, turnover intentions were lowest among employees with an AC/NC-dominant profile. Overall, the pattern of means is largely consistent with that from previous research (e.g., Somers, 2009, 2010).
Within-Time Comparisons of Commitment Profiles on Turnover Intention

Note: AC = affective commitment; CC = continuance commitment; NC = normative commitment. Means with similar superscripts within each time point are not significantly different from one another; all of the other means are significantly different from one another (*p ≤ .01).
Discussion
Our study extends earlier commitment profile research in several important ways. First, we provide further evidence for the heterogeneity of the workforce with regard to commitment mind-set profiles, demonstrate the cross-sample generalizability of several such profiles, and provide the first evidence for within-sample temporal stability of the profile structure. Second, we provide some of the first evidence that the likelihood of having a particular profile, and of changing profiles over time, can be predicted. Specifically, we demonstrated that, in an organization undergoing change, perceptions of management trustworthiness were associated with formation and change in commitment profiles.
Commitment Profiles and Profile Stability Over Time
Our findings regarding profile structure and stability help to address two potential concerns about the utility of the profile approach: first that the number of potential profiles is too great to be of practical value, and second that these profiles might fluctuate in unpredictable ways across and/or within samples. Our analyses revealed five commitment profiles, all of which were similar to profiles identified in previous research—AC/NC-dominant, AC-dominant, CC-dominant, and two midlevel profiles (one with AC-dominant, and one with CC-dominant). Thus, the number of potential profiles appears to be quite small—between five and nine (cf. Meyer, L. Stanley, et al., 2012). Moreover, these profiles can arguably be grouped into smaller subsets with similar outcomes, including (a) the fully committed and AC/NC-dominant profiles, (b) the AC-dominant and AC/CC-dominant profiles, (c) the midlevel profiles, (d) the CC-dominant and CC/NC-dominant profiles, and (e) the uncommitted profile. This limited set of profiles is certainly manageable, and emerging evidence concerning their implications for organizations and employees suggests the distinctions are worth making.
With regard to stability, we found not only that the profiles in our sample were similar to those in other studies, but also that these profiles were relatively stable within a sample (at least for a period of 8 months), even under conditions of organizational change. Indeed, we even found considerable stability in individual employee’s profiles as they were exposed to the change. As we note below, the change being experienced by these employees may not have been as dramatic or turbulent as might occur in other organizations. Still, the fact that profiles remained relatively constant under these conditions should allay fears that commitment profiles are too ephemeral and responsive to day-to-day fluctuations in working conditions to be of practical value. Of course, this stability does not mean that profiles are insensitive to management interventions. As we discuss below, profile formation and change appears to be somewhat sensitive to perceptions of management trustworthiness.
Perceived Management Trustworthiness and Commitment Profiles
With the odd exception (e.g., Gellatly et al., 2009), little attention has been paid to date to the formation of commitment profiles, and we are unaware of any studies that have examined change in profile over time. Although we conducted exploratory analyses with several demographic variables (e.g., age, gender), we found little in the way of systematic relations with profile membership. Given the exploratory nature of these analyses and the lack of consistency in the observed effects, the findings are difficult to interpret with confidence. Therefore, we focus attention on the antecedent of primary interest in this study—the perceived trustworthiness of management.
Due to existing disagreement concerning the dimensionality of Mayer and colleagues’ (1995) trustworthiness measure, we first conducted analyses to determine how the facets (ability, benevolence, integrity) should best be treated in testing our hypotheses: as individual factors, as a unidimensional construct, or as latent indicators of a higher-order construct. These analyses provided strong evidence for the existence of a higher-order construct, and therefore we conducted our primary analyses using this construct as our predictor. As expected, we found that perceptions of the overall trustworthiness of top management and the immediate supervisor related positively to the relative odds of membership in the more favorable profiles. The strength of these relations increased directly with profile favorability. Interestingly, this pattern mirrors that found in previous research involving outcomes (e.g., retention, job performance, OCB, well-being). Thus, those profiles associated with the highest levels of perceived management trustworthiness are also the most desirable from an outcomes perspective.
Our focus on global trustworthiness is not to suggest that employees never make distinctions, or that organizations should not use the three-facet model as a guide in shaping employee perceptions (e.g., focusing on demonstrating ability when it is likely to be a major concern for employees). To the contrary, we argue below that this is precisely what organizations should do. However, based on recent findings in other domains, more research may be needed to determine exactly how employees form and utilize perceptions of trustworthiness. For example, it has been demonstrated that employees form global perceptions of organizational justice (e.g., Ambrose & Schminke, 2009) and develop general attitudes (Harrison, Newman, & Roth, 2006), and that these global variables mediate the influence of individual facets of justice (e.g., distributive, procedural, interactional) or specific attitudes (e.g., job satisfaction, job involvement, attitudinal commitment) on their behavior. The same might apply to trustworthiness, where global assessments reflecting the higher-order factor may mediate the impact of the facets. Therefore, it would be interesting to determine whether, and when, employees form inconsistent perceptions of the three facets. If they do make distinctions, are these reconciled in the formation of a global assessment of trustworthiness, or do employees react differentially to the pattern of facet scores?
We also found some support for Dirks and Ferrin’s (2002) observation that employees’ organizational commitment is more sensitive to the trustworthiness of top management than of their immediate supervisor. Although the pattern of results was generally similar for the two foci, the effects were clearly stronger for top management. This is to be expected given that top management is generally seen as responsible for organization-level events, including the implementation of change initiatives such as that experienced by employees in the current study. Of course, if correspondence between the target of the perception and commitment is indeed the explanation (cf. Lewin, 1951), then the reverse might be expected in studies involving other foci of commitment. For example, in a study of commitment to a work team or project, trust in immediate supervisor may play a substantially greater role.
Finally, our ability to test our hypothesis regarding the prediction of profile change was limited by the fact that we found very little evidence of change. Interestingly, the largest shift was from the CC-dominant profile at Time 1 to the all mid with CC-dominant profile at Time 2, and this movement was predicted by increases in the level of perceived trustworthiness of top management. These findings, combined with the fact that perceptions of trustworthiness of both top management and immediate supervisor increased over time (see Table 1), suggest that, rather than undermining commitment, organizational change might provide opportunities for management to demonstrate their trustworthiness and foster more desirable commitment profiles (see Meyer, 2009).
We can only speculate on why we did not find stronger evidence for individual profile change in our sample. It is possible that the turbulence created by the change under investigation was not as great as initially expected, or that it was managed particularly well. Although it has been argued that radical changes can undermine trust (Gillespie & Dietz, 2009) and commitment (Meyer, 2009), it might do so only under some conditions. For example, Tomlinson and Mayer (2009) argued that the implications for managerial actions on perceptions of their trustworthiness will depend on the consequences for employees and, importantly, the attributions they make for these actions. The greatest damage to perceptions of trustworthiness can be expected when employees attribute negative outcomes to stable, internal, and controllable factors (e.g., managers’ persistent tendency to make decisions that favor themselves or shareholders rather than employees). Viewed with this lens, the change faced by the organization in this case was stimulated by deregulation of the industry (an external factor). Thus, senior managers may have been seen as taking appropriate action to keep the company competitive in the newly deregulated industry—a change that would benefit the majority of employees as well as other stakeholders. Indeed, it may have been management’s response to this external “threat” that contributed to some employees increasing their perceptions of trustworthiness and the accompanying shift to a more desirable profile. This leaves open the possibility that more negative perceptions of management might be observed in other change contexts with an accompanying shift to less desirable commitment profiles.
Limitations and Future Directions
As is true of any study, it is unclear whether our findings generalize beyond the current sample and context. The fact that we found many of the same profiles as previous research (cf. Meyer, L. Stanley, et al., 2012), and that these profiles related similarly to turnover intention, suggests that our sample was not particularly unique. Thus, our findings help to bolster confidence in the notion that the workforce consists of heterogeneous subgroups with distinct commitment profiles. We also have confidence in the generalizability of our findings regarding within-time relations between perceived trustworthiness and profile membership. However, as noted above, the context surrounding the organizational change in our study might not have been conducive to the kinds of attributions needed to undermine perceptions of top management trustworthiness (Tomlinson & Mayer, 2009). A useful strategy to investigate this issue in the future would be to assess employees’ attributions for the organizational change (or any other precipitating event) to use as a moderator in within-study analyses or cross-study comparisons. The same applies to other potential contextual factors such as implications for job security, workload, or compensation.
Our investigation of profile formation and change was admittedly limited. There are likely to be many factors other than management trustworthiness involved in shaping commitment profiles. It would be particularly useful to identify factors that can help to differentiate more clearly between specific profiles. For example, our findings suggest that when employees perceive management as trustworthy, the odds of having one of the more desirable profiles increases, and that the odds increase as a function of the level of desirability. However, if it is actually the case that an AC/NC-dominant profile is qualitatively distinct from an AC-dominant profile, it would be useful to know what specific initiatives, or combination of initiatives, are likely to foster the former as opposed to the latter. That is, what does it take to foster a moral imperative mind-set (Gellatly et al., 2006) rather than merely an affective bond or desire to remain?
Finally, two commonly expressed concerns with studies such as ours involve the use of a nonexperimental design and the potential for common method bias. The nature of the constructs makes it difficult to use direct manipulation. Nevertheless, future studies might take advantage of situations that involve the natural manipulation of conditions likely to affect perceptions of trustworthiness and test for mediating effects of the latter on profile formation or change. Similarly, it would have been difficult to measure our key constructs without using self-report. However, there are two reasons why we believe our findings reflect more than method bias. First, profile analyses detected different patterns of high and low scores on the commitment mind-sets within the sample. Second, we found that relations between trustworthiness perceptions and commitment profiles varied depending on focus (top management or supervisor). Strong method bias would have worked against our finding both of these patterns in our data.
Implications
Our findings have implications for both commitment theory and practice. With regard to theory, they provide further support for the notion that several organizational commitment profiles (e.g., AC/NC-dominant, AC-dominant, midlevel, CC-dominant) are common among the workforce. Perhaps more important, these profiles demonstrate remarkable temporal stability at both the individual and sample levels. Thus, in conjunction with previous studies, our findings help to alleviate concerns that profiles might be too complex and unstable to be of heuristic value.
An important next step in profile research is to address explanations for, and limits to, stability. As we noted earlier, existing theory and research provide arguments for both stability and instability. Most situations will likely involve a mix of forces for and against change. Indeed, as is often the case in psychological and organizational research, complex questions are rarely answered in an either/or manner, suggesting that it might be worthwhile to test models that include state and trait components (cf. Cole, Martin, & Steiger, 2005; Morin, Maïano, et al., 2011). Such models would allow for greater precision in disentangling stable trait and unstable state aspects of commitment and in studying the determinants and outcomes of these components. For example, based on repeated measures of commitment, such models would allow for the separate consideration of trait commitment (i.e., trajectories of commitment over time showing some form of longitudinal consistency) from state commitment (i.e., time-specific fluctuations that deviate from the estimated smoothed individual trajectory), and to consider predictors and outcomes of both components.
Also of relevance to commitment theory are our findings regarding the AC/NC-dominant profile. This profile has commonly been found to associate more strongly with retention, job performance, and OCB than the AC-dominant profile (e.g., Somers, 2009, 2010; Wasti, 2005). Its clearest rival is the fully committed profile that also includes strong AC and NC. We also found that turnover intention was lowest for employees in the AC/NC-dominant profile. In addition, this profile had a strong association with perceived management trustworthiness. The AC/NC-dominant or moral-imperative profile (Gellatly et al., 2006) is only beginning to garner attention, and research is shedding new light on the relevance of NC more generally (cf. Meyer & Parfyonova, 2010). It is possible that the combination of obligation (NC) with desire (AC) provides an optimal mix of self-interest and collective interest where employees are willing to exert effort for the benefit of both when possible, and to make personal sacrifices for the collective when the situation demands it. This AC/NC combination might be what theorists are referring to when they describe commitment as an outcome of transformational leadership (e.g., Bass, 1999), perceived organizational support (e.g., Eisenberger, Fasolo, & Davis-LaMastro, 1990), organizational justice (e.g., Sweeney & McFarlin, 1993), and relational psychological contracts (e.g., Rousseau, 1995). However, research to date has focused almost exclusively on AC. The accumulating evidence suggests that it might be time to look beyond AC alone. The same might be true for managers.
From a practical perspective, our findings regarding profile stability combined with evidence linking commitment to personality (Erdheim et al., 2006; Panaccio & Vandenberghe, 2012) and values (Clugston et al., 2000; Wasti, 2003) suggest that organizations might begin to establish desired forms of commitment in the selection process. Some personality characteristics (e.g., conscientiousness) and values (e.g., collectivism) might contribute directly to the development of an AC/NC-dominant profile. Other personality characteristics and values may need to be targeted differentially to achieve fit with the organization’s goals, values, and mission (see Kristof-Brown, Zimmerman, & Johnson, 2005).
Regardless of how predisposed employees might be to developing specific commitment profiles, their experiences at work will play an important role in shaping or changing their commitment. Early experiences and those that stimulate sense making (Morrison & Robinson, 1997; Tomlinson & Mayer, 2009) are likely to have the strongest influence. Although it is too early to provide clear prescriptions for how to manage these experiences, our study suggests that behaving in a way that establishes perceptions of trustworthiness may be important. Employees who perceived top management as trustworthy going into the change tended to have more desirable commitment profiles than those who did not. Although we did not detect much change in commitment profiles over time, we found evidence that positive changes in perceptions of trustworthiness were associated with a positive shift in profile. This finding is consistent with the idea that organizational change affords an opportunity to build trust (Meyer, 2009). In the present case, despite the fact that there were layoffs and some permanent positions were replaced by contract positions, the senior management team took a number of steps (e.g., town hall meetings) to communicate the rationale for the change and listen to concerns, which may have helped to maintain perceptions of trustworthiness, and perhaps even enhance it in the eyes of some employees.
There are many things that organizations can do prior to and during a change to maintain or enhance perceptions of trustworthiness. To illustrate, consider the facets of trustworthiness identified by Mayer et al. (1995)—ability, benevolence, and integrity—as key considerations. Management must instill confidence in their ability to manage the change effectively. A track record of success will help, but, in its absence, evidence of a clear and rational vision for the future could help, as might evidence of “small wins” (Kotter & Cohen, 2002) in the early stages of change. Consultation with employees at the various stages of change, where appropriate, will help to foster perceptions of both benevolence and integrity. Even when change has detrimental consequences for some employees, benevolence and integrity can be fostered by efforts to acknowledge and compensate those affected. An important key to all three facets is continuous, open, and honest communication (Gopinath & Becker, 2000; Schweiger & DeNisi, 1991). These and other strategies designed to foster perceptions of trustworthiness are likely to pay off in terms of building, maintaining, or enhancing desirable commitment profiles among employees during the change. Although it is beyond the scope of the present discussion, authors of a recent special topic forum in the Academy of Management Review provide numerous suggestions for ways that organizations can rebuild trust once it has been damaged (see Dirks, Lewicki, & Zaheer, 2009).
Conclusion
Our findings provide preliminary evidence for the temporal stability of commitment profiles and, by implication, offer some justification for targeting profile development as a strategy for achieving a healthier and more productive workforce. Efforts to foster perceptions of trustworthiness in the eyes of employees may be one key to fostering more desirable profiles. More research is needed to identify other important drivers, perhaps beginning with other variables (e.g., perceived organizational support, transformational leadership) that have been studied largely in relation to individual mind-sets.
Footnotes
Acknowledgements
This article was accepted under the editorship of Deborah E. Rupp.
The research reported in this article was supported by a research grant from the Social Sciences and Humanities Research Council to John P. Meyer.
Notes
References
Supplementary Material
Please find the following supplemental material available below.
For Open Access articles published under a Creative Commons License, all supplemental material carries the same license as the article it is associated with.
For non-Open Access articles published, all supplemental material carries a non-exclusive license, and permission requests for re-use of supplemental material or any part of supplemental material shall be sent directly to the copyright owner as specified in the copyright notice associated with the article.
