
Abstract
The aim of this article is to assess the role played by creativity and other components of human capital on the process of economic growth for 257 regions in the twenty-seven-member countries of the European Union. We first decompose the regional human capital endowment to distinguish between the educational component (the share of individuals with a university degree) and the creativity component, which considers the actual occupations of individuals in specific jobs like science, engineering, education, arts, and entertainment. We define three nonoverlapping categories of human capital (creative graduates, bohemians, and noncreative graduates), which are simultaneously included in a spatial model as determinants of regional growth measured by labor productivity. After extending the analysis to control for other relevant factors which may affect regional development, such as physical, technological, and social capital, cultural diversity, industrial and geographical characteristics, we provide robust evidence on the growth-enhancing effects of graduates, in particular for those of the creative category.
Introduction
The role of creative people as one of the main drivers of economic performance at the regional level has received a huge amount of interest since the publication of Florida’s seminal book in 2002. The idea that the presence of individuals working in creative jobs like sciences, education, culture, and arts enhances local development has been perceived especially among policy makers. It is now rare to see a metropolitan or a regional development plan which does not include among its strategic goals the attraction of creative individuals as the key determinant of local growth. According to Florida, the local economy greatly benefits from the presence of creative individuals since their main attitude is to identify problems, discover original solutions, generate new ideas, and new technology. All these activities are supposed to create a favorable environment for the attraction of new firms and to generate a virtuous circle that enhances regional development.
At the same time, academic researchers have promptly disputed Florida’s definition of creative class for being too broad and vague to be applied in empirical models of regional performance. More specifically, the focus of the debate has shifted to how to discriminate between the creative and the education components, both of which are essential in several occupations. Indeed, if we look at the list of creative occupations proposed by Florida it clearly turns out that most of them (medical doctors, engineers, lecturers, and so on) require the achievement of a university degree. This strong overlapping between creativity and the traditional measures of human capital, like educational attainment, has been remarked by Glaeser (2005) who claims that creativity does not generate an independent effect on local performance.
As a matter of fact, while the empirical literature has provided robust evidence on the role played by human capital on economic growth, even when the analysis is performed within quite different settings (data sets, geographic units, time periods, econometric methodologies, and controls), the evidence of creativity in enhancing economic development is still debatable. The contrasting results provided are largely due to the lack of a clear-cut definition of what creativity is meant to entail from an economic perspective. Overall, the unclear identification of the creative and education components in the empirical analyses generates a measurement problem inducing either multicollinearity or omitted variable bias. In both cases, this leads to confusing evidence as the effects of creativity on local performance are inadequately estimated.
A proper discrimination between the education and creativity components of human capital is of paramount importance for both academics and policy makers alike, especially for those in charge of advising and implementing development policies at the local level. Is it better to support the accumulation of high human capital per se, or policies should aim at attracting graduates in specific fields, such as those related to science and technology? From a labor market perspective, should the policy emphasis be placed on creative jobs as these can trigger the formation of further jobs by exploiting their innovative potential?
In this article, we aim to address these questions by analyzing the role played by creativity and other components of human capital on the process of economic growth for 257 regions of the twenty-seven European Union (EU) member countries over the period 2002–07. To overcome the creativity–education overlapping issue, we build on a previous contribution of ours, Marrocu and Paci (2012), where we proposed a novel classification in order to derive three nonoverlapping categories of human capital—creative graduates, bohemians, and noncreative graduates—obtained on the basis of the information available on people holding a university degree, the education component, and on individuals’ actual occupations in specific jobs, the creativity component.
In this article, we move forward with respect to Marrocu and Paci (2012), where after addressing the measurement problem of human capital indicators we analyze the impact of creativity on the level of total factor productivity (TFP), since in the present contribution we assess the role of education and creativity as key determinants of regional development. Following the standard approach adopted in the growth literature (starting from the seminal contribution by Mankiw, Romer, and Weil 1992), we measure regional development in terms of the growth rate of labor productivity. This measure is preferred with respect to employment growth, largely used in the literature on creativity, since the latter does not account for the process of production restructuring, which often implies a labor reduction to achieve a good performance of the local economy. However, in order to compare our findings with previous literature, we also analyze models for employment growth, while TFP growth is considered as an alternative indicator of economic dynamics for robustness checks.
Another original contribution of this article is that the sensitivity of the effects related to education and creativity are assessed by extending the analysis to control for a wide set of relevant factors. These include physical, technological and social capital, cultural diversity as well as industrial and geographical characteristics, all of them are supposed to remarkably shape regional development patterns. Finally, in order to capture the possible interdependence among the geographical units we carry out our empirical investigation within a spatial econometric framework.
The article is organized as follows. The second section discusses the literature on creativity and its role in regional development. The third section deals with data measurement issues for both the human capital variable and the regional control variables. In the fourth section, the empirical models and some methodological issues are discussed. The results for the basic model are presented in the fifth section together with a robustness analysis for alternative classifications of the human capital variables and for different specifications of the dynamics of the economic performance. Followed by the sixth section which presents an extension of the basic model with the introduction of a set of control variables which characterize the local environment. Finally, the last section concludes.
Literature Review
As we have pointed out in the Introduction, the empirical literature has provided robust evidence on the key role played by human capital, usually measured by education attainments, in influencing productivity levels and growth. In his seminal paper, Lucas (1988) identified human capital as the key factor in fostering endogenous growth and afterward the significant role of education has been widely recognized at the country level (Mankiw, Romer, and Weil 1992; Benhabib and Spiegel 1994) and also at the regional level (Moretti 2004; Ramos, Suriñach, and Artís 2010; Dettori, Marrocu, and Paci 2011). Moreover, the growth-enhancing effect of human capital is becoming even more relevant at the regional level since the differences in human capital endowments across regions tend to increase due to local agglomeration effects (Berry and Glaeser 2005) and to spatial flows of skilled people (Faggian and McCann 2006, 2009).
There are still several open questions related to how to measure human capital in general, how to distinguish between its education and creativity components, whether there are significant differences in the effects of such components when they are analyzed as economic performance drivers.
Since Florida’s (2002) seminal contribution, the concept of creativity, as an influential driver of local performance—deemed to be even more powerful than education—has attracted the attention of scholars and policy makers. Florida’s idea is that the local economy greatly benefits from “creative” individuals, defined as people employed in occupations like sciences, engineering, education, culture, arts, and entertainment. These people, often labeled as “creative class,” fulfill the role of identifying problems, discovering original solutions, generating new ideas and new technology, and all these functions are expected to favor regional development.
However, from the very beginning there has been a dispute over Florida’s definition of creative class, which has been criticized on the ground of being too broad and vague to be applied in empirical models for assessing the determinants of regional performance. For instance, Markusen (2006) describes the definition of creative class as a generic category which assembles several occupations with very little in common. On the same vein, McGranahan and Wojan (2007) criticize Florida’s creative class for being excessively varied since it includes also several technical jobs. The need to reduce the number of different occupations included in the definition of creative class is also suggested by Comunian, Faggian, and Li (2010) since the high level of heterogeneity reduces the explanatory power of the empirical evaluation. In general, most empirical works start discussing the meaning of creative class and then propose their own classification of creativity, which depends mainly on the specific aim of the study and on the data available.
Closely related to the definition issue is the debate on how to discriminate between the creative and the education components inherent in several occupations. In general, as we have previously underlined, education has been widely used to measure the human capital endowments of the economies and thus to assess its role on economic performance. At the same time, if we look at the list of creative occupations proposed by Florida, it is quite evident that most of them require the attainment of a high education degree. Just to give some examples, it is plain that to work as a medical doctor or an engineer or an architect one needs a university degree. This strong overlapping between creativity and the traditional measures of human capital like educational attainment has been first remarked by Glaeser (2005) who disputes that creativity may exert an independent effect on local performance. 1 This issue is usually acknowledged in the theoretical literature, but it is often neglected in empirical investigations.
In what follows, restricting our attention to the empirical studies directly related to the analysis presented in this article, we provide a brief account on the most salient results provided on the role played by creativity on regional performance. Table 1 summarizes the contributions which refer to different geographical contexts, like the U.S. metropolitan areas, the regions of Northern European countries like the Netherlands (NL), Germany (DE), Sweden (SE), Finland (FI), Norway (NO), Denmark (DK), and the regions of the EU.
Econometric Studies on the Relationship between Creativity and Regional Development.
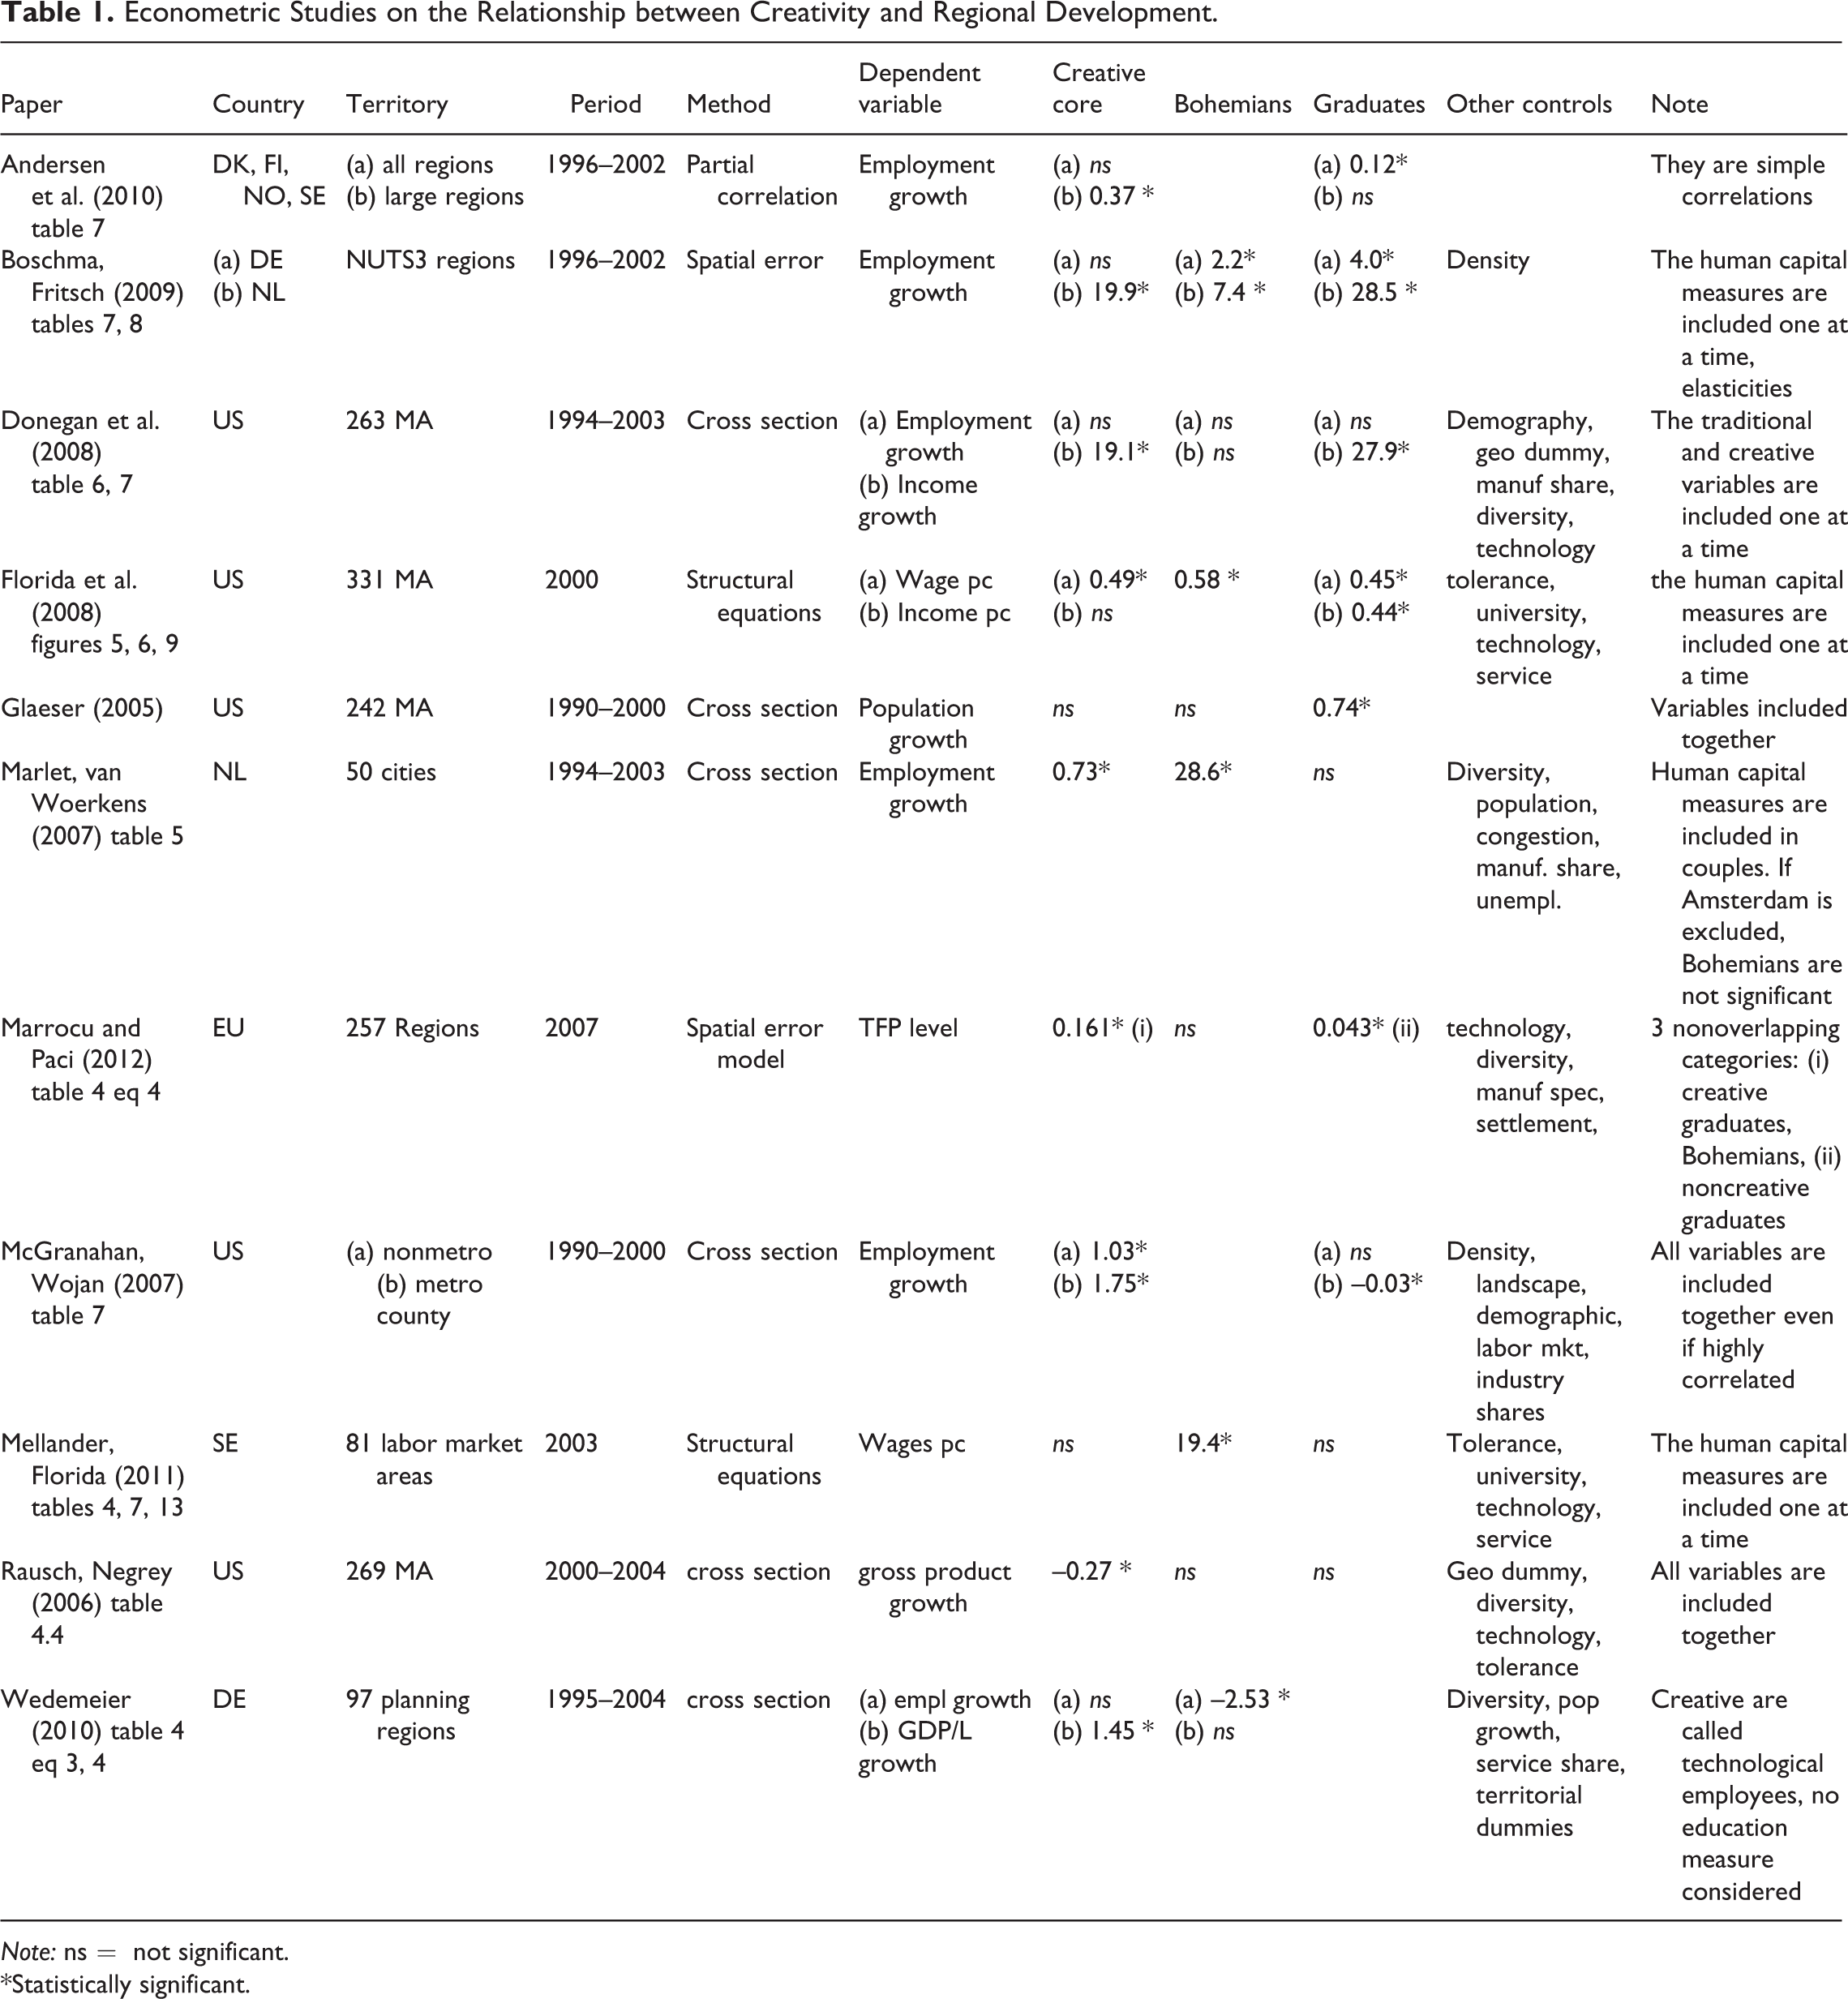
Note: ns = not significant.
*Statistically significant.
Glaeser (2005), in a critical review of Florida’s (2002) book, estimates a simple cross-section model of population growth in the U.S. metropolitan areas over the 1990s where an indicator of schooling (population with a bachelor’s degree) is included as an explanatory variable along with alternative measures of creativity. The results show that once one controls for the traditional measure of human capital—education—all the creative indicators become irrelevant, proving that creativity per se does not exert a direct effect on local economic performance. Rausch and Negrey (2006) show that the creative class has an unexpected negative impact on the growth of the gross product for U.S. metropolitan areas if an educational attainment measure is also included together with other control variables like diversity, tolerance, technology, and territorial characteristics.
Similar results are found by McGranahan and Wojan (2007), who extend the analysis to the rural U.S. counties and employ a restrictive definition of creative occupations (termed ‘recast creative class’). Controlling for a full set of local features, they show that creativity has a positive and significant effect on employment growth. Also in this contribution the issue of a high overlapping among the creativity and education variables, although acknowledged, is not addressed in the econometric estimation, so that, when the two variables are included together in the same regression, the endowment of graduates turns out to be not significant as a clear indication of a multicollinearity problem.
A different approach in dealing with the overlapping between the concepts of creativity and education is followed by Donegan et al. (2008) who assess the role played by creative core, bohemians, and graduates by including them one at a time in a cross-section model of employment and income growth for U.S. metropolitan areas. None of the human capital variables shows a statistically significant impact on employment growth; on the contrary, both creatives and graduates have a positive influence on income dynamics, while the bohemians’ component remains irrelevant.
Another contribution on the U.S. metropolitan areas is given by Florida, Mellander, and Stolarick (2008) who show that, within a path model of regional development system for the year 2000, the creative class influences only the level of labor productivity (proxied by the average wage level), while the educational attainments positively affect the regional income level as well. The same methodological framework is used by Mellander and Florida (2011) to analyze per capita wage level for eighty-one labor market areas in Sweden. In this case, bohemians turn out to be significantly associated with labor productivity, while no relevant effect is found for both creative class and graduates. In both contributions great attention was devoted to accounting for differences among the various groups of creative occupations, but the crucial issue of assessing to what extent the effects of creativity are overstated by the concurrent influence of graduates remained unaddressed.
Continuing the review of the contributions referring to the European context, Marlet and van Woerkens (2007) analyze the case of fifty cities in the Netherlands within a cross-section model of employment growth and controlling for various characteristics of the local environment like diversity, congestion, and unemployment. They include the three human capital indicators in pairs and find that the creative class measures outperform the conventional education indicators; moreover, bohemians show a strong impact on regional performance which, however, cancels out if Amsterdam is excluded.
Contrasting results are found by Boschma and Fritsch (2009) within a spatial error model of employment growth applied to NUTS3 regions in the Netherlands and Germany. In order to avoid multicollinearity problems, they consider the various proxies of human capital one at a time; they show that the education indicator outperforms the creative class measures in the case of German regions, while for the Dutch regions all variables significantly affect employment dynamics. The economic dynamics of the German regions, measured in terms of employment or labor productivity growth, is also analyzed by Wedemeier (2010). He controls for diversity, population growth, and production specialization, while the educational component of human capital is not considered. It turns out that labor productivity growth is positively affected by the creative class, which however does not influence employment dynamics. Finally, Andersen et al. (2010), in a simple partial correlation framework applied to four Nordic countries (Denmark, Finland, Norway, and Sweden), show that the creative class is positively associated with employment growth only for the case of the large city regions, when all regions are considered the correlation is no longer significant; the opposite outcomes are found for the schooling measure.
Marrocu and Paci (2012) introduce the three nonoverlapping categories of human capital and analyze their impact on the TFP level in 2007 for the EU27 regions by employing a spatial error model. The results show that the regional efficiency levels are positively affected by creative graduate people and, with a lower elasticity, by graduate employed in noncreative jobs, while the bohemian group does not show any relevant effect.
In general, the evidence provided so far does not permit to draw a consistent and unambiguous conclusion on the economic role of creativity: it is not simple to directly compare the various contributions, given the differences in the measurement of regional performance, in the definition of creative class, in the inclusion of education measures, in the controls for local environment indicators and in the econometric methodology adopted. Overall, a critical drawback emerges from the review of the empirical literature. The unclear identification of the creative and education components generates a measurement problem, which in the econometric analyses has often led to either multicollinearity if the two measures are included together or an omitted variable bias if they are included one at a time. In both cases, this induces confusing evidence as the effects of creativity on local performance are inadequately estimated. Therefore, in order to attain a more accurate evaluation of their impacts on regional development, in this article we adopt the approach proposed in a previous contribution of ours (Marrocu and Paci 2012) to disentangle the education and the creativity components of human capital. Our procedure is presented in detail in the next section.
Data Description
In this section, we present the whole set of explanatory variables used in our empirical investigation as potential determinants of economic development at the regional level. We start with the description of the human capital indicators (see Table 2) and then we present the contextual variables that account for several characteristics of the regional environment. Throughout the econometric analysis we consider 257 regions of the twenty-seven EU member countries; for the vast majority of the countries we use the NUTS2 level, while for some small states (Cyprus, Denmark, Estonia, Lithuania, Luxembourg, Latvia, Malta, Slovenia) the national level is considered. 2 We limit our analysis of the growth process to the period 2002–07 due to the lack of longer time series at the regional level for the variables considered. It should be remarked that the economic performance during this period is not affected by the pervasive financial crisis that has been gripping the world economy since the year 2008. The data sources and definition for all the variables are reported in Table 3, while the summary statistics are presented in Table 4.
Creatives and Graduates.
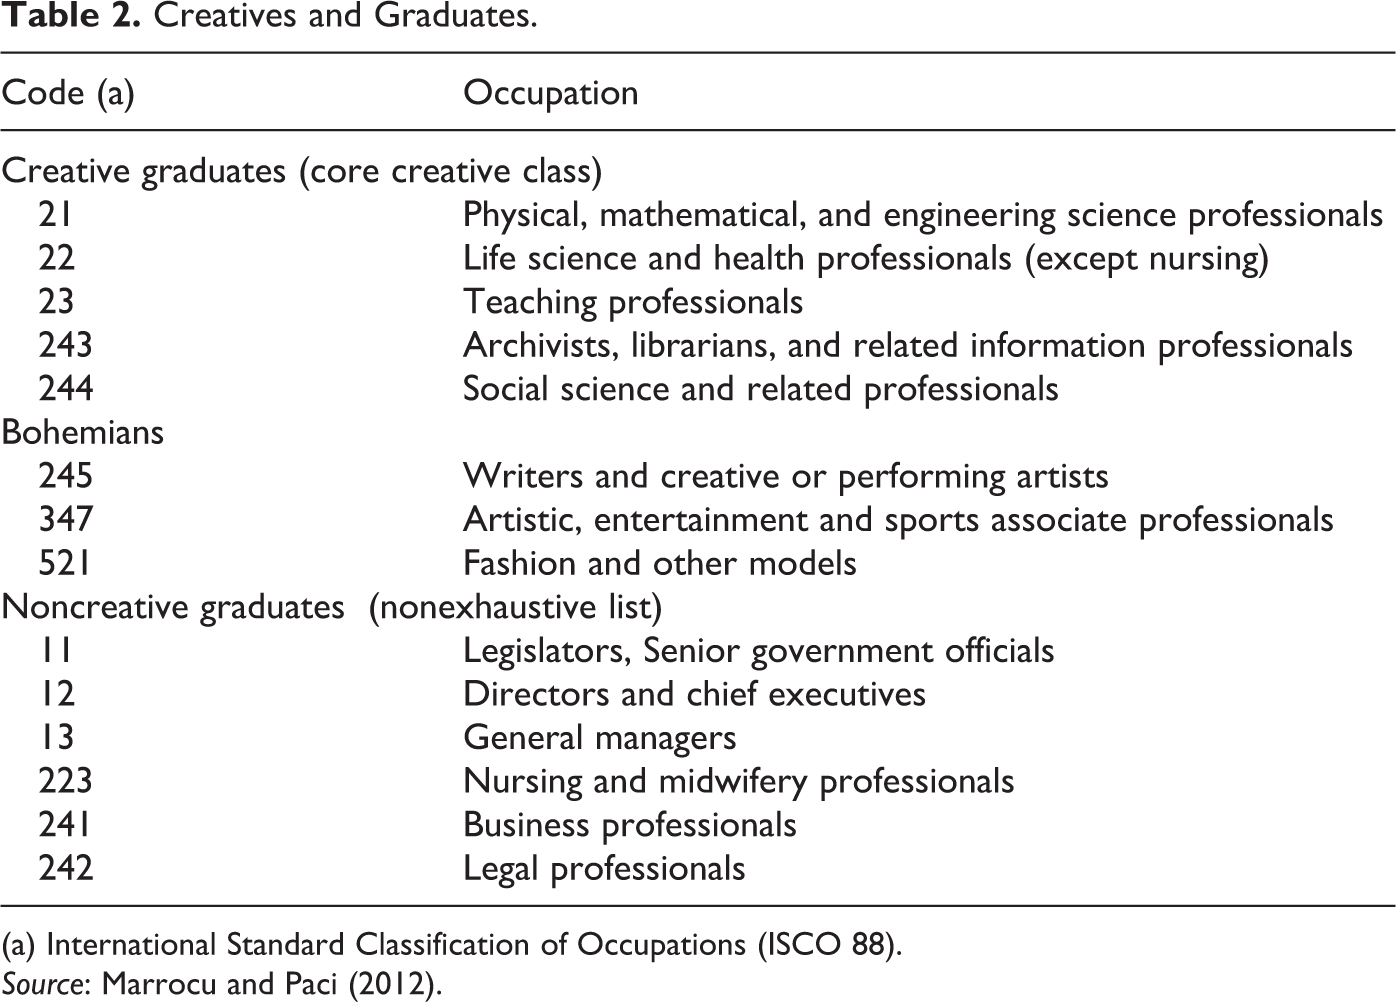
(a) International Standard Classification of Occupations (ISCO 88).
Source: Marrocu and Paci (2012).
Data Sources and Definition.
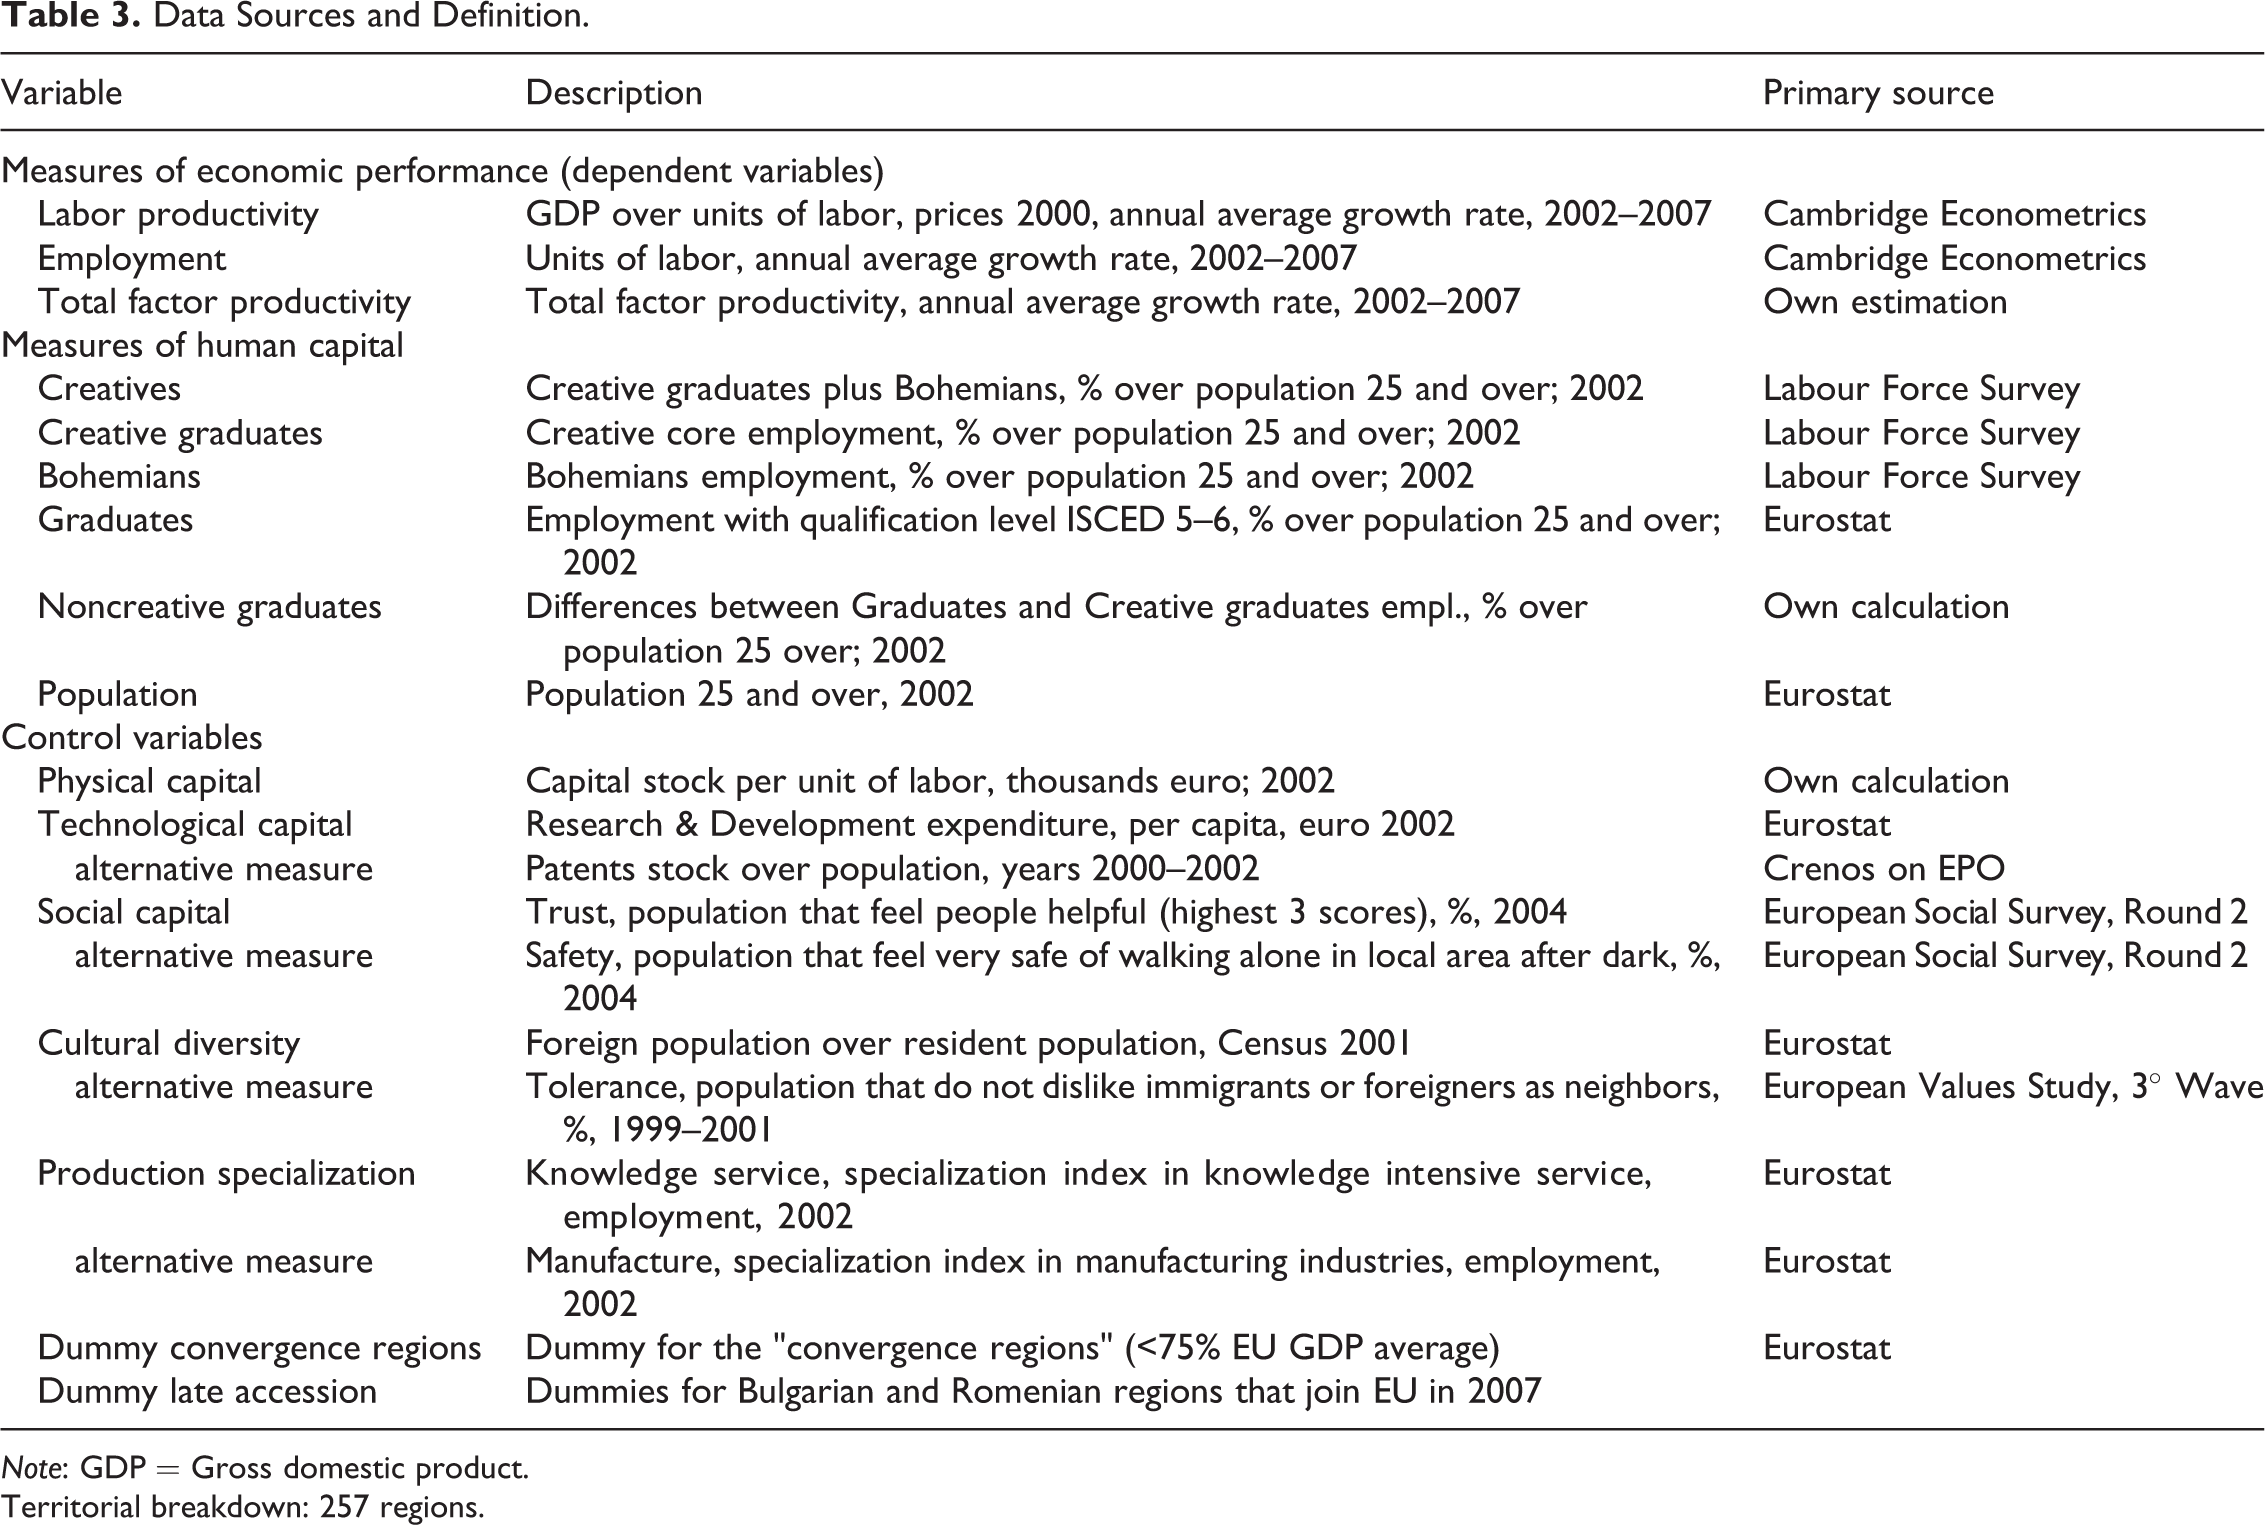
Note: GDP = Gross domestic product.
Territorial breakdown: 257 regions.
Descriptive Statistics.
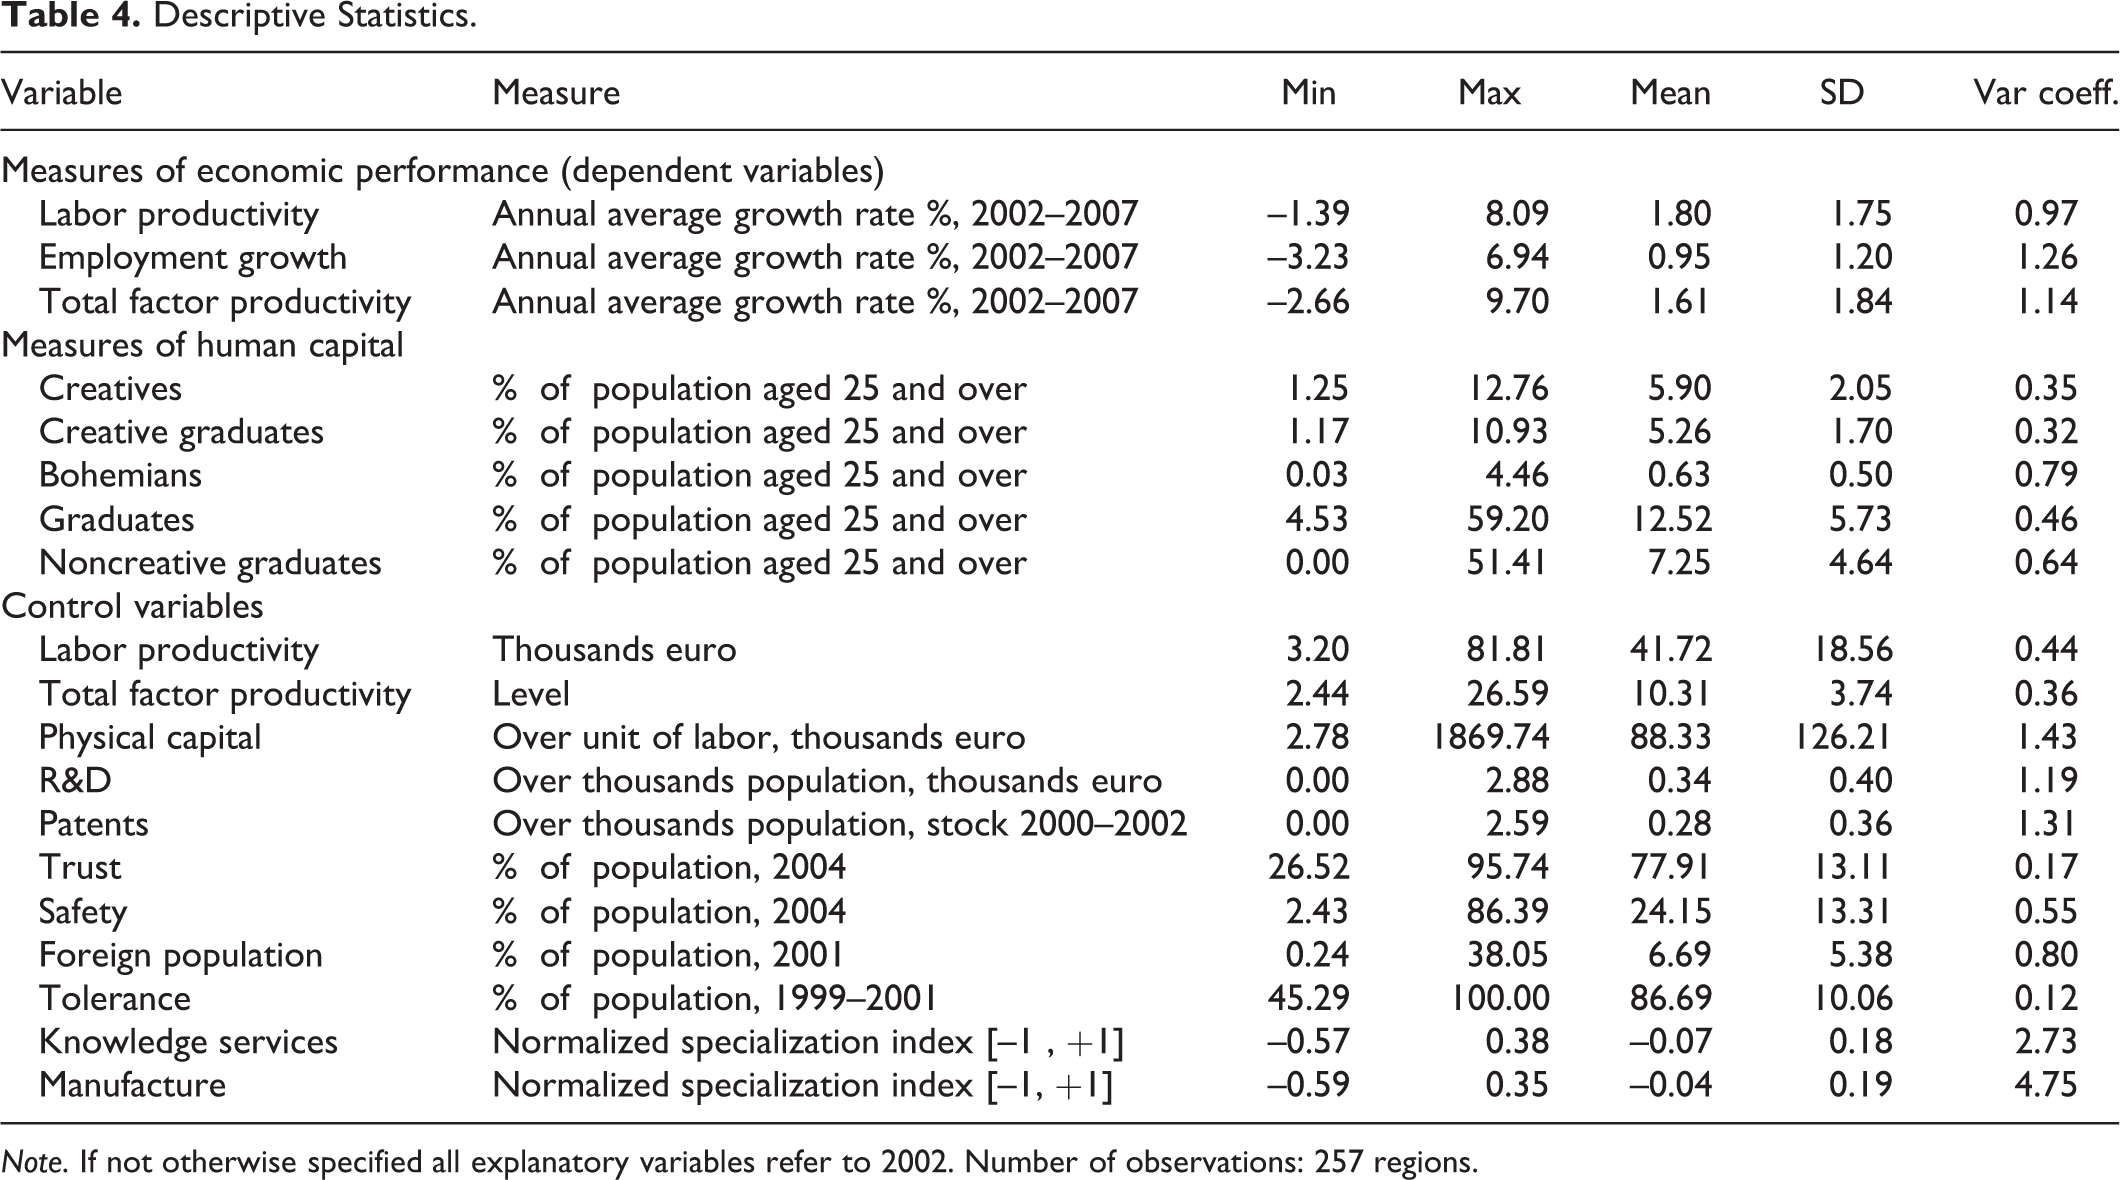
Note. If not otherwise specified all explanatory variables refer to 2002. Number of observations: 257 regions.
Creativity and Education Indicators
As we have seen in the previous section, one of the crucial issues in the debate on the influence of creativity on regional performance is the definition and measurement of creative population and its distinction with respect to the highly educated one. Indeed, there is a large overlapping between the two measures of human capital—education and creativity—which, if not properly dealt with, may cause estimators to be biased or to exhibit an incorrectly estimated variance. As already emphasized in the introductory section, the overlapping issue would be straightforwardly solved if detailed information on each individual education attainment and on his or her current occupation were available; unfortunately, such micro-level data are not collected at regional level for the countries considered. 3
Therefore, to tackle this problem, in a previous contribution (Marrocu and Paci 2012) we developed a classification of human capital measures which, combining the two different data sources on occupations and education attainments, defines the following three nonoverlapping categories.
Creative graduates, who include scientific, life sciences, health, teaching and social sciences professional occupations (this group corresponds to the one usually referred to as “super creative core” or “creative core” in the existing literature).
Bohemians, consisting of artistic, entertainment, and fashion professionals.
Noncreative graduates, obtained as the difference between the total number of employed people who has attained at least a university degree (ISCED 5-6) and the creative graduates; this category mainly includes legislators, government officials, managers, business and legal professionals, technicians and associate professionals.
4
The occupations included in the creative graduates group require, in general, the tertiary level of education and therefore these individuals are simultaneously graduates working in creative occupations.
5
The second category, bohemians, includes several creative occupations like writers, painters, musicians, actors, designers, athletes, and many others. We assume that in these occupations the creative component, related to individual talent, is essential and predominant with respect to the educational one and thus we maintain that all bohemians are creative and did not graduate.
6
The third category, noncreative graduates, includes all employed individuals who hold a university degree but are not already considered in the creative graduates group. The identification of these three nonoverlapping groups provides a working distinction between the formal education and the creativity components of human capital and it allows us to overcome the multicollinearity or the omitted variable problems, which have often affected previous empirical contributions.
It is worth highlighting that our human capital classification criteria address the measurement problems related to the unclear definition of what creativity should entail at the regional level, strongly conditioned by the lack of individual, micro-level data. As already emphasized, when a clear definition of creativity is missing this leads to the use of inadequate proxy variables, which in regression analysis induce the estimation problems mentioned above.
Our proposed procedure thus aims to remove the overlapping among the human capital components arising from the use of hasty and vague definitions of creativity. As a result, our reclassification procedure does not affect the genuine correlation among the geographical distribution of the three human capital components as it is due to their underlying fundamental determinants. As a matter of fact, the correlation coefficient between the regional distribution of creative graduates and noncreative ones is 0.54, the one between creative graduates and bohemians is 0.64 and, finally, the one between noncreative graduates and bohemians is just 0.40. The value of the first coefficient is reasonably due to the fact the two groups share the education determinant, while the value of the second one may be attributed to the talent fundamental. The noncreative people and the bohemians are the groups with less in common, in terms of both education and creativity, and this results in the lowest correlation coefficient. 7
We now present a brief description of the main features of the human capital variables. Starting from the occupation measures provided by the labor force survey, in Table 4 we report that the creative people in the European territory represent 5.9% of population aged twenty-five and over. 8 The great majority of them is employed in occupations requiring a degree and therefore it constitutes the creative graduate group (5.3%), while only 0.6% of population belongs to the bohemians’ group. On the other hand, the share of employed population holding a degree counts for 12.5%; among them 5.3% of population are employed, as we have seen, in the creative occupations and thus the remaining 7.2% are the noncreative graduates.
Looking at the territorial distribution of human capital variables reported in Figure 1, the creative graduates show a well-defined spatial divide with the highest values displayed in Northern Europe while the Southern and Eastern countries show a lower number of creative graduates. More specifically, the creative graduate group is larger, as expected, in the capital cities (Stockholm, Helsinki, Paris, Bucharest, Prague, Amsterdam) and in other regions, close to the capital city, which host well-known universities (Utrecht, Oxford, Louvain-la-Neuve). The bohemian group, when compared to the other human capital indicators, presents a more concentrated spatial distribution, as it is confirmed by the higher value of the variation coefficient (0.79). The region with the highest proportion of bohemian population is Inner London (4.4%), followed by other cities like Amsterdam, Stockholm, Outer London, Hamburg, Prague and Berlin. The third component, the active individuals with a degree not employed in creative jobs, shows a spatial distribution characterized by a strong national pattern. High values can be found for all regions in Spain, France, United Kingdom, Germany, and the Netherlands and also in the Scandinavian and Baltic countries. On the other hand, low values appear almost uniformly distributed for the other Southern and Eastern countries.

Creativity and education indicators. A, Creative graduates (percentage of population aged 25 and over). B, Bohemians (percentage of population aged 25 and over). C, Noncreative graduates (percentage of population aged 25 and over).
Contextual Variables for Regional Characteristics
The EU is characterized by a high degree of regional heterogeneity and therefore in evaluating the role of creativity and education on regional development it is important to control for other institutional and economic factors (Asheim and Hansen 2009; Rodriguez-Pose and Crescenzi 2008). In particular, in our empirical model we consider a wide set of control variables, which includes the endowments of tangible and intangible assets—like physical capital, technological capital, social capital and cultural diversity—and production specialization indicators.
It is well known that the performance of the local economy can be influenced by the stock of physical capital, which is computed by applying the perpetual inventory method on investment series over the period 1980–2001, and it is then divided by units of labor. From Table 4, it is possible to notice the strong differences among regions in the level of the capital labor ratio for 2002, it ranges from 2.8 to 1,860, indeed the coefficient of variation turns out to be very high (CV = 1.4).
Technology is, at least partially, a public good so that firms and regions benefit from the availability of technological capital, as originally suggested by Griliches (1979) in the so-called knowledge-capital model. In this article, as an indicator for technological capital, we use R&D expenditure per thousands inhabitants. Also for this variable there is a high degree of disparity in the regional endowment of technological capital (CV = 1.2). In general, the cluster of high-innovative regions embraces the Scandinavian countries, most German regions plus some regions in the United Kingdom, France, and Northern Italy; while all Southern and Eastern European regions are characterized by very low levels of technological capital. In the econometric analysis, as a robustness check, we also employ the stock of patents per thousands inhabitants in the years 2000–2002.
Regional productivity growth is also influenced by social capital, which represents a very relevant intangible asset, but often neglected in economic analyses (Temple and Johnson 1998). Social capital is a complex feature of social organization—represented by strong ties, shared norms and trust—which improves the efficiency and the economic performance of the local society by decreasing the transaction costs and by facilitating the coordination among actors (Knack and Keefer 1997). It is not an easy task to measure a phenomenon as complex, and often informal, as social capital (Glaeser, Laibson, and Sacerdote 2002), especially when we need to appraise it at the regional level for the whole of Europe. 9 Following La Porta et al. (1997), in this article as a proxy for regional social capital we use the level of “trust” measured by the share of population who state their belief in people’s helpfulness, as reported by the European Social Survey. 10 The share of population declaring high levels of trust is unevenly distributed in the EU, ranging from a minimum value of 26% in Calabria (Italy) to a maximum value of 96% in Itä-Suomi (Finland). In general, there is a clear geographical pattern, with the Northern and Western countries showing higher levels of trust with respect to the Southern and Eastern countries. As a robustness check, we also proxied social capital with an alternative indicator, the level of safety feeling; it is computed as the share of population who reports feeling very safe when walking alone in their own local area after dark.
According to Florida (2002), diversity and heterogeneity are the key ingredients of economic dynamics and the traditional social capital might have adverse effects on growth as it induces conformism and attitudes less inclined to innovativeness. Diversity among individuals is expected to favor approaches which are more open-minded, meritocratic, and tolerant. Dissimilarity is what makes a socioeconomic environment more stimulating as it fuels self-expression, creativity, innovation, and eventually economic growth. Although the role of diversity is not at all new to economic analysis, since it dates back at least to Jacobs (1961), who discussed the importance of both firms’ and individuals’ diversity, there is still limited empirical evidence on its growth-enhancing effects, in particular for the case of European regions. Thus, as an additional control variable we include the degree of cultural diversity of each region proxied by the share of foreign population from the 2001 Census data. A similar measure has been already used by Ottaviano and Peri (2006) for the U.S. cities and by Bellini et al. (2013) for the European regions. The idea is that foreign people, who are usually younger and more dynamic, bring diversified backgrounds in the new country of residence and this facilitates the diffusion of new ideas and increases in productivity for the whole economy. The average share of foreign born population in Europe is 6.7% and this value exhibits a high variability going from the minimum level of 0.24% in the Romanian region of Sud-Vest Oltenia to the highest value of 38% in Brussels. High values are displayed by capital cities like London, Luxembourg, Wien, Paris, and Stockholm, while in most of the Eastern countries’ regions the share of foreign born population is very low. To appraise openness to cultural diversity we have also used an indicator of tolerance measured by the share of population who, in the European Values Study (EVS), 11 has not stated to “dislike immigrants or foreign workers” as their own neighbors.
In our empirical models we consider both social sources of economic growth, the one stemming for similarity—trust—and the one coming from dissimilarity—foreign population—as complementary, rather than opposite, drivers of economic growth.
Finally, we have controlled for the regional production structure with the inclusion of two alternative indicators of the relative specialization in the knowledge-intensive services (KIS) and in the manufacturing sectors, which is expected to considerably shape regional productivity dynamics (Marrocu, Paci, and Usai 2013). More specifically, since the KIS sectors are more efficient and dynamic, we expect that regions specialized in these sectors exhibit a higher productivity growth; while the opposite relationship should result for the manufacturing specialization. It should be remarked that currently in Europe the knowledge-intensive regions are largely located in the advanced Western countries, whereas Eastern regions are mainly specialized in manufacturing. For instance, the top ten regions for knowledge-intensive sectors are in the United Kingdom, Luxembourg, the Netherlands, and France; while the top five manufacturing regions are in the Czech Republic, Hungary, and Romania and among the top ten there is only one German and one Italian region.
Model Specification and Methodological Issues
Specification of Empirical Models
The role played by human capital—considering both its education and creativity components—in determining growth performance of the European regions is first analyzed by means of a basic empirical model, specified as follows:
where i = 1,2,…, N = 257 regions. Note that the right-hand side variables are included at their initial year value to deal with endogeneity issues, as explained in greater detail below. The dependent variable is the annual average growth rate of labor productivity computed over the period 2002–07 for each region included in the sample. In order to consider both the education and creativity components of human capital, the corresponding variables’ vector in equation (1) includes the three nonoverlapping categories of creative graduates, noncreative graduates, and bohemians, which are log-transformed and expressed in per capita terms with respect to the resident population aged twenty-five and over. The level of labor productivity with reference to the initial year 2002 is included in order to account for possible convergence dynamics, as predicted by the conditional convergence or catching up models. In equation (1), the term α represents the intercept; β is a vector of coefficients measuring the effect of human capital components on the response variable; δ is the parameter related to the existence of convergence dynamics, it is expected to exhibit a significant negative sign, thus ruling out divergent or explosive kind of growth processes; ∊ is an i.i.d. error process.
The choice of labor productivity as dependent variable in model (1) is motivated by the extensive empirical literature on economic growth analysis. In the context of cross-country regressions, the output-per worker growth models were operationalized by Mankiw, Romer, and Weil (1992) by assuming that aggregate output is determined by a three-factor (labor, physical capital and human capital) Cobb–Douglas production function. Since their influential work, a virtually endless number of papers have been published, whose strengths and limitations are exhaustively appraised in the recent survey by Durlauf, Johnson, and Temple (2009).
Moreover, although in reviewing the literature on the effects of creativity we have reported that the most commonly analyzed measure of regional development is employment growth, we argue that such an indicator is not adequate since it cannot account for the process of production restructuring which has been going on in Europe over the last decade. As a result of the integration and enlargement processes, production restructuring has often entailed a reduction in the labor input in order to achieve a good performance of the local economy. Therefore, labor productivity represents a more comprehensive indicator, which at the same time permits to account for both production enhancements and increased efficiency. In order to carry out comparisons with previous contributions, in the subsequent analysis we also estimate the basic model for employment growth; as a robustness check, we consider an alternative indicator of regional economic development, represented by the growth rate of TFP.
As far as the human capital variables are concerned, in section 5 we address the effects of possible misclassifications in deriving the three human capital indicators and then we consider some finer decompositions of both the creative graduates and noncreative graduates groups. For the first group, the decomposition is based on the jobs’ creativity content, in order to get some insights on the potential growth-enhancing features of several specific occupations, such as those related to science professionals, which are generally believed to foster positive economic outcomes. For the noncreative graduate group, we test whether leading professions, such as those of directors and general managers, exhibit a significantly larger impact with respect to the other noncreative occupations.
In section 6, we extend the basic model to check whether the effects associated with human capital are robust to the inclusion of an array of control variables, the main extended specification is reported in equation (2):
Model (2) differs from the basic model because it includes a set of control variables, whose estimated coefficients are gathered in the γ vector. All the other terms are the same as reported above in describing model (1).
As explained in section 3.2, the control variables are expected to capture relevant features of the regional productive context. More specifically, besides the initial period level of the physical capital, they comprise proxies for the local endowments of technological capital and social capital in relation with the degree of diversity, openness, and tolerance of the social environment. Additional variables are also included to control for different specialization patterns across the European regions and to account for some geographical characteristics. In our empirical models, the geographical determinants of the growth process are captured by including a dummy variable for the convergence regions, defined as those regions whose per capita gross domestic product (GDP) is below the 75% EU average threshold, and two dummy variables for Bulgarian and Romanian regions since their countries formally joined the EU at the end of the period considered in our growth analysis. 12
Moreover, we investigate the existence of regional correlation, likely due to geographical features, by following the testing procedure specifically designed to detect spatial dependence.
Methodological Issues
The proposed empirical specifications could be affected by endogeneity problems, due to reversal causality, omitted regressors, especially related to unobservable factors as it is the case for productivity shocks, which make the error term correlated with the included explanatory variables. In moving from specification (1) to specification (2), the inclusion of a wide set of controls should alleviate the problem related to the omission of relevant variables. However, endogeneity might still be an issue even in model (2).
Differently from the case when micro-level data (firms) is used, in analyzing regional aggregate data we cannot resort to the control function approach (à la Olley and Pakes 1996) to clear the correlation between the error term and one or more regressors, induced by unobservables. For this reason, we follow a well-established approach proposed in the empirical literature (see Glaeser et al. 1992 and Henderson, Kunkoro, and Turner 1995) to estimate and identify the causal relationship between an economic growth indicator and its determinants, it entails including the explanatory variables at their initial period value, 2002 in our case. This is expected to rule out endogeneity problems, so that we can consider the estimated relationship as a long-run one and cautiously interpret the estimated coefficients as the causal effects of human capital indicators on economic performance dynamics.
Moreover, in order to control for possible endogeneity arising from a sorting process, which would lead to a positive selection of high-skilled people into highly productive regions, we also carried out a further test. We split our data into two subsamples, formed by regions with labor productivity levels above/below the median value in 2002, 13 and then we test for significant differences in the elasticities of the human capital variables between the two groups. No evidence was found of any relevant difference, and sorting issues can thus be reasonably excluded.
Another relevant econometric issue is related to the existence of spatial dependence among the regions included in our sample. Such kind of dependence is likely to be due to the effect of spatial spillovers or to unobservable variables featuring spatial patterns. We tackle this issue by estimating model (1) by ordinary least squares (OLS) and then by performing two Lagrange Multiplier (LM) tests, one consistent with the existence of a spatially lagged dependent variable term under the alternative hypothesis and the other entailing the error term exhibiting a spatial autoregressive pattern. 14 Both tests are carried out by making use of a spatial weight matrix represented by the inverse of the distance between all possible pairs of regions. Following the suggestion advanced in a recent article by Kelejian and Prucha (2010), the matrix is maximum-eigenvalue normalized; with respect to the commonly used row-standardization, this kind of normalization has the advantage of not imposing overly strong restrictions on the weight structure and of preserving the importance of absolute—rather than relative—distance.
The basic model, estimated by OLS, and the result of the LM tests are reported in the first column of Table 5; both tests are highly significant but the higher value of the first one suggests the spatial error specification as the most adequate for the labor productivity growth model. As a further check, we also estimate a spatial lag specification, but this yields unsatisfactory results as the indirect effects, due to the influence of neighboring regions, turned out to be not significant; this finding does not seem to support the existence of global spillovers for labor productivity growth.
Before relying entirely on the spatial error specification we tested for the existence of specific spillovers, directly related to the human capital indicators. We thus also consider augmenting model (1) with their spatial lags, but all the three of them turn out to be insignificant at conventional levels. It is possible that spillovers can be detectable only at a finer geographical scale or that it is necessary to adopt a more sophisticated and informative spatial matrix to describe the interconnectivity structure among local economies. This issue is very relevant and deserves further consideration, which, however, goes beyond the scope of the present analysis and thus is left for future research.
Labor Productivity Growth and Creativity.
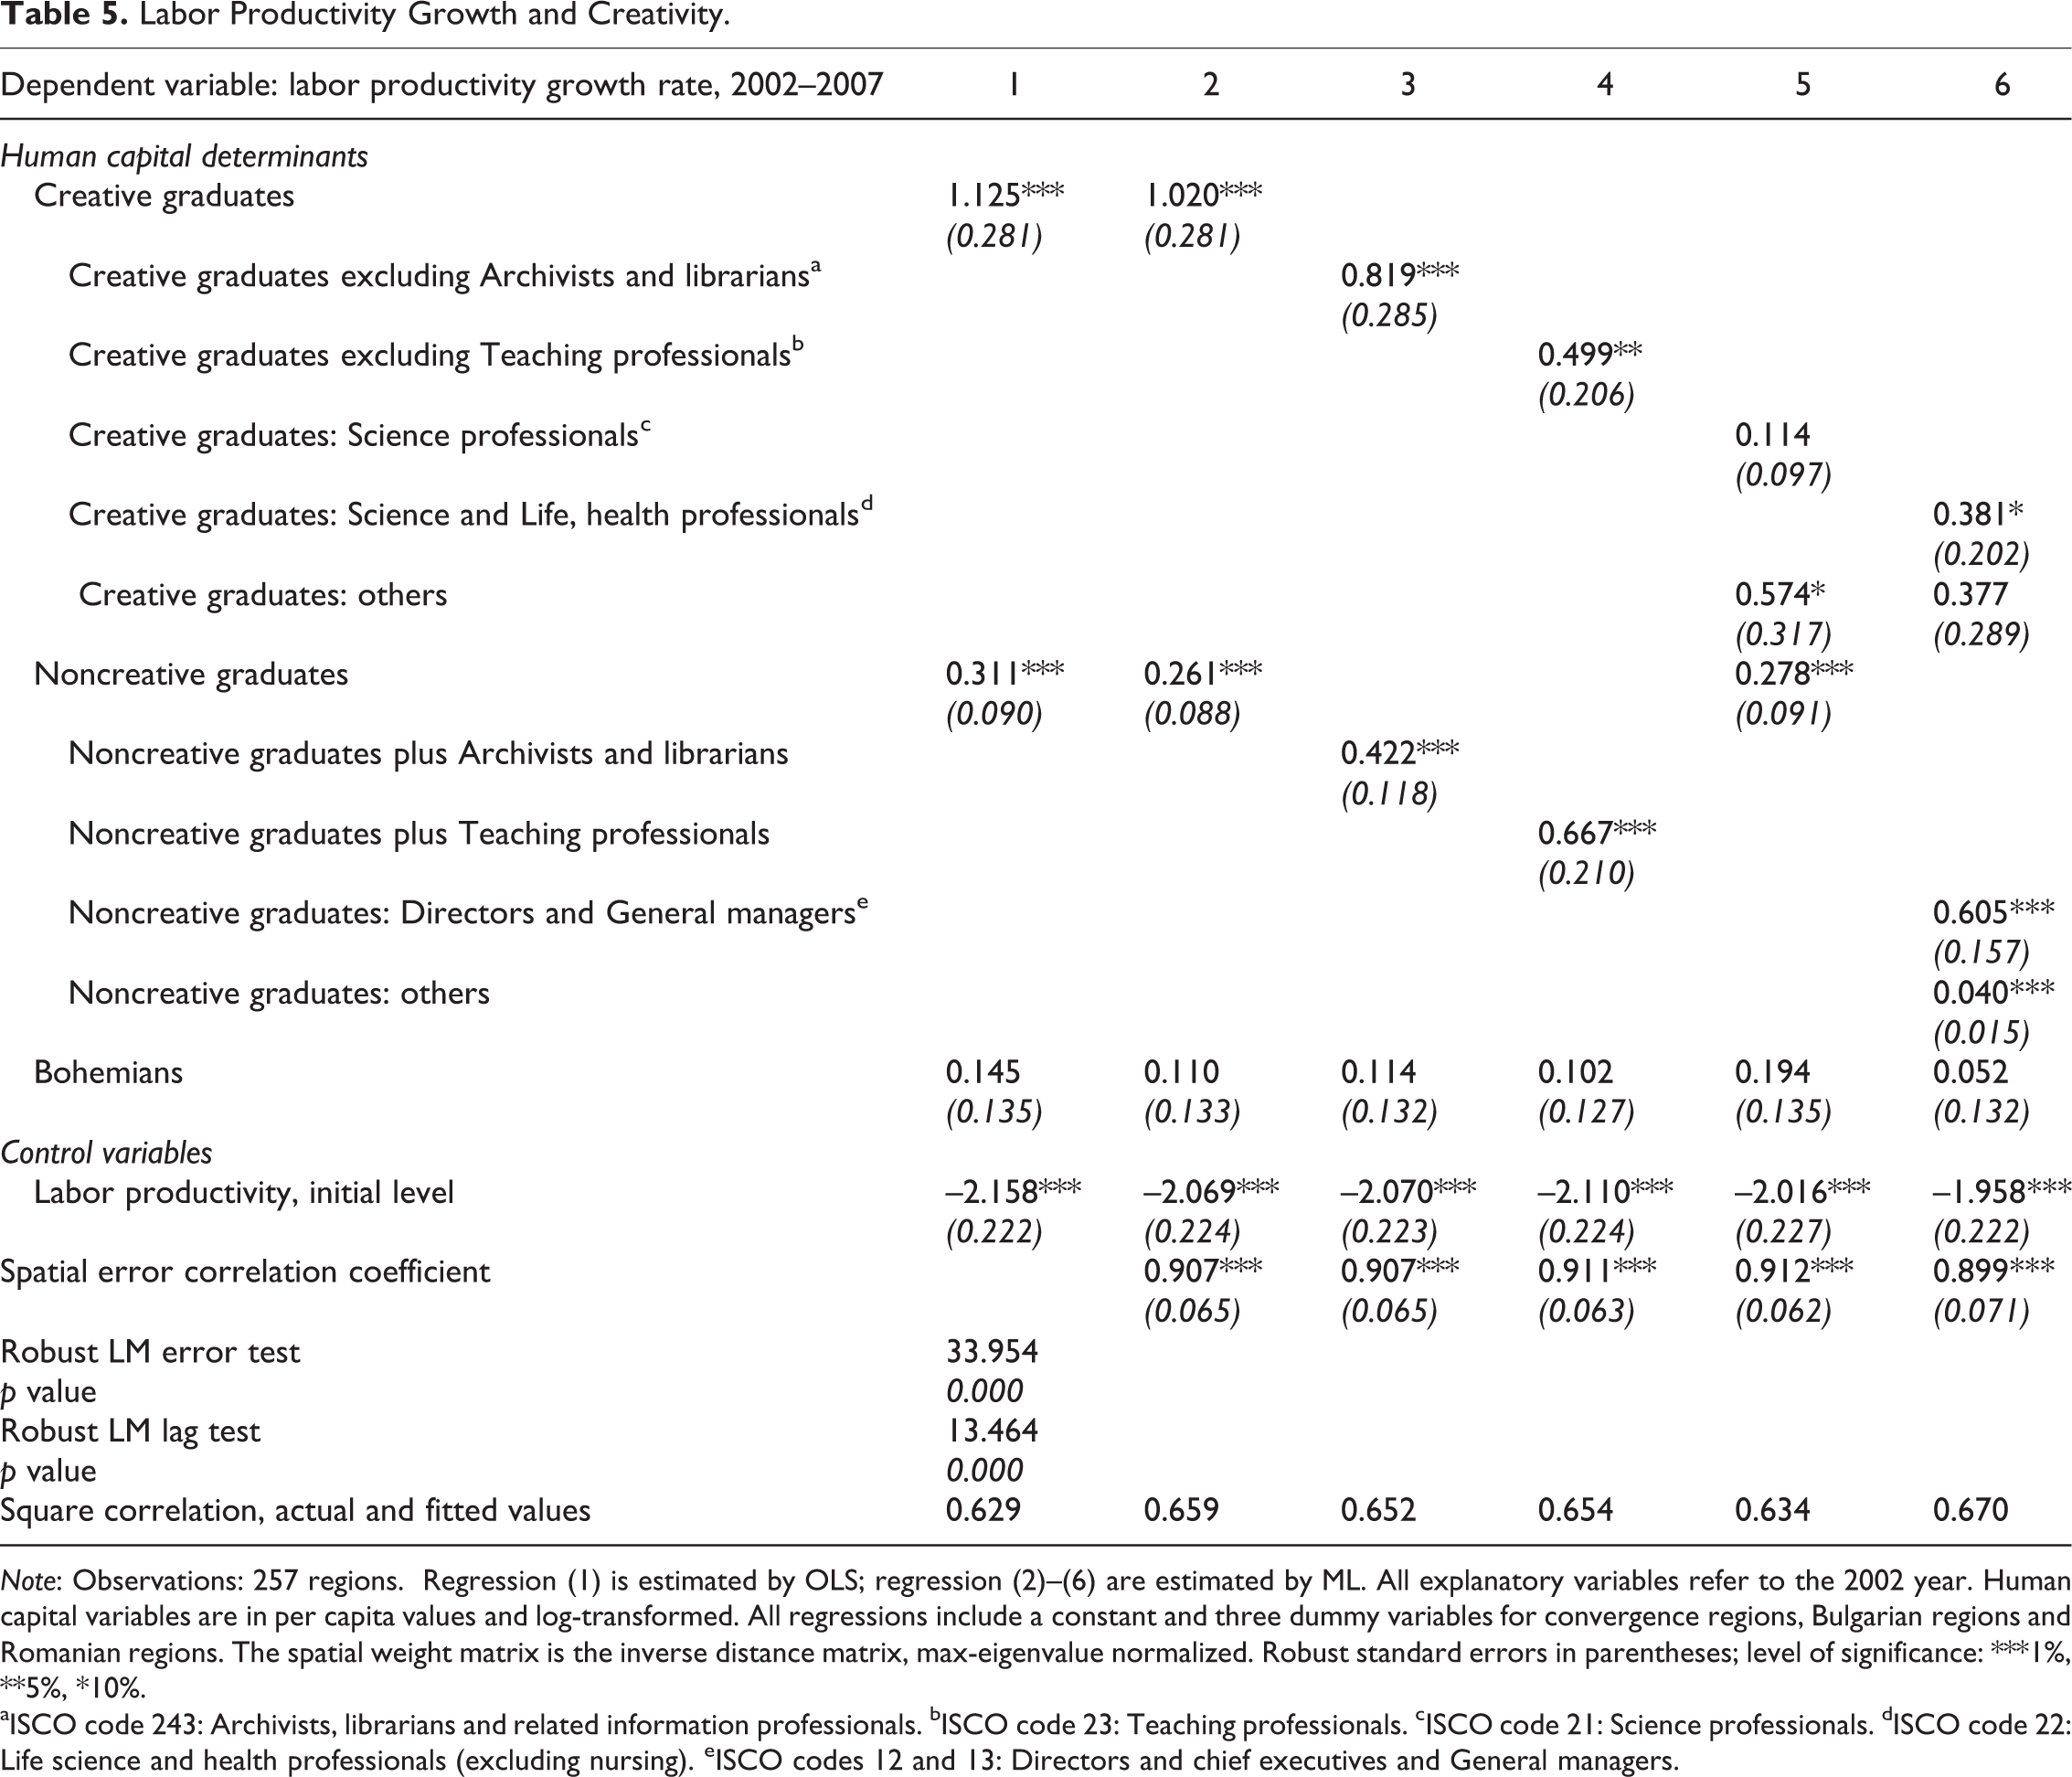
Note: Observations: 257 regions. Regression (1) is estimated by OLS; regression (2)–(6) are estimated by ML. All explanatory variables refer to the 2002 year. Human capital variables are in per capita values and log-transformed. All regressions include a constant and three dummy variables for convergence regions, Bulgarian regions and Romanian regions. The spatial weight matrix is the inverse distance matrix, max-eigenvalue normalized. Robust standard errors in parentheses; level of significance: ***1%, **5%, *10%.
aISCO code 243: Archivists, librarians and related information professionals. bISCO code 23: Teaching professionals. cISCO code 21: Science professionals. dISCO code 22: Life science and health professionals (excluding nursing). eISCO codes 12 and 13: Directors and chief executives and General managers.
In the next section, we discuss in detail the results obtained for the basic model, estimated by adopting the spatial error specification. Note that in this case for the estimated coefficients the usual interpretation of partial derivatives holds and that unbiasedness of standard errors is ensured by allowing for a spatial autoregressive process in the error term.
Econometric Results
Results for the Basic Model
The results for the basic specification spatial error models, which include the human capital variables and the geographical controls, are reported in column 2 of Table 5. Once we control for the level of labor productivity in the initial year, which exhibits the expected negative sign as predicted by the convergence and catching up models, the results point out the relevant role played by the education component of human capital in driving productivity growth. Both creative and noncreative graduates categories turn out to be highly significant with the first one outperforming the second with an effect four times as large. 15 As a considerable proportion of noncreative graduates are expected to be concentrated in capital cities, where they are likely to perform duties related to the government or public administration sector, it is possible that their effect on growth is somehow mixed up with a pure capital city effect. To disentangle the two effects in regression (2) we also included a dummy variable for regions hosting national capitals and an interaction term of the same dummy with respect to the noncreative graduates variable; as both additional regressors turned out to be not significant, we can reasonably conclude that the effect associated with the noncreative graduate people is a genuine one, possibly independent from their specific locations. 16
Focusing on the Bohemian group, the talent component of human capital does not seem to contribute in any way when it is considered per se and not complemented by formal education. 17 This result is in line with previous findings, as discussed in Glaeser (2005) for the U.S. metropolitan areas (growth models) and in Marrocu and Paci (2012) for the European regions (productivity level models). 18 More generally, our findings confirm the positive economic role of education capital, which has been found by a vast literature in different settings; just to mention, among many others, some recent contributions: Moretti (2004) at the firms level, Dettori, Marrocu, and Paci (2011) for the European regions, Yamarik (2011) for the states of the United States, and Cohen and Soto (2007) for the Organization for Economic Cooperation and Development (OECD) countries.
Note that qualitatively similar results were also found when the first-order contiguity matrix was used in place of the inverse distance one. Although the estimated coefficients for both groups of graduates were smaller than the ones reported in column 2 of Table 5, they confirm the creative component of education as more productivity enhancing with respect to the noncreative one; the impact of the bohemians remained not significant. As we maintain that the inverse distance matrix portraits a more reliable picture of the geographic connectivity among the regions, in the subsequent estimations we rely entirely on it and discard the contiguity matrix.
Robustness Analysis on Alternative Disaggregation of Human Capital Variables
One of the advantages of the proposed disaggregation of human capital variables into the three groups described in the third section is that it makes it straightforward to address possible misclassifications. For instance, it could be claimed that in applying our classification approach it is not correct to include archivists, librarians (ISCO code 243), or teaching (ISCO code 23) professionals among the creative graduate people, given that they are not expected to perform creative tasks. 19 We address this possible kind of misclassification by testing the robustness of our results when, alternatively, the archivists and librarian professionals or the teaching professionals are dropped from the creative graduate group and included in the noncreative one. Due to lack of data on the degree hold and on the occupation at individual level, rather than making untestable hypothesis on the proportion of people in archivists–librarians/teaching professions performing creative tasks, in our robustness test we consider the extreme case that none of them perform creative tasks. Although we acknowledge that this is a very unrealistic assumption, we think it can provide useful indications on the lower/upper bound effects that one can expect for creative/noncreative graduates.
In columns (3), we address the case of archivists and librarians when they are assumed to perform noncreative duties, the impact of creative graduates decreases to 0.82 and the noncreative graduate group one rises to 0.42, while the impact of bohemians is not at all affected. In column (4), when we assume that all teaching professional are occupied in noncreative jobs, the effect of the creative graduate group decreases to 0.50 and the effect of the noncreative one rises to 0.67. Notice that only in this extreme and rather unrealistic case the noncreative component of human capital could outperform the creative one.
We have also performed a similar robustness exercise assuming that for archivists–librarians and teaching professions the attainment of a university degree is not a formal requirement and thus they are not considered as graduate people. 20 In both cases the results, although lower in magnitude, are qualitatively very similar to the ones reported in regression (2) with the creative graduates exhibiting the highest impact.
Overall, these findings seem to provide interesting and novel evidence on the effectiveness of high human capital endowments on regional performance. Even when we allow for possible misclassifications, the effect of the creativity component of education is not lower than 0.50, while the noncreative component has an effect estimated in 0.67 at the maximum.
Another interesting evaluation is to single out the role played by specific groups of occupations in driving economic growth; in regression (5) of Table 5 we report the results of the empirical analysis based on a finer decomposition of the graduates’ categories. For the creative graduates, the occupations related to the science professionals (physical, mathematical, and engineering, ISCO code 21) are considered as a separate subgroup. 21 Although these professions have a high level of education and creativity content and therefore could be expected to be the most growth enhancing, their effect is much lower (0.11) than the one found for the other estimated specifications; the other creative graduates’ occupations with an estimated elasticity of 0.57 continue outperforming the noncreative graduate contribution (0.28) to productivity growth.
In the last specification of Table 5, regression (6), we disaggregate both the creative and the noncreative graduate categories. More specifically, from the creative graduates we single out a subgroup formed by science professionals (ISCO code 21) and life science and health professionals (ISCO code 22); in gathering together these two groups of professionals we expect to find more reliable results on the occupations with the highest creativity intensity. From the noncreative graduates, we select the subgroup of directors and general managers (ISCO codes 12 and 13) in order to test whether their task are more growth enhancing with respect to the ones performed by the other noncreative graduate individuals.
The results show that the effects of the most creative graduate group is now higher (0.38) and statistically significant, but this yields a noticeable reduction in the estimated elasticity (0.37) and significance level of the other creative graduate group. This result could be due to the reduced variability of the new subgroups variables, which exhibit a much higher within-group homogeneity with respect to the noncreative graduate subgroups. Moreover, a companion explanation may be related to the possible presence of strong complementarities among the occupations included in the creative graduates groups, which are lost as a result of the decomposition. More encouraging evidence is found for the subcategories of the noncreative graduates; the contribution to labor productivity of the top managerial occupations turns out to be significantly sizeable (0.60), while the one associated with the remaining occupations is very low (0.04), although still statistically significant. It may be the case that the organizational skills and abilities of the managerial occupations are quite effective when it comes to labor productivity as their specific aim is to ensure increasing levels of profitability for the firms by improving their degree of efficiency.
Robustness Analysis on Alternative Specification of the Dependent Variable
In Table 6, we contrast the results previously discussed for labor productivity growth with those obtained when alternative indicators of regional economic dynamics are considered. More specifically, we use the annual growth rate of employment, measured in terms of units of labor, since it is the most common measure employed in the previous literature. Moreover, we test the robustness of our results using as dependent variable a more complex measure of regional economic efficiency represented by the TFP growth rate. The regional levels of TFP are computed by adopting a growth-accounting approach after having estimated inputs’ elasticities from a Cobb–Douglas production function model using a panel data sample for the 257 European regions over the period 1990–2007. 22 We then use the TFP levels to calculate the average annual growth rate over the period 2002–07.
Alternative Growth Performance Indicators.
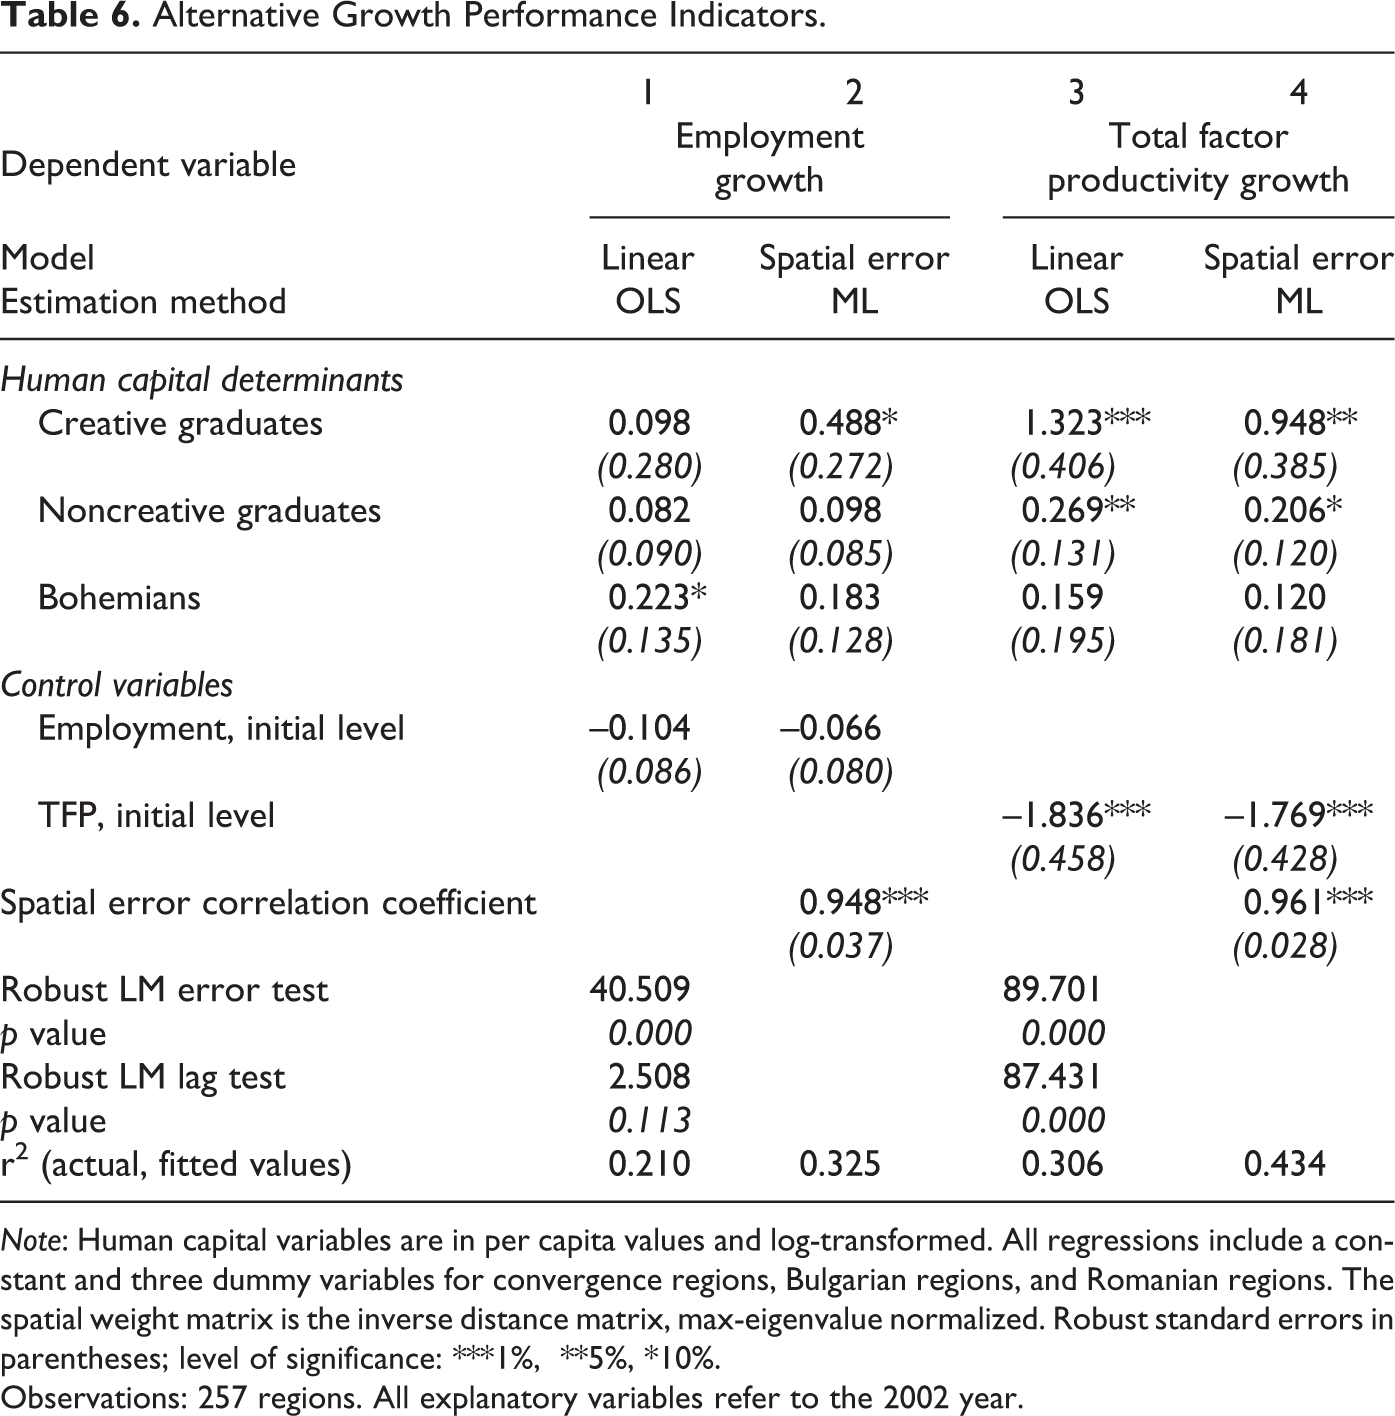
Note: Human capital variables are in per capita values and log-transformed. All regressions include a constant and three dummy variables for convergence regions, Bulgarian regions, and Romanian regions. The spatial weight matrix is the inverse distance matrix, max-eigenvalue normalized. Robust standard errors in parentheses; level of significance: ***1%, **5%, *10%.
Observations: 257 regions. All explanatory variables refer to the 2002 year.
Columns (1) and (3) of Table 6 report the OLS regression for the basic specification, which includes the three categories of human capital and the initial year level of the dependent variable. As was the case for labor productivity growth, the LM tests detect the significant presence of spatial dependence in the form of spatially autocorrelated error processes for both the alternative economic performance indicators considered. Therefore, in columns (2) and (4), we report the results of the estimation based on the spatial error specification.
Focusing on labor growth, only the group of creative graduates turns out to contribute significantly to employment expansion, with an estimated effect which is less than half of that obtained for the same regressor in the case of labor productivity growth. On the contrary, the estimates for the TFP growth are very much in line with those reported for the basic model (2) of Table 5. It is worth remarking that the TFP indicator already accounts for the contribution of labor and physical capital so that, differently from labor growth, it is much more robust to the structural change that has been occurring in Europe in the last decade as a result of the enlargement and integration processes on one hand and of the world globalization trends on the other hand.
For employment growth, comparisons with previous empirical literature need to be done very cautiously as most studies are affected by the measurement problem of the education and creativity components of human capital. Referring to the European context, graduates are found to enhance employment growth in the German and Dutch regions (Boschma and Fritsch 2009) and in the Nordic countries regions (Andersen et al. 2010); evidence in favor of creativity as a driver of labor growth is provided by Marlet and Van Woerkens (2007) and Boschma and Fritsch (2009) for the Netherlands. In some studies (Marlet and Van Woerkens 2007; Mellander and Florida 2011), a relevant role is also found for the Bohemians; their presence can act as an attractor for highly educated people who tend to prefer working in more open, diverse, and tolerant environments. However, this cannot be considered as a proper causal effect as further analysis would be necessary to rule out reverse causality problems among the different human capital groups.
On the basis of the results presented in Tables 5 and 6, we maintain labor productivity growth as one of the most adequate indicator to assess the economic performance of the European regions over time; the extension of the basic model is therefore based on such an indicator.
Extending the Basic Model
In Table 7, we report the results of the empirical analysis carried out on the extended version of the model, which allows us to test the robustness of the creativity and education effects previously discussed when a wide set of covariates is also included. The alternative specifications considered comprise, in addition to the three categories of human capital and the initial year level of labor productivity, the level of physical capital, technological capital, social capital, diversity, and production specialization which were described in the third section. As already mentioned in the methodological section, all variables refer to the year 2002 in order to avoid possible endogeneity and to allow for a time span long enough for their potential effects on labor productivity to unfold. All the models presented are estimated allowing for a spatial autocorrelated error term; the spatial autoregressive coefficient is always highly significant with an average estimate of 0.90.
Labor Productivity Growth Models—Robustness Analysis.
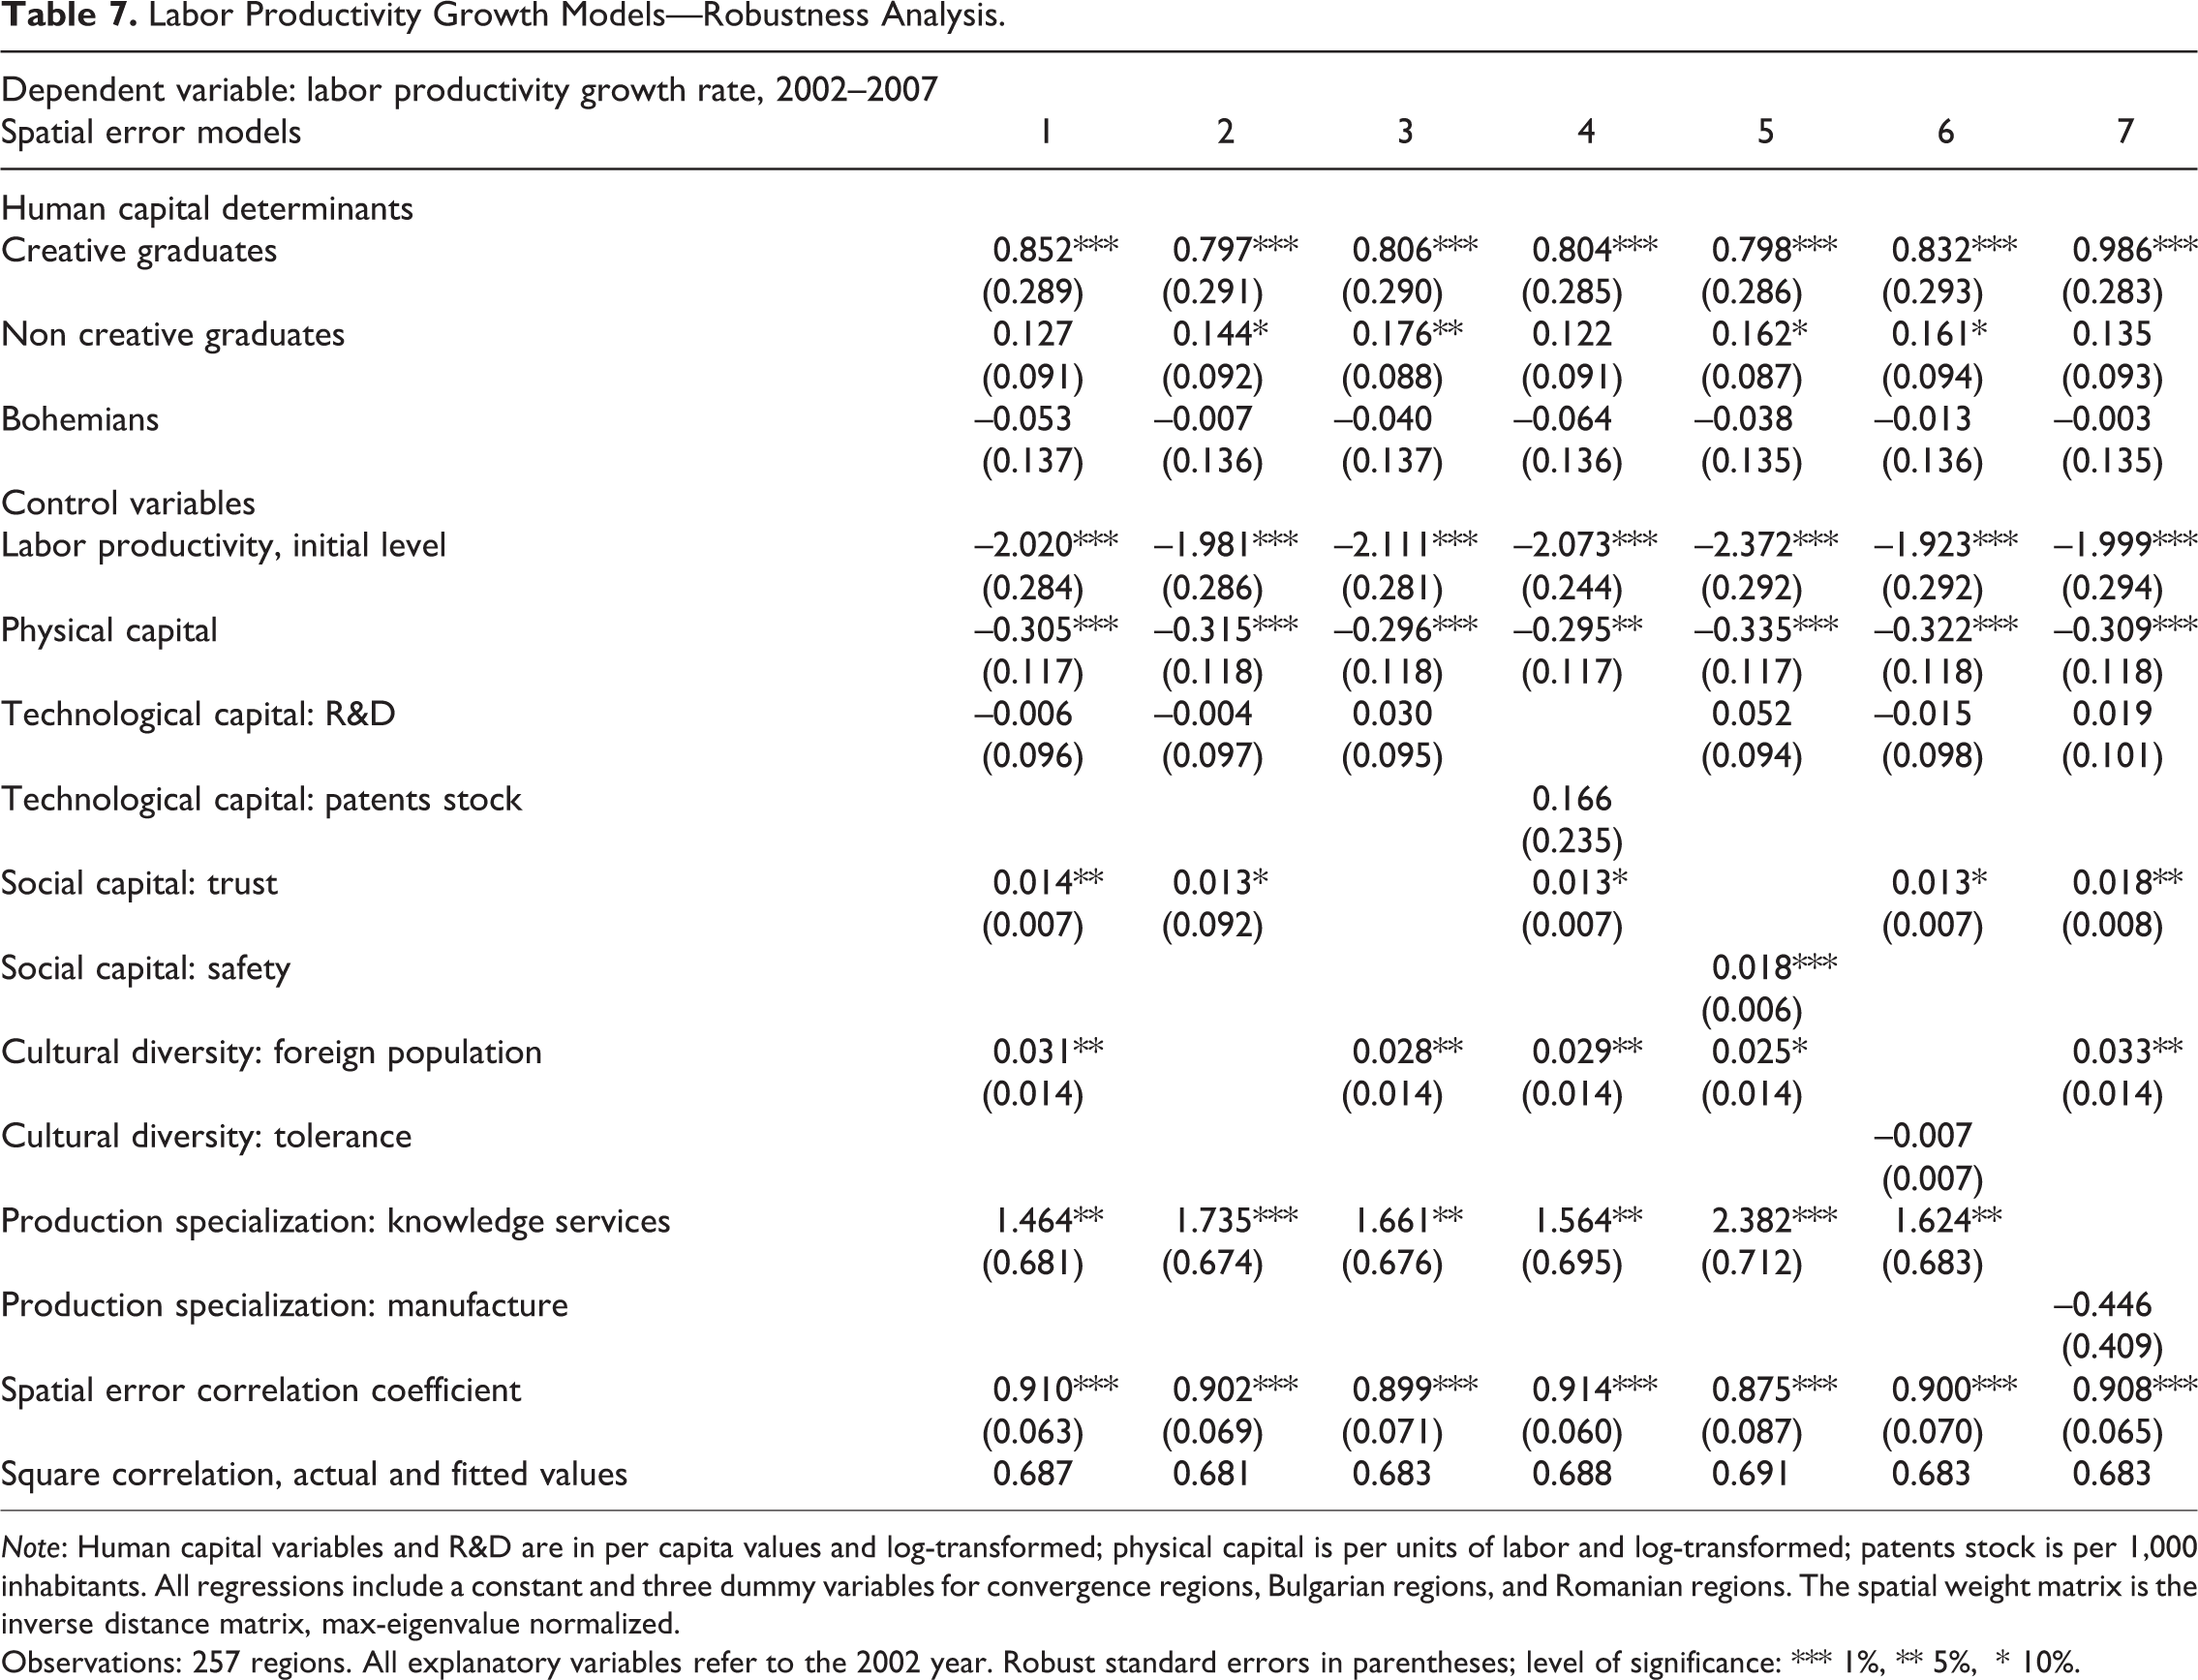
Note: Human capital variables and R&D are in per capita values and log-transformed; physical capital is per units of labor and log-transformed; patents stock is per 1,000 inhabitants. All regressions include a constant and three dummy variables for convergence regions, Bulgarian regions, and Romanian regions. The spatial weight matrix is the inverse distance matrix, max-eigenvalue normalized.
Observations: 257 regions. All explanatory variables refer to the 2002 year. Robust standard errors in parentheses; level of significance: *** 1%, ** 5%, * 10%.
The most salient result is that the creative graduates group is highly significant and quite effective—the coefficient ranges from 0.76 to 0.99—across all the specifications considered; the relevance of the noncreative graduates is also broadly confirmed, although it depends somehow on the specific set of controls included in the estimation. No evidence was found of positive effects of bohemians on economic dynamics.
Focusing on the estimated effects of regression (1), the creative graduate group is highly significant with an elasticity value of 0.85, while the noncreative graduate coefficient is not significant at conventional levels (p value = 0.16); this result could be due to a certain degree of collinearity associated with the inclusion of both trust and diversity in specification (1); when they are included one at a time (regressions 2 and 3 of Table 7), the noncreative graduates group is again statistically significant. To assess whether multicollinearity is an issue in the estimation of regression (1) we compute the variance inflation factors (VIFs) for each explanatory variables; they turned out to be all well below 6, 23 so that we can rule out that the reported elasticities are imprecisely estimated due to the existence of large standard errors. Because of the inclusion of the control variables, the estimated effects of creative and noncreative graduate groups are lower than the ones reported for the basic specification (regression 2 of Table 5).
The capital/labor ratio exhibits a significant negative coefficient, indicating that the growth process is stationary, as is the case also with the initial level of labor productivity, so that regions with high endowments of physical capital with respect to their labor force tend to have slower dynamics. R&D expenditure does not seem to provide a significant contribution to the growth of labor productivity over and above the human capital’s one. This apparently unexpected result may be due to the fact that even high amounts of R&D expenditure might be ineffective without a highly skilled and educated labor force, so that it might be the case that the R&D effect is an indirect one which works through the human capital channel and in particular through the creative educated one. 24
Turning to the social factors, our results point out that both trust and diversity contribute positively toward accelerating the growth process, with the latter having twice the effect of the former one. It seems reasonable to argue that the foreign population plays an important role in creating a more challenging productive environment and in signaling to graduate, creative, and innovative people the most open, tolerant, and inclusive places. At the same time, this is associated with reasonable degrees of trust, whose positive impact reflects its effectiveness in reducing transaction costs. This favorable result may be due to the particular European context, where it is still possible to benefit from the positive effects of both diversity and similarity, however threshold limits could be easily reached and adverse effects might result if the social capital–demographic diversity combination is upset. Specific social policies are indeed required at local level to maintain such a delicate balance.
Keeping constant the human, technological, and social capital endowment, having a regional productive structure specialized in knowledge intensive services markedly fosters the labor productivity growth. It is expected that the specialization pattern favors more strikingly the Western regions with respect to the new accession eastern ones, which are relatively more specialized in the manufacturing sectors as a result of the production delocalization triggered by the European integration and enlargement process.
In columns (4)–(7) of Table 7, we report the results of the extended model obtained by including alternative proxies for the main control variables. The evidence previously discussed is largely confirmed. Technological capital has no significant effects even when an indicator based on patents stock is included (regression 4) in place of R&D investments; this may be due to technological capital having a pure level effect on productivity, as documented by the empirical literature on intangible assets augmented production function (Dettori, Marrocu, and Paci 2011), and no additional growth effects. The social capital effect proves to be robust to the use of the alternative proxy represented by safety (regression 5), while the tolerance proxy (regression 6) is outperformed by the foreign population one in accounting for the degree of diversity in society.
In general, it is expected that creative graduate people and bohemians are more concentrated in places characterized by high degrees of tolerance, diversity, and inclusiveness. We also tested whether their effects on regional growth are enhanced by such contextual conditions by augmenting the models reported in Table 7 with additional regressors obtained as interaction terms of the human capital variables with each of the proxies considered for social capital and cultural diversity. However, no evidence is found of any significant effect, over and above the ones already discussed. This result may be due to the fact that in order to unveil such additional effects more informative data are indeed required: more informative indicators for social capital and cultural diversity, on one hand, and micro level data on the specific occupations and university degree fields attained by workers, on the other hand. As stressed in the previous sections, unfortunately this kind of data is not generally available at regional level and is only specifically collected for studies with deeper yet narrower territorial scope of investigation. Finally, as expected, specializing in manufacturing (regression 7) does not seem to steadily contribute to accelerating the growth performance.
The analysis carried out so far provides further evidence on the prominent role played by well-educated labor forces employed in creative occupations in driving and sustaining economic growth, which is also enhanced by a productive environment featuring high levels of social capital and diversity.
Conclusions
In recent years, creativity has attracted a great deal of attention from both scholars and policy makers alike. In advanced economies, increasingly specializing in knowledge intensive sectors, talent applied to improving the level of innovativeness is seen as the key ingredient in most policy prescriptions, as it is the most important factor in enhancing competitiveness and ultimately economic growth. Traditionally, economists have theorized that the degree of innovation is directly linked to high endowments of human capital, beside sizeable R&D expenditure, so that what really matters for long-run economic growth is investment in education (Mankiw, Romer, and Weil 1992; Benhabib and Spiegel 1994). Recently, Florida (2002) has questioned this view by claiming that the real fuel of growth is the creativity content of occupations and not the formal education attainments of employed individuals. Policy makers should be more concerned with realizing the most favorable working conditions in order to attract such high-valued people. This, in turn, would entail that local policies should aim at promoting an open, diverse, and tolerant social and productive environment where creative individuals are relatively more keen to work in.
While the empirical evidence on the relevant role of human capital, mainly in the form of high levels of education, on economic outcomes is very settled and it has been proved to be robust to a vast set of varying conditions (countries, regions, time period, methodology, set of covariates), the debate on the economic effectiveness of creativity is still open, with an increasing number of contributions providing contrasting or quite ad hoc results. This is basically due to the fact that the very concept of “creativity” is not straightforward to define, so that in most empirical studies the first step is to provide a workable definition of it, which inevitably ends up to be too dependent on the specific aim of the article. As a consequence, the results of the analysis can hardly be generalized to different contexts and settings. Moreover, an additional difficulty is represented by the fact that whatever the adopted definition, creativity tends to overlap with education when high-skilled innovative occupations are considered. Therefore, a crucial issue is to disentangle the individual effects of the education and creativity components of human capital.
We specifically dealt this issue in a previous contribution of ours (Marrocu and Paci 2012), where we proposed an empirical strategy to identify the three nonoverlapping categories of creative graduates, noncreative graduates, and bohemians, thus moving in the direction of overcoming the overlapping between the education and creativity contents of human capital.
Motivated by the empirical literature mentioned above on the key role played by human capital in driving economic outcomes and by the challenging questions raised by Florida, in the analysis presented in this article, we employ our three-group classification of highly skilled workers to assess their role in driving the economic growth of 257 European regions over the period 2002–07. Following previous literature and in order to evaluate the robustness of our results, we consider three alternative measures of growth performance: labor productivity dynamics is compared with growth in employment and in TFP.
The most relevant result is that the crucial growth determinant turns out to be the endowment of creative graduates, which comprises both the education and creativity traits of human capital. Noncreative graduates also exhibit a growth effect, although it was found to be somehow dependent on the particular empirical specification adopted. The most talent endowed category, the bohemians, does not show any significant direct impact on regional development.
The relevance of the creative graduates in enhancing economic growth, specifically in terms of increasing labor productivity, is robust to the inclusion of a wide set of contextual variables, which control for some geographical aspects, the endowment of technological and social capital, the productive specialization pattern and, finally, for cultural diversity. The latter feature has been shaping the European local environment along several dimensions, demographic, social, and productive and is expected to become increasingly relevant in complementing the effects of human capital.
From a policy perspective, our analysis confirms the importance of the traditional growth models’ recommendation of investing in education in order to ensure long-run steady increases in the level of production. Our findings also allow us to emphasize the diversified effects of different kinds of education when they are used in actual occupations; education associated with creativity—talent, originality, and innovativeness—is more productivity enhancing. These results become even more relevant in light of the EU Commission forecast that by 2020, 35% of all jobs in the EU will require high-level qualifications.
Therefore, for the whole of Europe, and especially for lagging territories, it is of crucial importance to increase the general level of education of the resident population, which—as remarked in our descriptive analysis—in 2002 was just above 12% on average, barely 9% for the convergence regions, and since then it has been increasing very sluggishly.
At the same time, policies should ensure that young generations have access to the most economically effective kinds of graduate specializations, while creating the conditions for an efficient matching process between creative graduates and creative jobs. Increasingly often employers across European regions report difficulties in finding the right people for the evolving needs of the knowledge economy.
Note also that the professions related to the high tech, innovation intensive jobs are also the ones that are expected to provide viable answers to the challenging issues at stake in the current European scenario, a balanced environment-friendly growth, higher and sharp competition from emerging countries, ageing population, and increasingly costly health care system, inclusive social policies for ensuring smooth integration of foreign people.
In future contributions, we aim to extend our analysis and to address some of its specific limitations. In particular, when more updated data become available we intend to provide a more accurate assessment of the long-run effects of education and creativity, which is now limited to the period 2002–07 because of lack of data for a longer time span. Availability of panel data, especially at a finer geographical scale, would enable a more rigorous investigation of the contextual conditions that enhance human capital potential and of the channels through which this potential is likely to diffuse toward proximate territories.
Footnotes
Declaration of Conflicting Interests
The author(s) declared no potential conflicts of interest with respect to the research, authorship, and/or publication of this article.
Funding
The author(s) disclosed receipt of the following financial support for the research, authorship, and/or publication of this article: The research leading to these results has received funding from the European Union’s Seventh Framework Programme FP7-SSH-2010-2.2-1 (2011-2014), under grant agreement no 266834 SEARCH project.